Local genetic context shapes the function of a gene regulatory network
- Institute of Science and Technology Austria, Austria
- Immunobiology and Genetics, Max F. Perutz Laboratories, Center Of Molecular Biology, University of Vienna, Austria
Figures
Figure 1 with 5 supplements
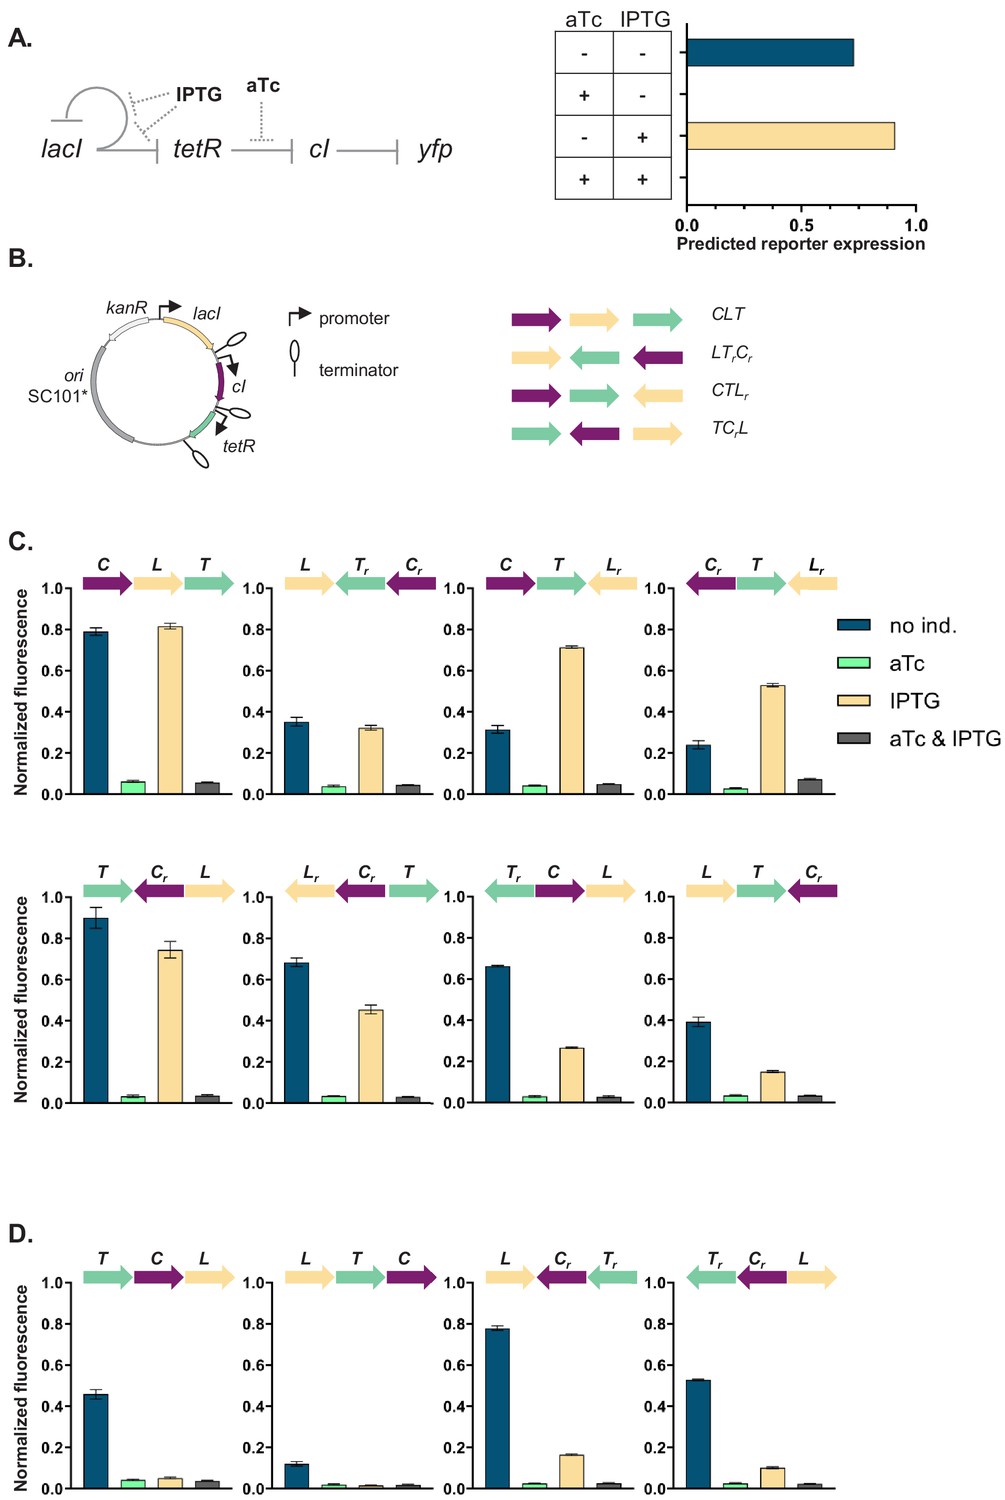
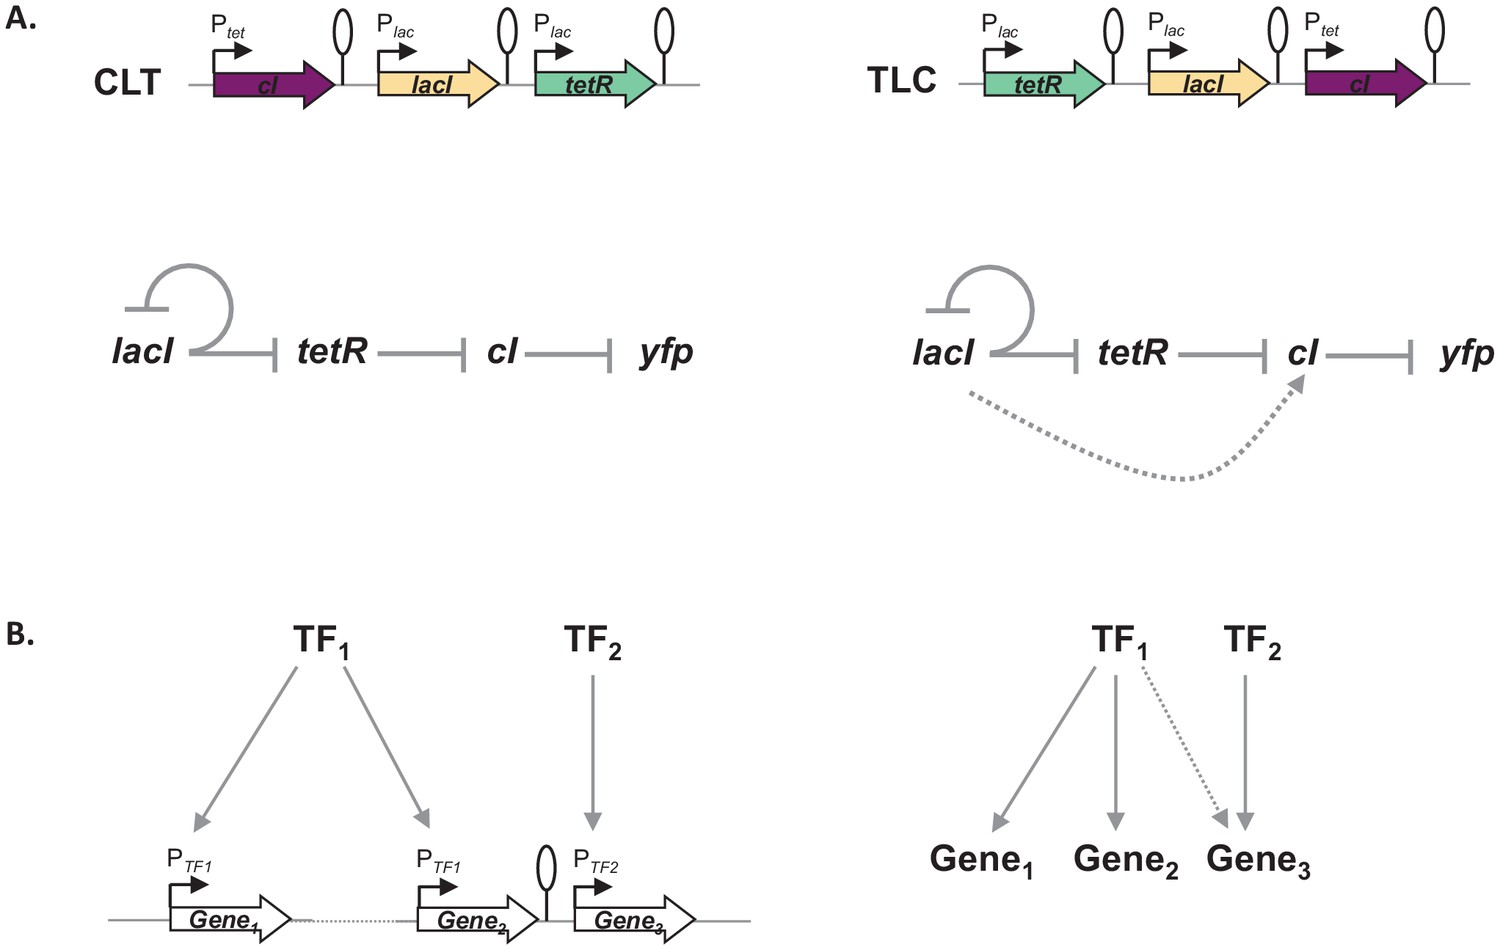
Architecture and phenotypes of the gene regulatory network (GRN).
(A) Diagram of interactions between the three independent transcriptional units (TUs) encoding for the repressors, lacI, tetR, and cI, their respective inducers isopropyl β-D-thiogalactopyranoside (IPTG) and anhydrotetracycline (aTc), and the promoters they control, with yfp as the GRN output (left). Phenotype of this GRN as predicted by our mathematical model (right). (B) Genetic architecture of TU permutations of GRN plasmid (left). Cartoon of TU permutations (right). Abbreviations used throughout the text: C stands for cI, L for lacI, and T for tetR. Letter r denotes reverse orientation. (C and D) Fluorescence of cells carrying a representative subset of different TU permutations of the GRN plasmid. A binary output value (On or Off) was assigned to each environment which thus defines a logical operation: NOT (aTc) in panel (C) and NOR in panel (D). Graphs show means and error bars standard deviations for three independent biological replicates.
Figure 1—figure supplement 1

A model of the mechanistic basis of gene expression, including transcriptional read-through.
(A) The topology of network interactions used in the model, along with the equations that model them. Term in red represents transcriptional read-through. (B) Two examples of transcriptional read-through. In the first example (top), transcription of lacI leads to transcriptional read-through into tetR and cI. This is modeled by additive terms for the rate of transcription of both tetR and cI. In the second example (bottom), expression of cI leads to transcriptional read-through into tetR. Because lacI is on the opposite strand from tetR, expression of tetR is assumed not to influence expression of lacI. (C) Range of values that fit the experimental results. Contour plot for a parameter scan for K in [0,0.5] and μ in [0,1], both with a step size of 0.05. For K in [0,0.21] and μ in [0.4,1], both parameters were scanned with a step size of 0.01. Lighter colors mean higher number of networks correctly fitted.
Figure 1—figure supplement 2
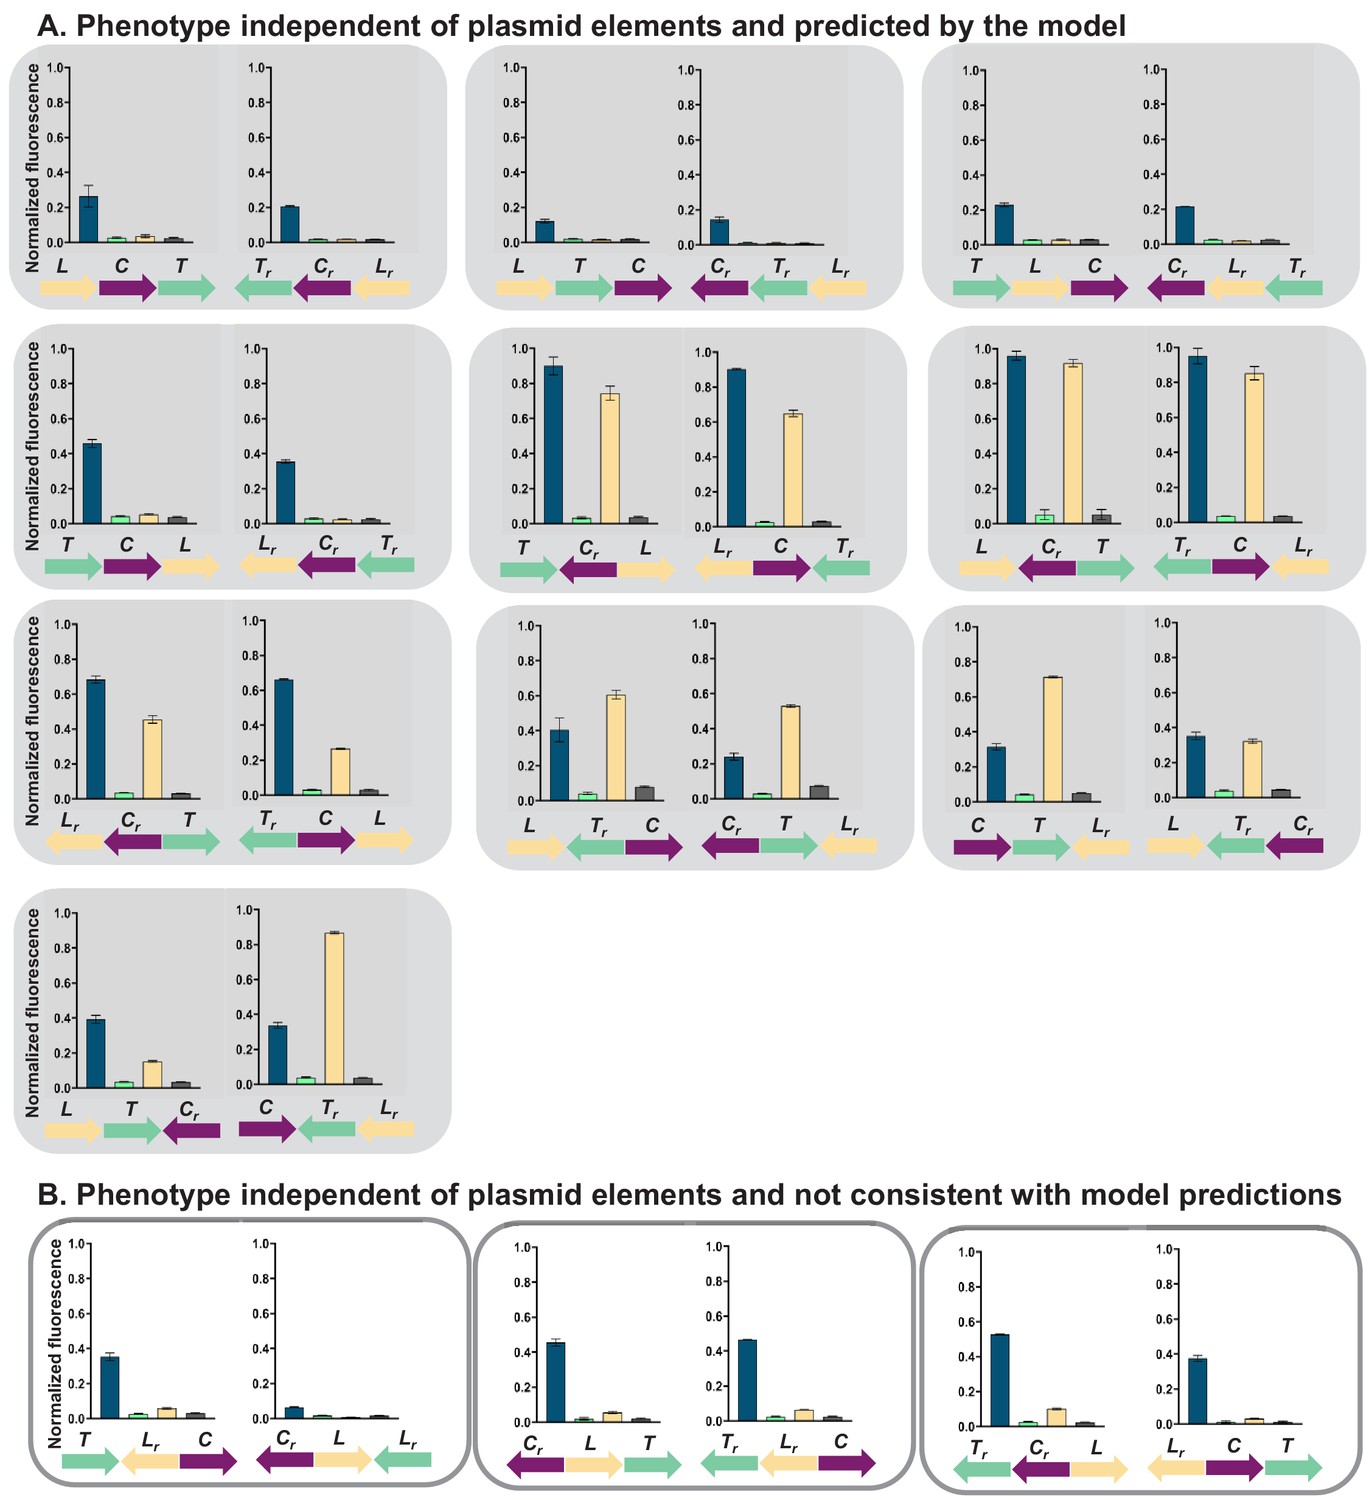
Gene regulatory networks (GRNs) in which phenotype is dependent only on changes in relative transcriptional unit (TU) order and orientation.
Fluorescence of cells carrying 26 different TU permutations of the GRN plasmid, grouped in pairs differing only in orientation with respect to plasmid backbone. Graphs show means and error bars standard deviations for three independent biological replicates. Shading marks strains which behave as predicted by the mathematical model incorporating transcriptional read-through (gray, A), white boxes denote strains which do not (B).
Figure 1—figure supplement 3
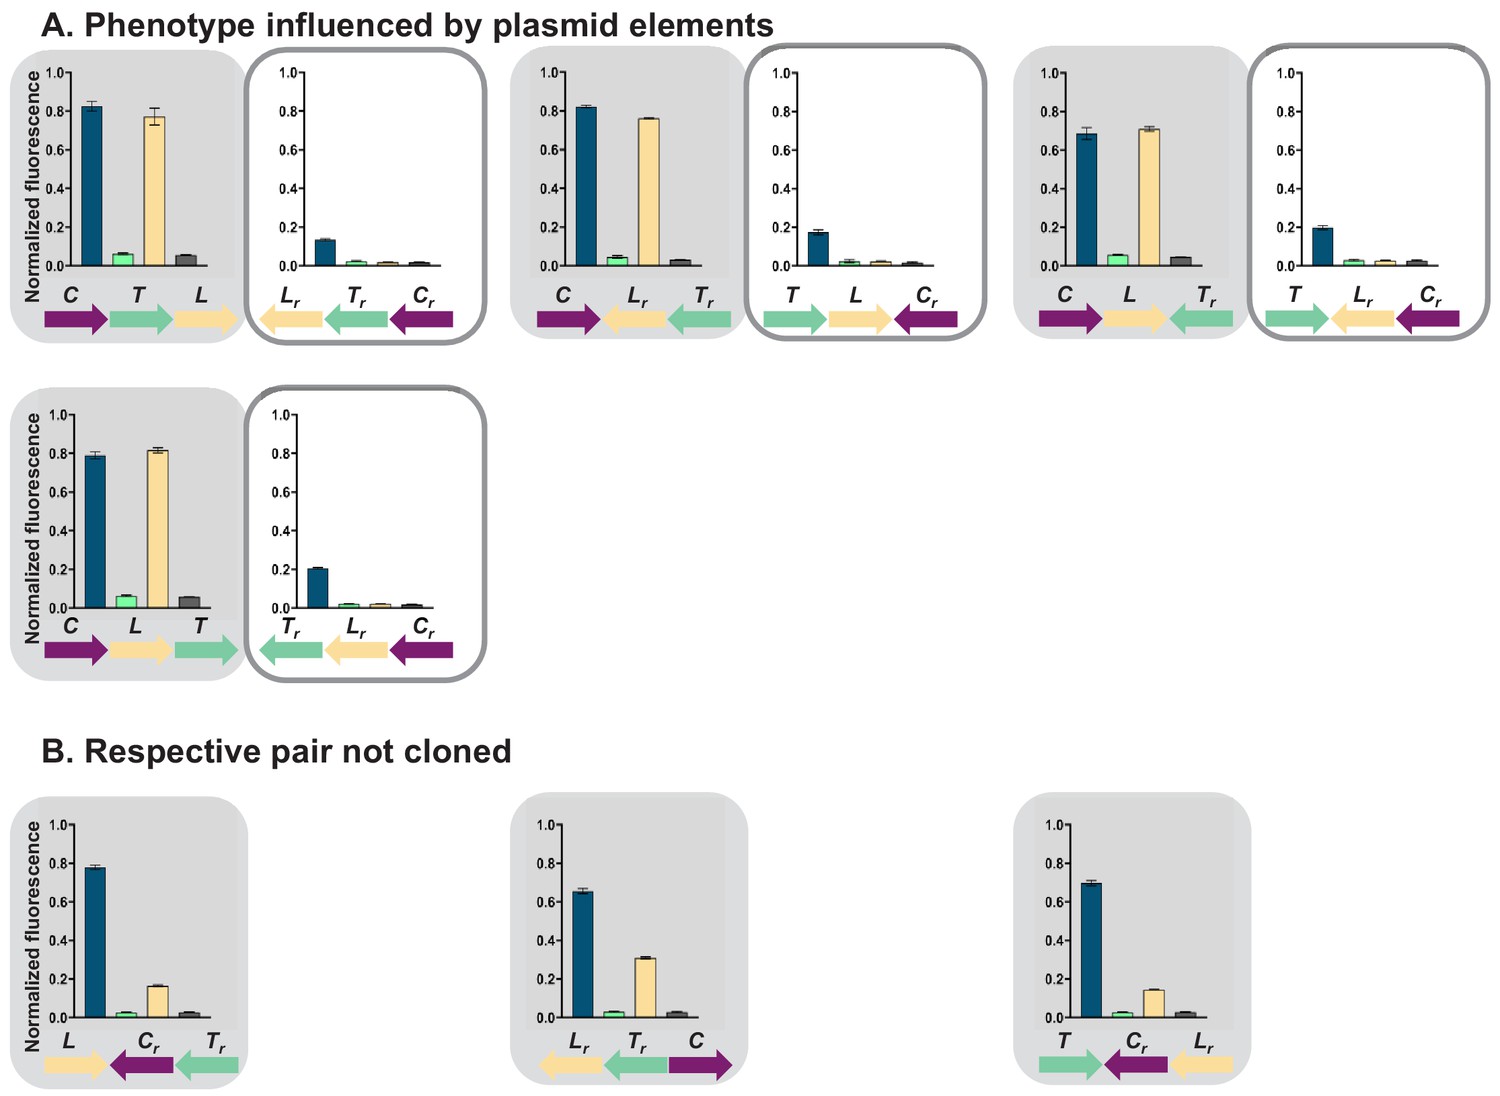
Gene regulatory networks (GRNs) in which the influence of plasmid-encoded genetic elements cannot be ruled out.
Fluorescence of cells carrying 11 different transcriptional unit (TU) permutations of the GRN plasmid, grouped in pairs differing only in orientation with respect to plasmid backbone. Shading marks strains which behave as predicted by the mathematical model incorporating transcriptional read-through (gray), white boxes denote strains which do not. (A) GRNs in which pairs do not show consistent phenotype, indicating influence of plasmid-encoded elements. (B) Pairs in which only one GRN was cloned, making comparison impossible. Graphs show means and error bars standard deviations for three independent biological replicates.
Figure 1—figure supplement 4
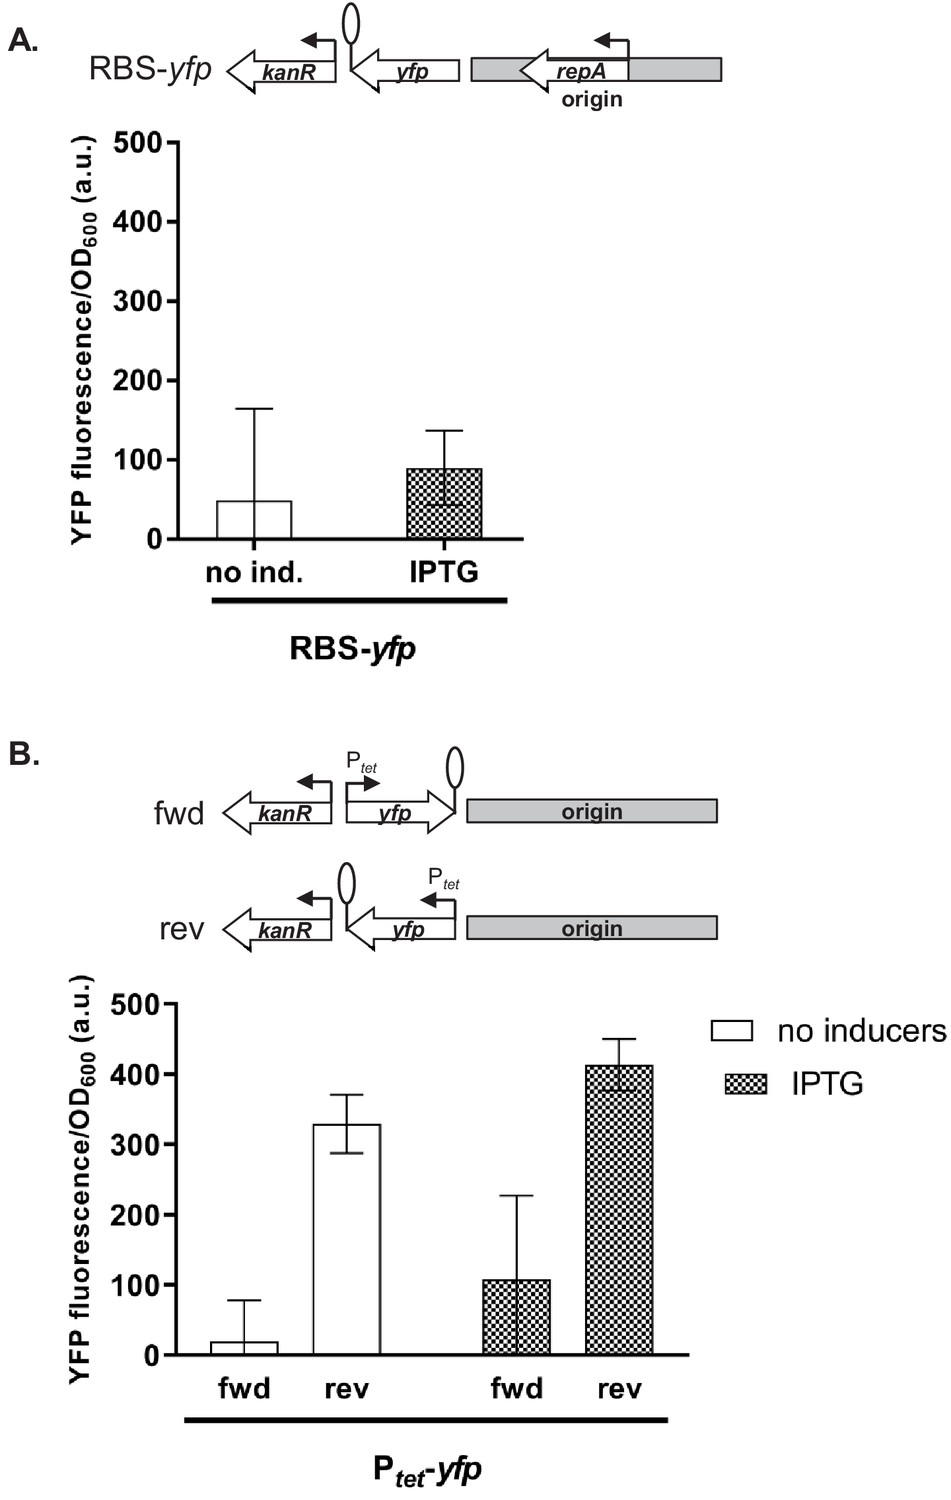
Influence of plasmid genetic elements on gene expression levels.
(A) Fluorescence of cells carrying a promoterless yfp gene cloned adjacent to the origin of replication, ori. (B) Fluorescence of cells carrying Ptet-yfp cloned in two orientations relative to ori and kanR measured in a strain carrying chromosomally encoded tetR. (A and B) Strains were exposed to isopropyl β-D-thiogalactopyranoside (IPTG) or grown without inducers. Genetic architecture of relevant plasmid fragment is given above the graph. Promoters are marked as bent arrows, terminators are represented by vertical bars and a circle. Graphs show means and error bars standard deviations for three independent biological replicates.
Figure 1—figure supplement 5

Distribution of phenotypes depending on the threshold applied to define ON and OFF states.
(A) Definition of the logic operations. The presence or absence of inducer is indicated with + and −, and output by On and Off. (B) Histogram shows the fraction of networks that can be assigned to a given phenotype depending on threshold. The threshold we used to assign phenotypes is marked with a dashed line.
Figure 2
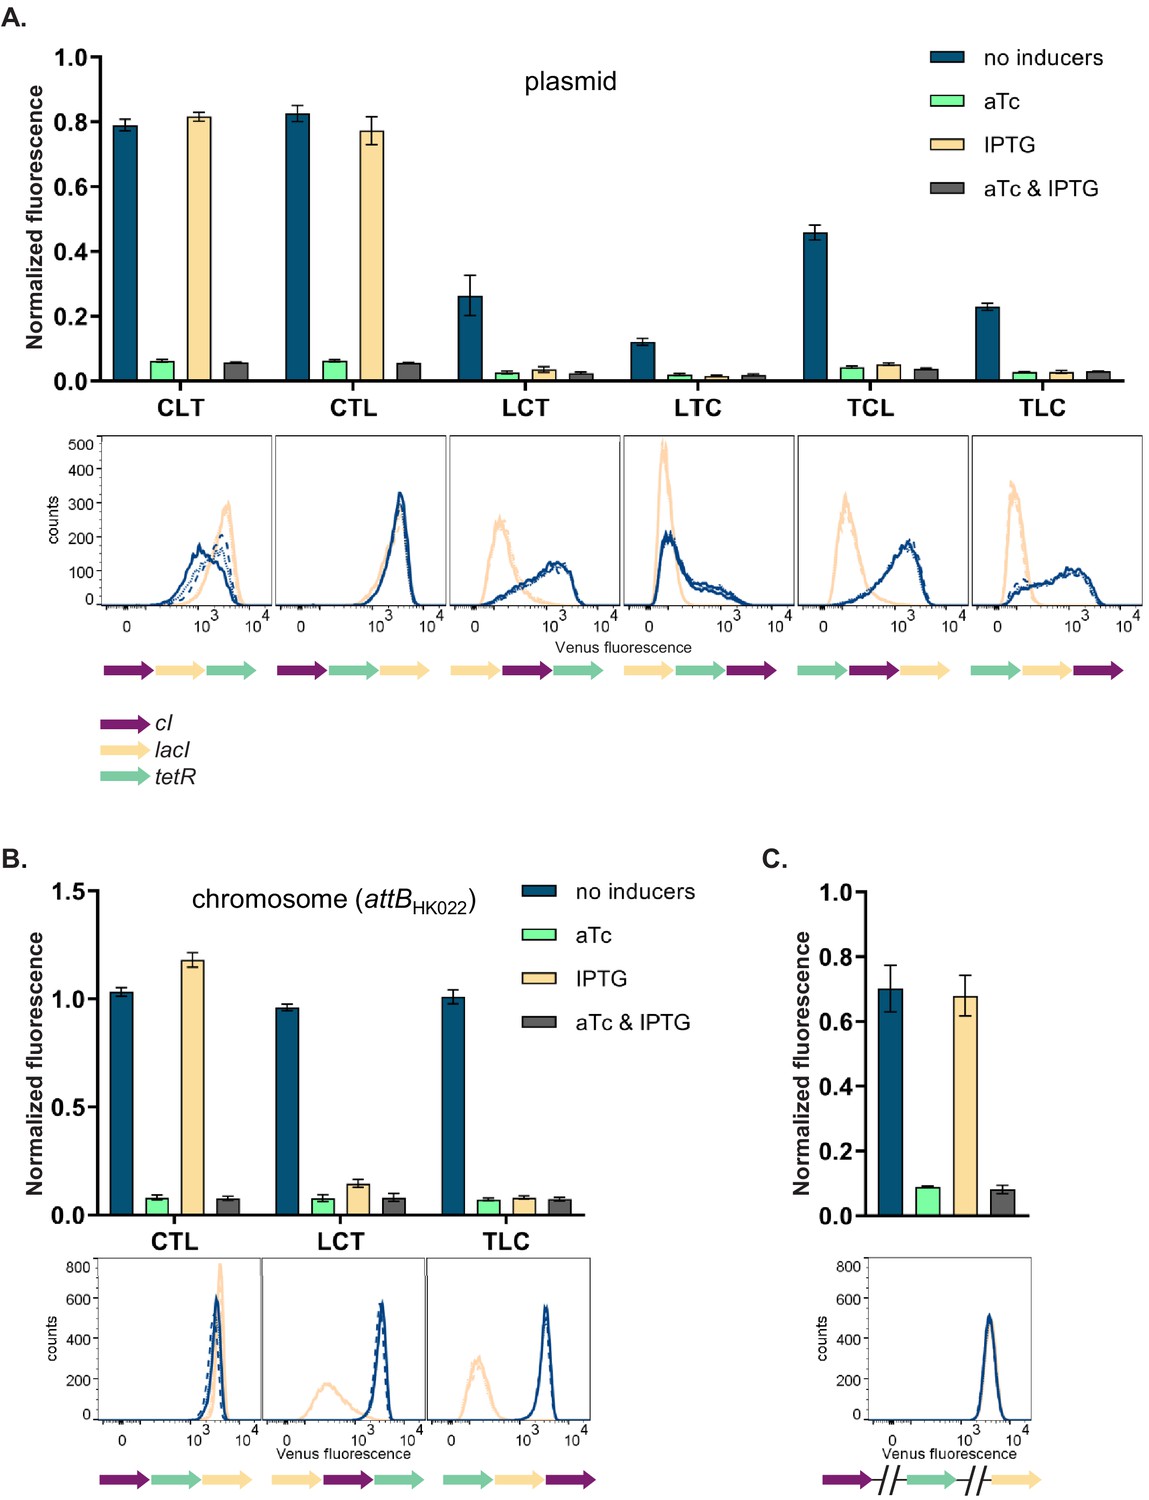
Changes in relative transcriptional unit (TU) order lead to qualitative changes of phenotype.
Fluorescence of cells carrying six different TU permutations of the gene regulatory network (GRN) on a plasmid (A), three GRN variants integrated on the chromosome at the phage HK022 attachment site (B), and with each of the repressor genes integrated at separate chromosomal loci (C). Graphs show population level fluorescence measurements of strains exposed to: no inducer, anhydrotetracycline (aTc), isopropyl β-D-thiogalactopyranoside (IPTG), or a combination of aTc and IPTG (as indicated). Graph shows mean and standard deviations for three independent biological replicates. Flow cytometry histograms of cell fluorescence show 10,000 gated events, corresponding to YFP expressed in a given strain grown without (blue) and with IPTG (yellow). For each strain and condition, three biological replicates are shown. Relative TU order of the three repressors is shown under the respective graphs.
Figure 3
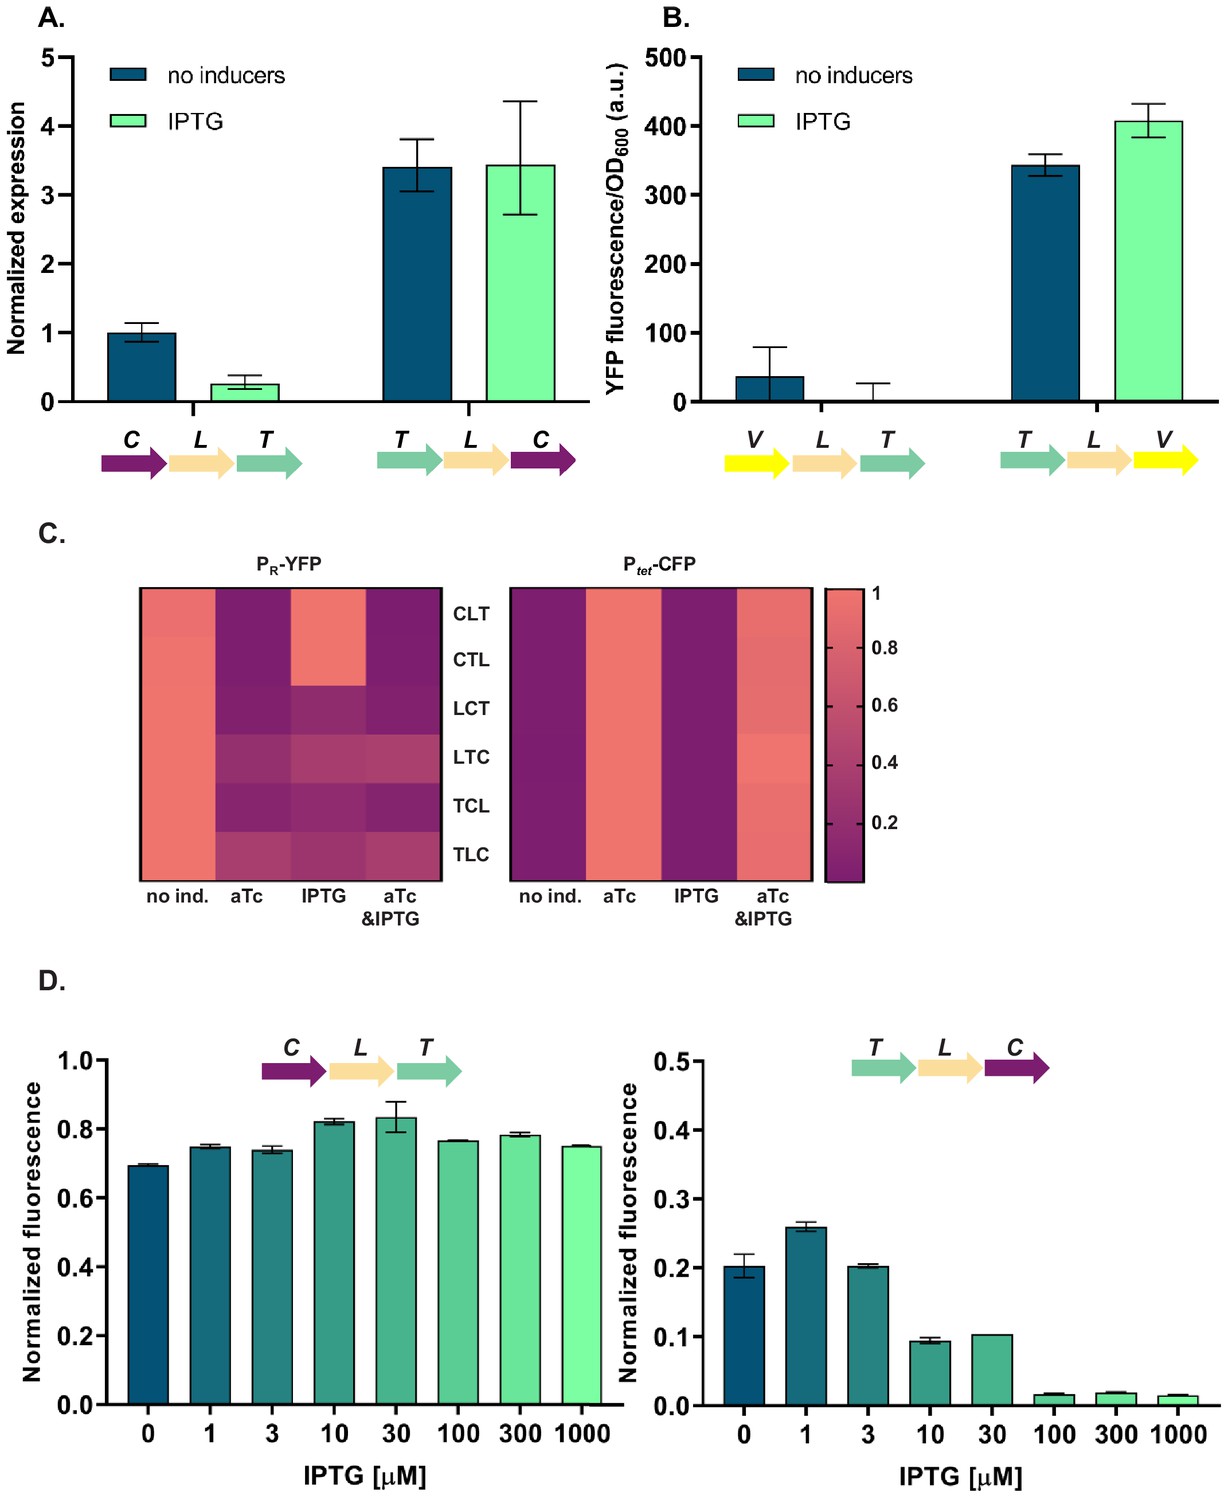
Differences in cI expression lead to transcriptional unit (TU) order dependent phenotypes.
(A) RT-qPCR analysis of cI expression. RT-qPCR was performed, using cI-specific primers. The induction ratios were calculated relative to the uninduced strain CLT. (B) YFP levels measured in strains VLT and TLV which carry a yfp reporter (V) under control of Ptet and differ only in relative TU order. (C) Heatmaps show PR promoter activity in six strains carrying plasmids differing in relative TU order (left) and activity of Ptet present in trans in the same strains on a second plasmid (right). (D) Relative TU order effects depend on expression from the lac promoter in isopropyl β-D-thiogalactopyranoside (IPTG)-dependent manner. Strains CLT and TLC were grown in the presence of different concentrations of IPTG. (B–D) Strains were exposed to anhydrotetracycline (aTc), IPTG, or a combination of aTc and IPTG (as indicated). For reasons of clarity, in (C) the highest expression level for each strain was individually normalized. Graphs show means and error bars standard deviations for three independent biological replicates.
Figure 4 with 2 supplements

Phenotype of strain TLC can be explained by transcriptional read-through.
(A) Genetic architecture of plasmid fragments encoding three repressors in strains TLC and TLC-10 (carrying mutations in the −10 promoter element of Ptet). Promoters are marked as bent arrows, terminators are represented by vertical bars and a circle, monocistronic transcripts are represented by solid arrows, predicted read-through transcripts by dashed arrows (left). Interaction diagrams within the two gene regulatory networks (GRNs). Solid lines represent interactions between transcription factors and the promoters they control, dashed line represents effects resulting from local genetic context (right). (B) Fluorescence of cells carrying TLC plasmid with either Ptet or Ptet carrying a mutation in the −10 promoter element (TLC-10) grown in the presence or absence of anhydrotetracycline (aTc) and isopropyl β-D-thiogalactopyranoside (IPTG). We expected that if GRN behavior is due to transcriptional read-through, mutating the Ptet promoter should not affect the responsiveness to IPTG. If, on the other hand, expression of cI was driven only by Ptet, mutating the −10 promoter element should lead to an ALL ON phenotype. Lack of repression in strains with Ptet-10 variant after aTc induction further confirms that this promoter variant is inactive. Graph shows means and error bars standard deviations for three independent biological replicates.
Figure 4—figure supplement 1
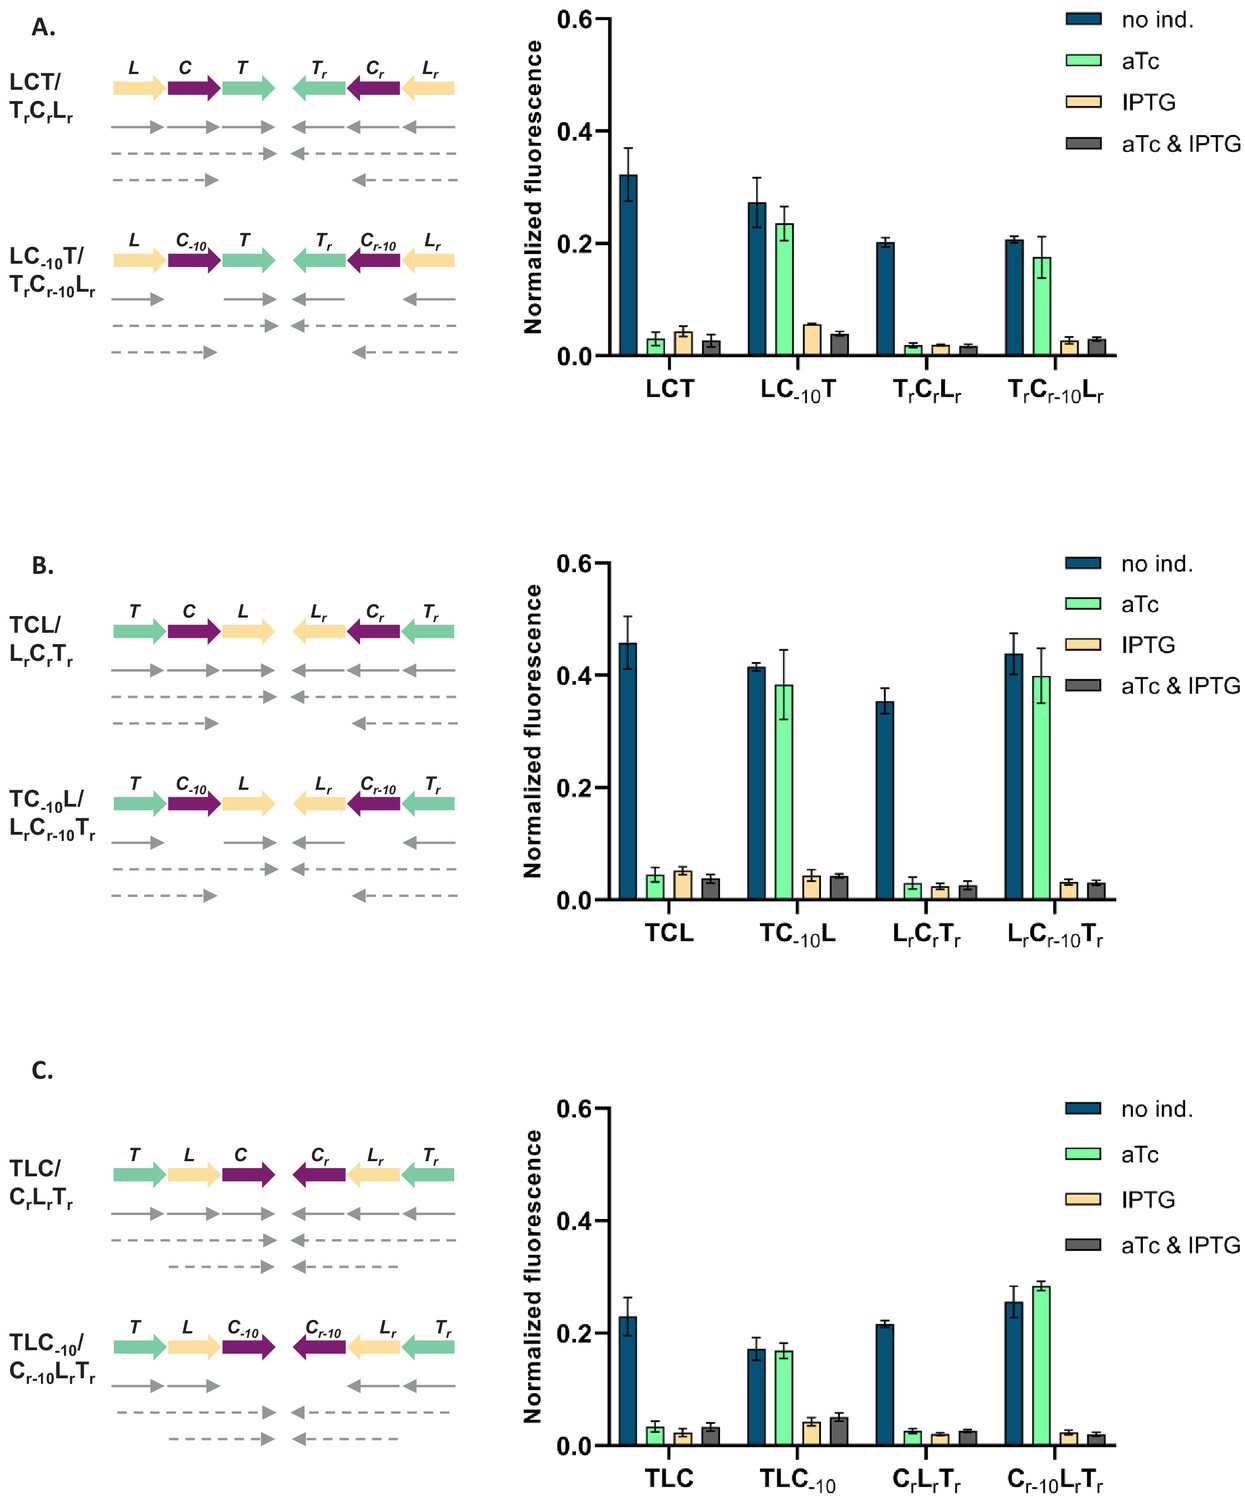
Phenotype of strains LCT, TrCrLr, TCL, LrCrTr, TLC, and CrLrTr can be explained by transcriptional read-through.
Genetic architecture of plasmid fragments encoding three repressors in strains LCT and TrCrLr (A), TCL and LrCrTr (B), TLC and CrLrTr (C), and their derivatives carrying mutations in the −10 promoter element of Ptet, together with fluorescence of cells carrying these plasmids grown in the presence or absence of anhydrotetracycline (aTc) and isopropyl β-D-thiogalactopyranoside (IPTG). We expected that if gene regulatory network (GRN) behavior is due to transcriptional read-through, mutating the Ptet promoter should not affect the responsiveness to IPTG. If, on the other hand, expression of cI was driven only by Ptet, mutating the −10 promoter element should lead to an ALL ON phenotype. Lack of repression in strains with Ptet-10 variant after aTc induction further confirms that this promoter variant is inactive. Monocistronic transcripts are represented by solid arrows, predicted read-through transcripts by dashed arrows. Graph shows means and error bars standard deviations for three independent biological replicates.
Figure 4—figure supplement 2
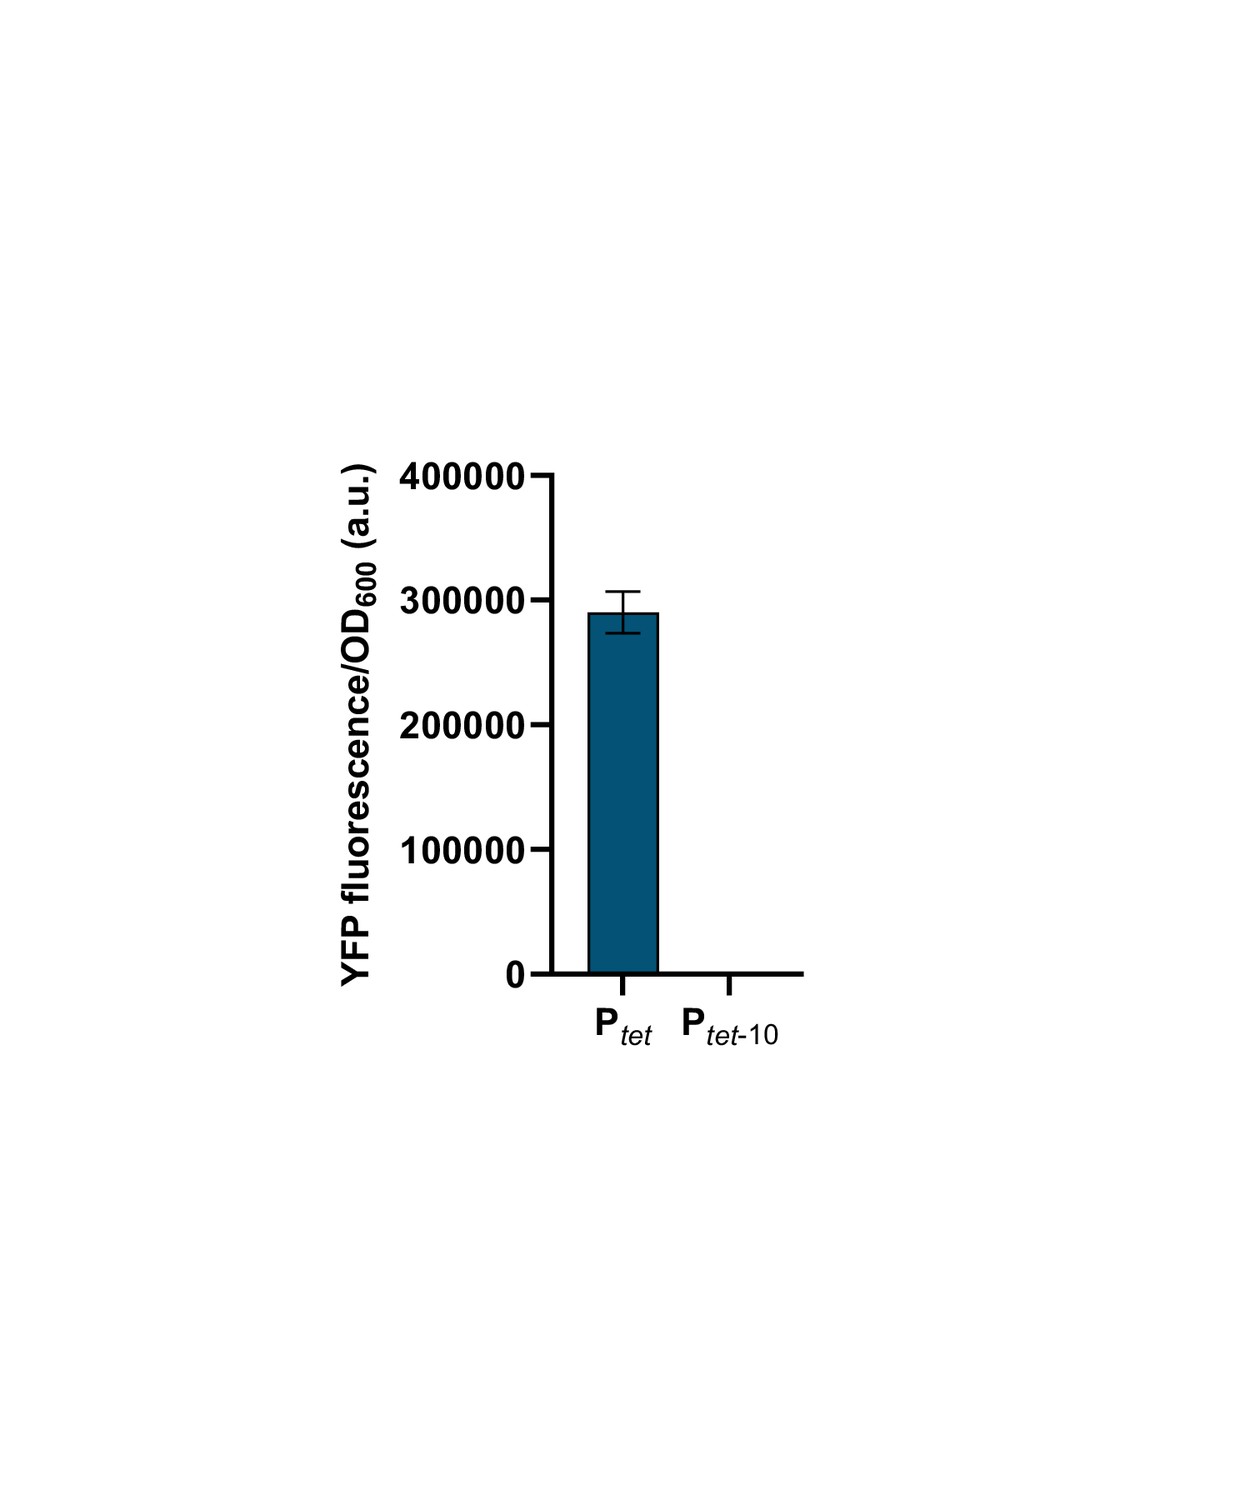
Point mutations in −10 promoter element render Ptet inactive.
Fluorescence of cells carrying either wild-type Ptet or Ptet with two point mutations in the −10 element driving yfp expression. Strains were grown without inducers. Graphs show means and error bars standard deviations for three independent biological replicates.
Figure 5 with 2 supplements
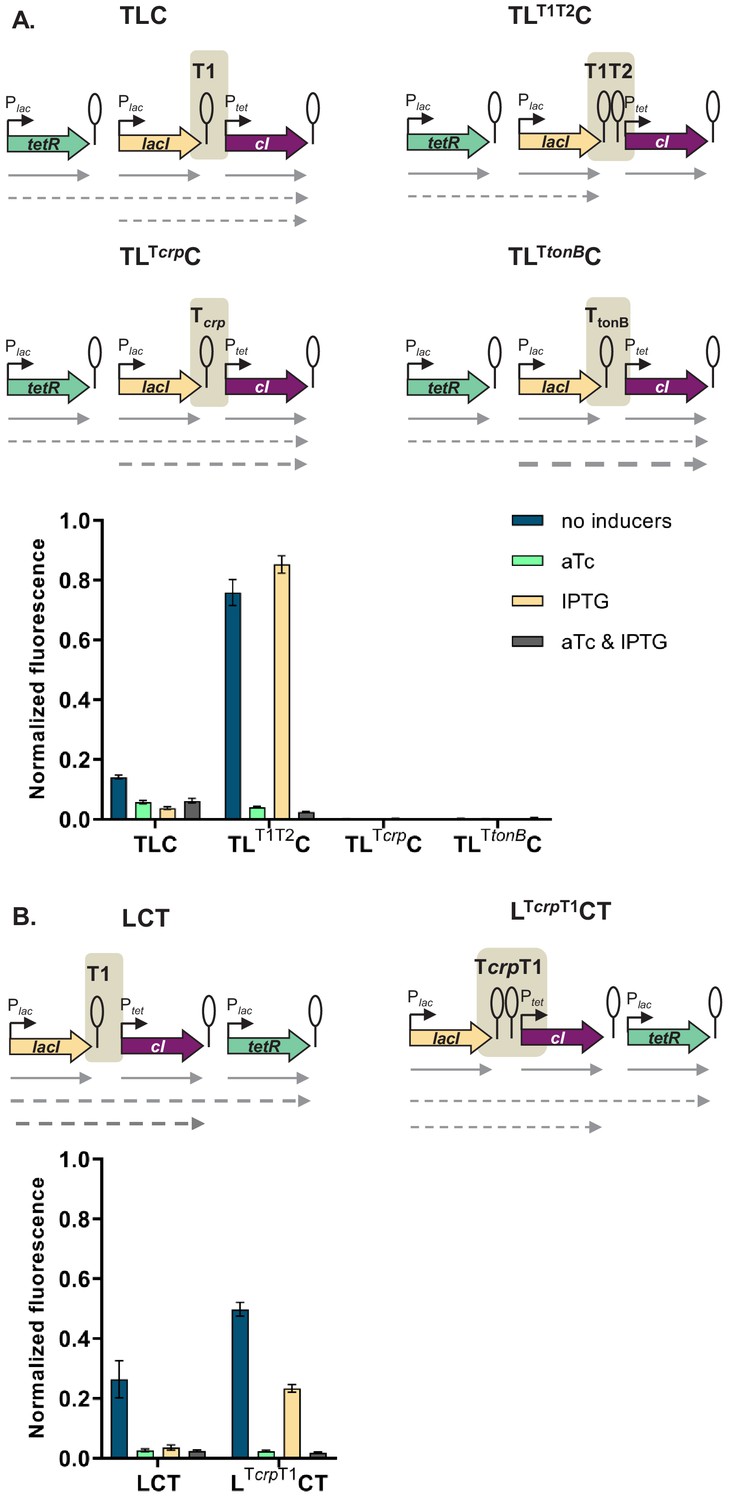
Change of terminator leads to qualitative change in phenotype.
(A) Genetic architecture of plasmid fragments encoding three repressors in strains TLC with different terminators: T1, T1T2, Tcrp, or TtonB, preceding cI, and fluorescence of cells carrying these plasmids grown in the presence or absence of anhydrotetracycline (aTc) and isopropyl β-D-thiogalactopyranoside (IPTG). (B) Genetic architecture of plasmid fragments encoding three repressors in strains LCT with either T1 or a double Tcrp-T1 terminator, and fluorescence of cells carrying these plasmids grown in the presence or absence of aTc and IPTG. (A and B) Promoters are marked as bent arrows, terminators are represented by vertical bars and a circle, operators as rectangles, monocistronic transcripts are represented by solid arrows, predicted read-through transcripts by dashed arrows. Increasing line thickness corresponds to increasing amount of transcript. Graph shows means and error bars standard deviations for three independent biological replicates.
Figure 5—figure supplement 1
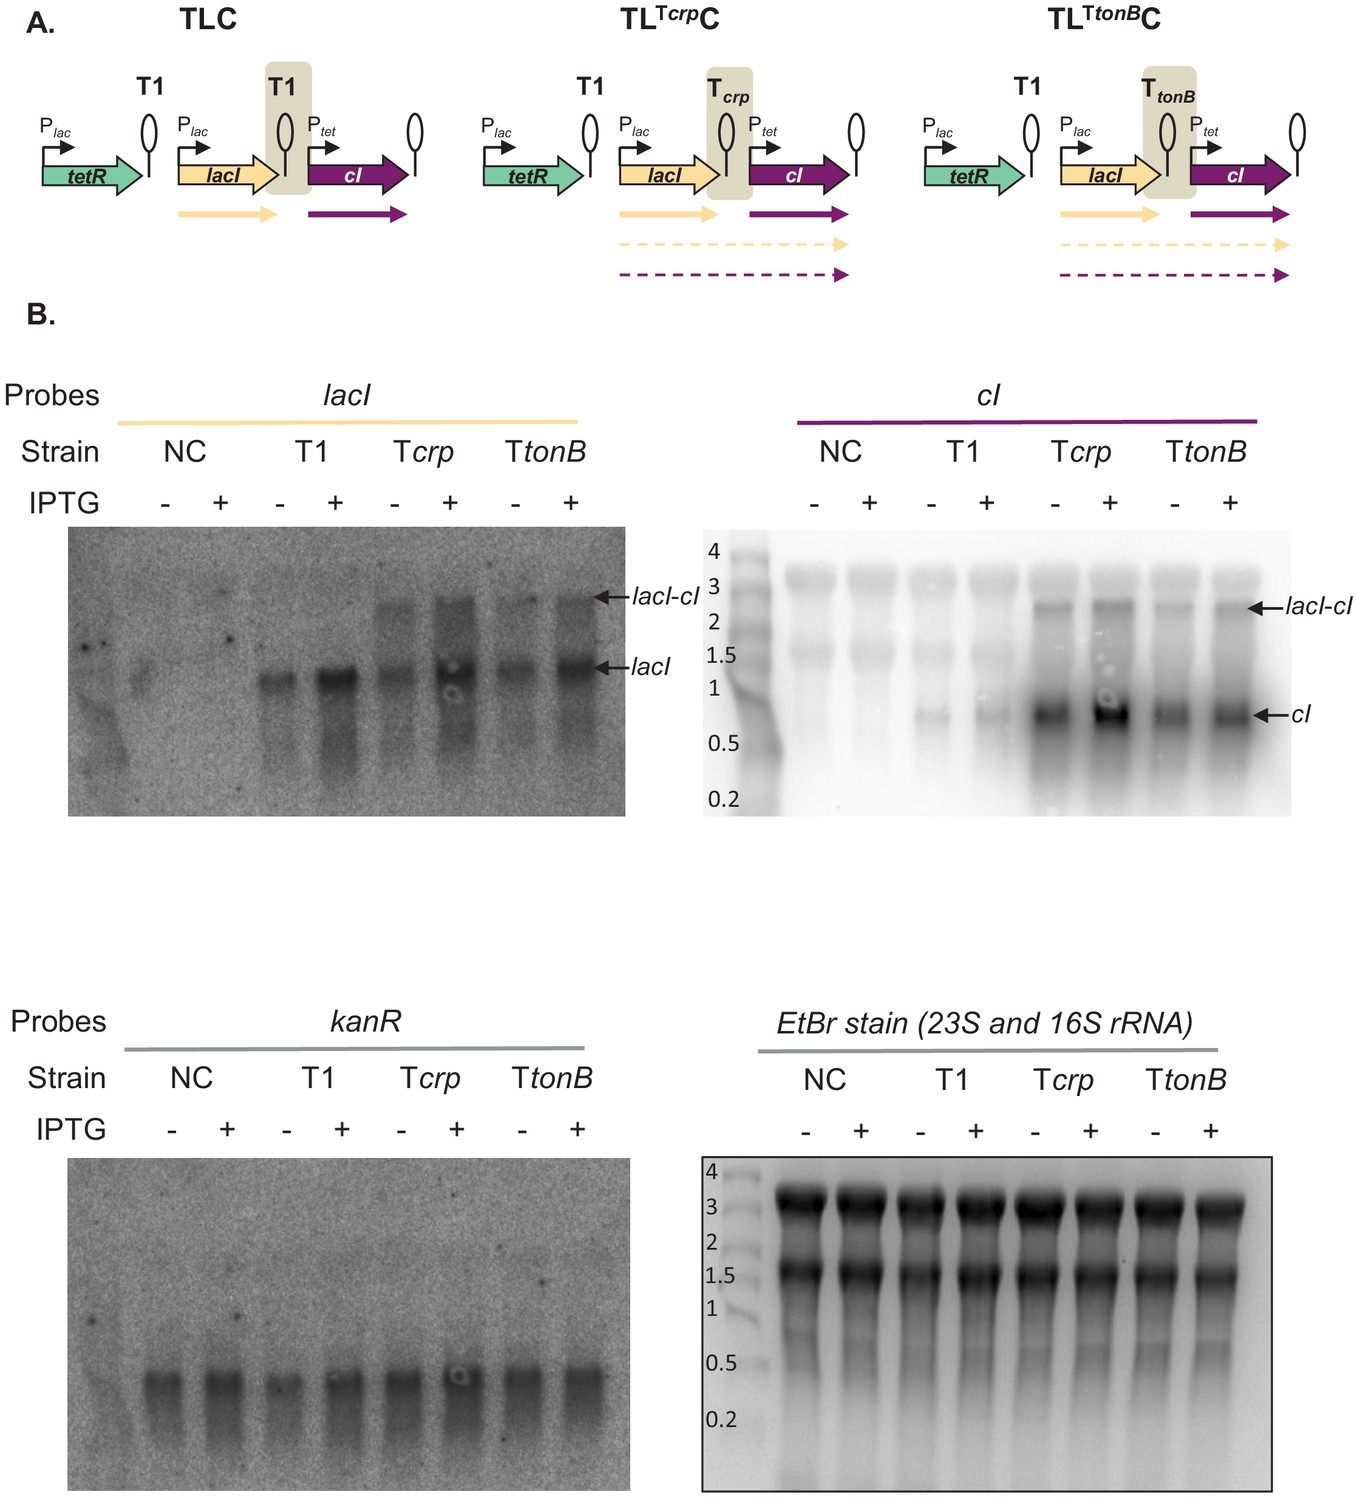
Northern blot assay shows read-through transcript in strains carrying Tcrp and TtonB.
(A) Schematic representation of the plasmid fragments encoding three repressors in strains TLC, TLTcrpC, and TLTtonBC. Shading marks regions which differ between the three gene regulatory networks (GRNs). (B) Northern blot analysis of cI, lacI, and kanR expression. Seven micrograms of total RNA (−, no induction; +, with isopropyl β-D-thiogalactopyranoside [IPTG] induction) was loaded on a formaldehyde gel, and northern blot analysis was performed as described in Materials and methods. NC – negative control, strain carrying network plasmid not encoding any transcription factor genes. Ethidium bromide staining of 23S and 16S rRNA is shown as a loading control.
Figure 5—figure supplement 2
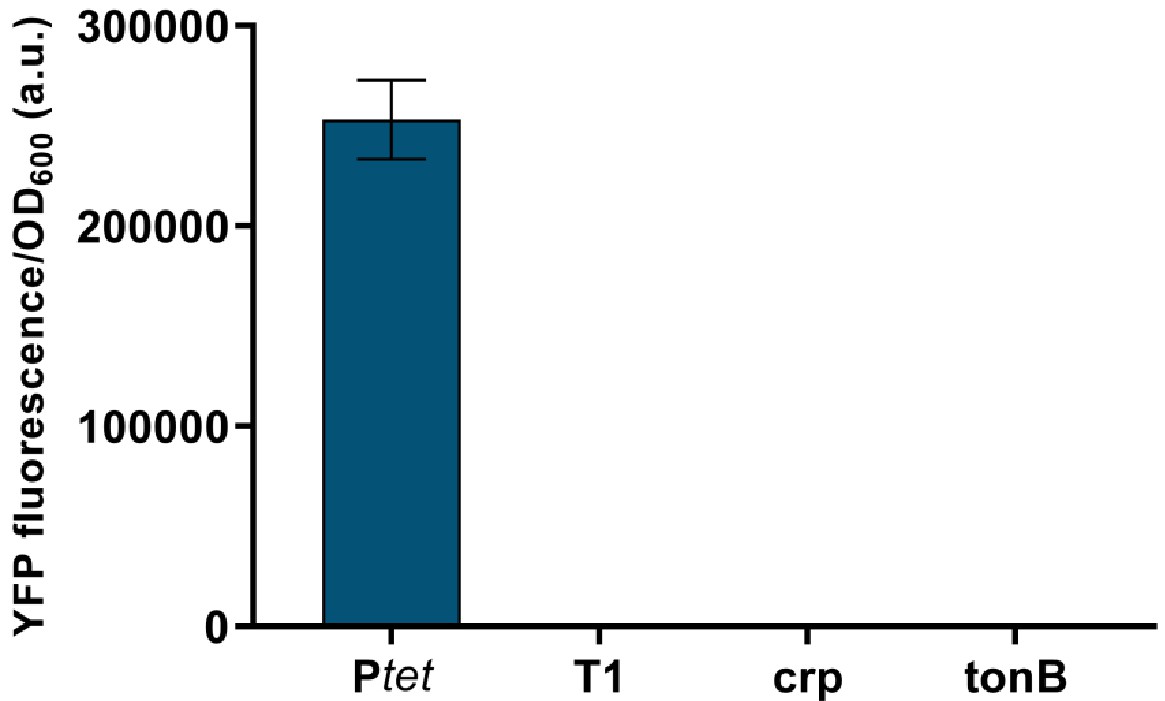
Terminator containing DNA fragments between repressor genes show no cryptic promoter activity.
Fluorescence of cells carrying DNA fragments located on gene regulatory network (GRN) plasmids between lacI and cI, and encoding T1, Tcrp, and TtonB, cloned in front of a promoterless yfp gene, and compared to Ptet activity. Graphs show means and error bars standard deviations for three independent biological replicates.
Figure 6 with 1 supplement
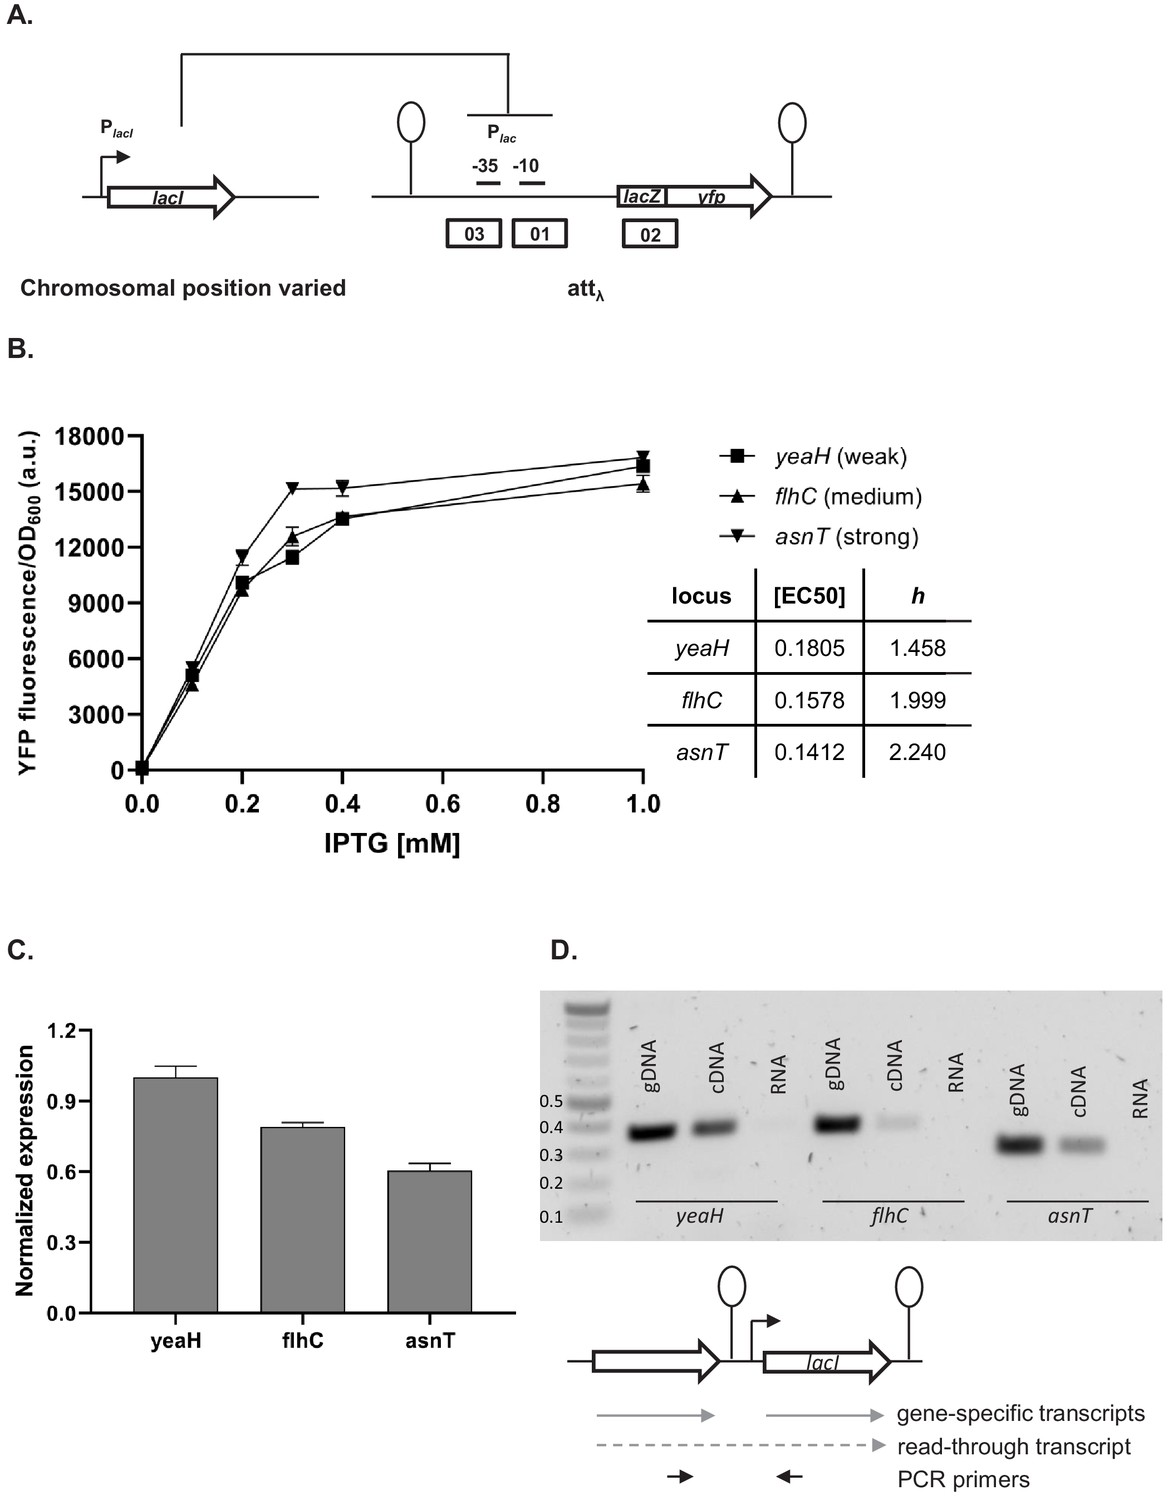
Effect of genetic context of lacI repressor chromosomal position on Plac activity.
(A) Diagram of interactions between LacI repressor and the promoter it represses, as well as genetic architecture of the DNA fragments integrated into MG1655 ΔlacI ΔlacZYA strain. Promoters are marked as bent arrows, terminators are represented by vertical bars and a circle, operators as rectangles. (B) Plac activity in cells carrying lacI inserted at different loci after a weak (yeaH), medium (flhC), and strong (asnT) terminator grown in different concentrations of isopropyl β-D-thiogalactopyranoside (IPTG). yfp levels were measured in exponentially growing cells. Graph shows means for at least three independent biological replicates. (C) RT-qPCR quantification of lacI transcript in strains described above. RT-qPCR was performed, using lacI-specific primers. The induction ratios were calculated relative to the strain with insertion in yeaH locus. (D) Ethidium bromide-stained 1% agarose gel of PCR products obtained with primers spanning the intergenic region between the upstream gene (yeaH, flhC, or asnT) and lacI. Templates for PCR were: chromosomal DNA (gDNA), cDNA as used for RT-qPCR above, and RNA.
Figure 6—figure supplement 1
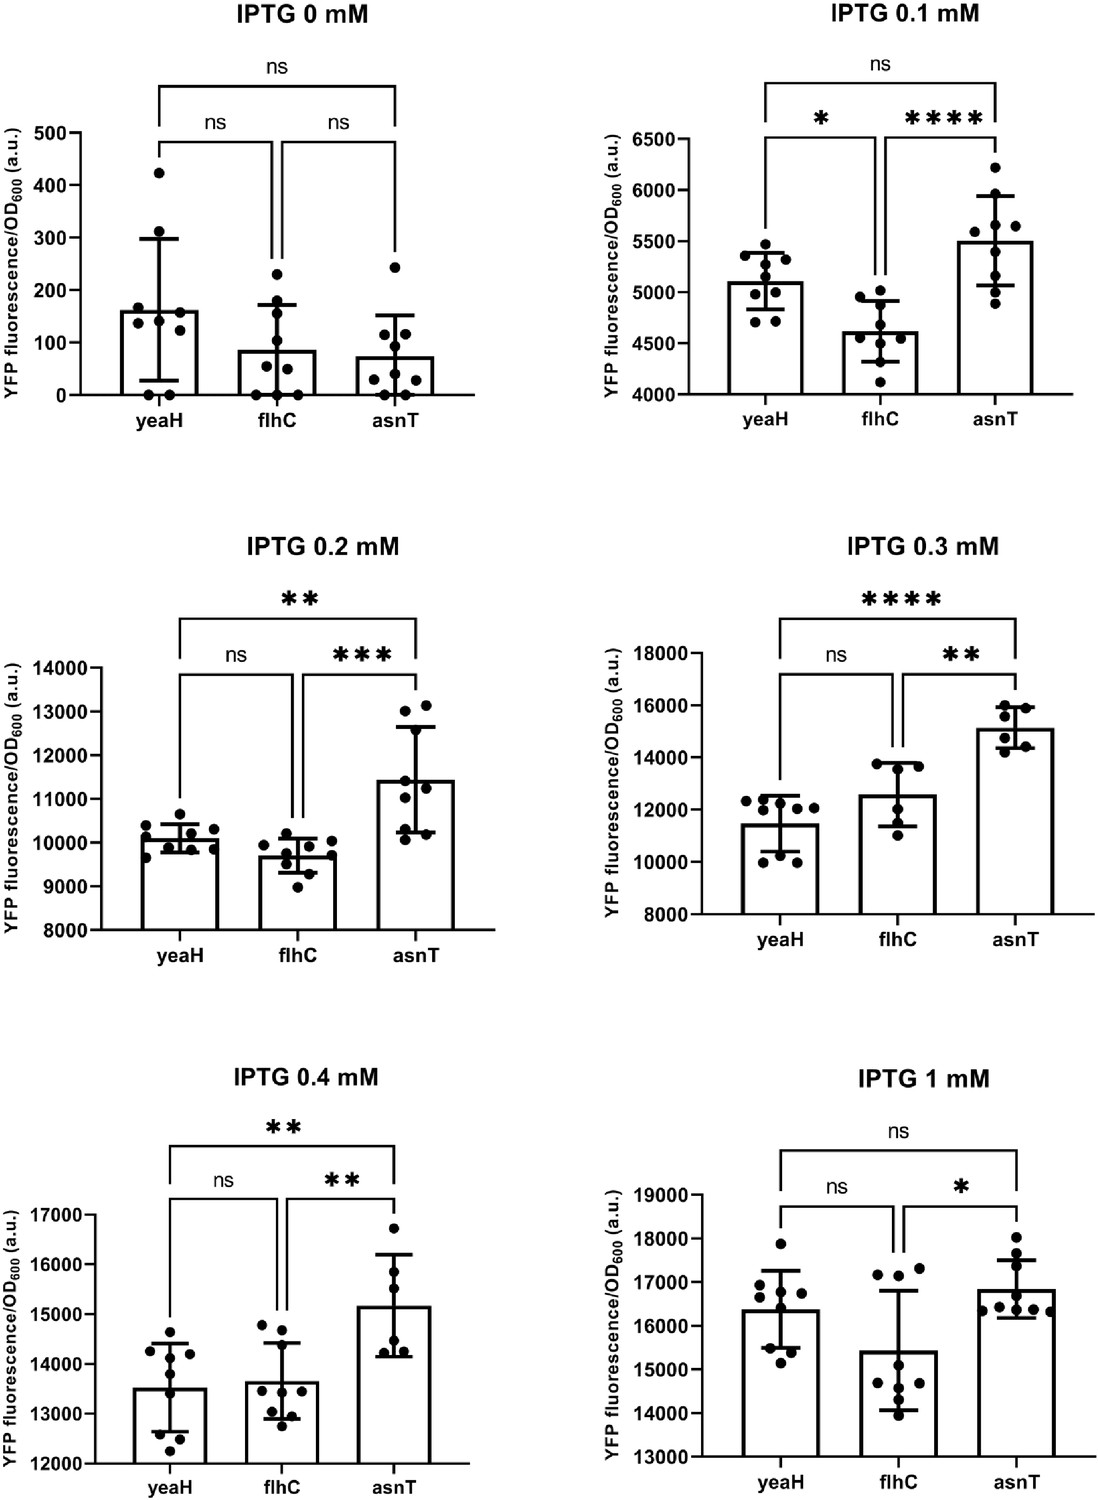
Plac activity differs significantly in cells carrying lacI inserted after a weak (yeaH), medium (flhC), and strong (asnT) terminator grown in different concentrations of isopropyl β-D-thiogalactopyranoside (IPTG).
Bars are mean values, circles individual measurements. Error bars are standard deviations. Stars indicate strains that significantly differ from each other (*p<0.05, **p<0.005, ***p<0.0005, ****p<0.0001).
Figure 7
Architecture of a regulon depends on local genetic context.
(A) Diagram of interactions within our gene regulatory network (GRN) in two different transcriptional unit (TU) arrangements: CLT and TLC. (B) Regulatory patterns in two regulons with overlapping components. Genes Gene1 and Gene2 are regulated via transcription factor-operator interactions with regulator TF1. Gene Gene3 is regulated by TF2 binding and by TF1 via local genetic context effects. (A and B) Solid lines represent interactions between transcription factors and the promoters they control, dashed line represents effects resulting from local genetic context. Promoters are marked as bent arrows, terminators are represented by vertical bars and a circle.
Additional files
-
Supplementary file 1
Strains used in this study.
- https://cdn.elifesciences.org/articles/65993/elife-65993-supp1-v3.docx
-
Supplementary file 2
Oligonucleotides used in this study.
- https://cdn.elifesciences.org/articles/65993/elife-65993-supp2-v3.docx
-
Supplementary file 3
Plasmids used in this study.
- https://cdn.elifesciences.org/articles/65993/elife-65993-supp3-v3.docx
-
Supplementary file 4
ANOVA test statistics.
- https://cdn.elifesciences.org/articles/65993/elife-65993-supp4-v3.docx
-
Transparent reporting form
- https://cdn.elifesciences.org/articles/65993/elife-65993-transrepform-v3.docx
Download links
A two-part list of links to download the article, or parts of the article, in various formats.
Downloads (link to download the article as PDF)
Open citations (links to open the citations from this article in various online reference manager services)
Cite this article (links to download the citations from this article in formats compatible with various reference manager tools)
Local genetic context shapes the function of a gene regulatory network
eLife 10:e65993.
https://doi.org/10.7554/eLife.65993


