Sustained expression of unc-4 homeobox gene and unc-37/Groucho in postmitotic neurons specifies the spatial organization of the cholinergic synapses in C. elegans
- Department of Zoology, University of British Columbia, Canada
- Graduate Program in Cell and Developmental Biology, University of British Columbia, Canada
- Life Sciences Institute, University of British Columbia, Canada
- Djavad Mowafaghian Centre for Brain Health, University of British Columbia, Canada
Figures
Figure 1 with 4 supplements

unc-4 and unc-37 are required for tiled synaptic innervation of DA8 and DA9 neurons.
(A) Schematic of the tiled innervation between DA8 and DA9 neurons of wild-type (top) and synaptic tiling mutants (bottom). (B–D) Representative images of synaptic tiling in wildtype (B), unc-4(e120) (C), and unc-37(e262) (D) mutants. Magnified images (represented by the dotted box) of GFP, mCherry, and merged channels shown above. Synaptic overlap between the DA8 and DA9 synaptic domains are highlighted with yellow lines. Asterisks: DA9 cell body. Scale bar: 10 μm. (E) Quantification of overlap between DA8 and DA9 synaptic domains. See Figure 1—source data 1. Each dot represents a single animal. Black bars indicate mean ± SEM. n.s.: not significant; *: p<0.05; ****: p<0.0001.
-
Figure 1—source data 1
Quantification of overlap between DA8 and DA9 synaptic domains.
- https://cdn.elifesciences.org/articles/66011/elife-66011-fig1-data1-v1.xlsx
Figure 1—figure supplement 1
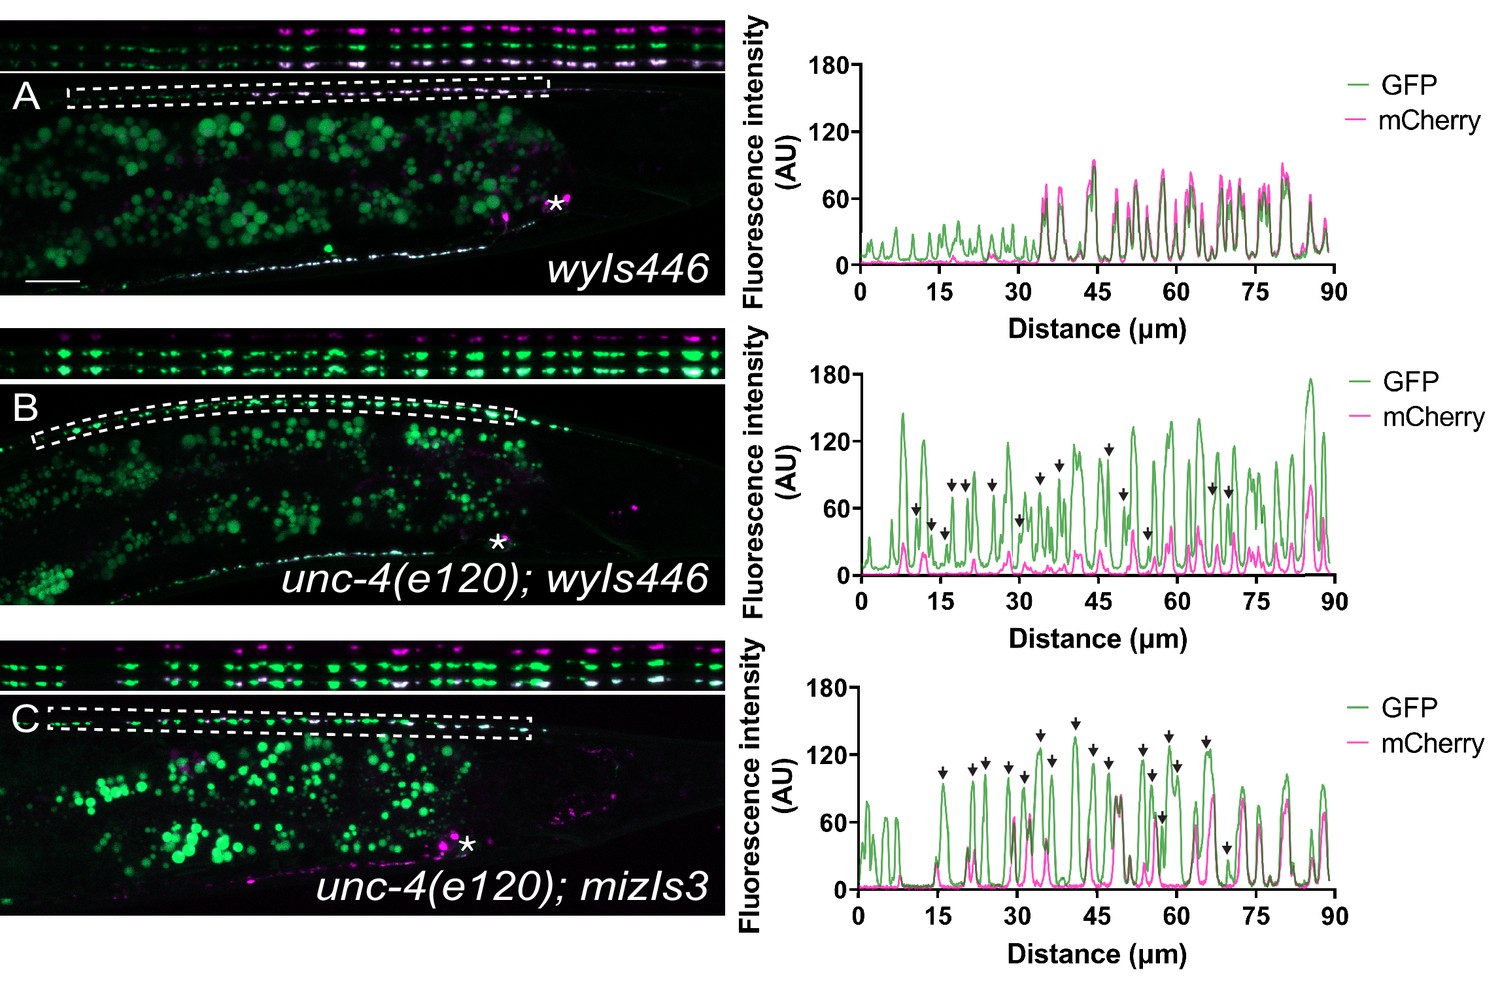
Colocalization of GFP::RAB-3 and mCherry::RAB-3 in the DA9 neuron with two synaptic tiling markers.
(A) Representative image of the previously used DA8 and DA9 synaptic marker (wyIs446) in wild-type animals (left). (B) Representative image of the unc-4(e120); wyIs446 animals (left). (C) Representative image of unc-4(e120); mizIs3 animals (left). Dotted box in each image denotes the region magnified above and used to measure the fluorescence intensity of GFP and mCherry channels (right). See Figure 1—figure supplement 1—source data 1. Asterisks: DA9 cell body. Scale bar: 10 μm. Black arrows denote DA8 synapses which are devoid of mCherry::RAB-3.
-
Figure 1—figure supplement 1—source data 1
Fluorescence intensity of GFP and mCherry channels.
- https://cdn.elifesciences.org/articles/66011/elife-66011-fig1-figsupp1-data1-v1.xlsx
Figure 1—figure supplement 2
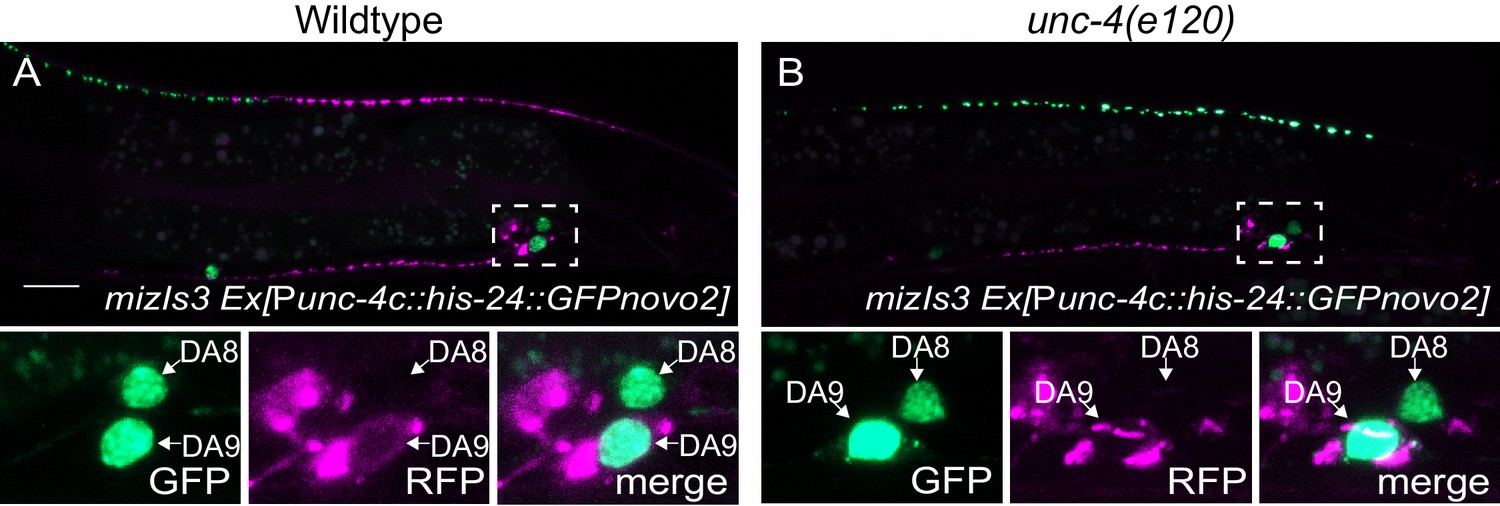
Pmig-13::mCherry::rab-3 is not ectopically expressed in DA8 of unc-4(e120) mutants.
(A) Representative image of mizIs3 animals co-expressing his-24::GFPnovo2 in the DA neurons. (B) Representative image of unc-4(e120); mizIs3 co-expressing his-24::GFPnovo2 in the DA neurons. GFP, RFP, and merged channels of the magnified images around the DA8 and DA9 cell bodies (indicated by dotted boxes) are shown below. Magnified images have increased brightness to show the presence of mCherry signal in DA9 cell body and the absence of mCherry signal in the DA8 cell body. Scale bar: 10 μm.
Figure 1—figure supplement 3
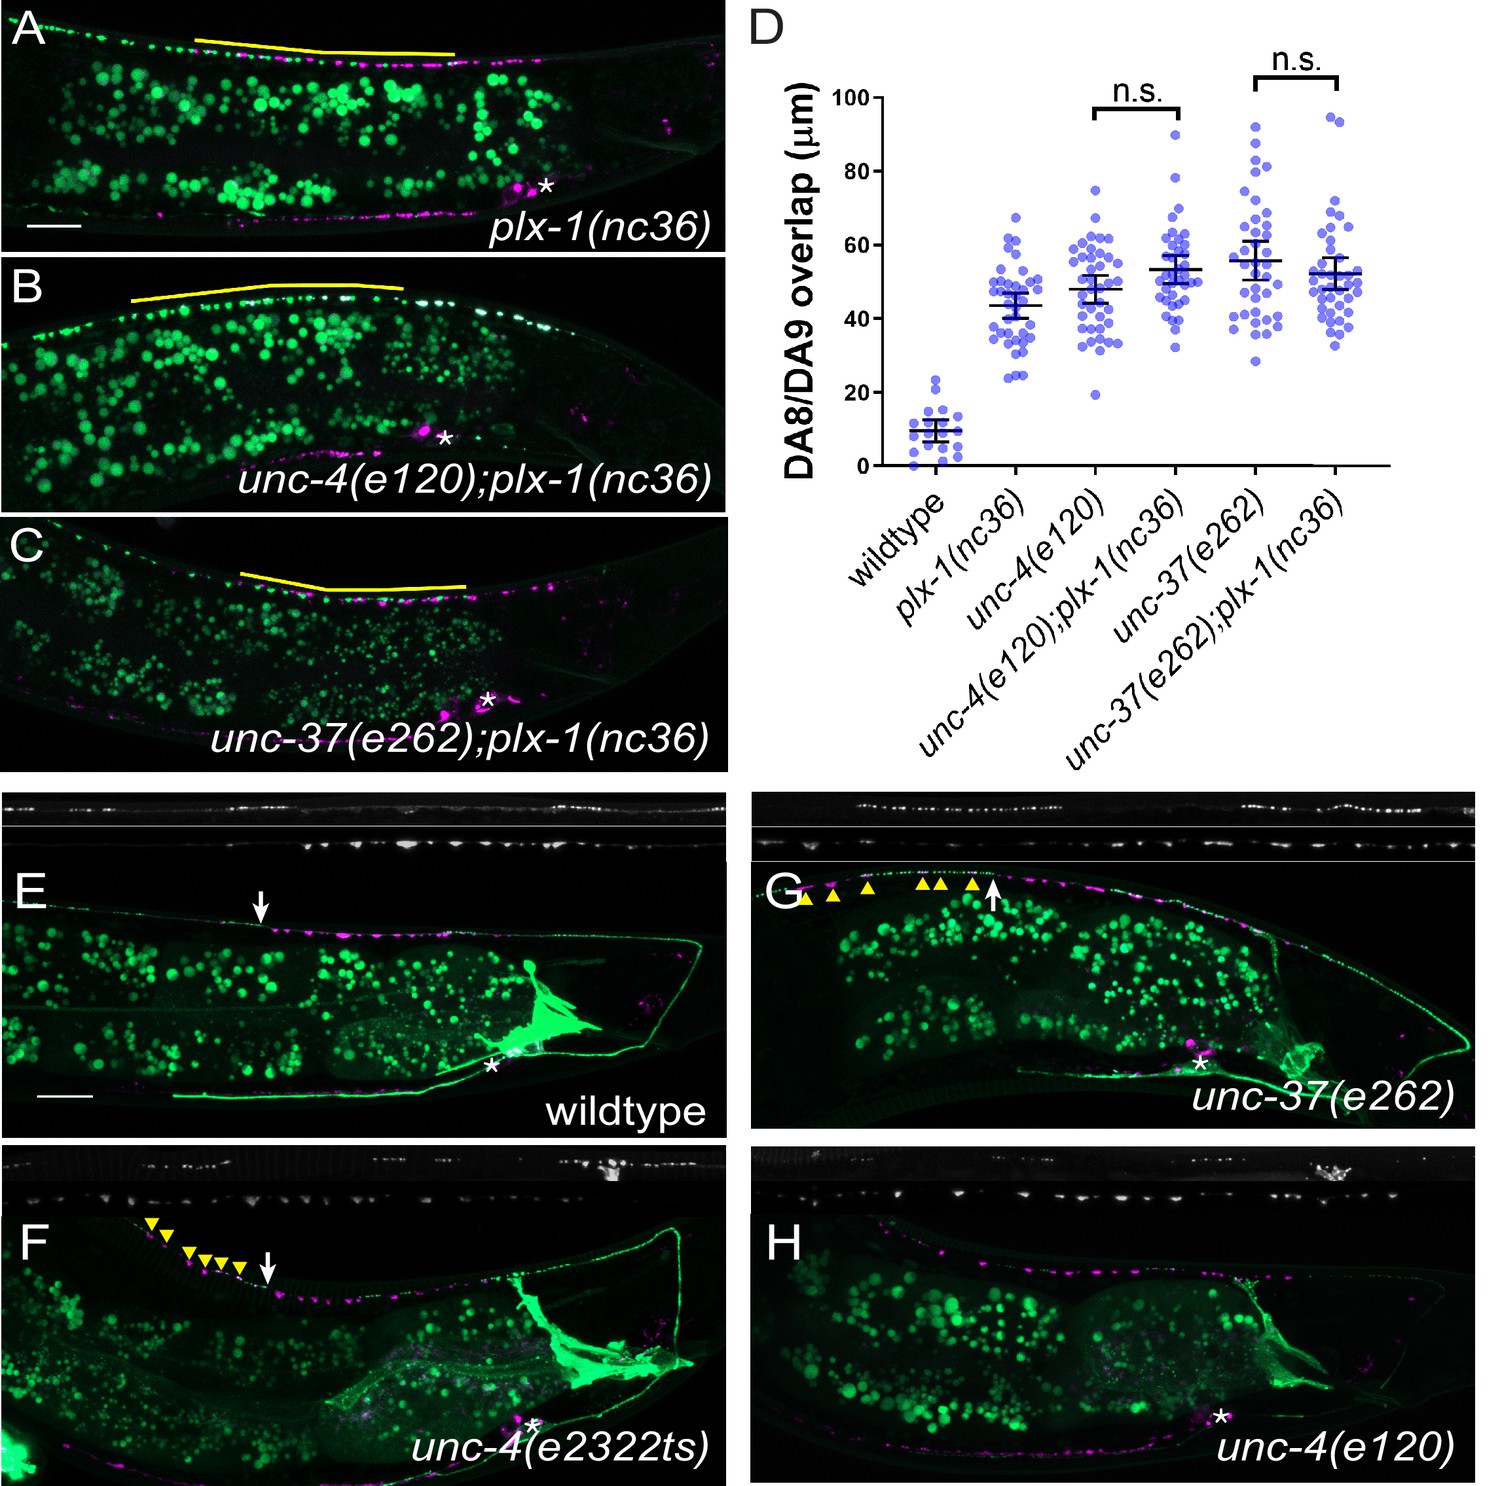
unc-4 and unc-37 may function in the same genetic pathway as plx-1.
(A–C) Representative images of synaptic tiling in plx-1(nc36) (A), unc-4(e120);plx-1(nc36) (B), unc-37(e262);plx-1(nc36) (C) mutants. The overlap between the DA8 and DA9 synaptic domains are highlighted with yellow lines. Asterisks: DA9 cell body. Scale bar: 10 μm. (D) Quantification of overlap between DA8 and DA9 synaptic domains in plx-1 mutant animals. See Figure 1—figure supplement 3—source data 1. Each dot represents a single animal. Black bars indicate mean ± SEM. n.s.: not significant. (E–H) Representative images of PLX-1::GFP in wild-type (E), unc-4(e2322ts) (F), unc-37(e262) (G), and unc-4(e120) (H) mutants. White arrows indicate the PLX-1::GFP localization at the anterior edge of the DA9 synaptic domain. Yellow arrowheads represent ectopic synapse formation anterior to the PLX-1::GFP localization. Asterisks: DA9 cell body. Scale bar: 10 μm.
-
Figure 1—figure supplement 3—source data 1
Quantification of overlap between DA8 and DA9 synaptic domains in plx-1 mutant animals.
- https://cdn.elifesciences.org/articles/66011/elife-66011-fig1-figsupp3-data1-v1.xlsx
Figure 1—figure supplement 4
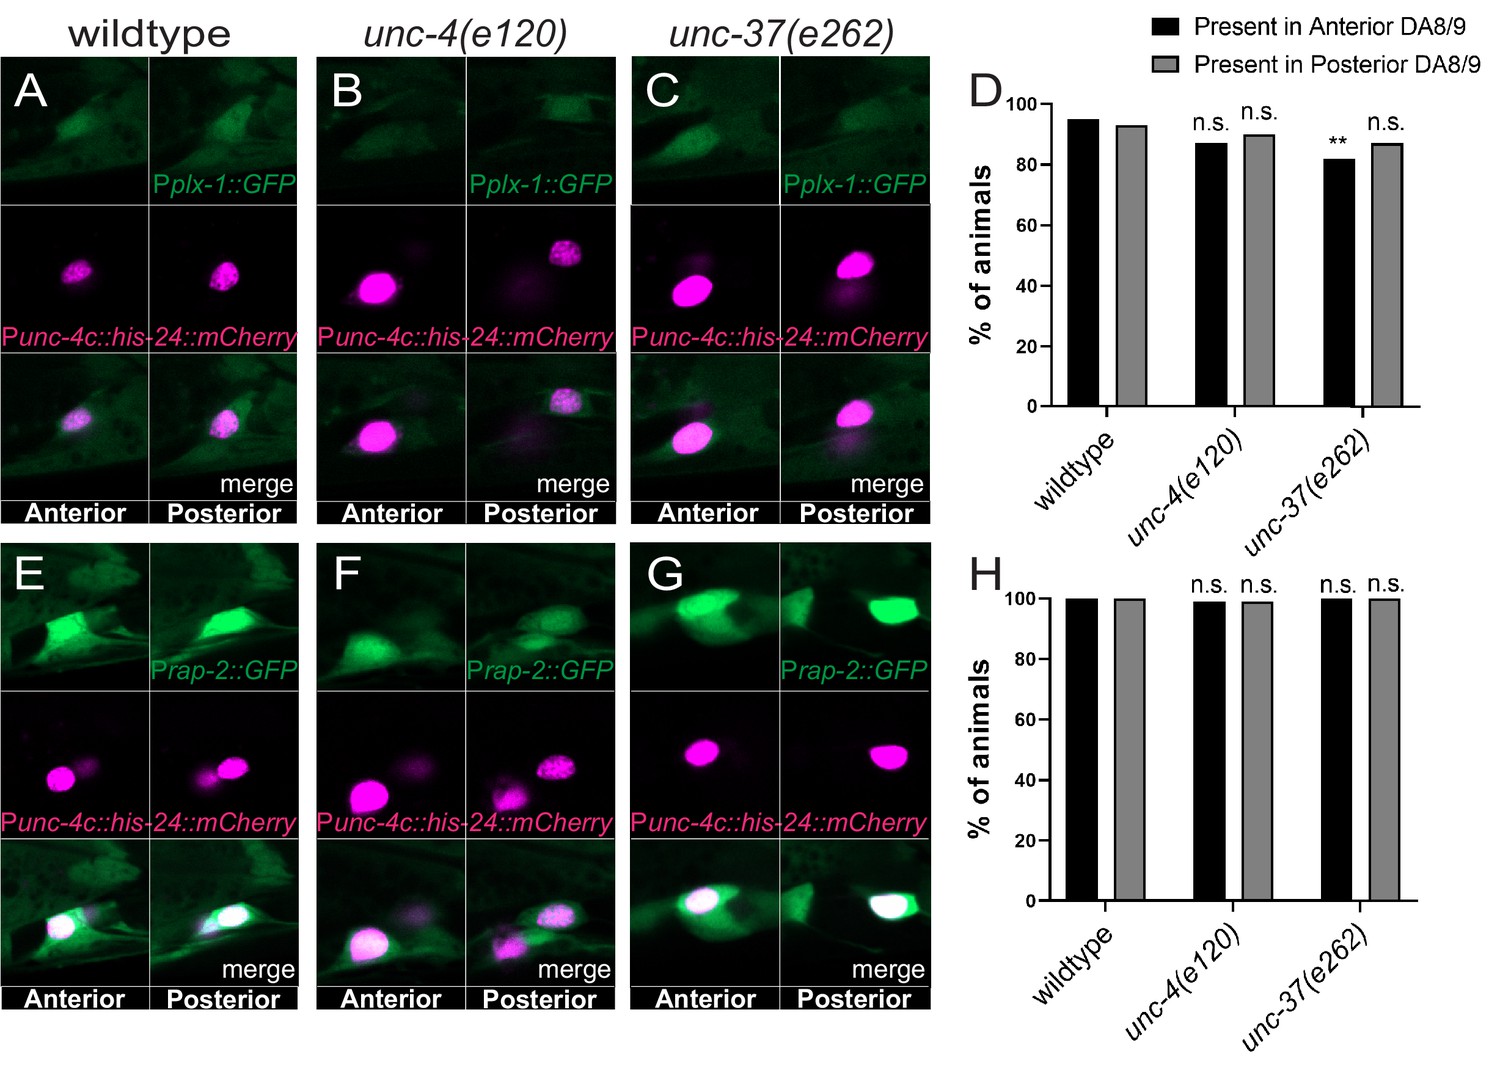
plx-1 and rap-2 expression is largely unaffected in unc-4 and unc-37 mutants.
(A–C) Representative image of Pplx-1::GFP in wild-type (A), unc-4(e120) (B), and unc-37(e262) (C) mutants with HIS-24::mCherry in DA8 and DA9. (D) Quantification of animals (n = 100) that expressed Pplx-1::GFP in the anterior and posterior DA8/DA9 of wild-type, unc-4(e120), and unc-37(e262) animals. Figure 1—figure supplement 4—source data 1. (E–G) Representative image of Prap-2::GFP in wild-type (E), unc-4(e120) mutant (F), unc-37(e262) (G) mutants with HIS-24::mCherry in DA8 and DA9. (H) Quantification of animals (n = 100) that expressed Prap-2::GFP in the anterior and posterior DA8/9 of wild-type, unc-4, and unc-37 animals. Figure 1—figure supplement 4—source data 2.
-
Figure 1—figure supplement 4—source data 1
Quantification of animals that expressed Pplx-1::GFP in the anterior and posterior DA8/DA9 of wild-type, unc-4(e120), and unc-37(e262) animals.
- https://cdn.elifesciences.org/articles/66011/elife-66011-fig1-figsupp4-data1-v1.xlsx
-
Figure 1—figure supplement 4—source data 2
Quantification of animals (n=100) that expressed Prap-2::GFP in the anterior and posterior DA8/9 of wild-type, unc-4, and unc-37 animals.
- https://cdn.elifesciences.org/articles/66011/elife-66011-fig1-figsupp4-data2-v1.xlsx
Figure 2 with 2 supplements
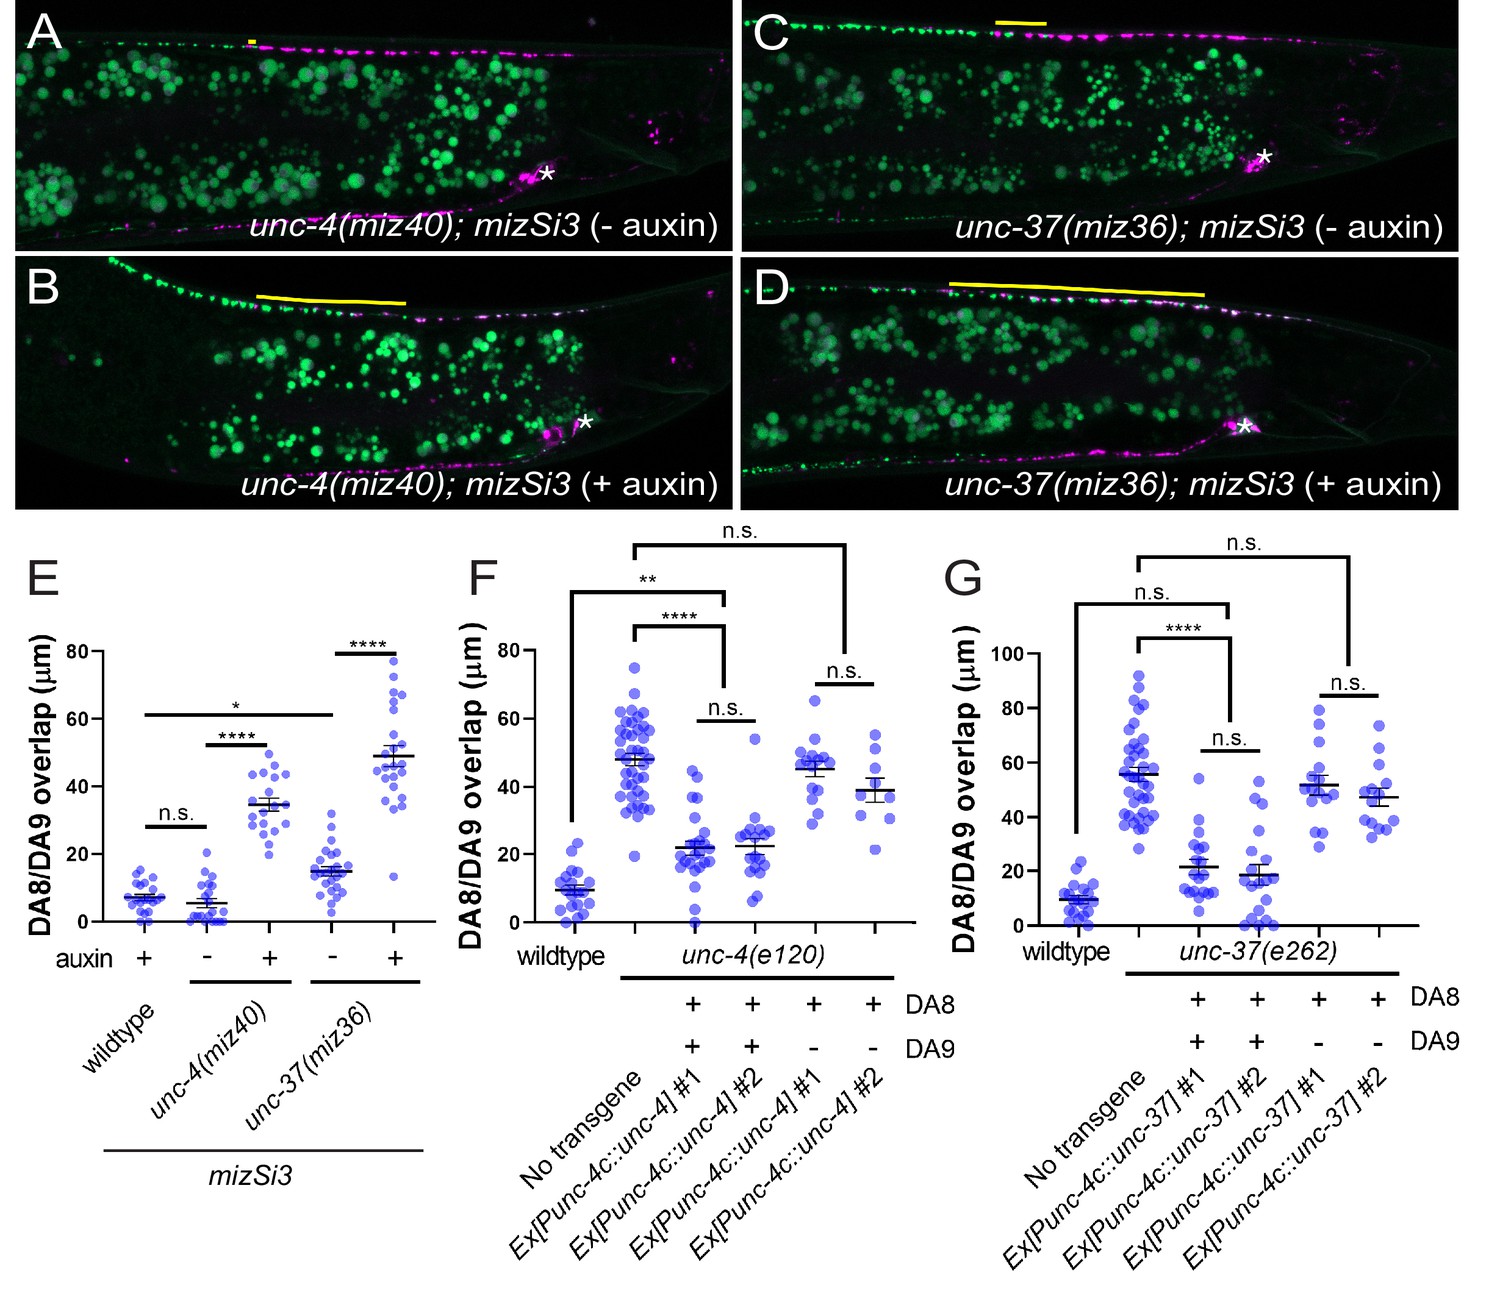
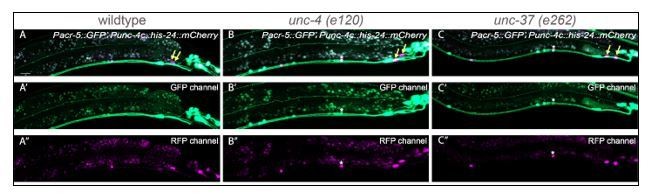
unc-4 and unc-37 are necessary and sufficient for the tiled innervation of DA8 and DA9 neurons.
(A–D) Representative images of synaptic tiling in unc-4(miz40); mizSi3 (− auxin) (A), unc-4(miz40); mizSi3 (+ auxin) (B), unc-37(miz36); mizSi3 (− auxin) (C), and unc-37(miz36); mizSi3 (+auxin) (D). mizSi3 expresses TIR1 in the DA neurons for tissue-specific degradation of UNC-4 and UNC-37. The overlap between the DA8 and DA9 synaptic domains are highlighted with yellow lines. Asterisks: DA9 cell body. Scale bar: 10 μm. (E) Quantification of overlap of DA8 and DA9 synaptic domains of unc-4(miz40); mizSi3 and unc-37(miz36); mizSi3 animals treated with (+) and without (-) auxin. See Figure 2—source data 1. (F, G) Cell specific rescue of unc-4(e120) mutants with unc-4 cDNA using DA-specific promoter (Punc-4c). See Figure 2—source data 2. (F) Cell specific rescue of unc-37(e262) mutants with unc-37 cDNA using DA-specific promoter (Punc-4c). See Figure 2—source data 3. (G). Two independent transgenic lines were quantified. Mosaic experiment using Punc-4c::unc-4 and Punc-4c::unc-37 are also shown. Each dot represents a single animal. Black bars indicate mean ± SEM. n.s.: not significant; *: p<0.05; **: p<0.01; ****:p<0.0001.
-
Figure 2—source data 1
Quantification of overlap of DA8 and DA9 synaptic domains of unc-4(miz40); mizSi3 and unc-37(miz36); mizSi3 animals treated with (+) and without (-) auxin.
- https://cdn.elifesciences.org/articles/66011/elife-66011-fig2-data1-v1.xlsx
-
Figure 2—source data 2
Cell specific rescue of unc-4(e120) mutants with unc-4 cDNA using DA-specific promoter (Punc-4c).
- https://cdn.elifesciences.org/articles/66011/elife-66011-fig2-data2-v1.xlsx
-
Figure 2—source data 3
Cell specific rescue of unc-37(e262) mutants with unc-37 cDNA using DA-specific promoter (Punc-4c).
- https://cdn.elifesciences.org/articles/66011/elife-66011-fig2-data3-v1.xlsx
Figure 2—figure supplement 1
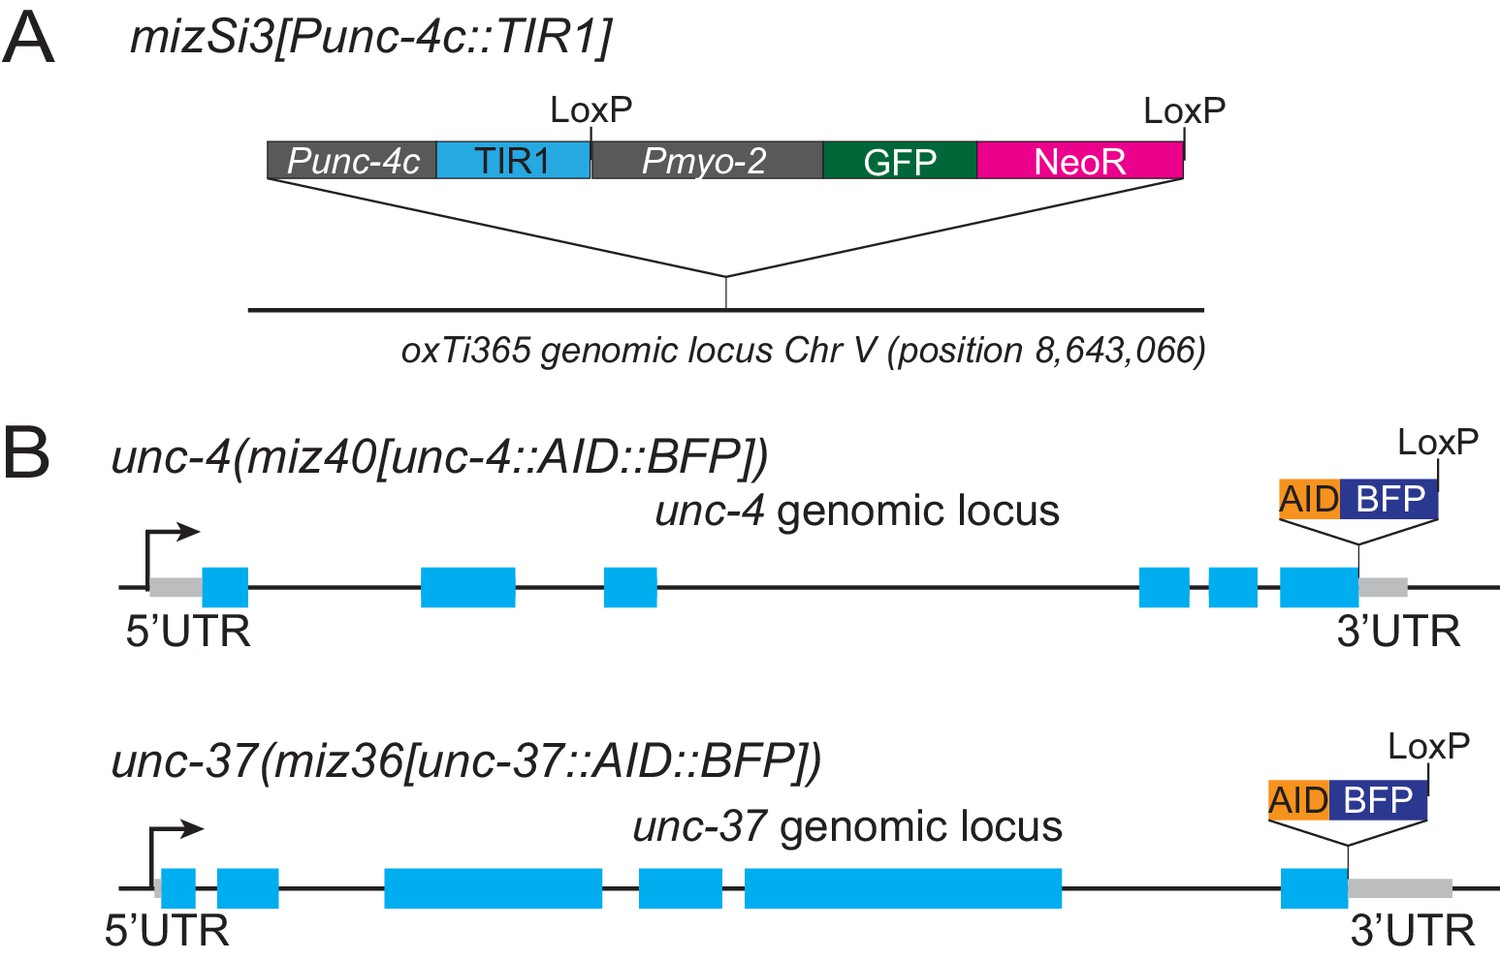
Genomic structure of the AID strains.
(A) Genomic structure of oxTi365 locus in mizSi3[Punc-4c::TIR1] strains. (B) Genomic structure of unc-4 (top) and unc-37 (bottom) in unc-4(miz40[unc-4::AID::BFP]) and unc-37(miz36[unc-37::AID::BFP]) strains. See Materials and methods for details.
Figure 2—figure supplement 2
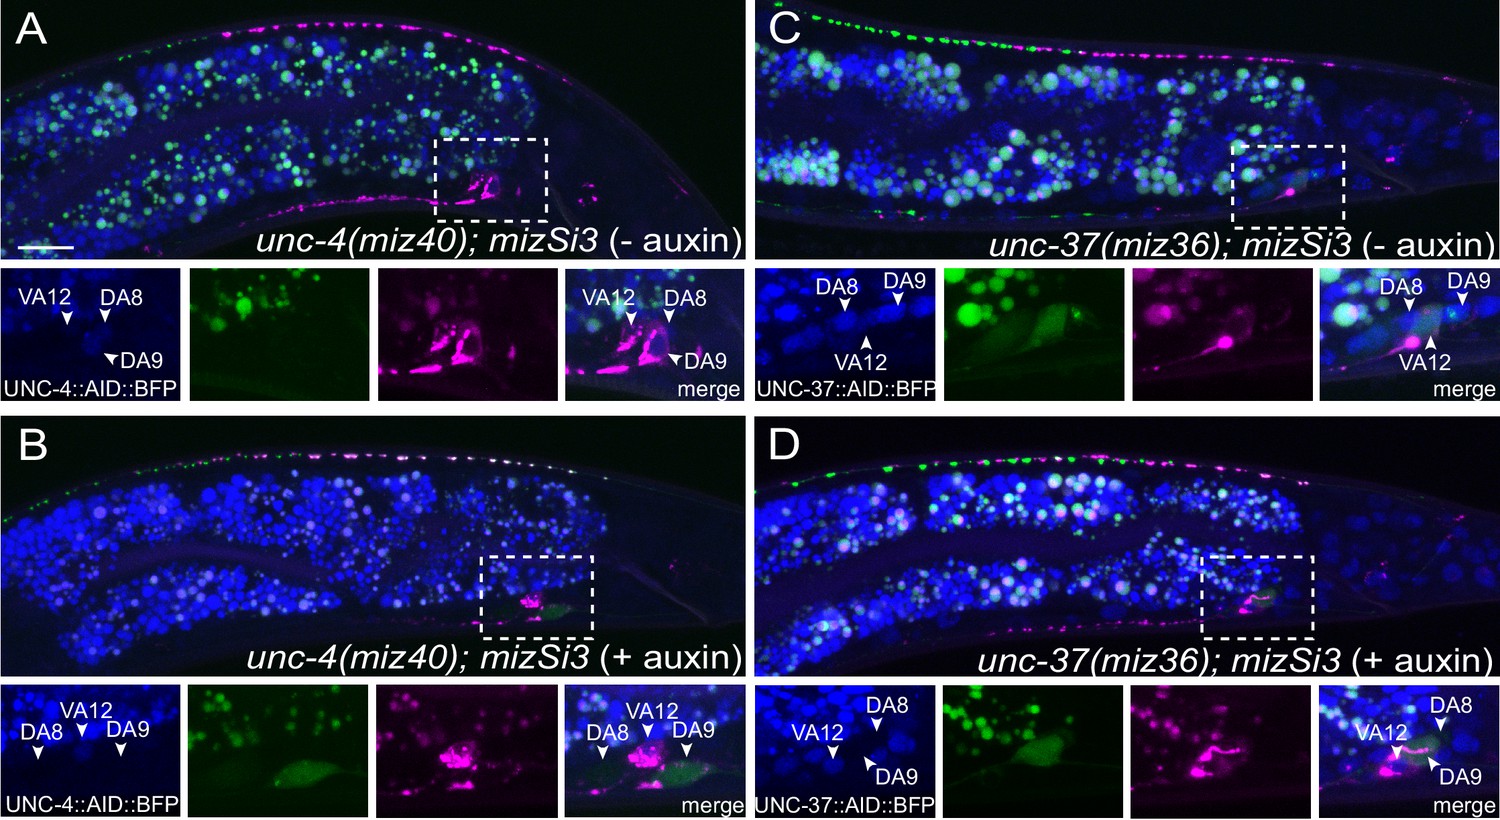
DA-neuron-specific degradation of UNC-4 and UNC-37 using AID system.
(A–B) Representative images of unc-4(miz40) in M9 control (A) and auxin (B) treated animals. (C–D) Representative images of unc-37(miz36) in M9 control (C) and auxin (D) treated animals. Magnified images (represented by dotted box) of BFP, GFP, RFP, and merged channels shown below. White arrow heads denote VA12, DA8, DA9 cell bodies. Scale bar: 10 μm.
Figure 3
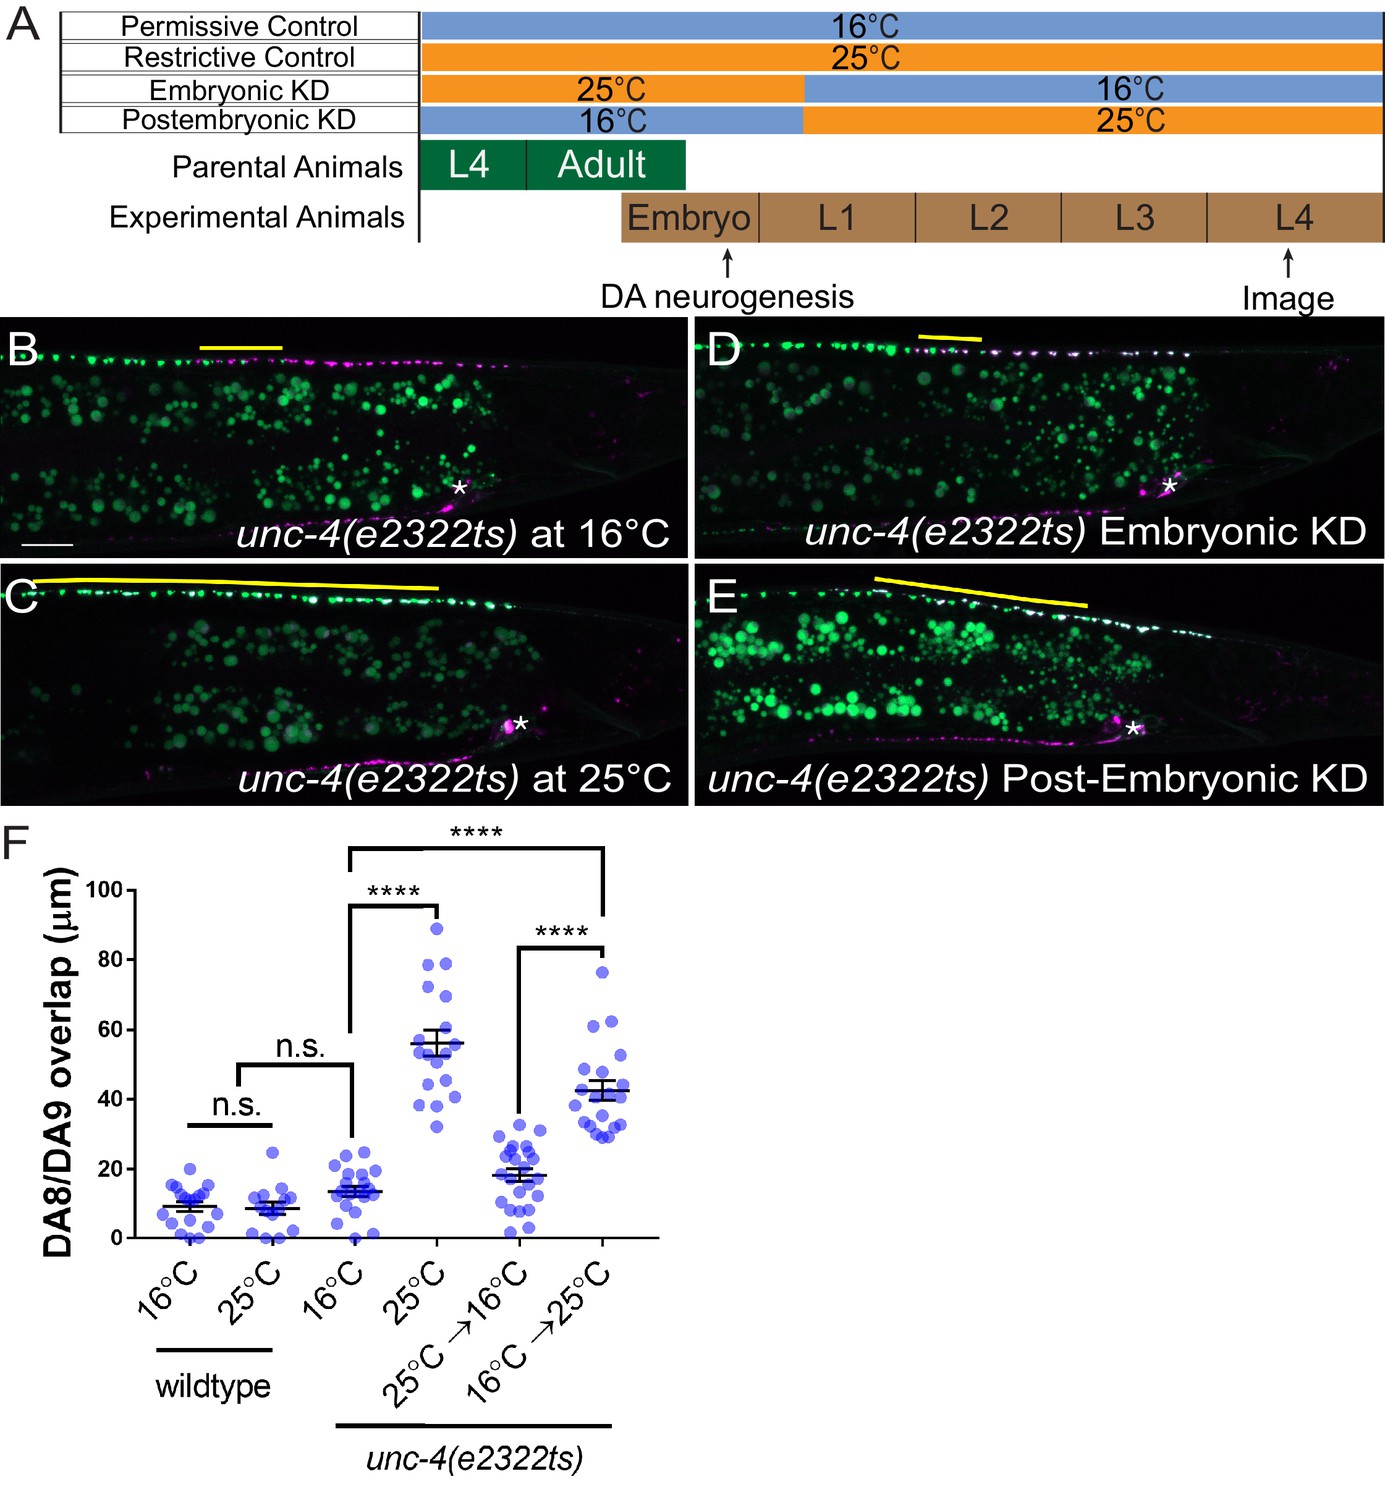
unc-4 functions in postmitotic DA neurons for the synaptic tiling of DA8 and DA9 neurons.
(A) Experimental design of the temperature shift assay. (B–E) Representative images of synaptic tiling in unc-4(e2322ts) at 16°C (B), unc-4(e2322ts) at 25°C (C), unc-4(e2322ts) embryonic knockdown (D), and unc-4(e2322ts) postembryonic knockdown (E). The overlap between the DA8 and DA9 synaptic domains are highlighted with yellow lines. Asterisks: DA9 cell body. Scale bar: 10 μm. (F) Quantification of overlap of DA8 and DA9 synaptic domains. See Figure 3—source data 1. Each dot represents a single animal. Black bars indicate mean ± SEM. n.s.: not significant; ****:p<0.0001.
-
Figure 3—source data 1
Quantification of overlap of DA8 and DA9 synaptic domains.
- https://cdn.elifesciences.org/articles/66011/elife-66011-fig3-data1-v1.xlsx
Figure 4
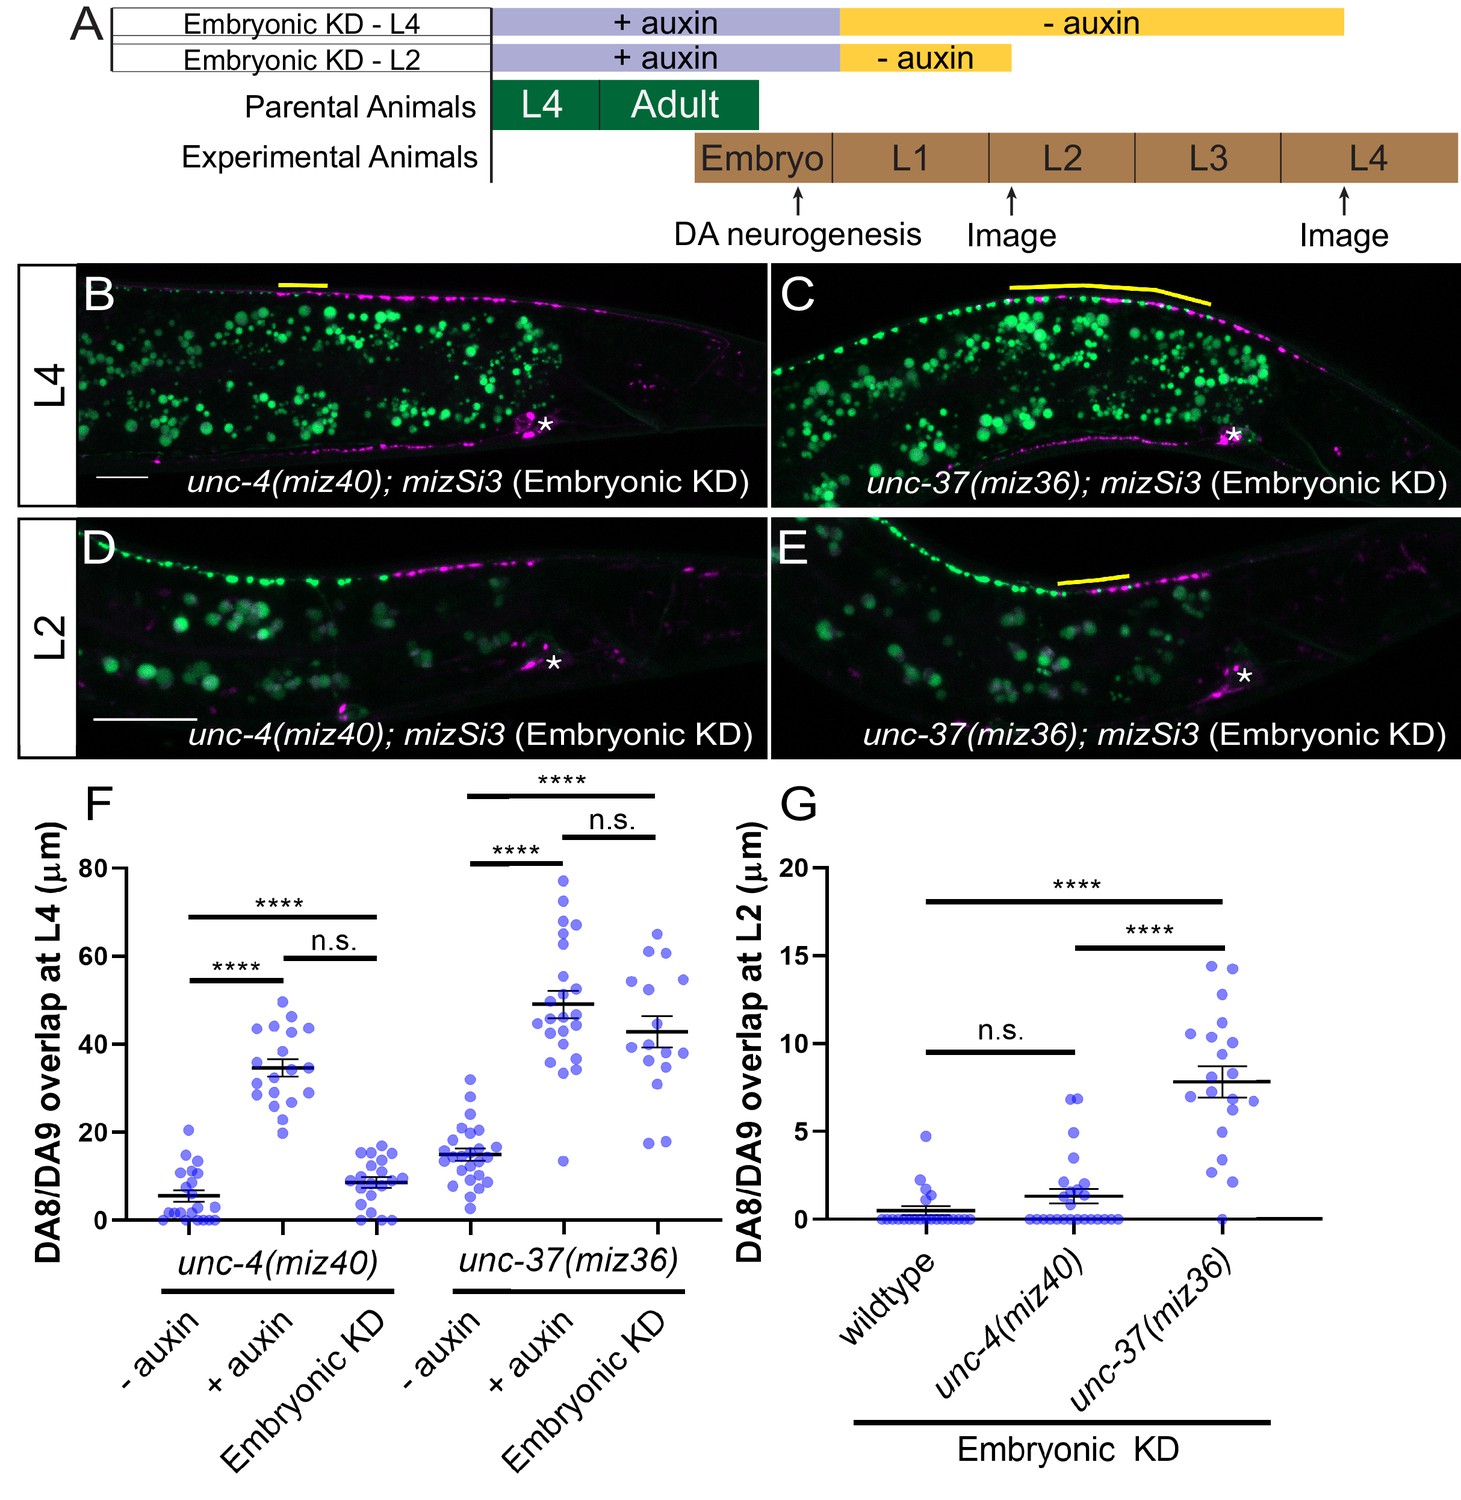
unc-37 but not unc-4 is required during DA neurogenesis for proper synaptic tiling of DA8 and DA9 neurons.
(A) Experimental design of the embryonic degradation of UNC-4 and UNC-37 using the AID system. (B, C) Representative images of synaptic tiling at L4 stage after embryonic degradation in unc-4(miz40); mizSi3 (B) and unc-37(miz36); mizSi3 (C). (D, E) Representative images of synaptic tiling at L2 stage after embryonic degradation in unc-4(miz40); mizSi3 (D) and unc-37(miz36); mizSi3 (E). The overlap between the DA8 and DA9 synaptic domains are highlighted with yellow lines. Asterisks: DA9 cell body. Scale bar: 10 μm. (F) Quantification of overlap of DA8 and DA9 synaptic domains at the L4 stage after embryonic auxin treatment. See Figure 4—source data 1. (G) Quantification of overlap of DA8 and DA9 synaptic domains at the L2 stage after embryonic auxin treatment. See Figure 4—source data 2. Each dot represents a single animal. Black bars indicate mean ± SEM. n.s.: not significant; ****:p<0.0001.
-
Figure 4—source data 1
Quantification of overlap of DA8 and DA9 synaptic domains at the L4 stage after embryonic auxin treatment.
- https://cdn.elifesciences.org/articles/66011/elife-66011-fig4-data1-v1.xlsx
-
Figure 4—source data 2
Quantification of overlap of DA8 and DA9 synaptic domains at the L2 stage after embryonic auxin treatment.
- https://cdn.elifesciences.org/articles/66011/elife-66011-fig4-data2-v1.xlsx
Figure 5
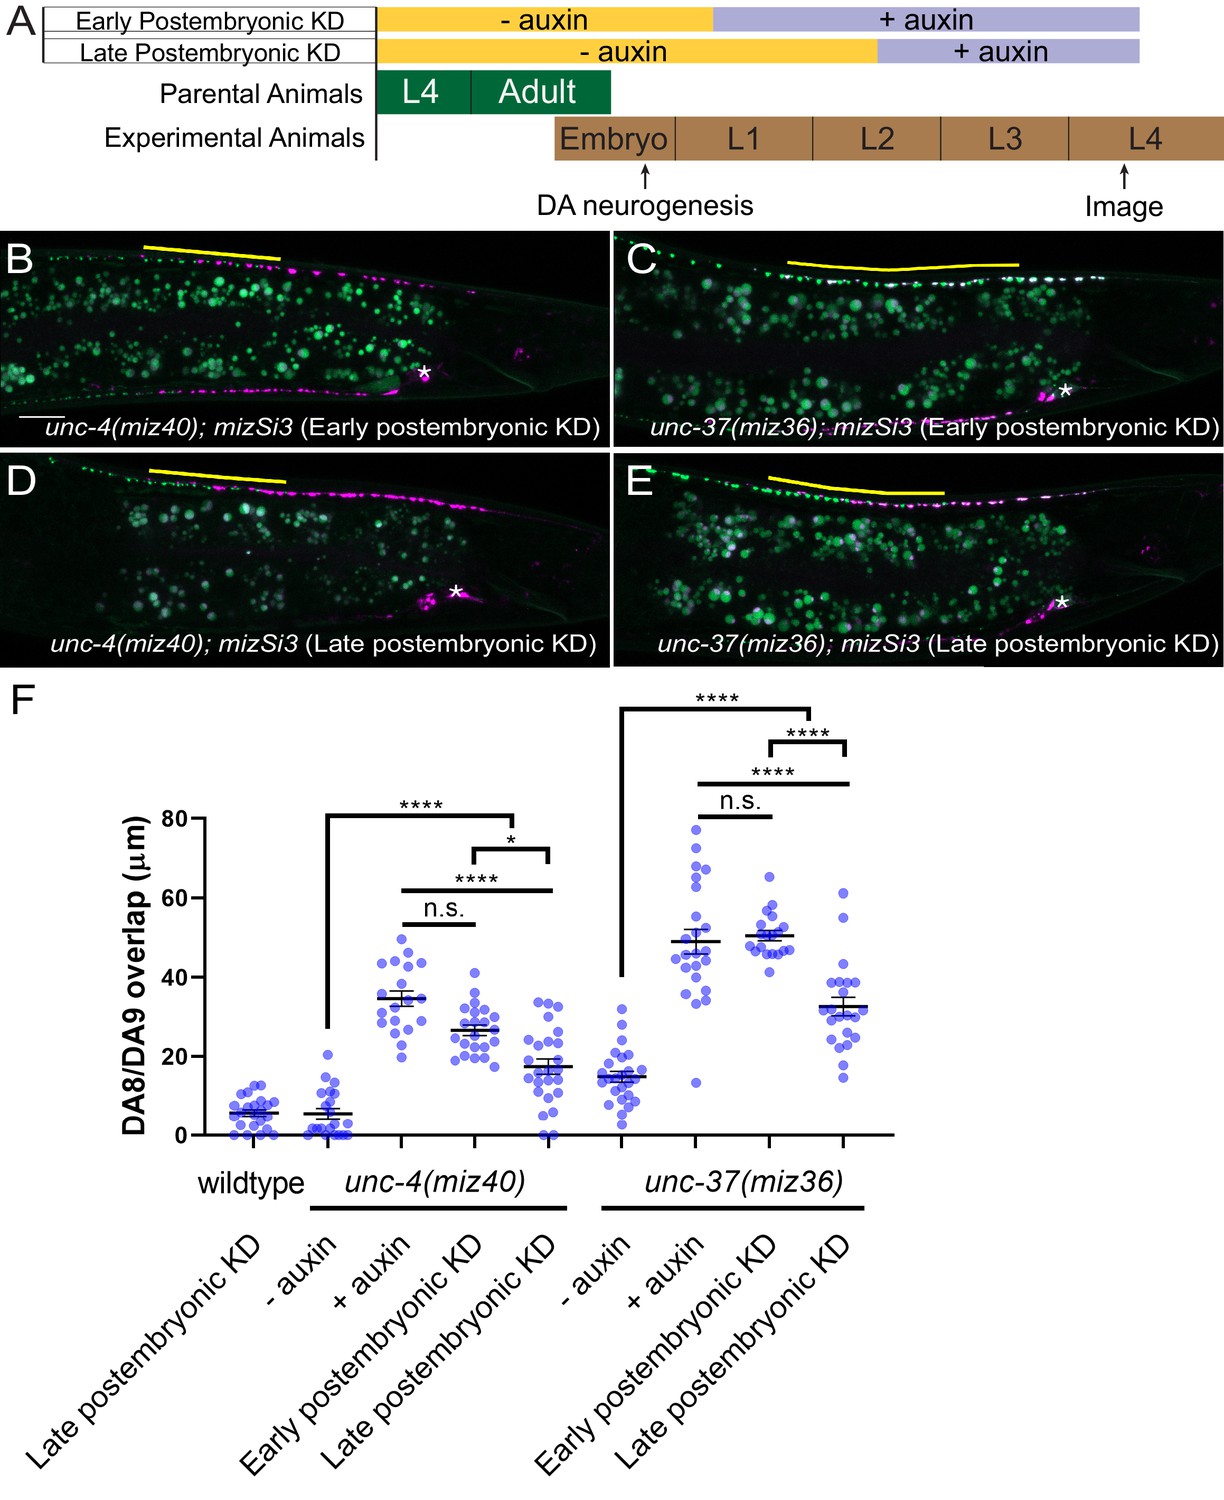
unc-4 and unc-37 are required in the postmitotic DA neurons to maintain synaptic tiling.
(A) Experimental design of the postembryonic degradation of UNC-4 and UNC-37 using the AID system. (B, C) Representative images of synaptic tiling after early postembryonic degradation in unc-4(miz40); mizSi3 (B) and unc-37(miz36); mizSi3 (C). (D, E) Representative images of synaptic tiling after late postembryonic degradation in unc-4(miz40); mizSi3 (D) and unc-37(miz36); mizSi3 (E). The overlap between the DA8 and DA9 synaptic domains are highlighted with yellow lines. Asterisks: DA9 cell body. Scale bar: 10 μm. (F) Quantification of overlap of DA8 and DA9 synaptic domains after postembryonic auxin treatment. See Figure 5—source data 1. Each dot represents a single animal. Black bars indicate mean ± SEM. n.s.: not significant; *:p<0.05; ****:p<0.0001.
-
Figure 5—source data 1
Quantification of overlap of DA8 and DA9 synaptic domains after postembryonic auxin treatment.
- https://cdn.elifesciences.org/articles/66011/elife-66011-fig5-data1-v1.xlsx
Figure 6 with 1 supplement
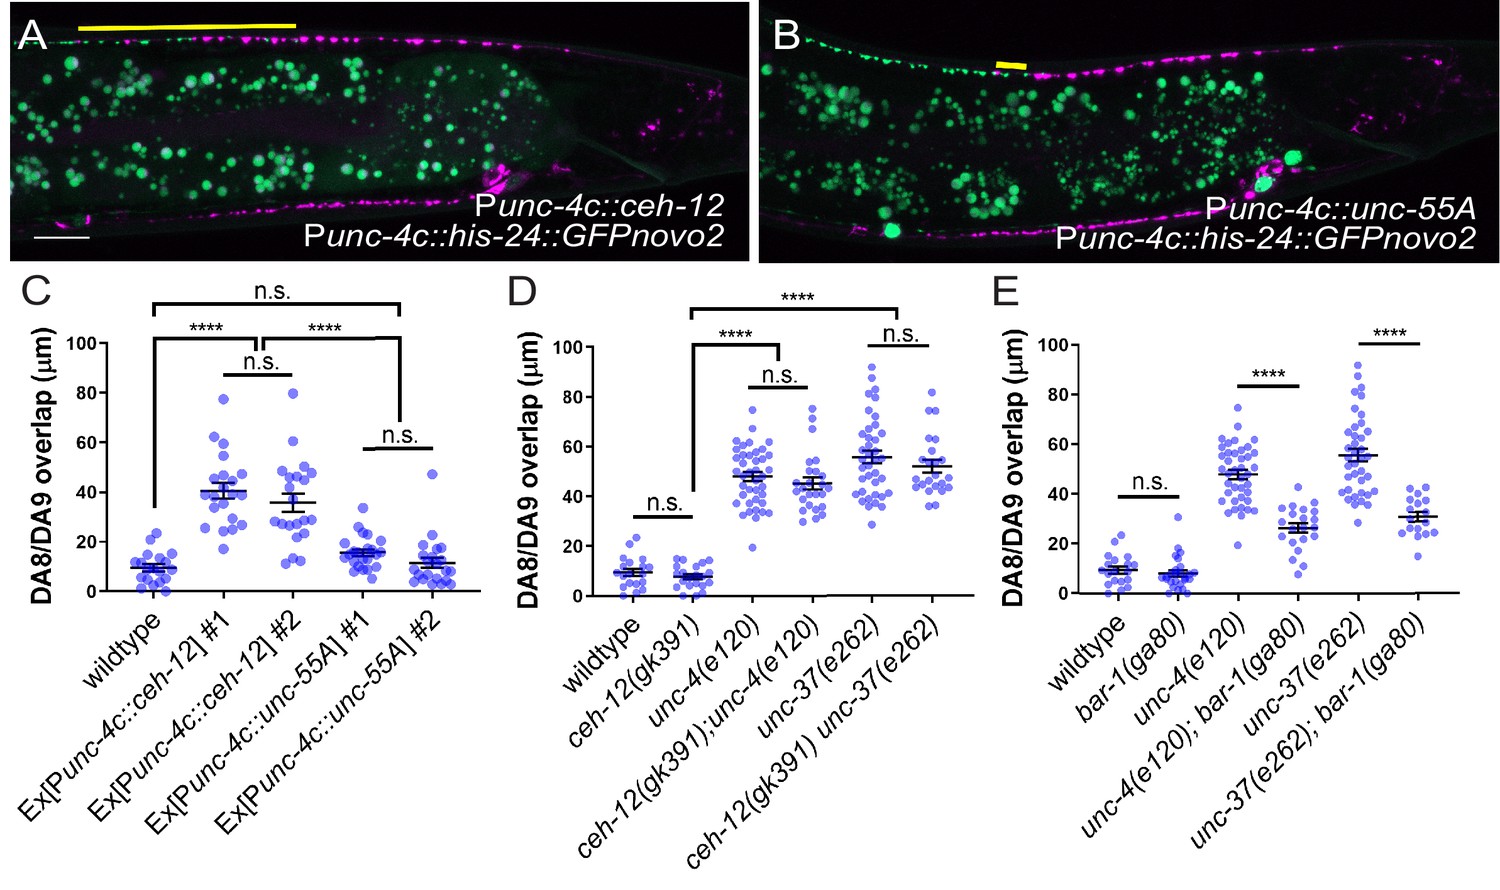
unc-4 and unc-37 inhibit canonical Wnt signaling to regulate synaptic tiling.
(A, B) Representative image of synaptic tiling in ectopic expression of ceh-12 under the unc-4c promoter (A) and unc-55A under the unc-4c promoter (B). The overlap between the DA8 and DA9 synaptic domains are highlighted with yellow lines. Scale bar: 10 μm. (C) Quantification of overlap between DA8 and DA9 synaptic domains. Two independent transgenic lines were quantified for each array. See Figure 6—source data 1. (D) Quantification of overlap between DA8 and DA9 synaptic domains in ceh-12 mutant animals. See Figure 6—source data 2. (E) Quantification of overlap between DA8 and DA9 synaptic domains in bar-1 mutant animals. See Figure 6—source data 3. Each dot represents a single animal. Black bars indicate mean ± SEM. n.s.: not significant; ****:p<0.0001.
-
Figure 6—source data 1
Quantification of overlap between DA8 and DA9 synaptic domains.
- https://cdn.elifesciences.org/articles/66011/elife-66011-fig6-data1-v1.xlsx
-
Figure 6—source data 2
Quantification of overlap between DA8 and DA9 synaptic domains in ceh-12 mutant animals.
- https://cdn.elifesciences.org/articles/66011/elife-66011-fig6-data2-v1.xlsx
-
Figure 6—source data 3
Quantification of overlap between DA8 and DA9 synaptic domains in bar-1 mutant animals.
- https://cdn.elifesciences.org/articles/66011/elife-66011-fig6-data3-v1.xlsx
Figure 6—figure supplement 1
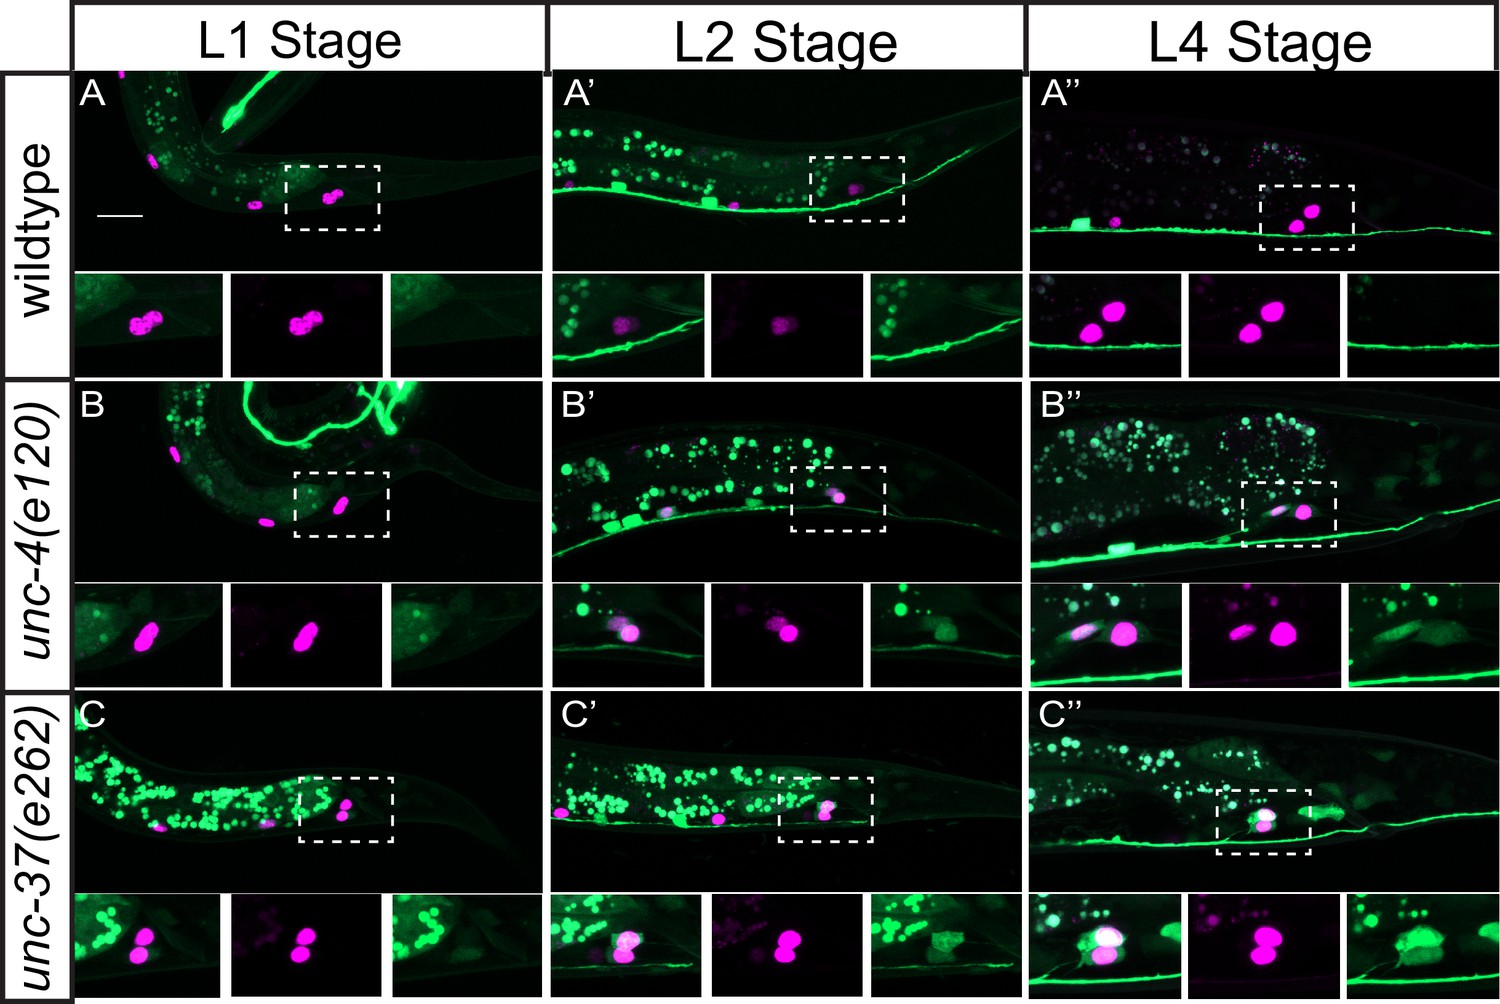
ceh-12 expression is derepressed in DA8/9 of unc-4(e120) and unc-37(e262) mutants.
(A–C) Representative images of Pceh-12::GFP with Punc-4c::his-24::mCherry in wild-type (A), unc-4(e120) (B) and unc-37(e262) (C) at the L1 (A–C), L2 (A’–C’), and L4 (A”–C”) stages. Dotted boxes represent the region of DA8 and DA9 cell bodies, and magnified images of merged, GFP, and mCherry channels are shown below. Scale bar: 10 μm.
Figure 7
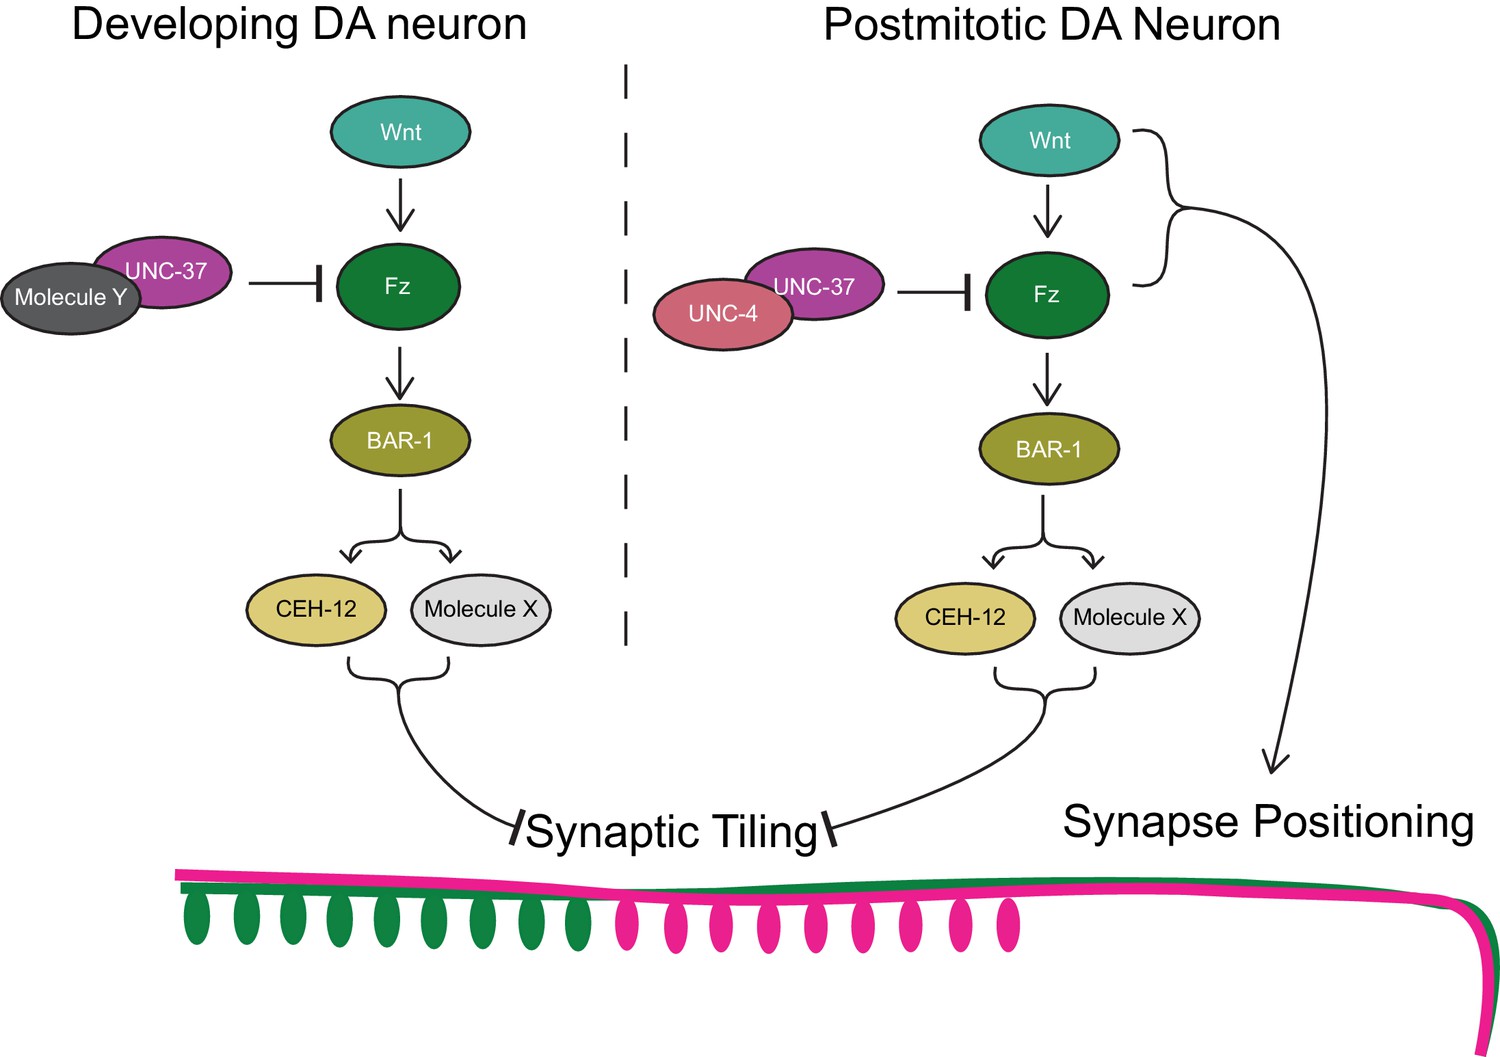
Model of UNC-4 and UNC-37 functions in synaptic tiling.
UNC-4 functions with UNC-37 in postmitotic DA neurons to regulate synaptic tiling by inhibiting canonical Wnt signaling. Ectopic expression of CEH-12 and other unknown molecules in DA neurons results in synaptic tiling defects. UNC-37 likely forms a repressor complex with an unknown transcription factor in developing DA neurons by inhibiting canonical Wnt signaling to regulate tiled synaptic innervation. Wnt and Fz also function in synapse positioning (Klassen and Shen, 2007; Mizumoto and Shen, 2013b).
Author response image 1
Author response image 2

Tables
Table 1
Expression of cell fate markers in the anterior or posterior DA8/DA9 neurons.
| DA marker | DB markers | DA9 markers | |||||||||
|---|---|---|---|---|---|---|---|---|---|---|---|
| Punc-53 | Punc-129DB | Pacr-16 | Pacr-5 | Pmig-13 | Pglr-4 | Pitr-1 | |||||
| Genotype | Anterior | Posterior | Anterior | Posterior | Anterior | Posterior | Anterior | Posterior | DA9 | DA9 | DA9 |
| Wild type | 94/100 | 94/100 | 2/100 | 4/100 | 0/100 | 0/100 | 0/100 | 0/100 | 100/100 | 100/100 | 100/100 |
| unc-4(e120) | 94/100 | 91/100 | 3/100 | 4/100 | 3/100 | 8/100 | 4/100 | 8/100 | 100/100 | 99/100 | n.d. |
| unc-37(e262) | 92/100 | 92/100 | 1/100 | 8/100 | 2/100 | 24/100 | 1/100 | 30/100 | 100/100 | 93/100 | 98/100 |
Key resources table
| Reagent type (species) or resource | Designation | Source or reference | Identifiers | Additional information |
|---|---|---|---|---|
| Gene (Caenorhabditis elegans) | unc-4 | WormBase | F26C11.2 | |
| Gene (Caenorhabditis elegans) | unc-37 | WormBase | W02D3.9 | |
| Strain, strain background (C. elegans) | unc-4(e120) | C. elegans stock center (CGC) | CB120 | |
| Strain, strain background (C. elegans) | unc-4(e2322) | C. elegans stock center (CGC) | NC37 | |
| Strain, strain background (C. elegans) | unc-37(e262) | C. elegans stock center (CGC) | CB262 | |
| Strain, strain background (C. elegans) | ceh-12(gk391) | C. elegans stock center (CGC) | VC995 | |
| Strain, strain background (C. elegans) | bar-1(ga80) | C. elegans stock center (CGC) | EW15 | |
| Strain, strain background (C. elegans) | unc-4(miz40) | This study | UJ1017 | unc-4::AID::BFP |
| Strain, strain background (C. elegans) | unc-37(miz36) | This study | UJ1013 | unc-37::AID::BFP |
| Strain, strain background (C. elegans) | mizIs3 | This study | UJ124 | DA8/DA9 synaptic marker |
| Strain, strain background (C. elegans) | mizSi3 | This study | UJ1133 | Punc-4c::TIR1 |
Additional files
Download links
A two-part list of links to download the article, or parts of the article, in various formats.
Downloads (link to download the article as PDF)
Open citations (links to open the citations from this article in various online reference manager services)
Cite this article (links to download the citations from this article in formats compatible with various reference manager tools)
Sustained expression of unc-4 homeobox gene and unc-37/Groucho in postmitotic neurons specifies the spatial organization of the cholinergic synapses in C. elegans
eLife 10:e66011.
https://doi.org/10.7554/eLife.66011


