Neural mechanisms of modulations of empathy and altruism by beliefs of others’ pain
- School of Psychological and Cognitive Sciences, PKU-IDG/MGovern Institute for Brain Research, Beijing Key Laboratory of Behavior and Mental Health, Peking University, China
Figures
Figure 1
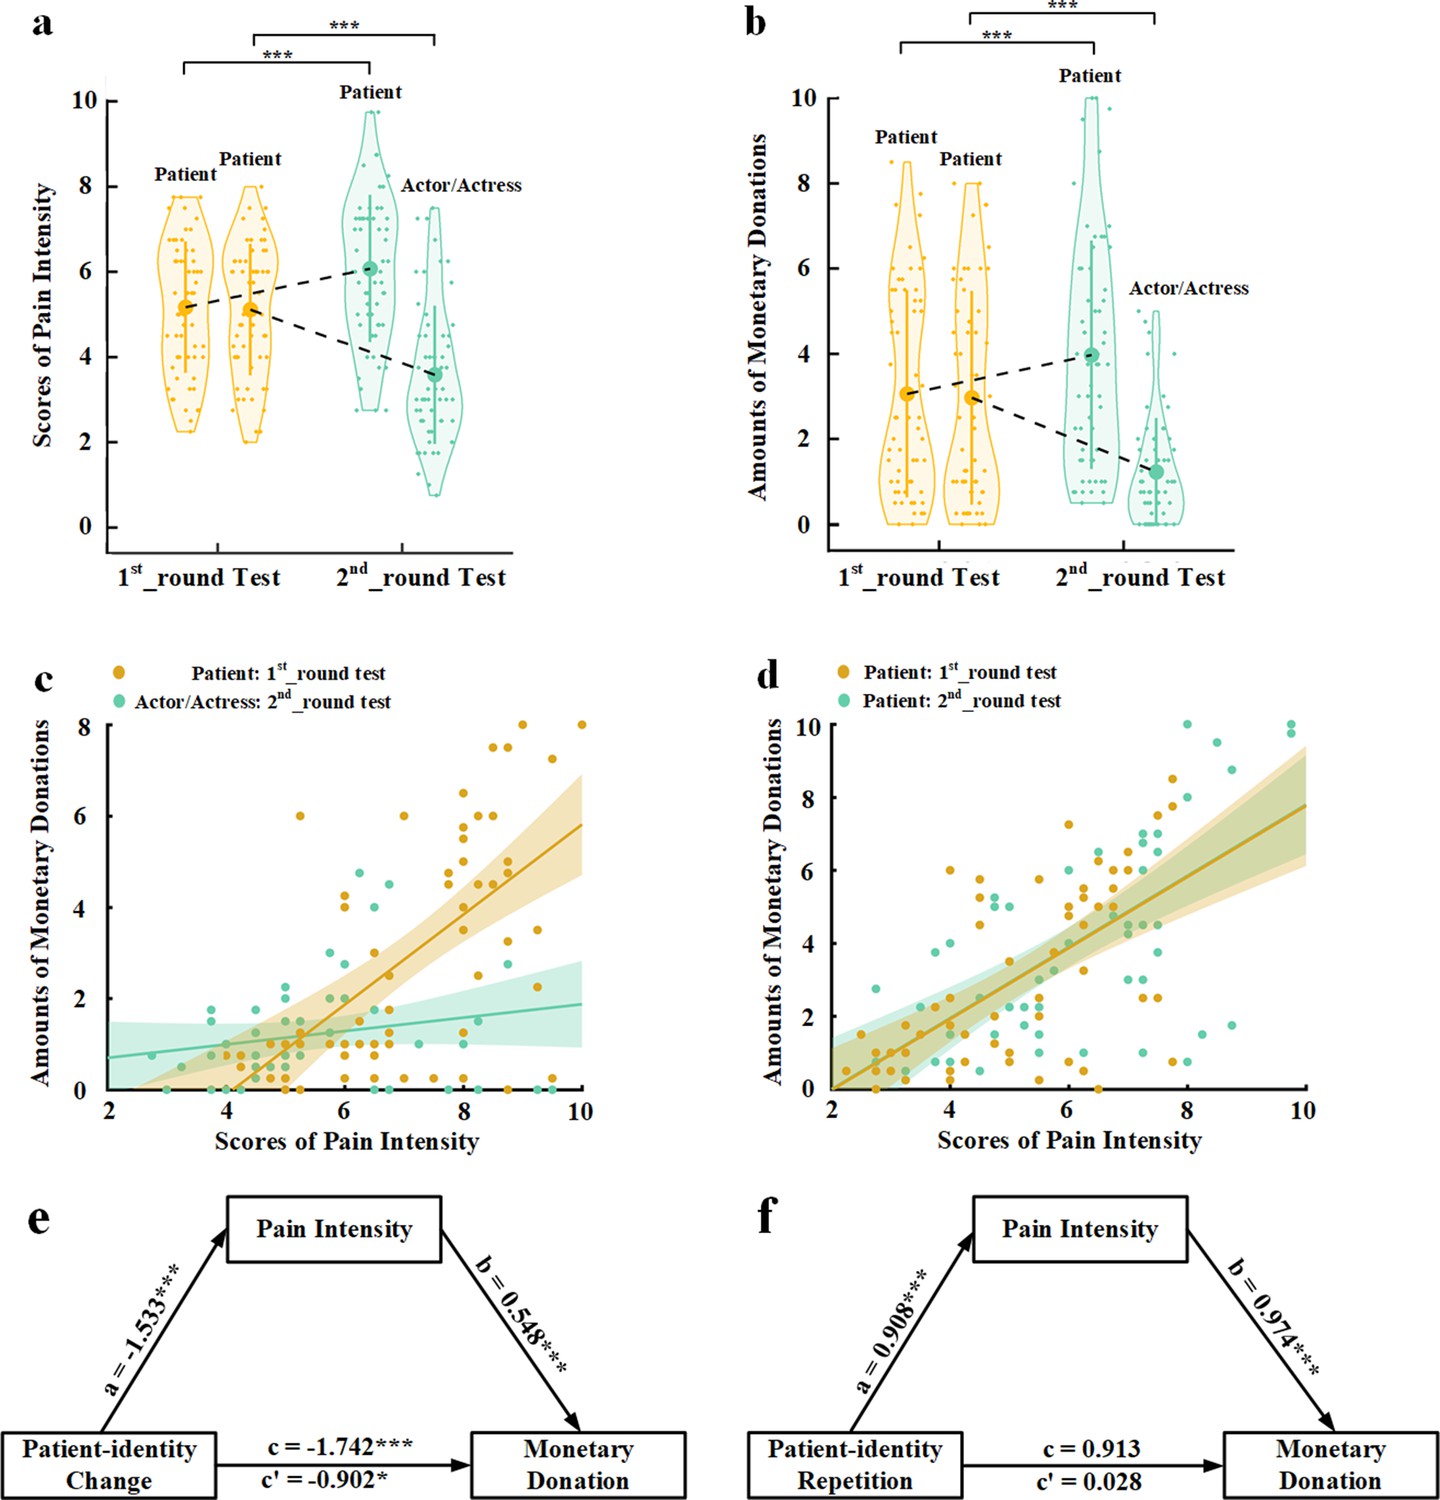
Behavioral results in Experiment 1.
(a) Mean rating scores of pain intensity in the 1st_round and 2nd_round tests. (b) Mean amounts of monetary donations in the 1st_round and 2nd_round tests. Shown are group means (large dots), standard deviation (bars), measures of each individual participant (small dots), and distribution (violin shape) in (a) and (b). (c) The associations between rating scores of pain intensity and amounts of monetary donations for patients in the 1st_round test and for actors/actresses in the 2nd_round test. (d) The associations between rating scores of pain intensity and amounts of monetary donations for patients in both the 1st_round and 2nd_round tests. (e) Rating scores of pain intensity partially mediate the relationship between patient-identity change and reduced monetary donations. (f) Rating scores of pain intensity mediate the relationship between patient-identity repetition and increased monetary donations.
-
Figure 1—source data 1
Pain intensity rating scores.
- https://cdn.elifesciences.org/articles/66043/elife-66043-fig1-data1-v3.csv
-
Figure 1—source data 2
Amounts of monetary donations.
- https://cdn.elifesciences.org/articles/66043/elife-66043-fig1-data2-v3.csv
Figure 2

Behavioral results in Experiment 2.
The relationships between intrinsic BOP (indexed by the rating score of effective medical treatments) and scores of pain intensity (a), own unpleasantness (b), and monetary donations (c), respectively, across the 16 models in the 1st_round test in each participant. The regression line of each participant is plotted in (a–c). (d–f) Mean rating scores of pain intensity, own unpleasantness, and monetary donations in the 1st_round and 2nd_round tests. (g) The associations between rating scores of pain intensity and amounts of monetary donations for patients in the 1st_round test and for 100% effective patients in the 2nd_round test across all the participants. (h) The associations between rating scores of own unpleasantness and amounts of monetary donations for patients in the 1st_round test and for 100% effective patients in the 2nd_round test across all the participants. (i) The associations between rating scores of pain intensity and amounts of monetary donations for patients in the 1st_round test and for 0% effective patients in the 2nd_round test across all the participants. (j) The associations between rating scores of own unpleasantness and amounts of monetary donations for patients in the 1st_round test and for 0% effective patients in the 2nd_round test across all the participants. (k) Rating scores of pain intensity change partially mediate the relationship between decreased BOP and changes in monetary donations. (l) Rating scores of pain intensity change fail to mediate the relationship between enhanced BOP and changes in monetary donations. Shown are group means (large dots), standard deviation (bars), measures of each individual participant (small dots), and distribution (violin shape) in (d–f). BOP, beliefs of others’ pain.
-
Figure 2—source data 1
Pain intensity rating scores.
- https://cdn.elifesciences.org/articles/66043/elife-66043-fig2-data1-v3.csv
-
Figure 2—source data 2
Own unpleasantness rating scores.
- https://cdn.elifesciences.org/articles/66043/elife-66043-fig2-data2-v3.csv
-
Figure 2—source data 3
Amounts of monetary donations.
- https://cdn.elifesciences.org/articles/66043/elife-66043-fig2-data3-v3.csv
Figure 3
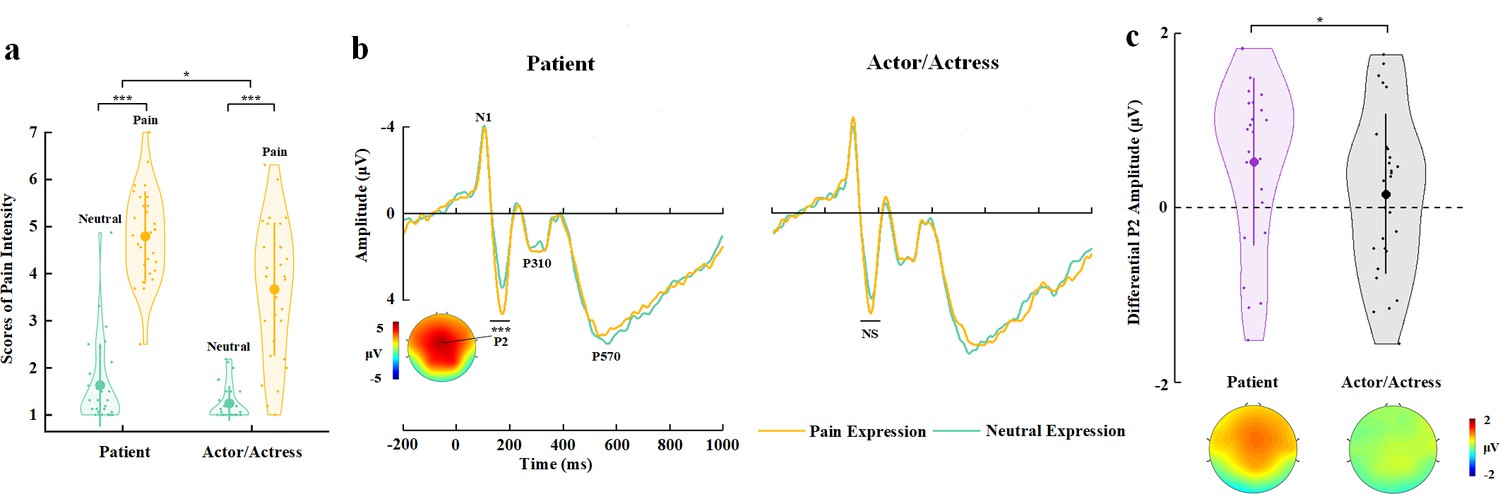
EEG results of Experiment 3.
(a) Mean rating scores of pain intensity to pain versus neutral expressions of faces with patient or actor/actress identities. (b) ERPs to faces with patient or actor/actress identities at frontal electrodes. The voltage topography shows the scalp distribution of the P2 amplitude with the maximum over the central/frontal region. (c) Mean differential P2 amplitudes to pain versus neutral expressions of faces with patient or actor/actress identities. The voltage topographies illustrate the scalp distribution of the P2 difference waves to pain versus neutral expressions of faces with patient or actor/actress identities, respectively. Shown are group means (large dots), standard deviation (bars), measures of each individual participant (small dots), and distribution (violin shape) in (a) and (c). EEG, electroencephalography; ERP, event-related potential.
-
Figure 3—source data 1
Pain intensity rating scores.
- https://cdn.elifesciences.org/articles/66043/elife-66043-fig3-data1-v3.csv
-
Figure 3—source data 2
Mean differential P2 amplitudes.
- https://cdn.elifesciences.org/articles/66043/elife-66043-fig3-data2-v3.csv
Figure 4
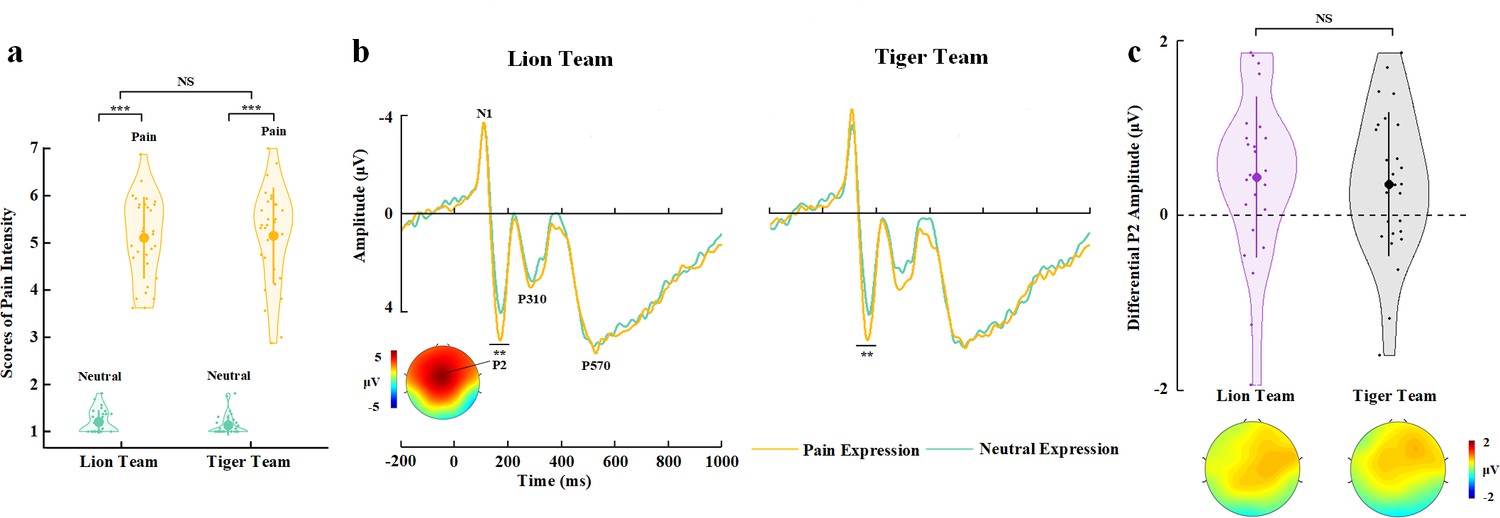
EEG results of Experiment 4.
(a) Mean rating scores of pain intensity to pain versus neutral expressions of faces with Lion or Tiger team identities. (b) ERPs to faces with Lion/Tiger team identities at frontal electrodes. The voltage topography shows the scalp distribution of the P2 amplitude with the maximum over the central/frontal region. (c) Mean differential P2 amplitudes to pain versus neutral expressions of faces with Lion/Tiger team identities. The voltage topographies illustrate the scalp distribution of the P2 difference waves to pain versus neutral expressions of faces with the Lion/Tiger team identities, respectively. Shown are group means (large dots), standard deviation (bars), measures of each individual participant (small dots), and distribution (violin shape) in (a) and (c). EEG, electroencephalography; ERP, event-related potential.
-
Figure 4—source data 1
Pain intensity rating scores.
- https://cdn.elifesciences.org/articles/66043/elife-66043-fig4-data1-v3.csv
-
Figure 4—source data 2
Mean differential P2 amplitudes.
- https://cdn.elifesciences.org/articles/66043/elife-66043-fig4-data2-v3.csv
Figure 5
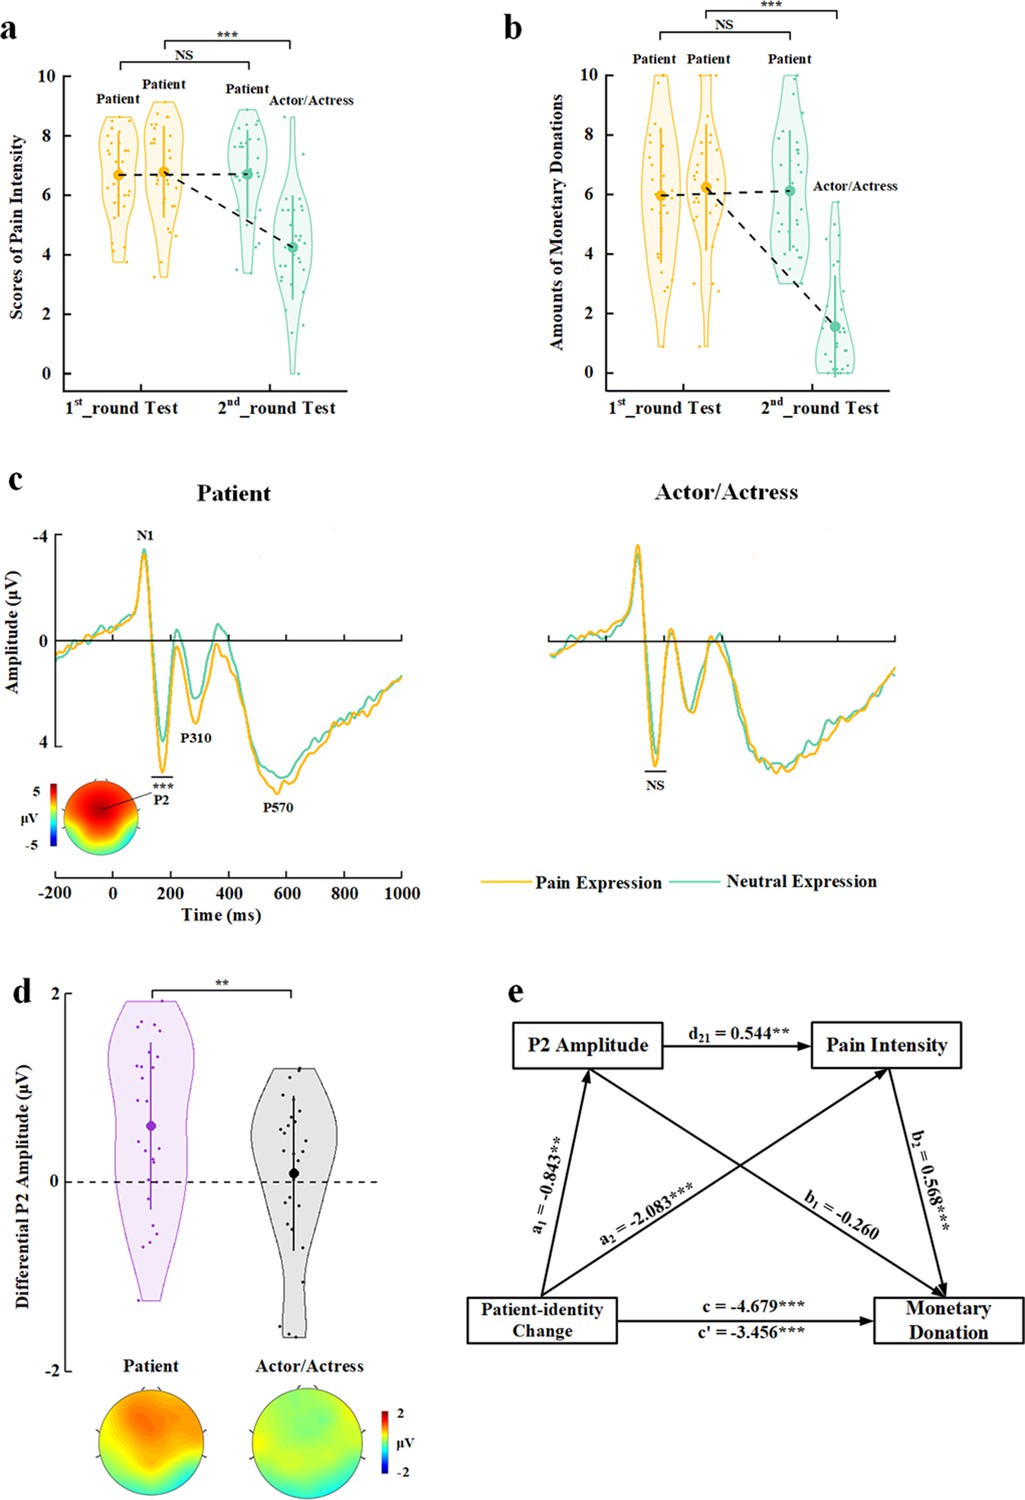
Behavioral and EEG results of Experiment 5.
(a) Mean rating scores of pain intensity in the 1st_round and 2nd_round tests. (b) Mean amounts of monetary donations in the 1st_round and 2nd_round tests. (c) ERPs to faces with patient or actor/actress identities at frontal electrodes. The voltage topography shows the scalp distribution of the P2 amplitude with the maximum over the central/frontal region. (d) Mean differential P2 amplitudes to pain versus neutral expressions of faces with patient or actor/actress identities. The voltage topographies illustrate the scalp distribution of the P2 difference waves to pain versus neutral expressions of faces with patient or actor/actress identities, respectively. (e) Illustration of the serial mediation model of the relationship between decreased BOP and changes in monetary donations. Shown are group means (large dots), standard deviation (bars), measures of each individual participant (small dots), and distribution (violin shape) in (a), (b), and (d). BOP, beliefs of others’ pain; EEG, electroencephalography; ERP, event-related potential.
-
Figure 5—source data 1
Pain intensity rating scores.
- https://cdn.elifesciences.org/articles/66043/elife-66043-fig5-data1-v3.csv
-
Figure 5—source data 2
Amounts of monetary donations.
- https://cdn.elifesciences.org/articles/66043/elife-66043-fig5-data2-v3.csv
-
Figure 5—source data 3
Mean differential P2 amplitudes.
- https://cdn.elifesciences.org/articles/66043/elife-66043-fig5-data3-v3.csv
Figure 6
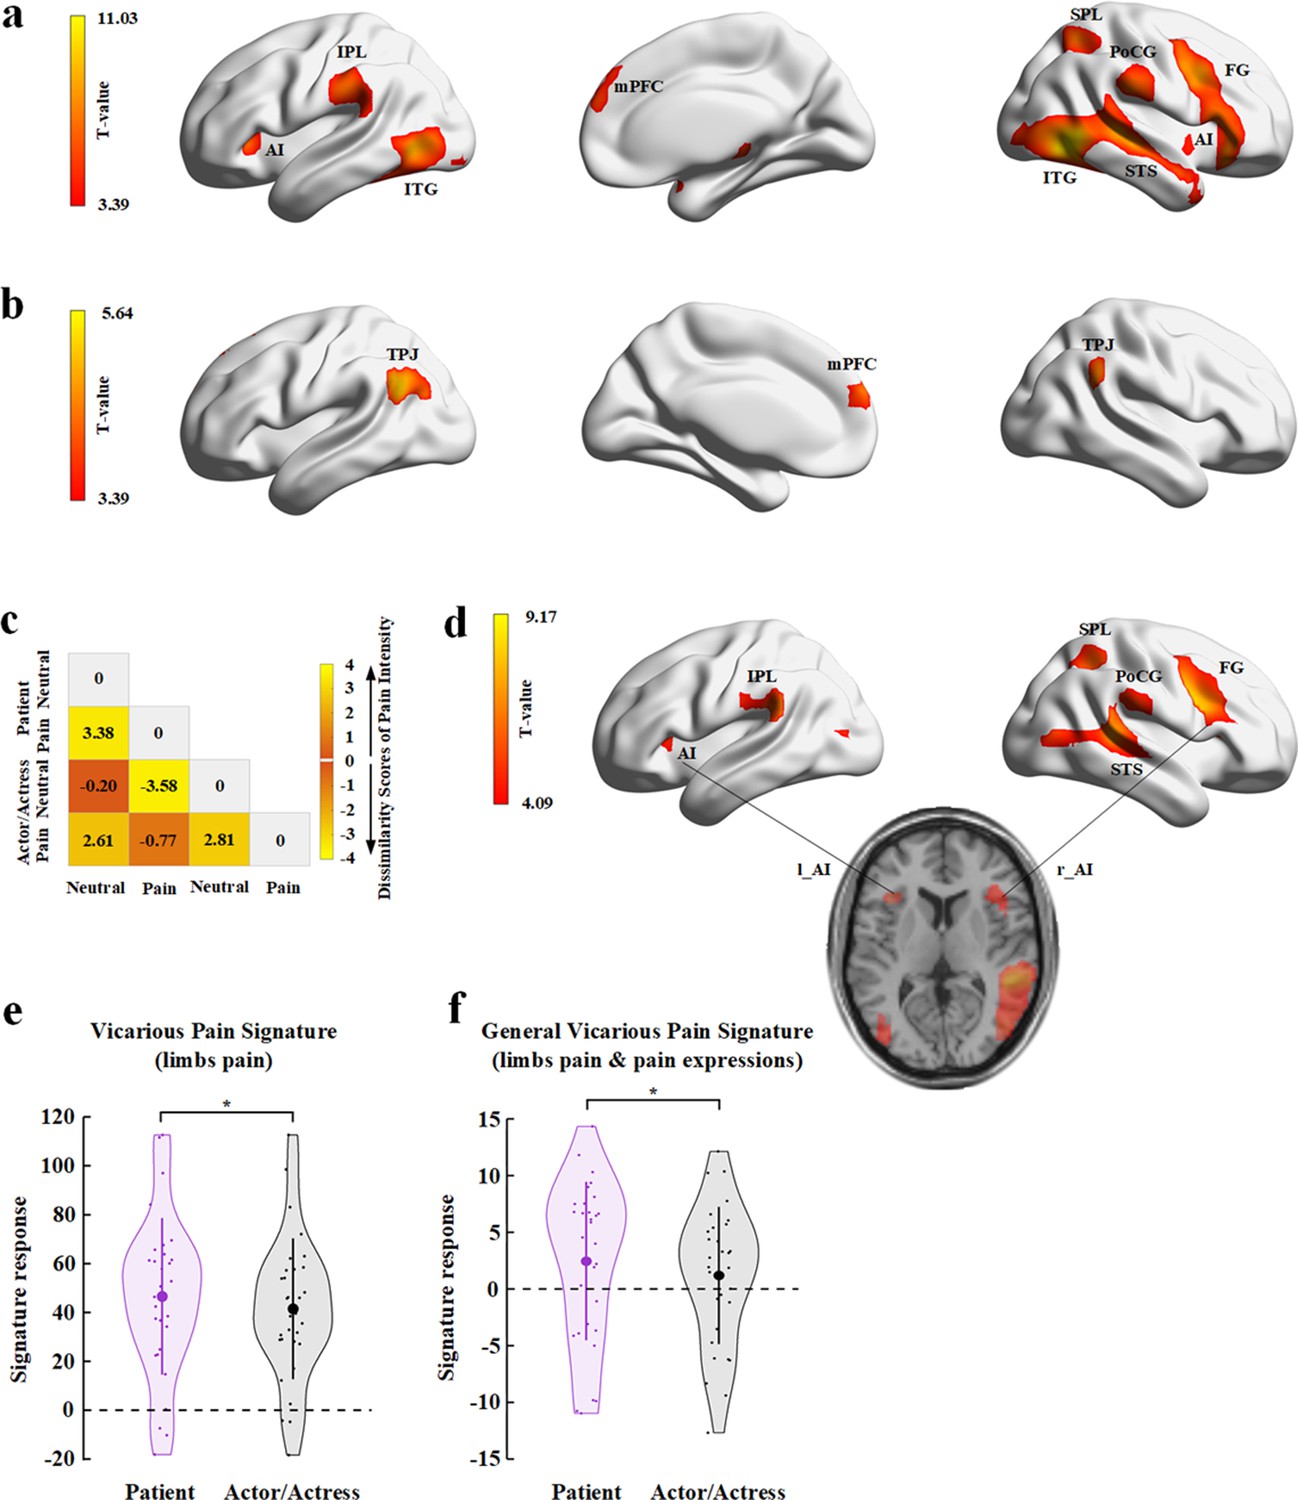
fMRI results of Experiment 6.
(a) Brain activations in response to perceived painful (vs. non-painful) stimuli applied to targets (collapsed faces with patient and actor/actress identities). (b) Brain activations in response to non-painful stimuli to patients compared to actors/actresses. (c) Illustration of the behavioral dissimilarity matrix (DM) derived from the rating scores of pain intensity across all participants. Each cell in the DM represents the mean difference in rating scores of pain intensity between each pair of conditions. (d) Brain activations that were correlated with the behavioral DM revealed in the searchlight RSA. (e) Illustration of the vicarious pain signature (defined by response to perceived noxious stimulation of body limbs) responses to patients’ and to actors/actresses’ pain. (f) Illustration of the general vicarious signature (defined by response to perceived noxious stimulation of body limbs and painful facial expressions) responses to patients’ and actors/actresses’ pain. AI, anterior insula; FG, frontal gyrus; IPL, inferior parietal lobe; ITG, inferior temporal gyrus; MFC, middle frontal cortex; mPFC, medial prefrontal cortex; PoCG, post-central gyrus; RSA, representational similarity analysis; SPL, superior parietal lobe; STS, superior temporal sulcus; TPJ, temporoparietal junction.
-
Figure 6—source data 1
Brain activations in response to painful vs. non-painful stimuli (collapsed faces with patient and actor/actress identities).
- https://cdn.elifesciences.org/articles/66043/elife-66043-fig6-data1-v3.zip
-
Figure 6—source data 2
Brain activations in response to non-painful stimuli to patients compared to actors/actresses.
- https://cdn.elifesciences.org/articles/66043/elife-66043-fig6-data2-v3.zip
-
Figure 6—source data 3
Behavioral dissimilarity matrix derived from the rating scores of pain intensity across all participants.
- https://cdn.elifesciences.org/articles/66043/elife-66043-fig6-data3-v3.mat
-
Figure 6—source data 4
Brain activations that were correlated with the behavioral dissimilarity matrix revealed in the searchlight RSA.
- https://cdn.elifesciences.org/articles/66043/elife-66043-fig6-data4-v3.zip
-
Figure 6—source data 5
Data of the vicarious pain signature.
- https://cdn.elifesciences.org/articles/66043/elife-66043-fig6-data5-v3.csv
-
Figure 6—source data 6
Data of the general vicarious pain signature.
- https://cdn.elifesciences.org/articles/66043/elife-66043-fig6-data6-v3.csv
Appendix 1—figure 1

EEG results of the additional experiment.
(a) Mean rating scores of happy intensity related to happy and neutral expressions of faces with awardee or actor/actress identities. (b) ERPs to faces with awardee or actor/actress identities at frontal electrodes. The voltage topography shows the scalp distribution of the P570 amplitude with the maximum over the central/parietal region. (c) Mean differential P570 amplitudes to happy versus neutral expressions of faces with awardee or actor/actress identities. The voltage topographies illustrate the scalp distribution of the P570 difference waves to happy (vs. neutral) expressions of faces with awardee or actor/actress identities, respectively. Shown are group means (large dots), standard deviation (bars), measures of each individual participant (small dots), and distribution (violin shape) in (a) and (c). EEG, electroencephalography; ERP, event-related potential.
-
Appendix 1—figure 1—source data 1
Happy intensity rating scores and Mean differential P570 amplitudes.
- https://cdn.elifesciences.org/articles/66043/elife-66043-app1-fig1-data1-v3.xlsx
Tables
Appendix 1—table 1
RTs, accuracies, rating scores, numbers of ERP trials, and ERP amplitudes (mean±SD) in the additional experiment.
| Awardee | Actor/Actress | ||||||
|---|---|---|---|---|---|---|---|
| Neutral | Happy | Neutral | Happy | ||||
| RT (ms) | 654±63 | 657±60 | 666±64 | 680±66 | |||
| Accuracy (%) | 92±4.9 | 90±7.5 | 92±5.4 | 88±8.7 | |||
| Happy intensity | 2.525±0.94 | 5.638±0.64 | 2.146±0.94 | 4.95±0.96 | |||
| N1 amplitude (μV) | −2.267±1.69 | −2.606±1.75 | −2.297±1.43 | −2.620±1.52 | |||
| P2 amplitude (μV) | 2.544±2.64 | 2.375±2.30 | 2.940±2.56 | 2.593±2.56 | |||
| P310 amplitude (μV) | 3.449±3.45 | 3.445±3.30 | 3.492±3.38 | 3.376±3.38 | |||
| P570 amplitude (μV) | 4.677±2.22 | 5.379±2.15 | 4.696±2.16 | 4.950±2.11 | |||
| ERP trials | 114±10 | 110±13 | 113±11 | 108±12 | |||
| Statistic value | ANOVA | Simple effect (Identity) | |||||
| Value | Identity | Expression | Identity*Expression | Awardee | Actor/Actress | ||
| RT (ms) | F | 13.229 | 11.256 | 4.733 0.7 | 0.915 | 13.230 | |
| p | 0.001 | 0.002 | 0.038 | 0.347 | 0.001 | ||
| ηp2 | 0.313 | 0.280 | 0.140 | 0.031 | 0.313 | ||
| 90% CI | (0.094, 0.488) | (0.071, 0.459) | (0.004, 0.326) | (0, 0.180) | (0.094, 0.488) | ||
| Accuracy (%) | F | 0.496 | 40.590 | 0.595 | |||
| p | 0.487 | <0.001 | 0.447 | ||||
| ηp2 | 0.017 | 0.583 | 0.020 | ||||
| 90% CI | (0, 0.150) | (0.362, 0.698) | (0, 0.158) | ||||
| Happy Intensity | F | 19.512 | 422.774 | 6.610 | 433.364 | 302.128 | |
| p | <0.001 | <0.001 | 0.016 | <0.001 | <0.001 | ||
| ηp2 | 0.402 | 0.936 | 0.186 | 0.937 | 0.912 | ||
| 90% CI | (0.166, 0.560) | (0.889, 0.953) | (0.021, 0.372) | (0.892, 0.955) | (0.849, 0.937) | ||
| N1 (95–115 ms) | F | 0.031 | 9.890 | 0.005 | |||
| p | 0.862 | 0.004 | 0.944 | ||||
| ηp2 | 0.001 | 0.254 | 0.0002 | ||||
| 90% CI | (0, 0.041) | (0.055, 0.436) | (0, 0.007) | ||||
| P2 (175–195 ms) | F | 6.476 | 2.822 | 0.441 | |||
| p | 0.017 | 0.104 | 0.512 | ||||
| ηp2 | 0.183 | 0.089 | 0.015 | ||||
| 90% CI | (0.019, 0.369) | (0, 0.266) | (0, 0.145) | ||||
| P310 (280–340 ms) | F | 0.012 | 0.140 | 0.252 | |||
| p | 0.913 | 0.711 | 0.619 | ||||
| ηp2 | 0.0004 | 0.005 | 0.009 | ||||
| 90% CI | (0, 0.017) | (0, 0.106) | (0, 0.125) | ||||
| P570 (500–700 ms) | F | 1.948 | 20.752 | 4.832 | 20.880 | 3.375 | |
| p | 0.173 | <0.001 | 0.036 | <0.001 | 0.076 | ||
| ηp2 | 0.063 | 0.417 | 0.143 | 0.419 | 0.104 | ||
| 90% CI | (0, 0.232) | (0.180, 0.572) | (0.005, 0.328) | (0.181, 0.573) | (0, 0.285) | ||
-
Note: Effect size is indexed as the partial eta-squared value. The 90% CIs are reported for partial eta-squared value.
Additional files
-
Source code 1
Scripts for plotting Figures 1a, b, 2d, e, f, 3a, 4a, 5a and b.
- https://cdn.elifesciences.org/articles/66043/elife-66043-code1-v3.zip
-
Source code 2
Scripts for plotting Figures 3c, 4c and 5d.
- https://cdn.elifesciences.org/articles/66043/elife-66043-code2-v3.zip
-
Source code 3
Scripts for the whole-brain analysis in Figure 6a and b.
- https://cdn.elifesciences.org/articles/66043/elife-66043-code3-v3.zip
-
Source code 4
Scripts for plotting Figure 6c.
- https://cdn.elifesciences.org/articles/66043/elife-66043-code4-v3.zip
-
Source code 5
Scripts for plotting Figure 6d.
- https://cdn.elifesciences.org/articles/66043/elife-66043-code5-v3.zip
-
Supplementary file 1
Statistical results of the mediation analysis (pain intensity mediated the relationship between decreased BOP and monetary donations) in Experiment 1.
- https://cdn.elifesciences.org/articles/66043/elife-66043-supp1-v3.docx
-
Supplementary file 2
Statistical results of the mediation analysis (pain intensity mediated the relationship between enhanced BOP and monetary donations) in Experiment 1.
- https://cdn.elifesciences.org/articles/66043/elife-66043-supp2-v3.docx
-
Supplementary file 3
Pain intensity, unpleasantness, and monetary donation (mean±SD) in Experiment 2.
- https://cdn.elifesciences.org/articles/66043/elife-66043-supp3-v3.docx
-
Supplementary file 4
Statistical results of the mediation analysis (pain intensity mediated the relationship between decreased BOP and monetary donations) in Experiment 2.
- https://cdn.elifesciences.org/articles/66043/elife-66043-supp4-v3.docx
-
Supplementary file 5
Statistical results of the mediation analysis (pain intensity mediated the relationship between enhanced BOP and monetary donations) in Experiment 2.
- https://cdn.elifesciences.org/articles/66043/elife-66043-supp5-v3.docx
-
Supplementary file 6
Statistical results of the mediation analysis (unpleasantness mediated the relationship between decreased BOP and monetary donations) in Experiment 2.
- https://cdn.elifesciences.org/articles/66043/elife-66043-supp6-v3.docx
-
Supplementary file 7
Statistical results of the mediation analysis (unpleasantness mediated the relationship between enhanced BOP and monetary donations) in Experiment 2.
- https://cdn.elifesciences.org/articles/66043/elife-66043-supp7-v3.docx
-
Supplementary file 8
Statistical results of reaction times, accuracies, and rating scores (mean±SD) in Experiment 3.
- https://cdn.elifesciences.org/articles/66043/elife-66043-supp8-v3.docx
-
Supplementary file 9
Statistical results of mean ERP amplitudes (mean±SD) in Experiment 3.
- https://cdn.elifesciences.org/articles/66043/elife-66043-supp9-v3.docx
-
Supplementary file 10
Statistical results of reaction times, accuracies, and rating scores (mean±SD) in Experiment 4.
- https://cdn.elifesciences.org/articles/66043/elife-66043-supp10-v3.docx
-
Supplementary file 11
Statistical results of mean ERP amplitudes (mean±SD) in Experiment 4.
- https://cdn.elifesciences.org/articles/66043/elife-66043-supp11-v3.docx
-
Supplementary file 12
Statistical results of reaction times, accuracies, and mean ERP amplitudes (mean±SD) in Experiment 5.
- https://cdn.elifesciences.org/articles/66043/elife-66043-supp12-v3.docx
-
Supplementary file 13
Results of the serial mediation analysis in Experiment 5.
- https://cdn.elifesciences.org/articles/66043/elife-66043-supp13-v3.docx
-
Supplementary file 14
Statistical results of reaction times, accuracies and rating scores (mean±SD) in Experiment 6.
- https://cdn.elifesciences.org/articles/66043/elife-66043-supp14-v3.docx
-
Supplementary file 15
Number of ERP trials for analyses (mean±SD) in Experiments 3–5.
- https://cdn.elifesciences.org/articles/66043/elife-66043-supp15-v3.docx
-
Transparent reporting form
- https://cdn.elifesciences.org/articles/66043/elife-66043-transrepform-v3.docx
-
Appendix 1—figure 1—source data 1
Happy intensity rating scores and Mean differential P570 amplitudes.
- https://cdn.elifesciences.org/articles/66043/elife-66043-app1-fig1-data1-v3.xlsx
Download links
A two-part list of links to download the article, or parts of the article, in various formats.
Downloads (link to download the article as PDF)
Open citations (links to open the citations from this article in various online reference manager services)
Cite this article (links to download the citations from this article in formats compatible with various reference manager tools)
Neural mechanisms of modulations of empathy and altruism by beliefs of others’ pain
eLife 10:e66043.
https://doi.org/10.7554/eLife.66043


