Mechanical stretch scales centriole number to apical area via Piezo1 in multiciliated cells
- Pediatric Genomics Discovery Program, Department of Pediatrics and Genetics, Yale University School of Medicine, United States
- Department of Cell and Developmental Biology, Feinberg School of Medicine, Northwestern University, United States
Figures
Figure 1 with 2 supplements
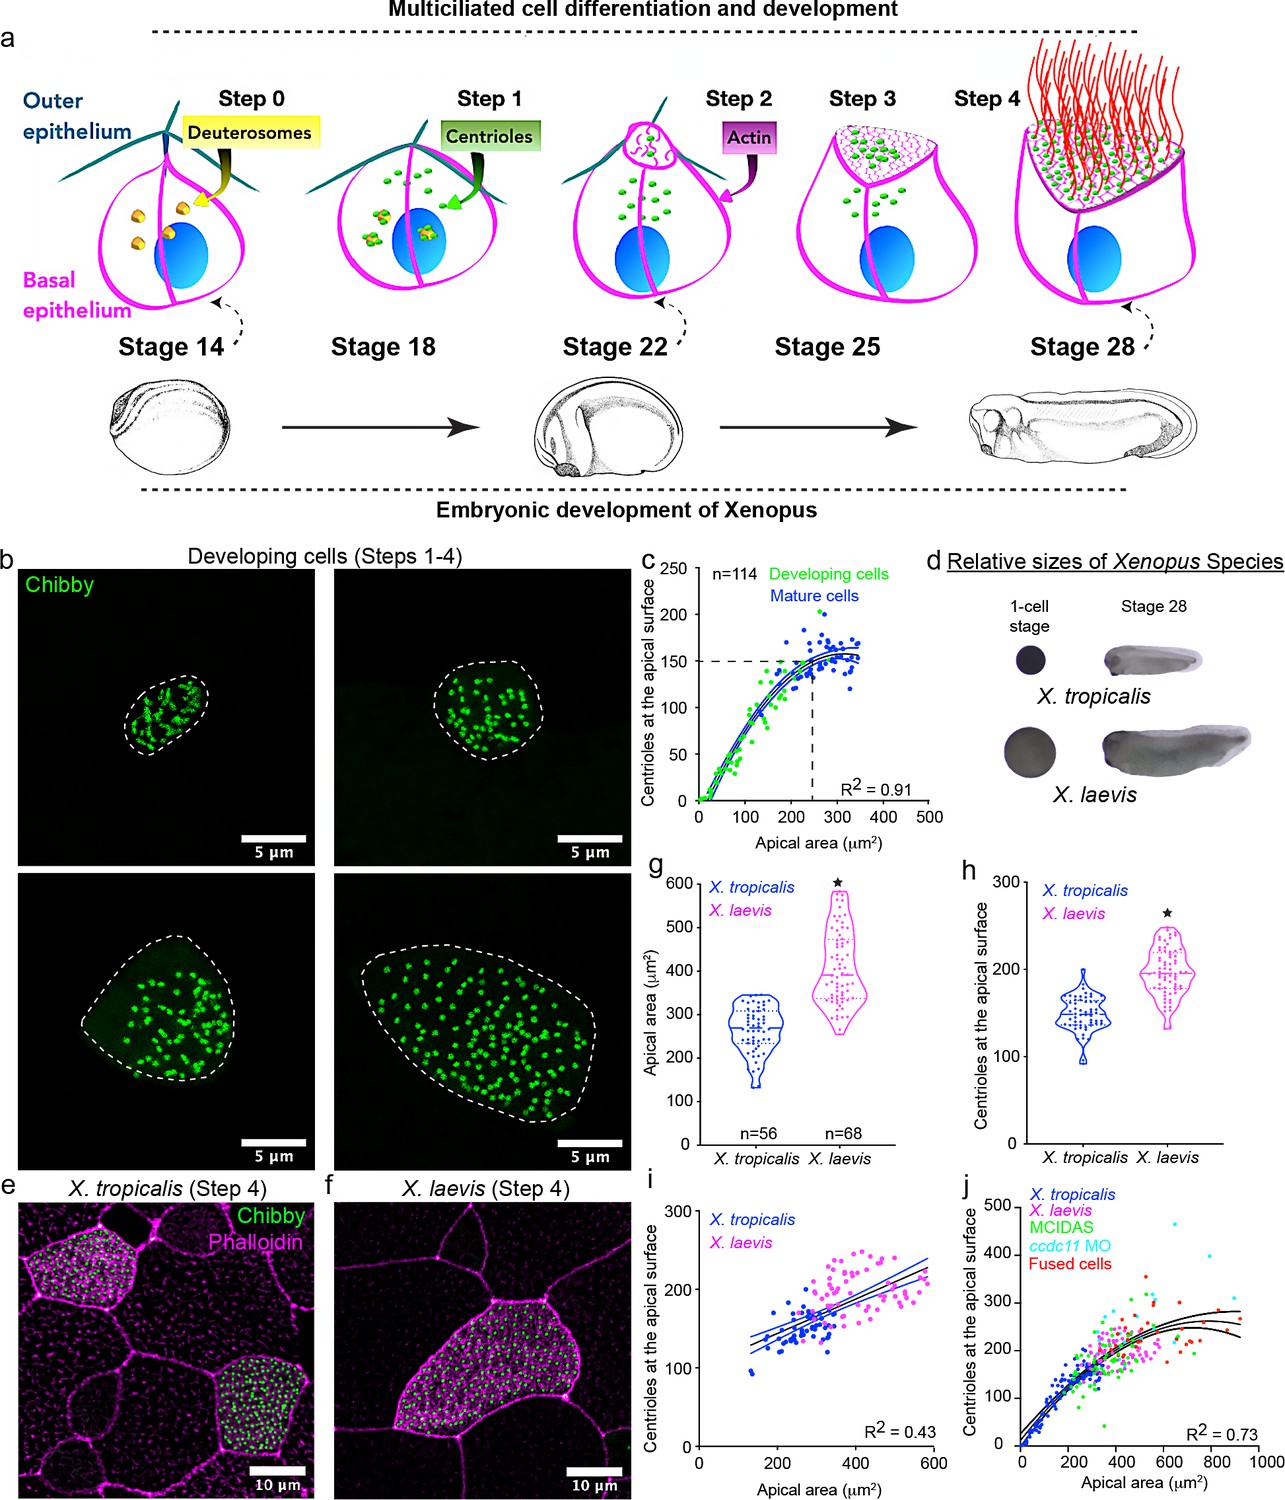
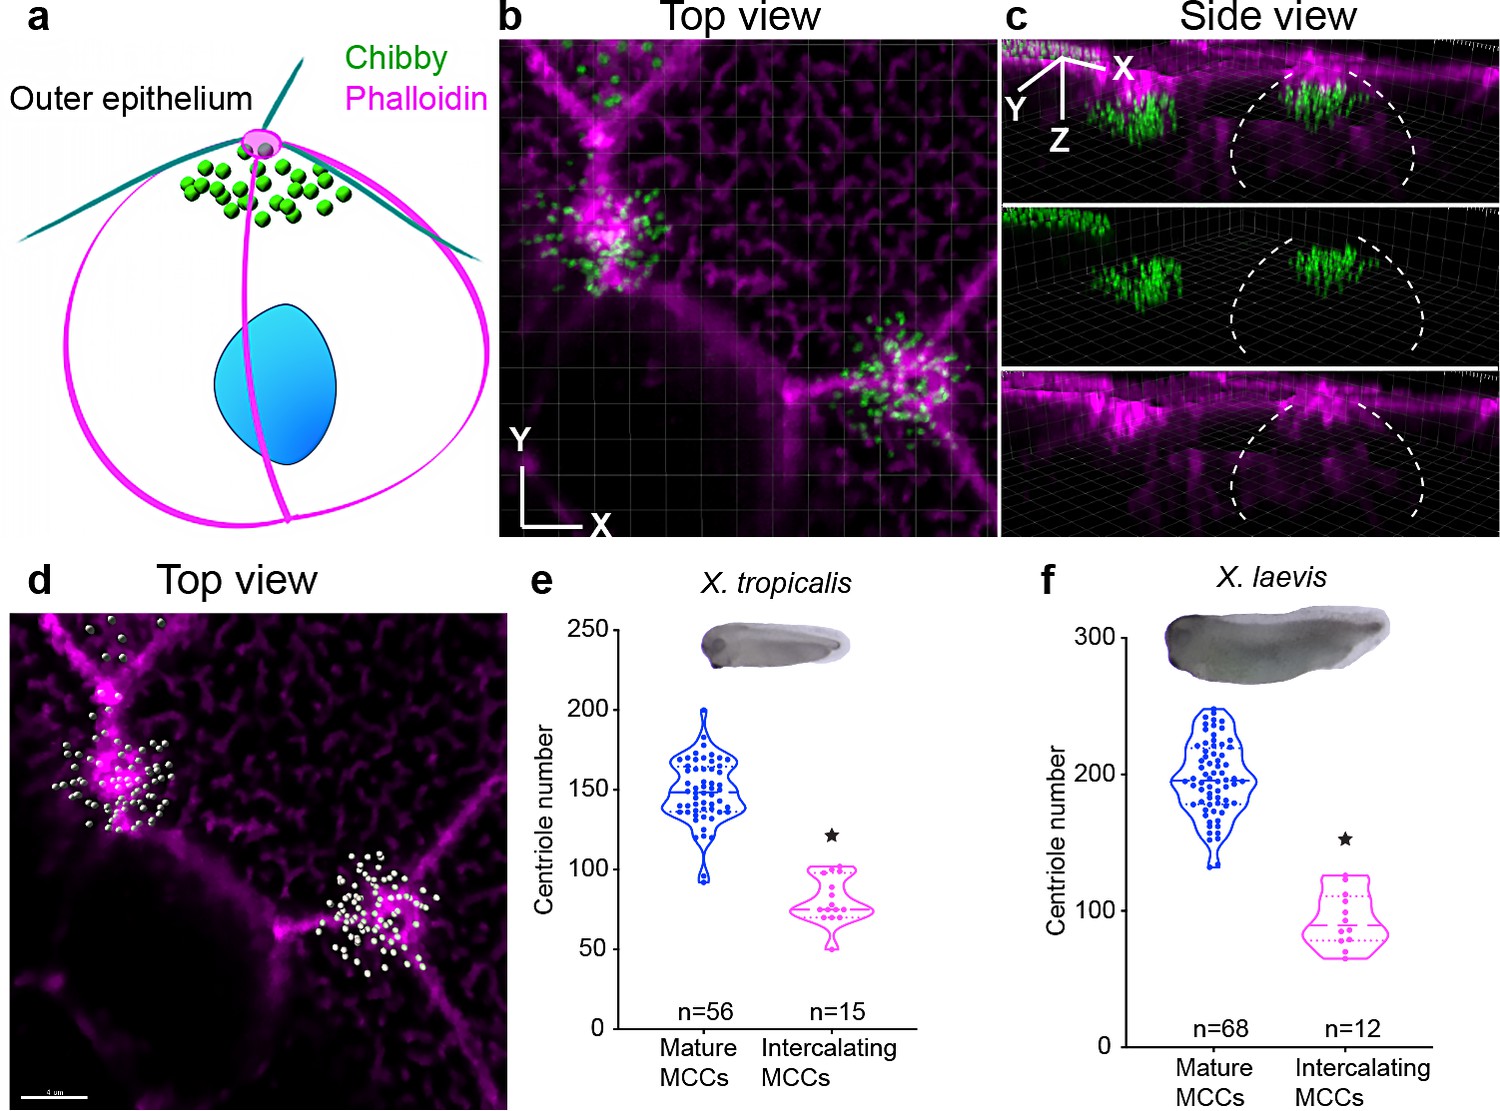
Centriole number scales with apical area in Xenopus MCCs.
(a) Schematic representing the current understanding of how MCCs differentiate and develop (Steps 0–4). Xenopus embryonic development is closely linked (dashed arrows) to MCC development. (b) MCCs captured in different stages of development (Steps 2–4) and labeled with chibby-GFP (centrioles). Dotted line represents the cell boundary. (c) Regression plot showing the positive correlation between apical area and number of centrioles at the apical surface in developing (green, Step 2, 3) and mature MCCs (blue, Step 4). (d) One-cell stage and stage 28 embryos of Xenopus tropicalis and Xenopus laevis. Images are to scale. Mature (Step 4) epidermal MCCs marked with chibby-GFP (centrioles) and phalloidin (F-actin) of (e) X. tropicalis and (f) X. laevis embryos at stage 28. Quantitation of (g) apical area and (h) centriole number in MCCs of X. tropicalis and X. laevis. The statistical comparison between the treatments is done using an unpaired t test. (i) Regression plot showing the positive correlation between apical area and centriole number across species in mature MCCs. (j) Regression plot showing the scaling relationship exists over a 40-fold change in apical area among different treatments. R2 is the correlation coefficient. * indicates statistical significance at p < 0.05. n = number of cells from 15 to 25 embryos. The data is uploaded as source data 1.
-
Figure 1—source data 1
Source data related to Figure 1 .
- https://cdn.elifesciences.org/articles/66076/elife-66076-fig1-data1-v2.xlsx
Figure 1—figure supplement 1
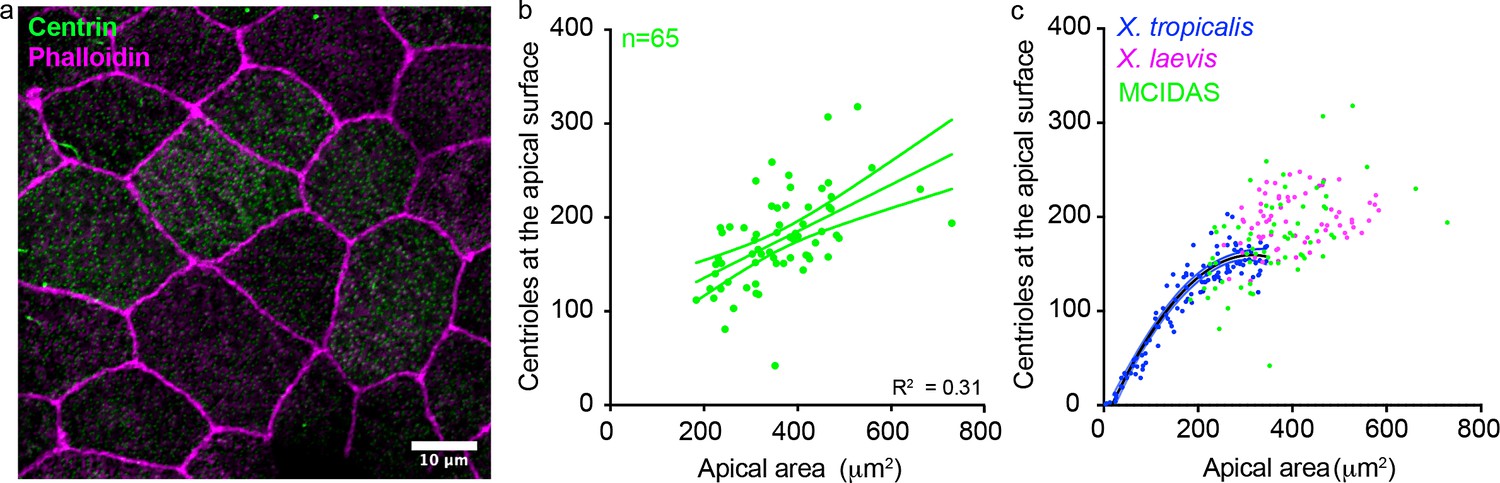
Relation between centriole number and apical area in goblet cells converted to MCCs in Xenopus laevis.
(a) MCCs marked with centrin-GFP (centrioles, green), and phalloidin (F-actin, magenta) in Xenopus laevis. (b) Regression plot showing the relation between apical area and centriole number in MCCs induced by overexpressing mcidas in X. laevis embryos and (c) comparison to control X. laevis and X. tropicalis embryos. n = number of cells collected from five embryos. The data is uploaded as source data 1.
Figure 1—figure supplement 2
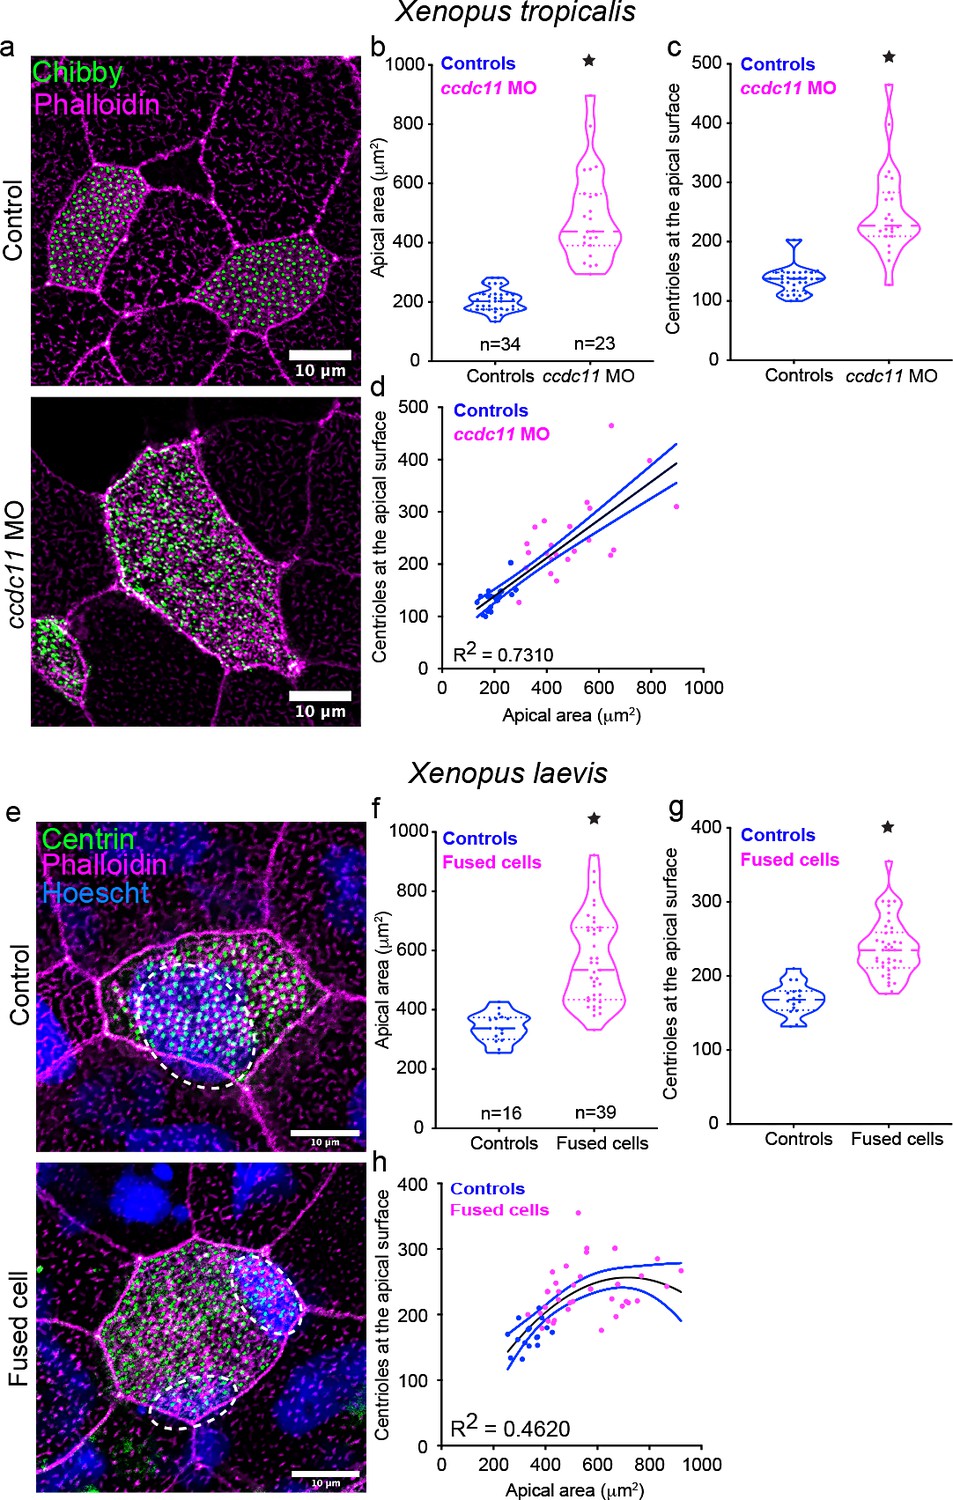
Increasing apical area leads to an increase in centriole number.
(a) Mature (Step 4) epidermal MCCs marked with chibby-GFP (centrioles, green) and phalloidin (F-actin, magenta) in control and ccdc11 morphant embryos at Stage 28. Quantitation of (b) apical area and (c) centriole number in MCCs of control and ccdc11 morphant embryos. (d) Regression plot showing the positive correlation between apical area and centriole number. (e) Control and epidermal MCC fused with a neighboring cell marked with chibby (centrioles, green) and phalloidin (F-actin, magenta). Dashed circles indicate nuclei (Hoescht). Quantitation of (f) apical area and (g) centriole number in MCCs of control and fused MCCs. (h) Regression plot showing the positive correlation between apical area and centriole number. * indicates statistical significance at p < 0.05. The statistical comparison between the treatments (b, c, f, g) is done using an unpaired t test. R2 is the correlation coefficient. n = number of cells collected from 6 to 20 embryos. The data is uploaded as source data 1.
Figure 2
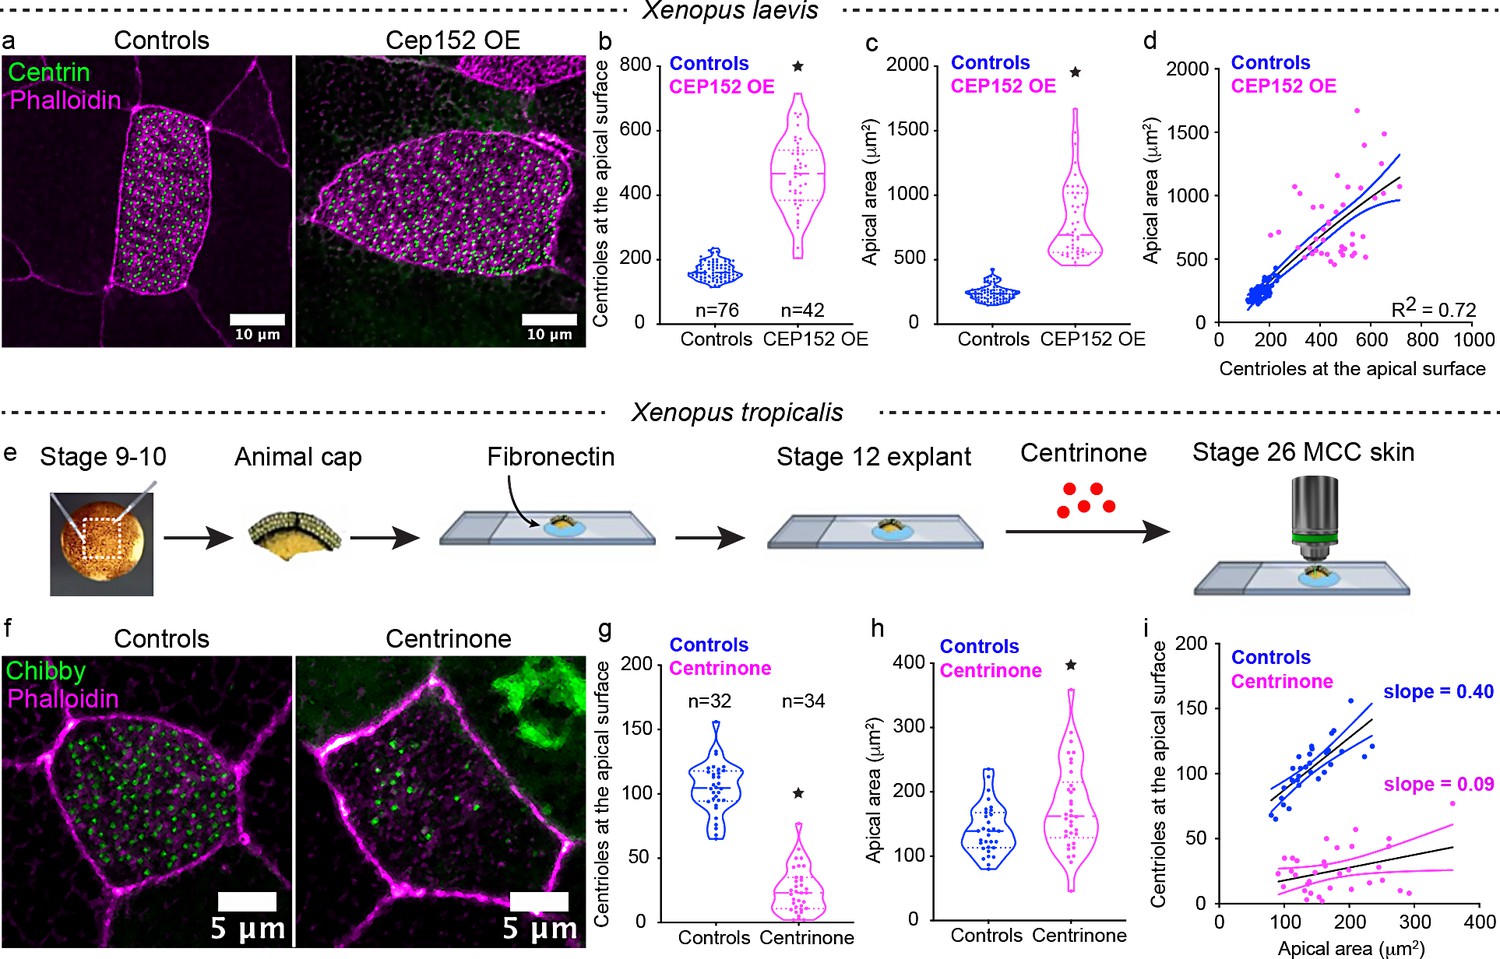
Perturbation of centriole amplification affects apical area contextually.
(a) Mature (Step 4) epidermal MCCs marked with chibby-GFP (centrioles, green), and phalloidin (F-actin, magenta) in control and Cep152 overexpressed (OE) embryos. Quantitation of (b) apical area and (c) centriole number in MCCs of control and CEP 152 OE embryos at stage 28. (d) Regression plot showing the positive correlation between apical area and centriole number. (e) Experimental design to block centriole amplification in MCCs using Centrinone in animal caps. We dissected the animal caps at stage 8–9 and tethered them to slides using fibronectin. At stage 14 (based on unmanipulated sibling embryos), we exposed the caps to Centrinone until their unmanipulated sibling embryos reached stage 25–26. (F) Epidermal MCCs marked with chibby-GFP (centrioles, green), and phalloidin (F-actin, magenta) in control and Centrinone-treated animal caps. Quantitation of (g) apical area and (h) centriole number in MCCs of control and Centrinone-treated animal caps. (i) Regression plot showing the loss of correlation between apical area and centriole number in Centrinone-treated MCCs. * indicates statistical significance at p < 0.05. The statistical comparison between the treatments (b, c, g, h) is done using an unpaired t test. R2 is the correlation coefficient. n = number of cells collected from 10 to 15 embryos. The data is uploaded as source data 2.
-
Figure 2—source data 1
Source data related to Figure 2.
- https://cdn.elifesciences.org/articles/66076/elife-66076-fig2-data1-v2.xlsx
Figure 3
MCCs synthesize about half the total number of centrioles during intercalation.
(a–c) Centrioles (chibby-GFP, green) and F-actin (phalloidin, magenta) in intercalating MCCs (Step 1). Dotted while lines show the border of the intercalating MCCs. (d) The same MCC is segmented using IMARIS to show individual centrioles in grey and F-actin in magenta. MCCs generate half of the total number of centrioles just prior to intercalation in (e) X. tropicalis and (f) X. laevis. * indicates statistical significance at p < 0.05. The statistical comparison between the treatments is done using an unpaired t test. n = number of cells from 10 to 15 embryos/species. The data is uploaded as source data 3.
-
Figure 3—source data 1
Source data related to Figure 3.
- https://cdn.elifesciences.org/articles/66076/elife-66076-fig3-data1-v2.xlsx
Figure 4 with 3 supplements
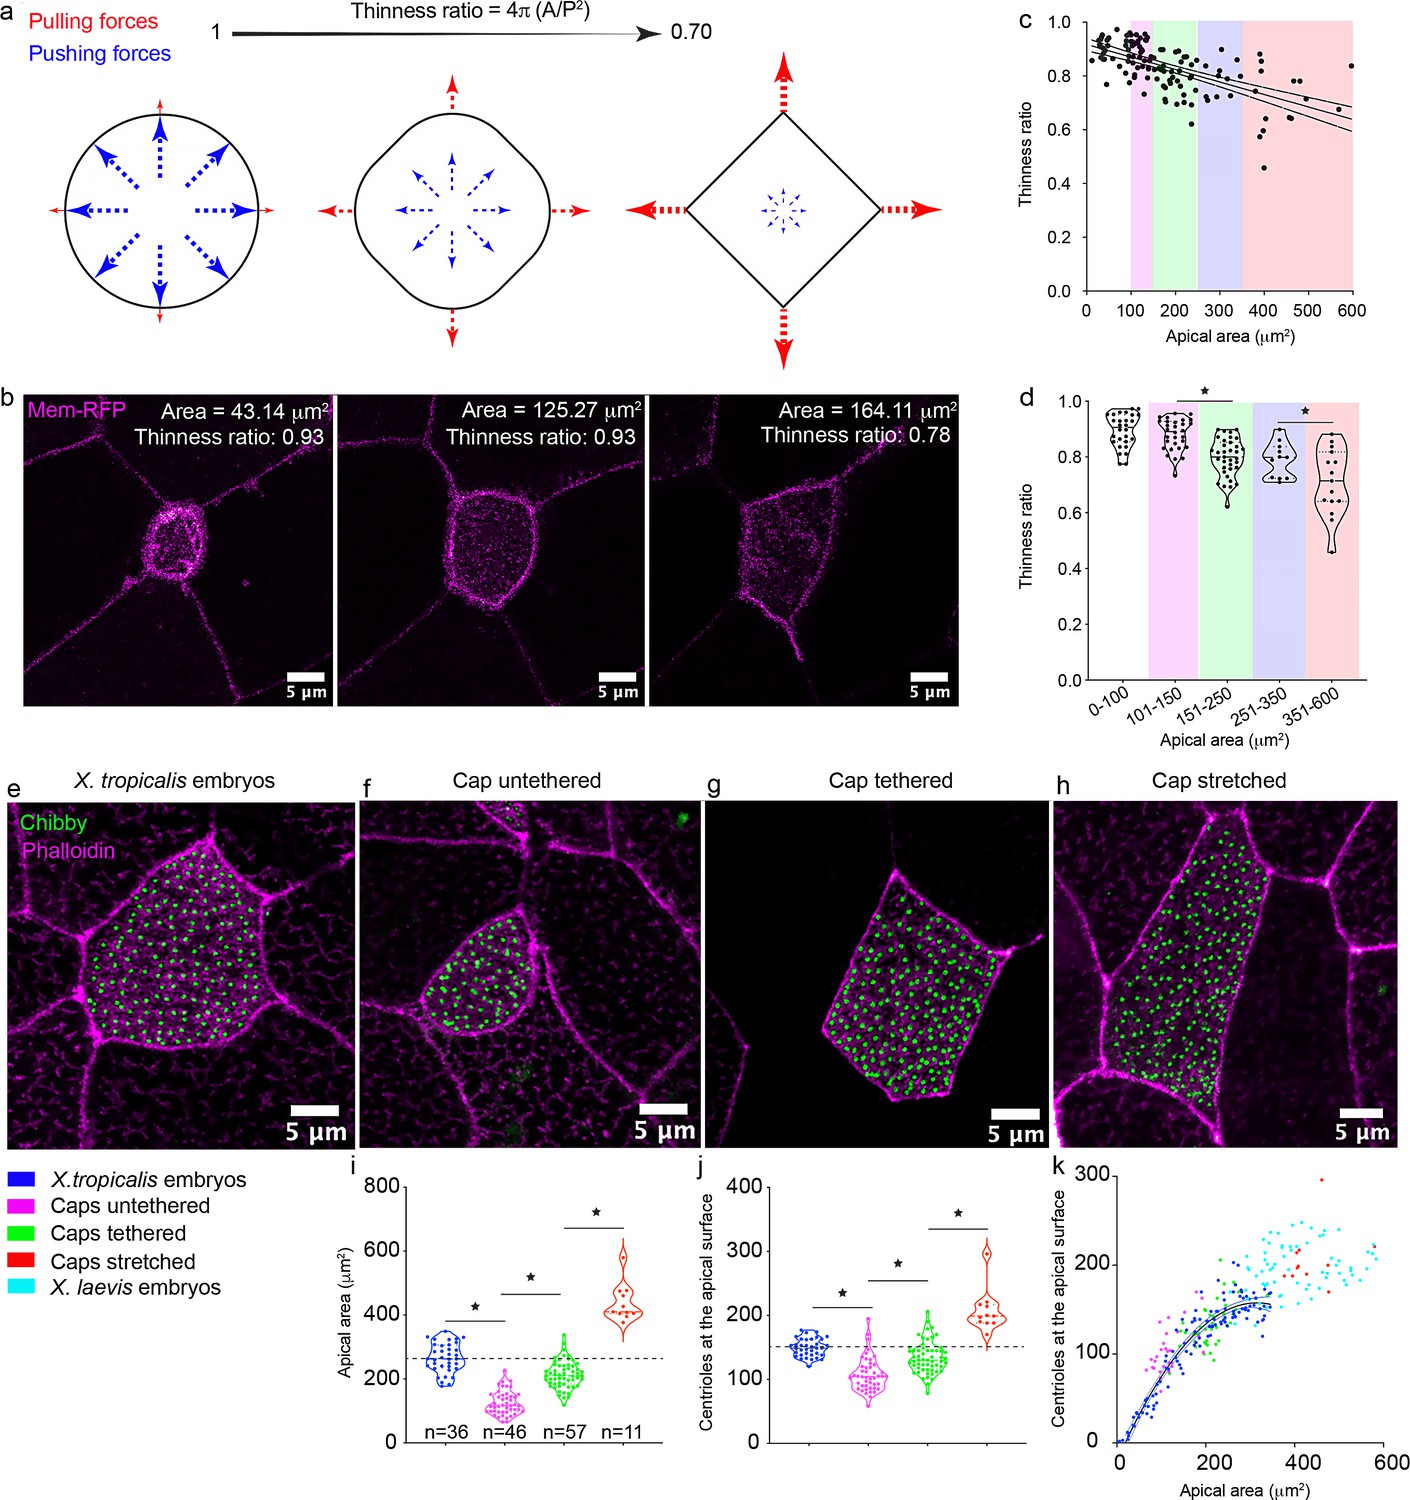
Mechanical stretch triggers centriole amplification in MCCs.
(a) Schematic showing the effect of cell autonomous pushing (blue) vs. cell non-autonomous pulling forces (red) on cell shape and the thinness ratio (TR). (b) A single MCC (marked by membrane-RFP) undergoing apical expansion and in the process changing the cell shape from circular (TR=0.93) to more polygonal (TR=0.78). (c) A regression plot showing the negative correlation between the TR and the apical area. Magenta: 100–150 μm2, Green: 151–250 μm2, Blue: 251–350 μm2, Red: 351–600 μm2. n = 122 cells collected from 20 to 25 embryos (d) Binning the apical area shows that the increase in apical area leads to a significant reduction in the TR. MCCs marked with chibby-GFP (centrioles, green), and phalloidin (F-actin, magenta) in (e) control embryos, (f) untethered animal caps, (g) tethered animal caps, and (h) mechanically stretched animal caps. The statistical comparison between the treatments is done one-way ANOVA test followed by Tukey’s multiple comparisons test. Quantitation of (i) apical area and (j) centriole number in MCCs of animal caps subjected to different mechanical stimuli. Dashed line indicates the median value of controls. * indicates statistical significance at p < 0. 05. The statistical comparison between the treatments is done using the Brown-Forsythe and Welch ANOVA test followed by the Dunnett's T3 multiple comparisons test. n = number of cells. Data for untethered and tethered caps was collected from 10 to 12 animal caps. Data for stretched animal caps was collected from six to nine animal caps. (k) Regression plot demonstrates the scaling relation between the apical area and centriole number across different treatments. The data is uploaded as source data 4.
-
Figure 4—source data 1
Source data related to Figure 4.
- https://cdn.elifesciences.org/articles/66076/elife-66076-fig4-data1-v2.xlsx
Figure 4—figure supplement 1

Depletion of β-catenin affects apical area and centriole number in MCCs Stage 28 embryos of (a) controls and (c) β-catenin morphants.
Images are to scale. Mature epidermal MCCs marked with chibby-GFP (centrioles, green), and phalloidin (F-actin, magenta) in (b) control and (d) β-catenin morphant embryos at stage 28. Quantitation of (e) apical area of MCCs, (f) apical area of non-MCCs, and (g) centriole number in control and β-catenin morphant embryos at stage 28. (h) Regression plot showing the positive correlation between apical area and centriole number. (i) TR in the β-catenin morphants is significantly higher than controls, (j) A regression plot showing the negative correlation between the TR and apical area between controls and β-catenin morphants. * indicates statistical significance at p < 0.05. The statistical comparison between the treatments (e, g, i) is done using an unpaired t test. The statistical comparison between the treatments in (f) is done using Mann-Whitney test. n = number of cells collected from 10 to 15 embryos. The data is uploaded as source data 4.
Figure 4—figure supplement 2
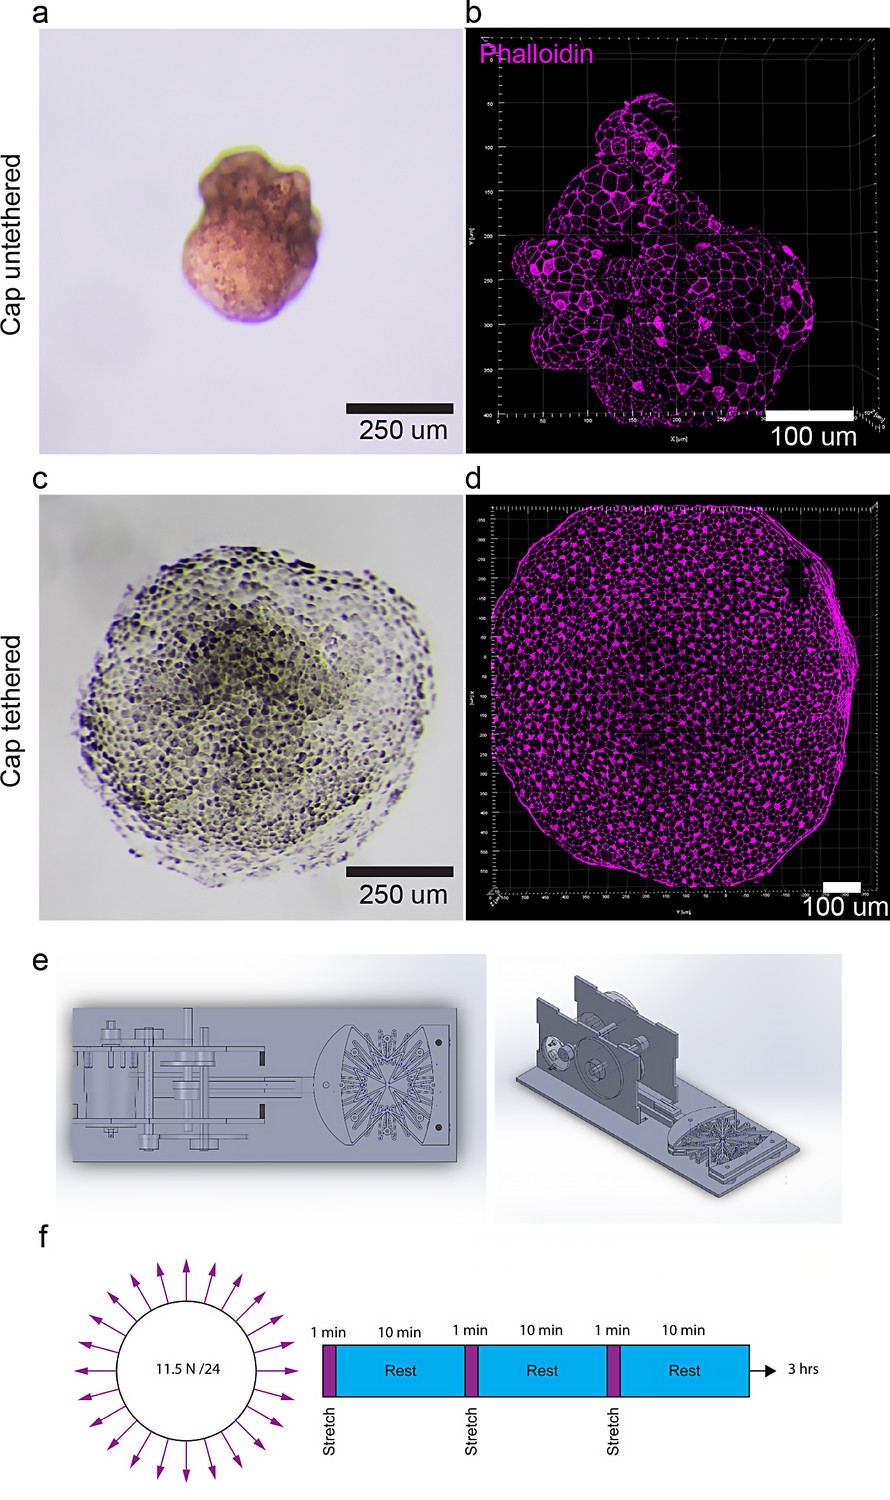
Manipulation of animal caps by cell adhesion and mechanical stretcher.
(a, b) Untethered (grown on agarose) and (c, d) tethered animal caps (grown on fibronectin slides) labeled with phalloidin (F-actin, magenta, b, d) at stage 28. (e) Mechanical stretcher (top view, left and side view, right). (f) Animal caps were stretched in a stepwise fashion with 1 min of stretch and 10 min of rest. The data is uploaded as source data 4.
Figure 4—figure supplement 3
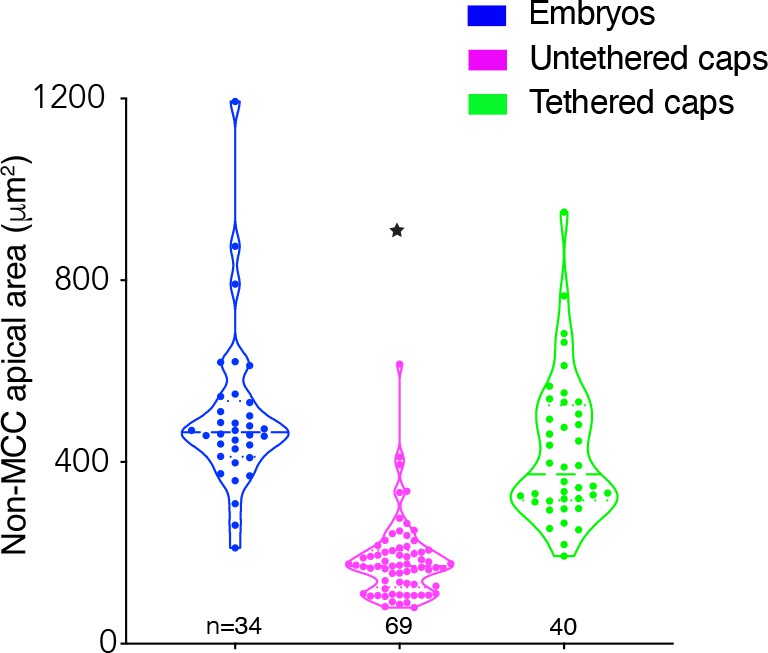
Apical area of non-MCCs in untethered/tethered animal caps.
Quantitation of apical area in non-MCCs of control embryos (blue) and animal caps that are untethered (magenta) or tethered (green). * indicates statistical significance at p < 0.05. The statistical comparison between the treatments is done using the Brown-Forsythe and Welch ANOVA test followed by Dunnett's T3 multiple comparisons test. n = number of cells collected from 10 to 12 animal caps. The data is uploaded as source data 4.
Figure 5 with 1 supplement
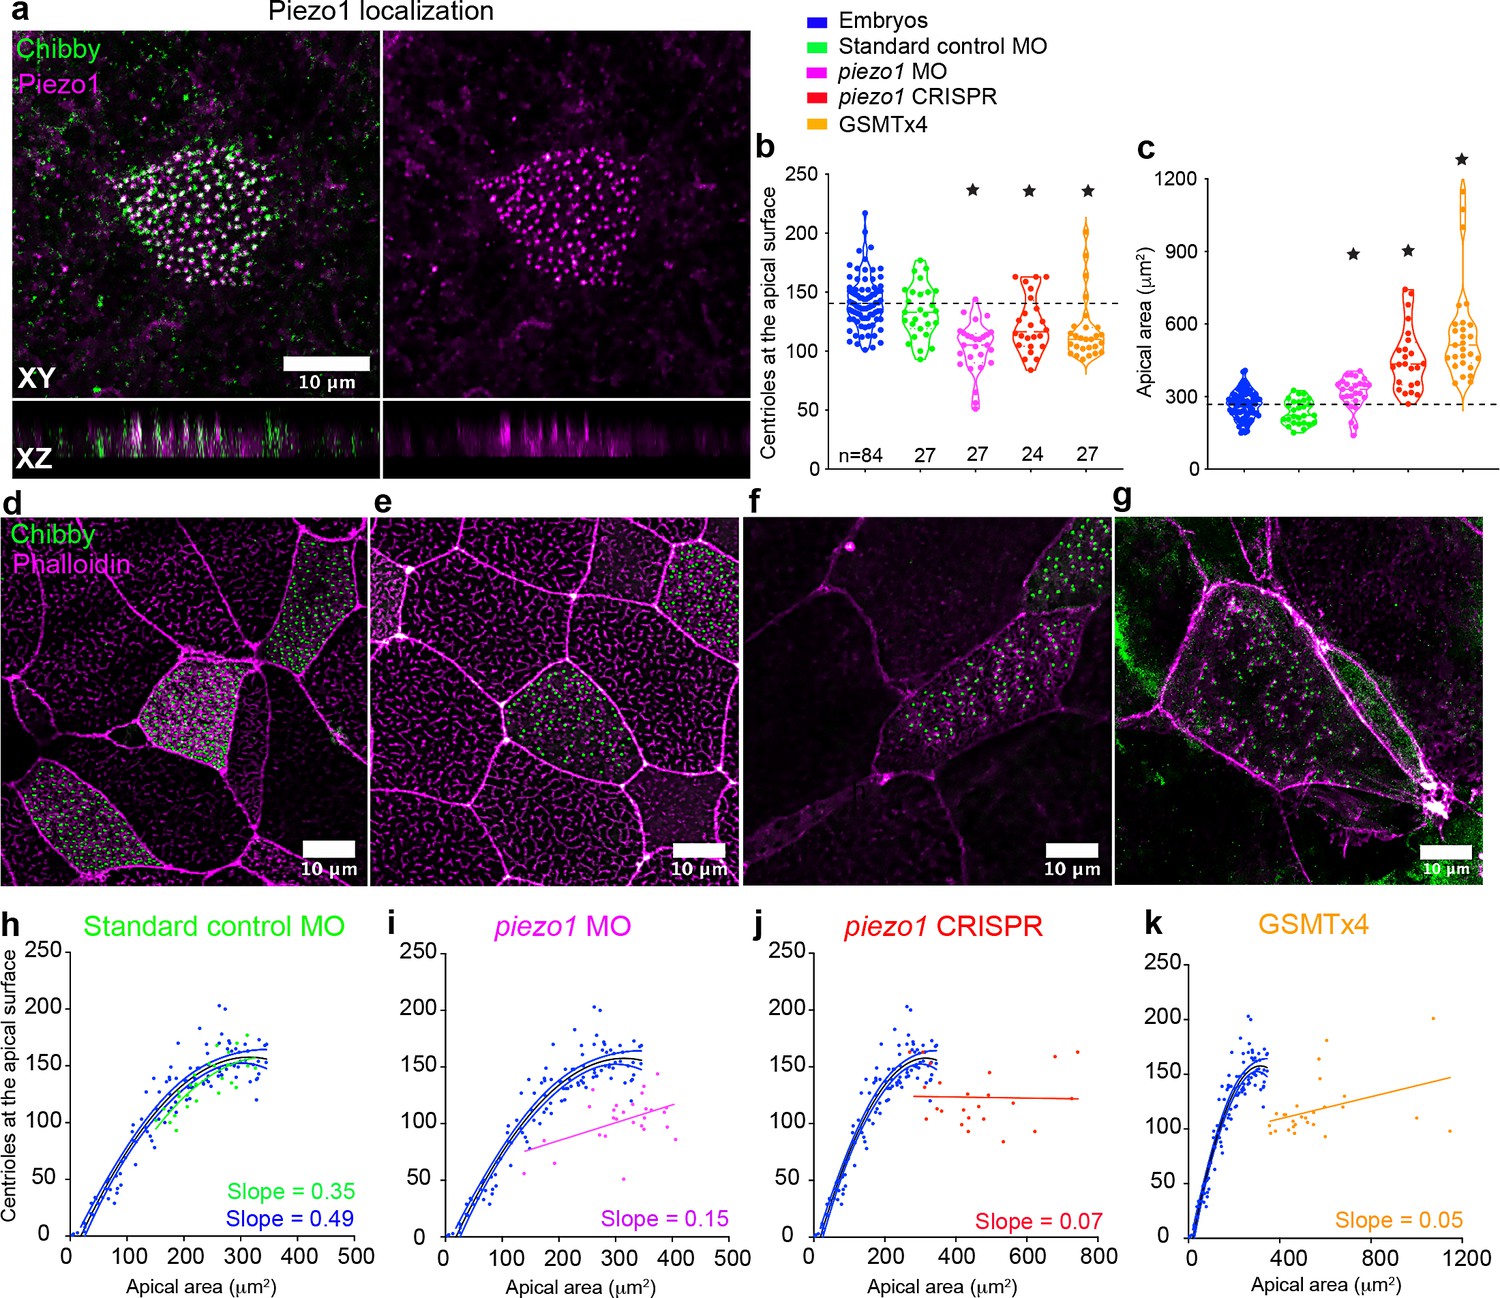
Piezo1 fine tunes centriole amplification and the scaling relation with apical area in the embryos.
(a) Mature epidermal MCCs marked with anti-Piezo1 antibody (magenta) and chibby-GFP (centrioles, green) in X. tropicalis embryos. XZ axis shows that Piezo1 localizes at the same plane as centrioles. Quantitation of (b) centriole number and (c) apical area in MCCs across different treatments that affect Piezo1 levels (MO or CRISPR) or function (GSMTx4). Dashed lines indicate the median values of controls. * indicates statistical significance at p < 0.05. The statistical comparison between the treatments is done using the Brown-Forsythe and Welch ANOVA test followed by Dunnett's T3 multiple comparisons test. n = number of cells collected from 12 to 20 embryos. MCCs marked with chibby-GFP (centrioles), and phalloidin (F-actin) in (d) Standard control MO, (e) piezo1 MO, (f) piezo1 CRISPR, and (g) GSMTx4. Regression plot demonstrating the positive correlation between apical area and centriole number in mature MCCs of controls (blue) and (h) standard control MO (green) compared to loss of correlation in (i) piezo1 MO (magenta), (j) piezo1 CRISPR (red), and (k) GSMTx4 (orange). The data is uploaded as source data 5.
-
Figure 5—source data 1
Source data related to Figure 5.
- https://cdn.elifesciences.org/articles/66076/elife-66076-fig5-data1-v2.xlsx
Figure 5—figure supplement 1

Piezo1 localization at the cell junctions and the bases of cilia in the MCCs.
(a) Mature epidermal MCCs stained using anti-Piezo1 antibody. Box region (b) shows MCCs at increased magnification. Dashed box in (b) indicates the localization of Piezo1 at cell junction. (c) Experimental design to test the specificity of Piezo1 antibody using a MO based knockdown approach at two-cell stage. (d) Mature epidermal MCCs marked with Piezo1 antibody in a single embryo injected with piezo1 MO in one cell at two-cell stage as shown in (c). (e) Quantitation of Piezo1 signal at the centrioles between uninjected (control) and morpholino oligo injected sides. * indicates statistical significance at p < 0.05. The statistical comparison between the treatments is done using an unpaired t test. n = number of cells collected from 10 to 15 embryos. The data is uploaded as source data 5.
Figure 6

Piezo1 dysfunction leads to reduced number of centrioles in MCCs in a tension-dependent manner.
MCCs marked with chibby-GFP (centrioles, green), and phalloidin (F-actin, magenta) in controls and piezo1 morphants in (a) untethered animal caps and (b) tethered animal caps. Quantitation of (c) number of centrioles at the apical surface and (d) apical area in untethered animal caps and tethered animal caps. * indicates statistical significance at p < 0.05. The statistical comparison between the treatments is done using a one-way ANOVA followed by Tukey’s multiple comparison test. n = number of cells collected from six to eight animal caps obtained from two independent experiments. (e) Regression plot showing a positive scaling relationship between apical area and the number of centrioles at the apical surface across all the treatments performed in this paper. When Piezo1 function is affected (black: piezo1 MO, piezo1 CRISPR, and GSMTx-4), the scaling relationship is abolished. n = number of cells. (f) Model illustrating that pushing forces dominate in the initial phase of apical expansion (apical area increases from 0 to ~150 μm2) and the centriole number reaches ~100. In the later phase of apical expansion, pulling forces dominate which changes the cell shape from round to polygonal. The pulling force is sensed by Piezo1 to regulate the amplification of the next ~50 centrioles. The data is uploaded as source data 6.
-
Figure 6—source data 1
Source data related to Figure 6.
- https://cdn.elifesciences.org/articles/66076/elife-66076-fig6-data1-v2.xlsx
Videos
Video 1
Centrioles (green) and F-actin (magenta).
Centrioles dispersed below the apical surface of an intercalating MCC.
Video 2
Segmentation and 3D reconstruction of the Video 1 using IMARIS.
Video 3
MCC labeled with membrane-RFP undergoing expansion of its apical surface.
Video 4
Untethered cap forms an irregular spherical structure.
F-actin is in magenta.
Video 5
Tethered animal cap forms a flat multiciliated epithelium.
F-actin is in magenta.
Tables
Key resources table
| Reagent type (species) or resource | Designation | Source or reference | Identifiers | Additional information |
|---|---|---|---|---|
| Other | Translation blocking morpholino (X. tropicalis) | b-catenin | 5’-TTTCAACAGTTTCCAAAGAACCAGG-3’ | 7.5–10 ng/ embryo |
| Other | Translation blocking morpholino (X. tropicalis) | ccdc11 | 5’-CATGCTTTCTCCCCAGCCGTGCTGT-3’ | 7.5–10 ng/ embryo |
| Other | Translation blocking morpholino (X. tropicalis) | piezo1 | 5’- CACAGAGGACTTGCAGTTCCATC-3’ | 10 ng/embryo |
| Other | Translation blocking morpholino (X. tropicalis) | standard control | 5’- CCTCTTACCTCAGTTACAATTTATA −3’ | 10 ng/embryo |
| Other | CRISPR (X. tropicalis) | piezo1 | 5’- GGGGCAGAAGGAGCCAAAAC −3’ | 600 ng of sgRNA and2.4 ng of NLS-Cas9 protein (PNABio)/ embryo |
| Antibody | Anti-Piezo1 (Rabbit polyclonal) | Novus | NBP1-78537 | IF (1:25) |
| Recombinant DNA reagent | Chibby-GFP (plasmid) | Kulkarni et al., 2018b | ||
| Recombinant DNA reagent | GFP-Centrin4 | Klos Dehring et al., 2013 | ||
| Recombinant DNA reagent | RFP-Cep152 | Klos Dehring et al., 2013 | ||
| Recombinant DNA reagent | hGR-Mcidas | Stubbs et al., 2012 | ||
| Recombinant DNA reagent | GFP-Sas6 | Stubbs et al., 2012 | ||
| Chemical compound, drug | GSMTx-4 | Abcam | ab141871 | |
| Chemical compound, drug | Centrinone | Tocris | 5687 | |
| Other | Alexa 488 Phalloidin | Thermo Fisher | A12379 | |
| Other | Alexa 647 Phalloidin | Thermo Fisher | A30107 |
Additional files
Download links
A two-part list of links to download the article, or parts of the article, in various formats.
Downloads (link to download the article as PDF)
Open citations (links to open the citations from this article in various online reference manager services)
Cite this article (links to download the citations from this article in formats compatible with various reference manager tools)
Mechanical stretch scales centriole number to apical area via Piezo1 in multiciliated cells
eLife 10:e66076.
https://doi.org/10.7554/eLife.66076


