An open label trial of anakinra to prevent respiratory failure in COVID-19
- 4th Department of Internal Medicine, National and Kapodistrian University of Athens, Greece
- 2nd Department of Internal Medicine, Democritus University of Thrace, Medical School, Greece
- 1st Department of Internal Medicine, Aristotle University ofThessaloniki, Greece
- Department of Medicine and Research Laboratory of Internal Medicine, National Expertise Center of Greece in Autoimmune Liver Diseases, General University Hospital of Larissa, Greece
- 3rd Department of Internal Medicine, National and Kapodistrian University of Athens, Greece
- 1st Department of Internal Medicine,University of Ioannina, School of HealthSciences, Faculty of Medicine, Greece
- Department of Pulmonary Medicine, General Hospital of Kerkyra, Greece
- Department of Internal Medicine, University of Patras, Medical School, Greece
- Department of Internal Medicine and Center for Infectious Diseases, Radboud University, Netherlands
- Clinical Research Centre, Copenhagen University Hospital Hvidovre, Denmark
- Immunology and Metabolism, Life & Medical Sciences Institute, University of Bonn, Germany
Figures
Figure 1 with 1 supplement
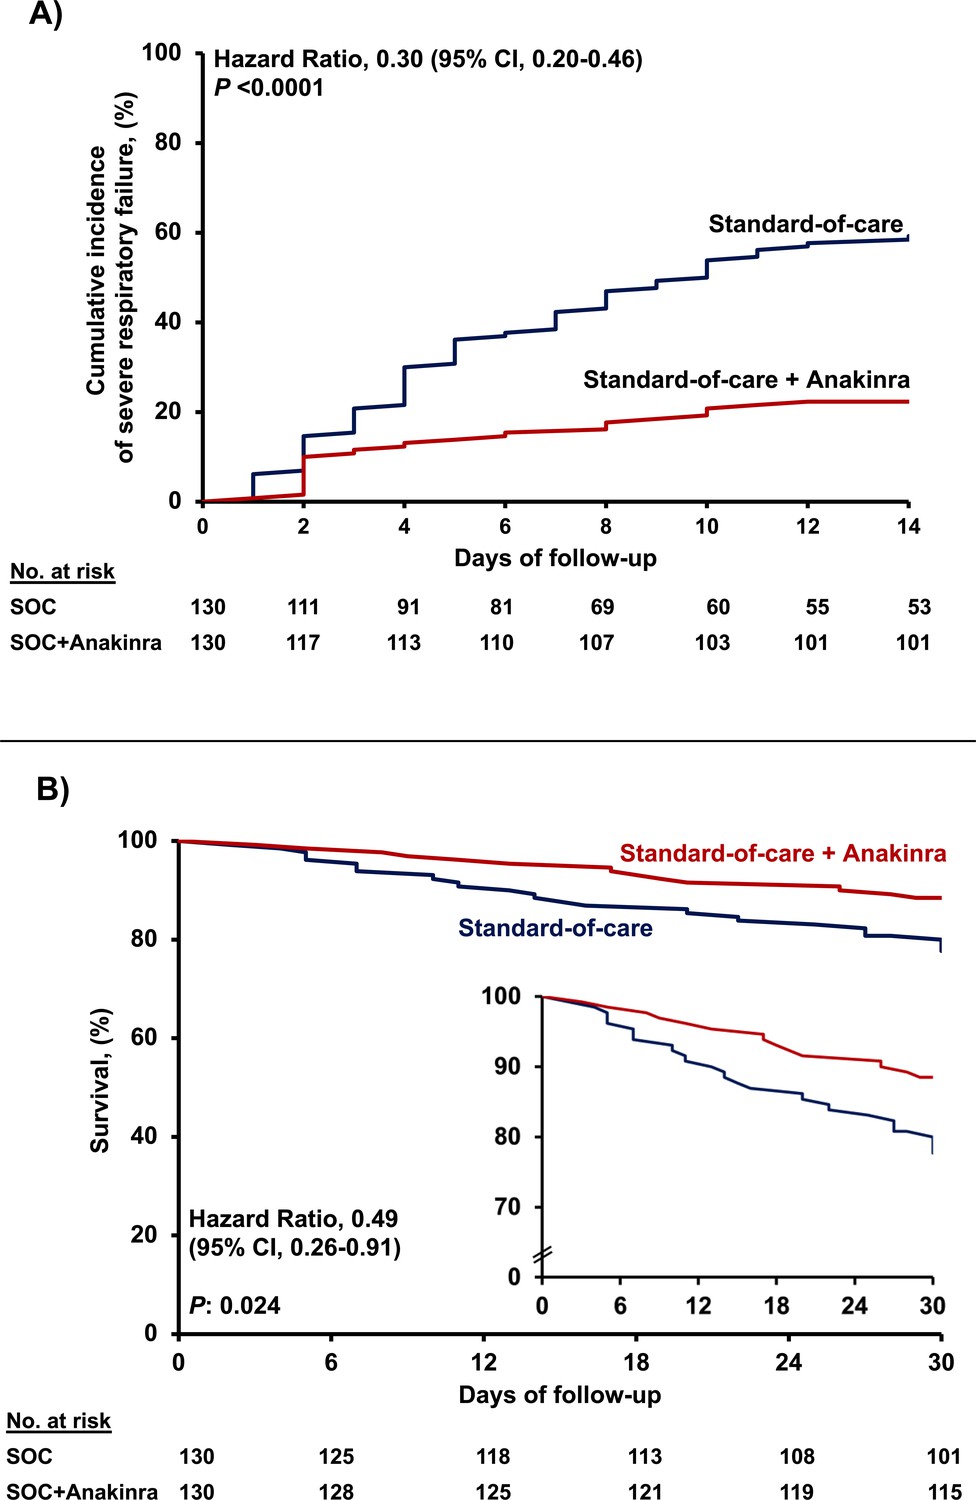
Outcome of patients treated with anakinra.
(A) Curves of the cumulative incidence of severe respiratory failure (SRF); and (B) curves of 30-day mortality; the inset shows the curves in enlarged Y-axis. The analysis includes propensity-scored fully matched comparators treated with standard-of-care (SOC; n = 130) and the 130 participants in the SAVE trial who were treated with SOC treatment and anakinra (n = 130). Separate analysis for the cumulative incidence of SRF between the total available 179 comparators and the 130 participants in the SAVE trial can be found in Figure 1—figure supplement 1.
Figure 1—figure supplement 1
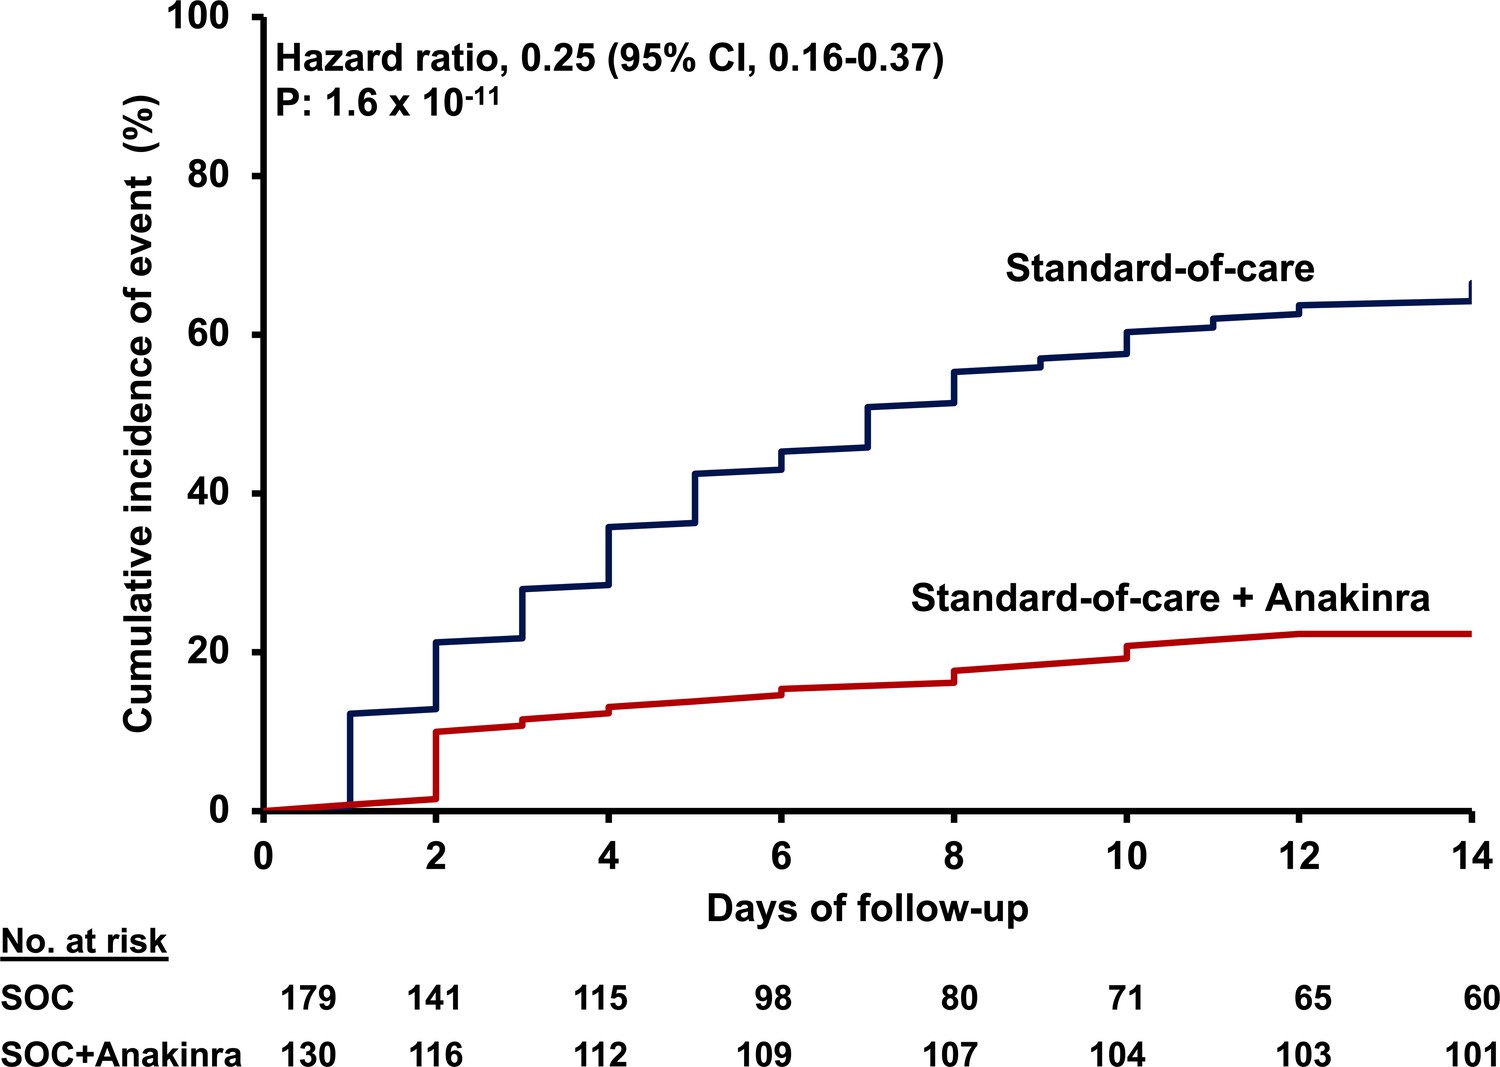
Incidence of SRF among the total of 179 available comparators treated with SOC before matching and the 130 partiicpants in the SAVE trial treated with Anakinra and SOC.
Figure 2
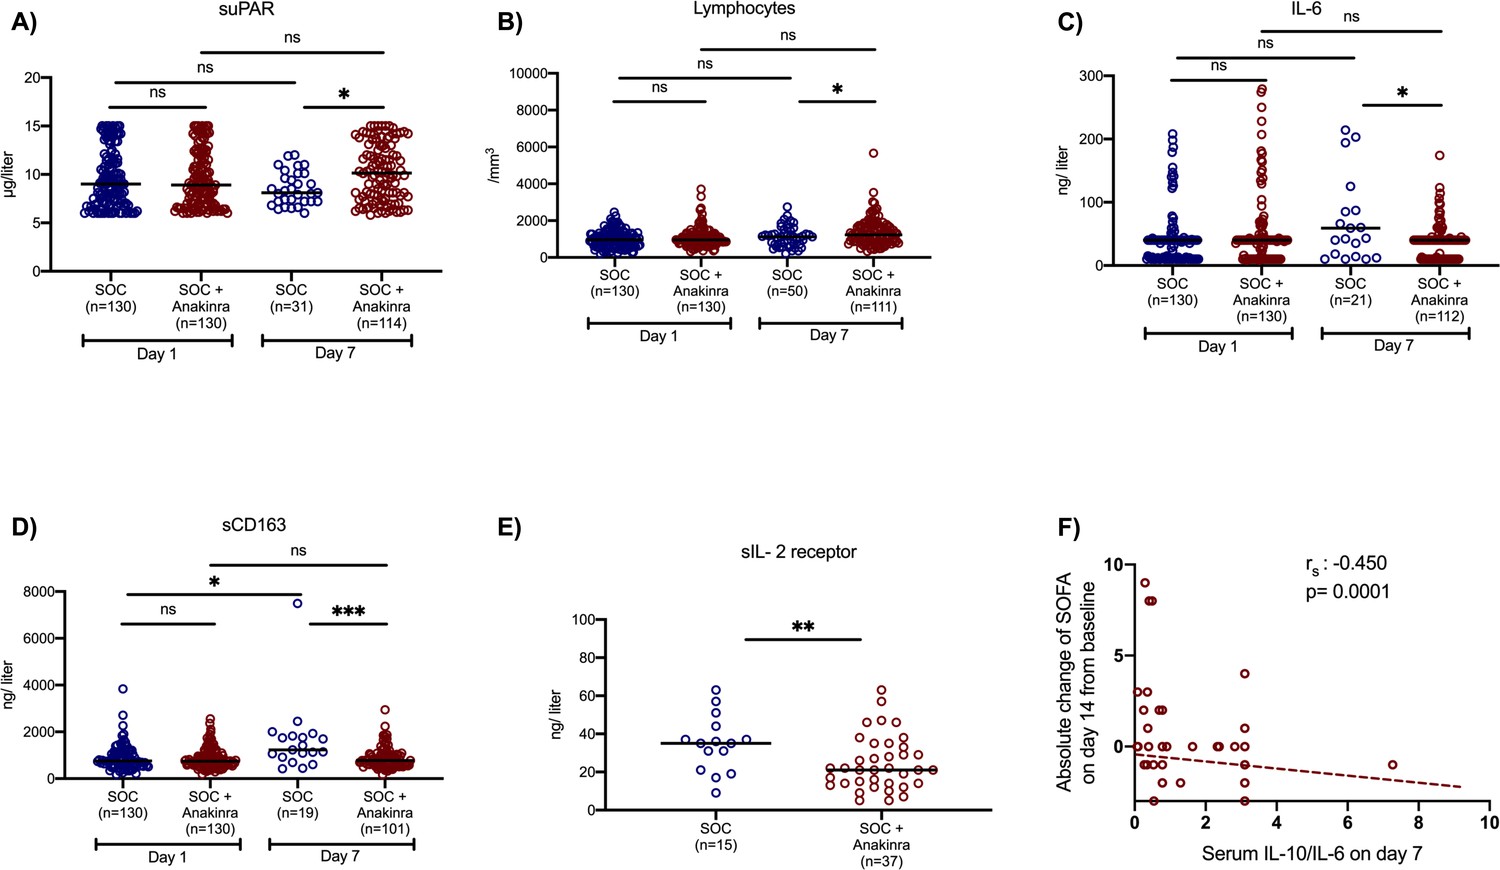
Effect of anakinra treatment on circulating mediators of patients with lower respiratory tract infection by SARS-CoV-2.
Concentrations of (A) suPAR (soluble urokinase plasminogen activator receptor); (B) the absolute lymphocyte count; (C) interleukin (IL)-6; and (D) sCD163 of patients under parallel standard-of-care (SOC) treatment (blue color) and of patients under treatment with SOC and anakinra (red color) at baseline (day of hospital admission) and day 7 of follow-up are shown. The concentrations of sIL-2R on day 7 are provided in panel E. Lines refer to median values. Comparisons between different groups were performed by the Mann–Whitney U-test and within the same group by the Wilcoxon test. Statistical comparisons: ns, non-significant; *p<0.05; **p<0.01; ***p<0.0001. The correlation of the IL-10/IL-6 ratio with the absolute change of the SOFA (sequential organ failure assessment) score on day 14 from the baseline is also shown (panel F). The Spearman rank of order correlation co-efficient and the p-value of the correlation is provided.
Figure 3
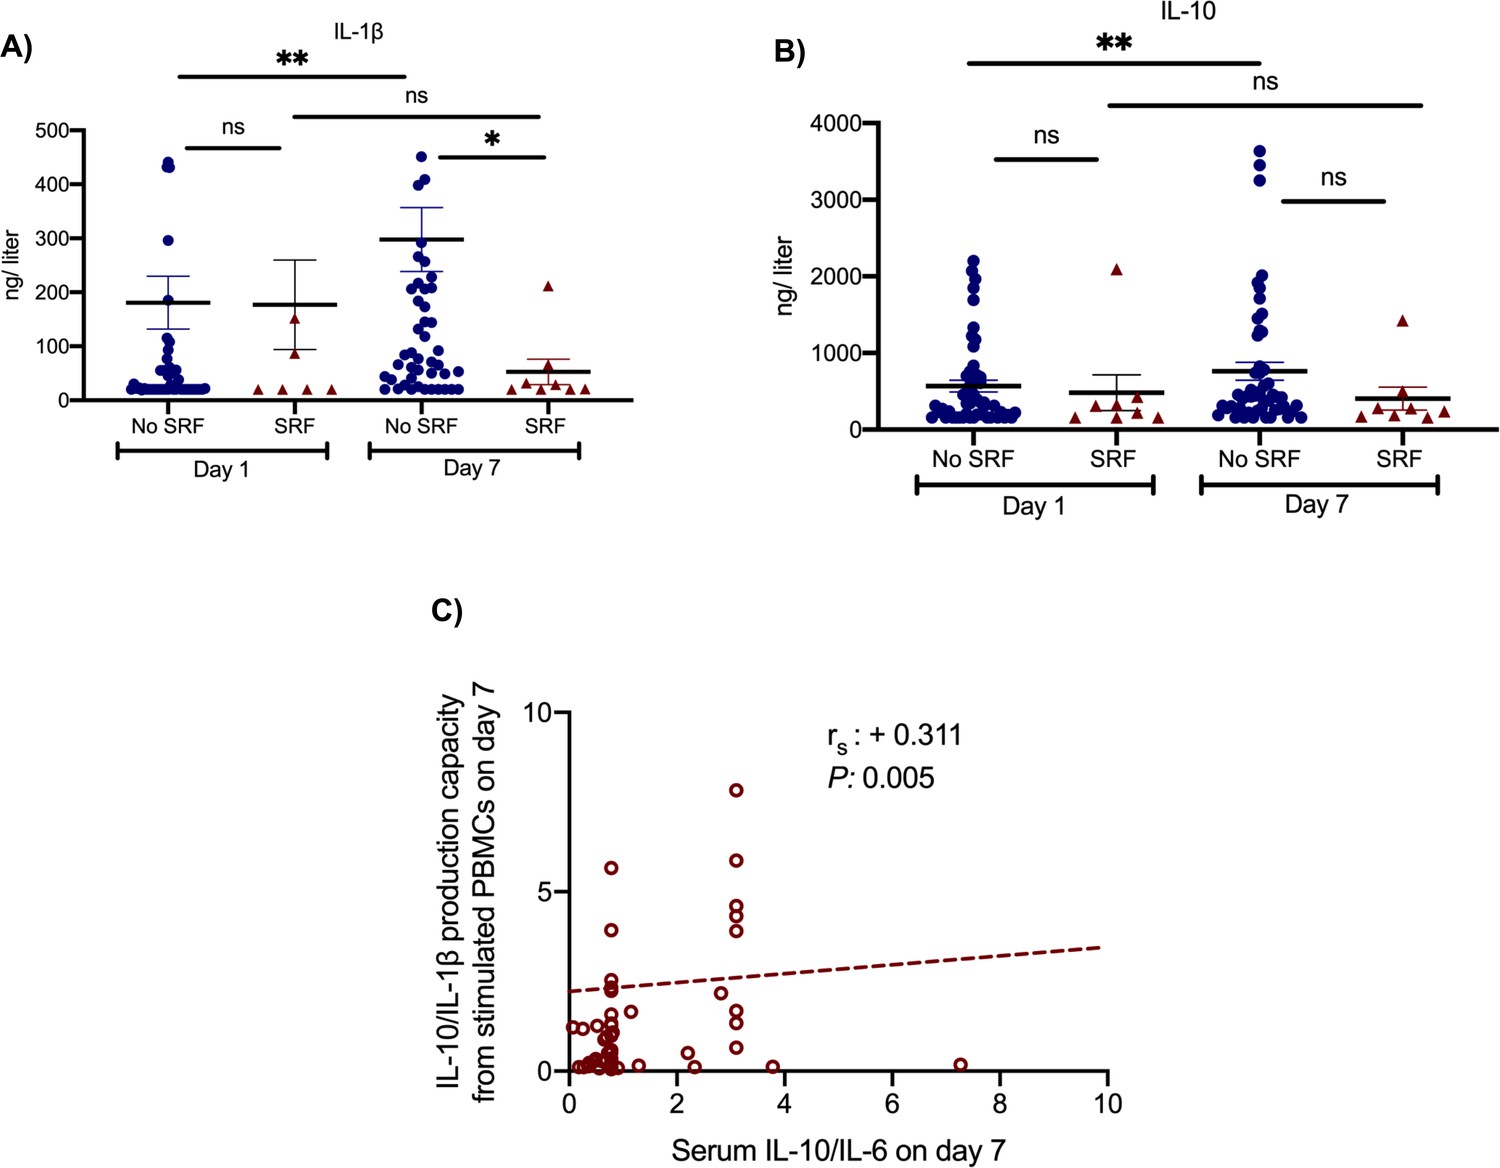
Effect of anakinra treatment on cytokine production capacity from peripheral blood mononuclear cells (PBMCs).
PBMCs were isolated before and 7 days after start of treatment with anakinra. PBMCs were stimulated with lipopolysaccharide (LPS) of Escherichia coli O55:B5 for the production of interleukin (IL)−1β and with heat-killed Candida albicans for the production of IL-10. Production of IL-1β (panel A) and of IL-10 (panel B) is presented separately for patients who developed by day 14 severe respiratory failure (SRF) or not. Lines refer to median values. Comparisons between different groups were performed by the Mann–Whitney U-test and within the same group by the Wilcoxon test. Statistical comparisons: ns, non-significant; *p<0.05; **p<0.01. The correlation between the ratio of IL-10/IL-1β production by PBMCs and of the ratio of IL-10/IL-6 in serum on day 7 is provided in panel C. The Spearman rank of order correlation co-efficient and the p-value of the correlation is provided.
Figure 4
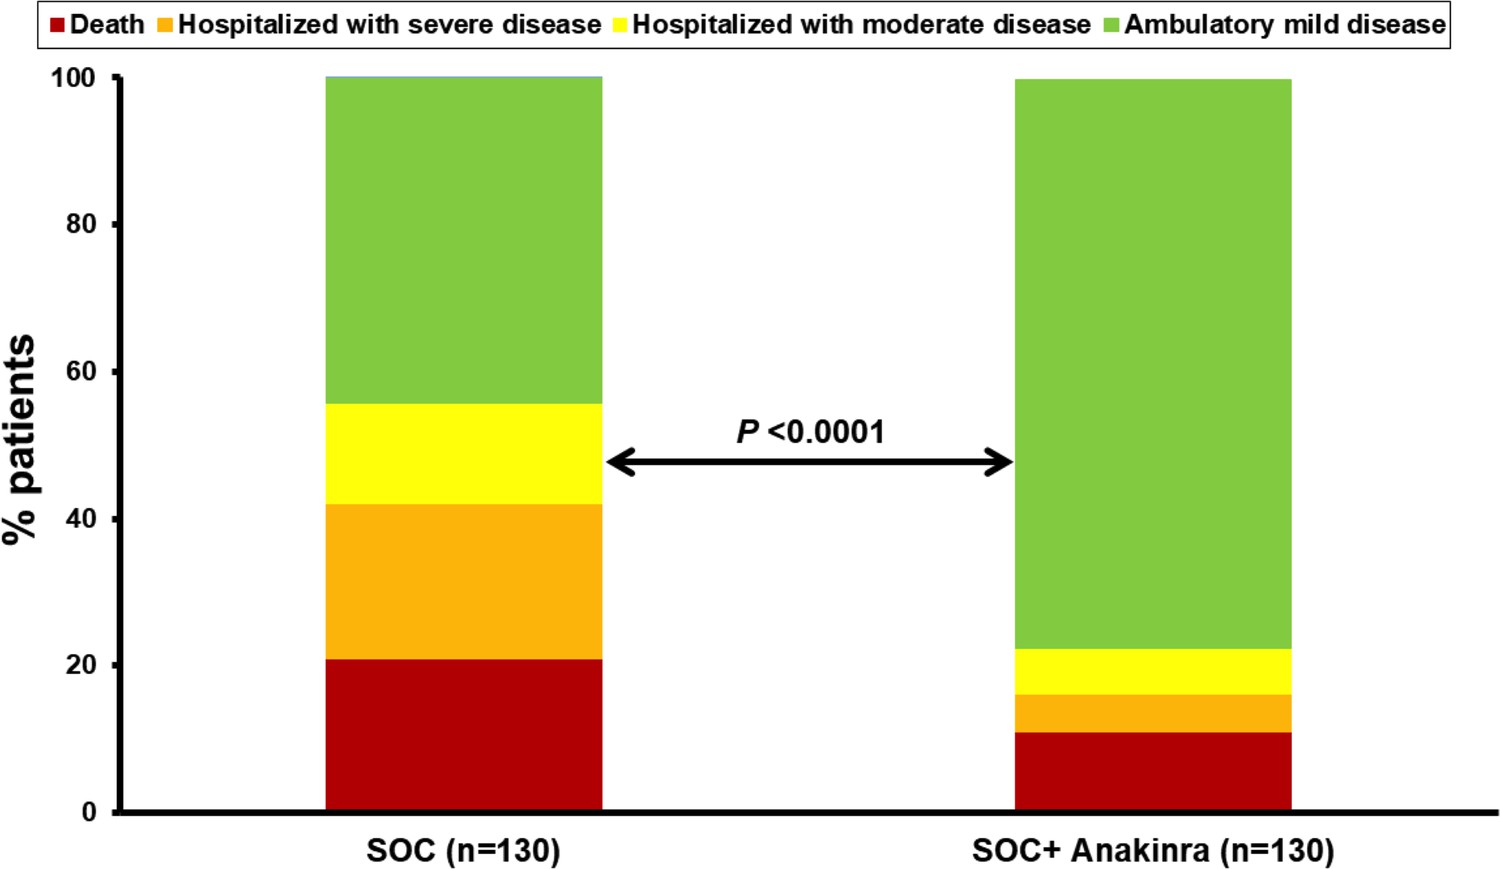
Allocation of patients into the strata of the WHO clinical progression scale by day 28.
The analysis includes propensity-scored fully matched comparators treated with standard-of-care (SOC, n = 130) and the 130 participants in the SAVE trial who were treated with SOC treatment and anakinra (n = 130). Comparisons were done by the Pearson’s chi-square test.
Appendix 1—figure 1
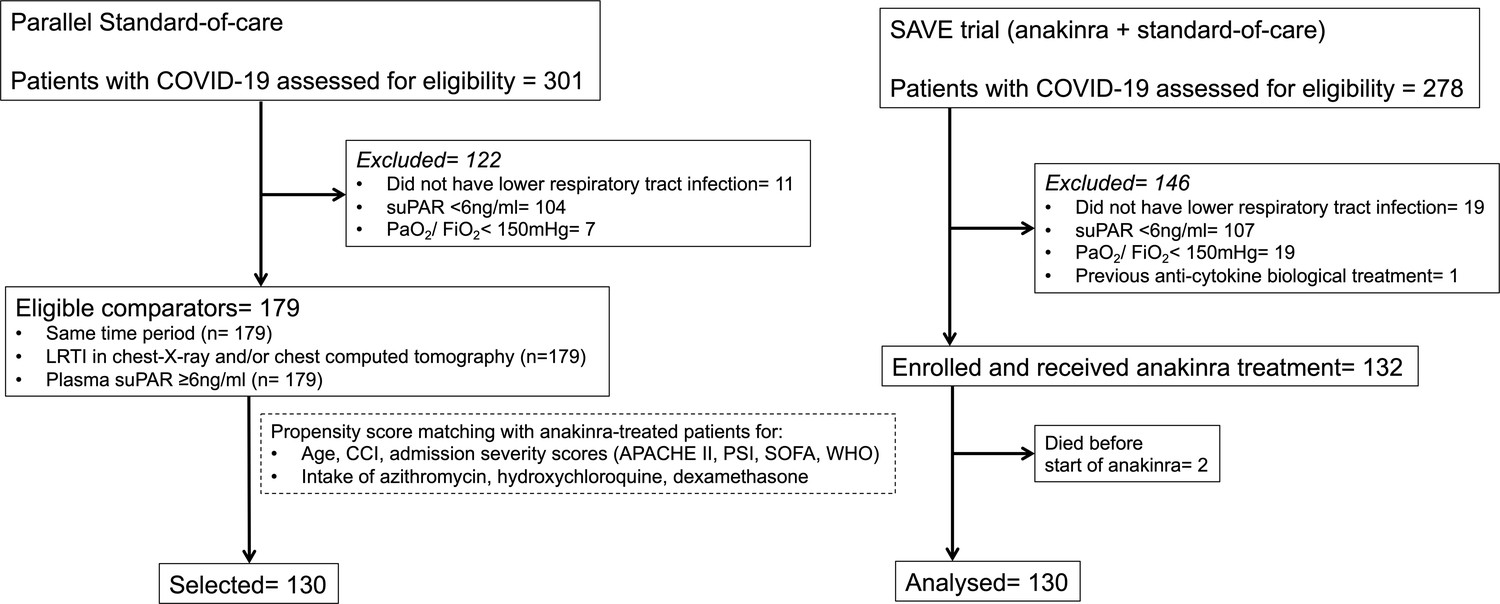
Trial profile and selection of parallel standard-of-care (SOC) comparators.
SOC comparators were hospitalized at the same time period at seven department of Internal Medicine in tertiary hospitals and they were selected in two steps: at the first step after application of the inclusion and exclusion criteria of patients receiving anakinra; and at the second step after propensity score matching. Abbreviations: APACHE II: acute physiology and chronic health evaluation; CCI: Charlson’s comorbidity index; COVID-19: infection by the new coronavirus SARS-CoV-2; ITT: intent-to-treat; LRTI: lower respiratory tract infection; PaO2/FiO2: respiratory fraction of partial oxygen pressure to fraction of inspired oxygen; PSI: pneumonia severity index; SOFA: sequential organ failure assessment; suPAR: soluble urokinase plasminogen activator receptor; WHO: severity classification of COVID-19 by the World Health organization.
Appendix 1—figure 2
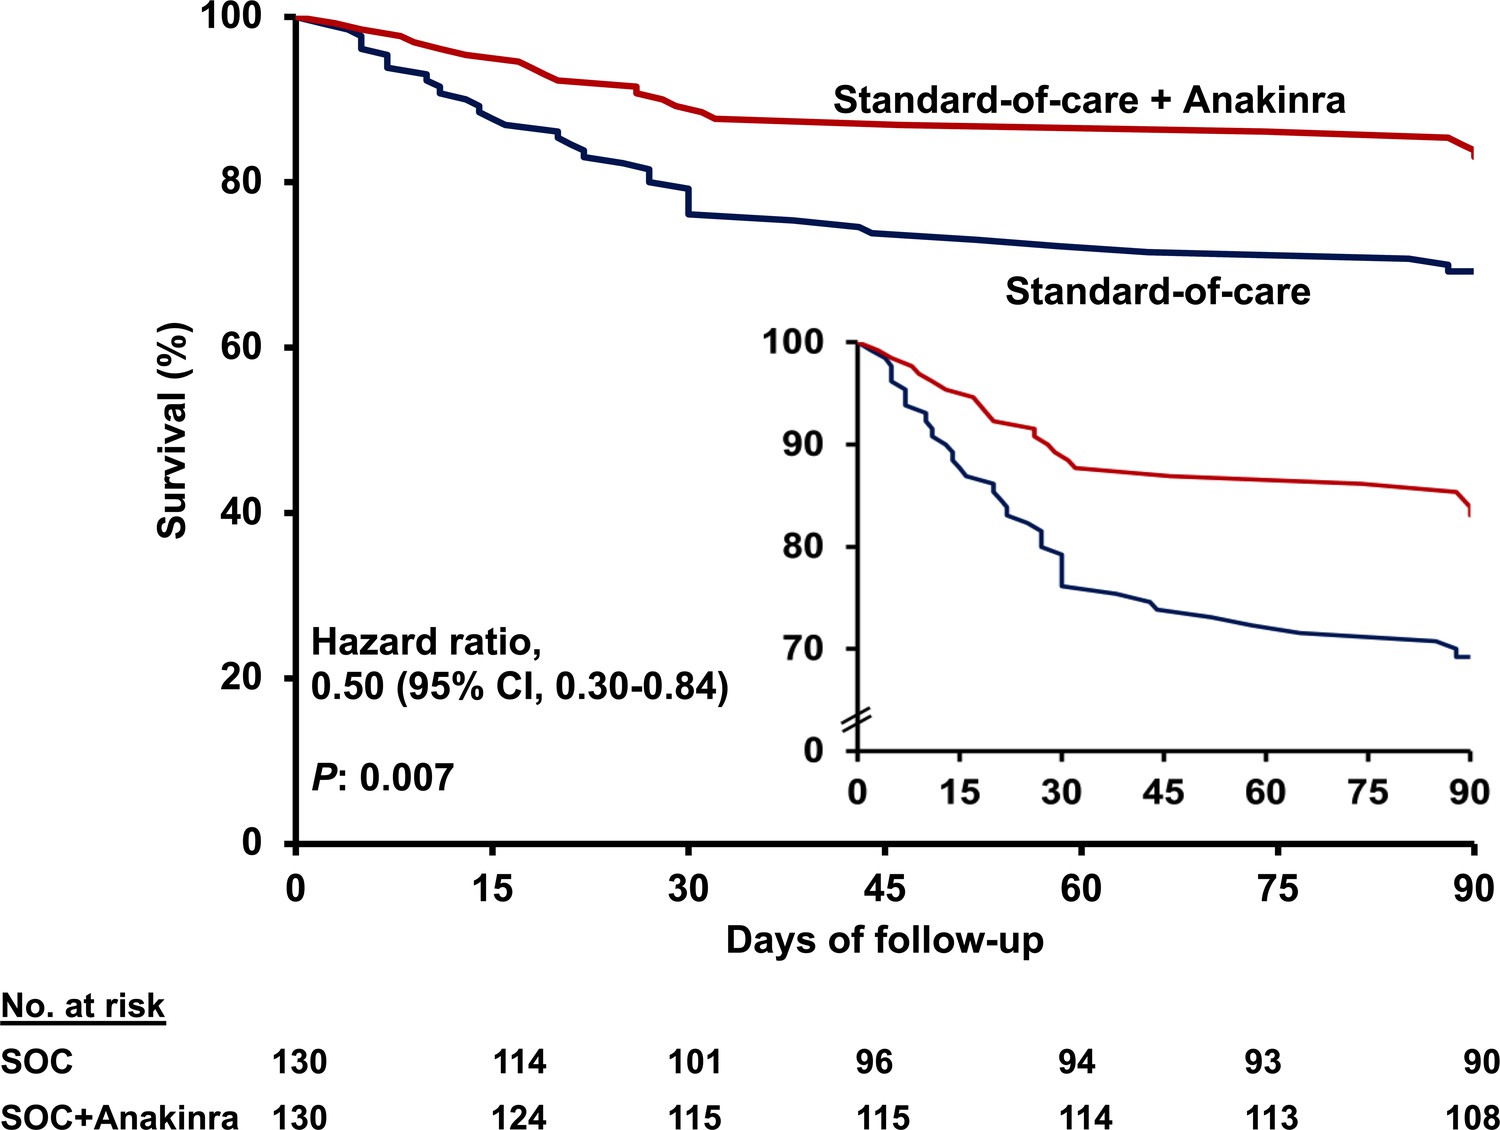
Survival curves until day 90.
Patients participating in the SAVE trial received standard-of-care (SOC) treatment and anakinra and were compared to parallel comparators treated only with SOC. The inset shows the curves in enlarged Y-axis. CI: confidence interval.
Appendix 1—figure 3
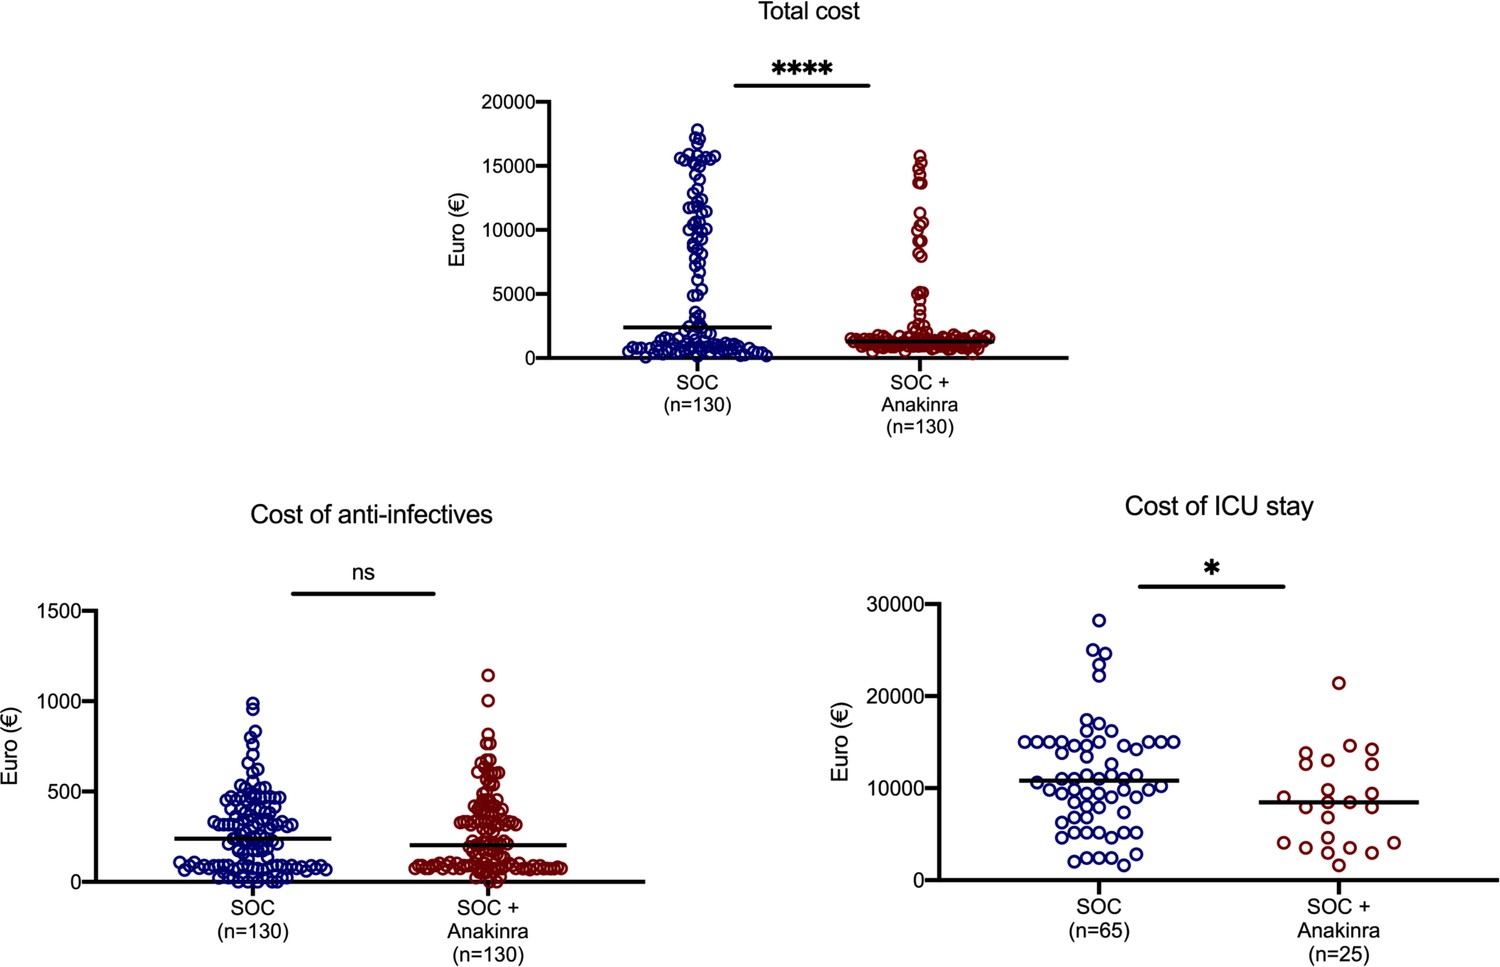
Cost of hospitalization.
The three main categories of cost are shown: total cost, cost of anti-infectives, and cost of stay in the intensive care unit. Statistical comparisons between groups. ns: non-significant; *p<0.05; ****p<0.0001. Abbreviation: SOC: standard-of-care.
Tables
Table 1
Baseline characteristics of patients.
| SOC + anakinra (N = 130) | Parallel SOC (N = 179) | p-value* | Parallel SOC after propensity matching (N = 130) | p-value** | |
|---|---|---|---|---|---|
| Age, years, mean (SD) | 63 (14) | 66 (14) | 0.094 | 64 (14) | 0.839 |
| Male sex, No. (%) | 81 (62.3) | 116 (64.8) | 0.719 | 84 (64.6) | 0.797 |
| Days from onset of symptoms to start of treatment, median (range) | 8 (1–23) | 6 (4–9) | 0.012 | 7 (1–12) | 0.143 |
| Severity indexes, mean (SD) | |||||
| Charlson’s comorbidity index | 3 (2) | 3 (2) | 0.123 | 3 (2) | 0.927 |
| ΑPACHE II score | 7 (3) | 8 (5) | 0.002 | 7 (3) | 0.957 |
| SOFA score | 2 (1) | 3 (2) | 0.001 | 2 (1) | 0.813 |
| Pneumonia severity index | 69 (22) | 80 (28) | <0.0001 | 70 (20) | 0.709 |
| WHO classification for COVID-19, No. (%) | |||||
| Moderatepneumonia, no oxygen | 61 (46.9) | 68 (38.0) | 0.158 | 57 (43.8) | 0.709 |
| Severe pneumonia | 69 (53.1) | 111 (62.0) | 73 (56.2) | ||
| Comorbidities, No. (%) | |||||
| Type 2 diabetes mellitus | 41 (31.5) | 45 (25.1) | 0.248 | 32 (24.6) | 0.270 |
| Chronic heart failure | 11 (8.5) | 19 (10.6) | 0.565 | 10 (7.7) | 1.000 |
| Chronic renal disease | 1 (0.8) | 12 (6.7) | 0.009 | 4 (3.1) | 0.370 |
| Coronary heart disease | 10 (7.7) | 24 (13.4) | 0.141 | 14 (10.8) | 0.521 |
| Arterial hypertension | 68 (52.3) | 87 (48.6) | 0.565 | 57 (43.8) | 0.214 |
| Chronic obstructive pulmonary disease | 12 (9.2) | 14 (7.8) | 0.682 | 6 (4.6) | 0.221 |
| Solid tumor malignancy | 8 (6.2) | 14 (7.8) | 0.658 | 9 (6.9) | 1.000 |
| Cerebrovascular disease | 7 (5.4) | 13 (7.3) | 0.641 | 4 (3.1) | 0.540 |
| Bacterial co-infection, No. (%) | 1 (0.8) | 5 (2.8) | 0.407 | 3 (2.3) | 0.622 |
| Streptococcus pneumoniae | 0 (0.0) | 2 (1.1) | 0.511 | 2 (1.5) | 0.498 |
| Escherichia coli | 0 (0.0) | 1 (0.6) | 1.000 | 1 (0.8) | 1.000 |
| Laboratory values, median (Q1–Q3) | |||||
| White blood cells, cells/mm3 | 5400 (4390–6830) | 6215 (4805–9013) | 0.005 | 5879 (4760–7800) | 0.106 |
| Lymphocytes, cells/mm3 | 950 (722–1252) | 961 (615–1271) | 0.307 | 977 (587–1318) | 0.382 |
| Platelets, cells/mm3 | 184,000 (137,000–246,000) | 202,000 (150,000–270,000) | 0.121 | 204,400 (150,450–271,625) | 0.107 |
| C-reactive protein, mg/l | 47.4 (14.3–105.5) | 64.7 (18.3–140.0) | 0.179 | 68.8 (19.7–141.8) | 0.117 |
| Procalcitonin, ng/ml | 0.14 (0.08–0.31) | 0.23 (0.10–0.71) | 0.149 | 0.13 (0.08–0.41) | 0.841 |
| Ferritin, ng/ml | 536.5 (280.0–898.5) | 629.5 (375.0–1277.0) | <0.001 | 607.5 (367.8–1196.0) | 0.107 |
| Serum soluble uPAR, ng/ml | 8.9 (7.0–12.2) | 9.2 (7.0–13.8) | 0.344 | 9.0 (7.0–11.7) | 0.973 |
| PaO2/FiO2, mmHg | 293.3 (195.7–371.2) | 262.0 (182.0–350.3) | 0.090 | 285.7 (208.5–371.7) | 0.917 |
| Concomitant treatment, No. (%) | |||||
| Hospitalization at tertiary academic hospitals | 127 (97.7) | 156 (87.2) | 0.191 | 120 (92.3) | 0.167 |
| β-lactamase inhibitors | 18 (13.8) | 16 (8.9) | 0.199 | 13 (10) | 0.444 |
| Third generation cephalosporins | 60 (46.2) | 66 (36.9) | 0.127 | 43 (33.1) | 0.042 |
| Piperacillin/tazobactam | 37 (28.7) | 61 (34.1) | 0.323 | 42 (32.3) | 0.590 |
| Ceftaroline | 38 (29.2) | 50 (27.9) | 0.800 | 42 (32.3) | 0.687 |
| Carbapenem | 11 (8.5) | 23 (12.8) | 0.271 | 15 (11.5) | 0.536 |
| Moxifloxacin/levofloxacin | 27 (20.9) | 26 (14.5) | 0.170 | 17 (13.2) | 0.136 |
| Glycopeptides | 2 (1.5) | 6 (3.4) | 0.475 | 5 (3.8) | 0.447 |
| Azithromycin | 96 (73.8) | 145 (81.0) | 0.164 | 104 (80.0) | 0.303 |
| Remdesivir | 8 (6.2) | 12 (6.7) | 1.000 | 11 (8.5) | 0.635 |
| Hydroxychloroquine | 56 (43.1) | 92 (51.4) | 0.066 | 68 (52.3) | 0.172 |
| Dexamethasone | 52 (40.0) | 65 (36.3) | 0.553 | 47 (36.2) | 0.610 |
| Predicted probability | 0.488 (0.386–0.571) | _ | _ | 0.488 (0.391–0.556) | 0.629 |
-
Abbreviations: APACHE: acute physiology and chronic health evaluation; n: number; Q: quartile; SD: standard deviation; SOC: standard-of-care; SOFA: sequential organ failure assessment; uPAR: urokinase-type plasminogen activator receptor; WHO: World Health Organization.
*p-value of comparison between SOC + anakinra treated patients and parallel standard-care comparators.
-
**p-value of comparison between SOC + anakinra treated patients and parallel standard-care comparators after propensity matching.
Table 2
Primary, secondary, and exploratory study outcomes.
| Parallel SOC (N = 130) | SOC + Anakinra after propensity matching (N = 130) | OR (95% CI) | p-value | |
|---|---|---|---|---|
| Severe respiratory failure by day 14, No. (%) | 77 (59.2) | 29 (22.3) | 0.19 (0.12–0.34) | <0.0001 |
| Mechanical ventilation (MV) by day 14, No. (%) | 65 (50.0) | 25 (19.2) | 0.24 (0.14–0.42) | <0.0001 |
| Non-invasive MV by day 14, No. (%) | 9 (6.9) | 6 (4.6) | 0.65 (0.23–1.88) | 0.596 |
| 14-day mortality, No. (%) | 16 (12.3) | 6 (4.6) | 0.35 (0.13–0.91) | 0.043 |
| SOFA score on day 7, median (Q1–Q3) | 2 (0 to 3) | 1 (0 to 3) | NA | 0.540 |
| SOFA score on day 14, median (Q1–Q3) | 2 (0–9) | 1 (0–3) | NA | 0.191 |
| Absolute change of SOFA score by day 7 compared to baseline, median (Q1–Q3) | 0 (−1 to 1) | 0 (−1 to 0) | NA | 0.356 |
| Absolute change of SOFA score by day 14 compared to baseline, median (Q1–Q3) | 0 (−1 to 6) | −2 (−1 to 0) | NA | 0.004 |
| Absolute change of respiratory symptoms score by day 7 compared to baseline, median (Q1–Q3) | 0 (0 to 0.75) | −1 (−3 to 0) | NA | 0.019 |
| Absolute change of respiratory symptoms score by day 14 compared to baseline, median (Q1–Q3) | 0 (−0.75 to 0) | −2 (−4 to −1) | NA | 0.016 |
| Ventilator-free days, mean (SD) | 18 (11) | 25 (8) | NA | <0.0001 |
| 30-day mortality, No. (%) | 29 (22.3) | 15 (11.5) | 0.45 (0.23–0.90) | 0.031 |
| 90-day mortality, No. (%) | 40 (30.8) | 22 (16.9) | 0.46 (0.25–0.83) | 0.013 |
-
Abbreviations: CI: confidence interval; n: number; NA: non-applicable; OR: odds ratio; Q: quartile; SD: standard deviation; SOC; standard-of-care; SOFA: sequential organ failure assessment.
Table 3
Anakinra as an independent protective factor from development of severe respiratory failure (SRF) by day 14.
Univariate and multivariate (Cox forward conditional) models, for patients receiving anakinra with standard-of-care (SOC) treatment and for parallel comparators receiving only SOC treatment are presented. Only admission variables that differ significantly between patients who developed and those who did not develop SRF by day 14 are provided. Results are provided after four steps of analysis.
| Univariate analysis | Multivariate analysis | |||||
|---|---|---|---|---|---|---|
| Variable, no. (%) | SRF (−) (N = 154) | SRF (+) (N = 106) | HR (95% CI) | p-value | HR (95% CI) | p-value |
| Anakinra treatment, n (%) | 101 (65.6) | 29 (27.4) | 0.30 (0.20–0.47) | <0.0001 | 0.28 (0.18–0.44) | <0.0001 |
| APACHE II, mean (SD) | 6 (3) | 8 (3) | 1.12 (1.07–1.19) | <0.0001 | ||
| SOFA score, mean (SD) | 2 (1) | 3 (1) | 1.58 (1.38–1.82) | <0.0001 | 1.41 (1.21–1.65) | <0.0001 |
| Pneumonia severity index, mean (SD) | 66 (22) | 73 (19) | 1.01 (1.00–1.02) | 0.017 | ||
| Severe COVID-19 by WHO classification, n (%) | 65 (42.2) | 77 (72.6) | 2.78 (1.81–4.27) | <0.0001 | 1.74 (1.09–2.79) | 0.020 |
| Soluble uPAR, ng/ml, median (Q1–Q3) | 8.3 (6.7–11.0) | 10.0 (8.0–13.9) | 1.10 (1.04–1.17) | 0.001 | 1.07 (1.01–1.14) | 0.022 |
| Lymphocytes/mm3, median (Q1–Q3) | 1000 (733–1315) | 930 (579–1197) | 0.99 (0.99–1.00) | 0.026 | ||
| C-reactive protein, mg/l, median (Q1–Q3) | 41.1 (12.7–95.2) | 73.4 (30.6–153.1) | 1.00 (1.00–1.00) | <0.0001 | ||
| Ferritin, ng/ml, median (Q1–Q3) | 525.0 (280.0–804.5) | 641.5 (451.3–1556.8) | 1.00 (1.00–1.00) | <0.0001 | ||
| PaO2/FiO2, mmHg, median (Q1–Q3) | 330.8 (231.9–386.7) | 244.4 (161.7–305.8) | 0.99 (0.99–0.99) | <0.0001 | ||
| Treatment with third generation cephalosporin, n (%) | 73 (47.4) | 30 (28.3) | 0.53 (0.35–0.82) | 0.004 | ||
| Treatment with piperacillin/tazobactam, n (%) | 37 (24.0) | 42 (39.6) | 1.60 (1.08–2.38) | 0.019 | ||
| Treatment with carbapenem, n (%) | 7 (4.5) | 19 (17.9) | 2.79 (1.69–4.60) | <0.0001 | 2.19 (1.26–3.83) | 0.006 |
| Treatment with glycopeptide, n (%) | 1 (0.6) | 6 (5.7) | 2.60 (1.14–5.95) | 0.023 | ||
| Treatment with dexamethasone, n (%) | 46 (29.9) | 53 (50.0) | 1.73 (1.19–2.54) | 0.005 | ||
-
Abbreviations: APACHE: acute physiology and chronic health evaluation; CI: confidence interval; HR: hazard ratio; n: number; PaO2/FiO2: ratio of partial oxygen pressure to the fraction of inspired oxygen; Q: quartile; SD: standard deviation; SOFA: sequential organ failure assessment; SRF: severe respiratory failure; uPAR: urokinase-type plasminogen activator receptor.
Table 4
Adverse events and serious adverse events.
The incidence of the same events was depicted among parallel SOC treated, propensity-matched comparators.
| Parallel SOC (N = 130) | SOC + anakinra (N = 130) | OR (95% CI) | p-value | |
|---|---|---|---|---|
| At least one SAE by day 14, No. (%) | 63 (48.5) | 32 (24.6) | 0.34 (0.21–0.59) | <0.0001 |
| Extended hospitalization | 63 (48.5) | 32 (24.6) | 0.34 (0.21–0.59) | <0.0001 |
| Death | 16 (12.3) | 6 (4.6) | 0.35 (0.13–0.91) | 0.043 |
| Shock | 56 (43.1) | 27 (20.8) | 0.34 (0.20–0.59) | <0.0001 |
| Acute kidney injury | 37 (28.5) | 15 (11.5) | 0.32 (0.17–0.63) | 0.001 |
| Any bacterial infection | 30 (23.1) | 9 (6.9) | 0.22 (0.10–0.49) | <0.0001 |
| Thromboembolic event | 5 (3.8) | 2 (1.5) | 0.32 (0.06–1.72) | 0.188 |
| Pulmonary edema | 0 (0) | 1 (0) | NA | 1.00 |
| At least one AE by day 14, No. (%) | 89 (68.5) | 85 (65.4) | 0.87 (0.51–1.45) | 0.693 |
| Gastrointestinal disturbances | 9 (6.9) | 15 (11.5) | 1.74 (0.74–4.17) | 0.284 |
| Electrolyte abnormalities | 41 (31.5) | 35 (26.9) | 0.80 (0.47–1.37) | 0.496 |
| Elevated liver function tests | 51 (39.2) | 40 (30.8) | 0.69 (0.41–1.15) | 0.193 |
| Anemia | 26 (20.0) | 22 (16.9) | 0.82 (0.44–1.53) | 0.632 |
| Leukopenia | 3 (2.3) | 11 (8.5) | 3.91 (1.07–14.37) | 0.051 |
| Thrombopenia | 7 (5.4) | 9 (6.9) | 1.31 (0.47–3.62) | 0.797 |
| Headache | 2 (1.5) | 4 (3.1) | 2.03 (0.37–11.29) | 0.684 |
| Allergic reaction | 7 (5.4) | 4 (3.1) | 0.56 (0.16–1.95) | 0.540 |
| Any heart arrhythmia | 22 (16.9) | 9 (6.9) | 0.37 (0.16–0.83) | 0.020 |
-
Abbreviations: AE: non-serious adverse event; CI: confidence interval; n: number; NA: non-available; OR: odds ratio; SAE: serious adverse event; SOC: standard-of-care.
Key resources table
| Reagent type (species) or resource | Designation | Source or reference | Identifiers | Additional information |
|---|---|---|---|---|
| Commercial assay or kit | Human IL-1b uncoated ELISA | Invitrogen | 88–7261 | |
| Commercial assay or kit | Human IL-6 uncoated ELISA | Invitrogen | 88–7066 | |
| Commercial assay or kit | Human IL-10 uncoated ELISA | Invitrogen | 88–7066 | |
| Commercial assay or kit | Human IL-2R uncoated ELISA | Invitrogen | 88-7025-22 | |
| Commercial assay or kit | Human sCD163 uncoated ELISA | Affymetrix Inc | RAB0082 | |
| Commercial assay or kit | Human Ferritin ELISA | ORGENTEC Diagnostika GmbH | ORG 5FE | |
| Chemical compound, drug | Lymphosep, Lymphocyte Separation Media | Biowest | L0560 | |
| Chemical compound, drug | PBS Dulbecco’s Phosphate Buffered Saline w/o Magnesium, w/o Calcium | Biowest | L0615 | |
| Chemical compound, drug | FBS Superior; standardized Fetal Bovine Serum, EU-approved | Biochrom | S0615 | |
| Chemical compound, drug | Gentamycin Sulfate BioChemica | PanReac AppliChem | A1492 | |
| Chemical compound, drug | Penicillin G Potassium Salt BioChemica | PanReac AppliChem | A1837 | |
| Chemical compound, drug | Lipopolysaccharides from Escherichia coli O55:B5 | Sigma-Aldrich | L2880 |
Appendix 1—table 1
List of participating study sites where patients were hospitalized.
| Name of study site | City | Level of care | SOC (n) | SOC + anakinra (n) |
|---|---|---|---|---|
| 4th Department of Internal Medicine, ATTIKON University Hospital | Athens | Tertiary Academic | 17 | |
| 3rd Department of Internal Medicine, Sotiria General Hospital | Athens | Tertiary Academic | 26 | |
| 1st Department of Pulmonary Medicine, Sotiria General Hospital | Athens | Tertiary Academic | 25 | |
| AHEPA General Hospital COVID-19 unit I | Thessaloniki | Tertiary Academic | 43 | |
| AHEPA General Hospital COVID-19 unit II | Thessaloniki | Tertiary Academic | 32 | |
| University General Hospital of Larissa | Larissa | Tertiary Academic | 36 | |
| University General Hospital of Alexandroupolis, COVID-19 unit I | Alexandroupolis | Tertiary Academic | 18 | |
| University General Hospital of Alexandroupolis, COVID-19 unit II | Alexandroupolis | Tertiary Academic | 18 | |
| University General Hospital of Ioannina, COVID-19 unit I | Ioannina | Tertiary Academic | 3 | |
| University General Hospital of Ioannina, COVID-19 unit II | Ioannina | Tertiary Academic | 11 | |
| University General Hospital of Patras | Patras | Tertiary Academic | 15 | |
| 1st Department of Internal Medicine, Thriasio General Hospital | Athens | Tertiary NHS | 12 | |
| Department of Pulmonary Medicine, Kerkyra General Hospital | Kerkyra | Tertiary NHS | 4 |
-
Abbreviations N: number; NHS: national health system; SOC: standard-of-care.
Appendix 1—table 2
Anakinra as an independent protective factor from development of severe respiratory failure (SRF) by day 14 among patients treated with dexamethasone.
Univariate and multivariate (Cox forward conditional) models, for the anakinra with standard-of-care group (SOC) and parallel SOC comparators are presented. Only admission variables that differ significantly between patients who developed and those who did not develop SRF by day 14 are provided.
| Univariate analysis | Multivariate analysis | |||||
|---|---|---|---|---|---|---|
| Variable no. (%) | SRF (−) (N = 46) | SRF (+) (N = 53) | HR (95% CI) | p-value | HR (95% CI) | p-value |
| Anakinra treatment, n (%) | 31 (67.4) | 21 (39.6) | 0.55 (0.32–0.97) | 0.038 | 0.56 (0.32–0.97) | 0.038 |
| Soluble uPAR, ng/ml, median (Q1–Q3) | 9.60 (7.2–12.6) | 11.6 (7.3–12.6) | 1.10 (1.00–1.20) | 0.030 | 1.97 (1.14–3.41) | 0.018 |
| Ferritin, ng/ml, median (Q1–Q3) | 593.0 (411.3–968.5) | 633.0 (412.0–968.0) | 1.00 (1.00–1.00) | 0.025 | ||
-
Abbreviations: CI: confidence interval; HR: hazard ratio; n: number; Q: quartile; SRF: severe respiratory failure; uPAR: urokinase-type plasminogen activator receptor.
Appendix 1—table 3
Anakinra as an independent protective factor from 30-day mortality.
Univariate and multivariate (Cox forward conditional) models, for the anakinra with standard-of-care (SOC) group and parallel SOC comparators are presented. Only admission variables that differ significantly between patients who died and those who did not die are provided. Results are provided after four steps of analysis.
| Univariate analysis | Multivariate analysis | |||||
|---|---|---|---|---|---|---|
| Parameters, no. (%) | Survival (N = 216) | Death (N = 44) | HR (95% CI) | p-value | HR (95% CI) | p-value |
| Anakinra treatment, n(%) | 115 (53.2) | 15 (34.1) | 0.49 (0.26–0.91) | 0.024 | 0.49 (0.25–0.97) | 0.041 |
| Charlson’s comorbidity index, mean (SD) | 3 (2) | 4 (2) | 1.29 (1.13–1.48) | <0.0001 | 1.26 (1.09–1.48) | 0.002 |
| APACHE II score, mean (SD) | 6 (3) | 9 (3) | 1.24 (1.14–1.35) | <0.0001 | ||
| SOFA score, mean (SD) | 2 (1) | 3 (1) | 2.13 (1.73–2.63) | <0.0001 | 2.03 (1.61–2.55) | <0.0001 |
| Pneumonia severity index, mean (SD) | 67 (21) | 81 (18) | 3.66 (1.85–7.24) | <0.0001 | ||
| Severe COVID-19 by WHO classification, n (%) | 105 (48.6) | 37 (84.1) | 4.86 (2.17–10.92) | 0.0001 | ||
| Soluble uPAR, ng/ml, median (Q1–Q3) | 8.8 (6.8–11.4) | 10.4 (8.0–14.7) | 1.15 (1.05–1.26) | 0.003 | ||
| Lymphocytes/mm3, median (Q1–Q3) | 984 (699–1275) | 839 (545–1167) | 0.999 (0.99–1.00) | 0.024 | ||
| C-reactive protein, mg/l, median (Q1–Q3) | 50.7 (17.5–118.4) | 80.1 (18.7–156.7) | 1.003 (1.00–1.01) | 0.033 | ||
| PaO2/FiO2 mmHg, median (Q1–Q3) | 301 (224.6–374.4) | 195.8 (88.2–290.4) | 0.99 (0.98–0.99) | <0.0001 | ||
| History of type 2 diabetes mellitus, n (%) | 53 (24.5) | 20 (45.5) | 2.38 (1.31–4.31) | 0.004 | ||
| Treatment with third generation cephalosporin, n (%) | 93 (43.1) | 10 (22.7) | 0.43 (0.21–0.88) | 0.020 | ||
| Treatment with piperacillin/tazobactam, n (%) | 59 (27.3) | 20 (45.5) | 2.03 (1.11–3.69) | 0.021 | ||
| Treatment with remdesivir, n (%) | 11 (5.1) | 8 (18.6) | 3.22 (1.50–6.95) | 0.003 | 1.27 (1.09–1.47) | 0.002 |
-
Abbreviations: APACHE: acute physiology and chronic health evaluation; CI: confidence interval; HR: hazard ratio; n: number; PaO2/FiO2: ratio of partial oxygen pressure to the fraction of inspired oxygen; q: quartile; SD: standard deviation; SOFA: sequential organ failure assessment; uPAR: urokinase-type plasminogen activator receptor.
Additional files
-
Supplementary file 1
Protocol and statistical analysis plan.
- https://cdn.elifesciences.org/articles/66125/elife-66125-supp1-v2.docx
-
Transparent reporting form
- https://cdn.elifesciences.org/articles/66125/elife-66125-transrepform-v2.docx
Download links
A two-part list of links to download the article, or parts of the article, in various formats.
Downloads (link to download the article as PDF)
Open citations (links to open the citations from this article in various online reference manager services)
Cite this article (links to download the citations from this article in formats compatible with various reference manager tools)
An open label trial of anakinra to prevent respiratory failure in COVID-19
eLife 10:e66125.
https://doi.org/10.7554/eLife.66125


