Independent and interacting value systems for reward and information in the human brain
- Center for Research in Cognition & Neurosciences, ULB Neuroscience Institute, Université Libre de Bruxelles, Belgium
- Department of Experimental Psychology, Faculty of Brain Sciences, & The Max Planck UCL Centre for Computational Psychiatry and Ageing Research, University College London, United Kingdom
- Department of Experimental Psychology, Ghent University, Belgium
- Center for Complex Systems and Brain Sciences, Florida Atlantic University, United States
- Department of Psychology, Florida Atlantic University, United States
- Brain Institute, Florida Atlantic University, United States
Figures
Figure 1
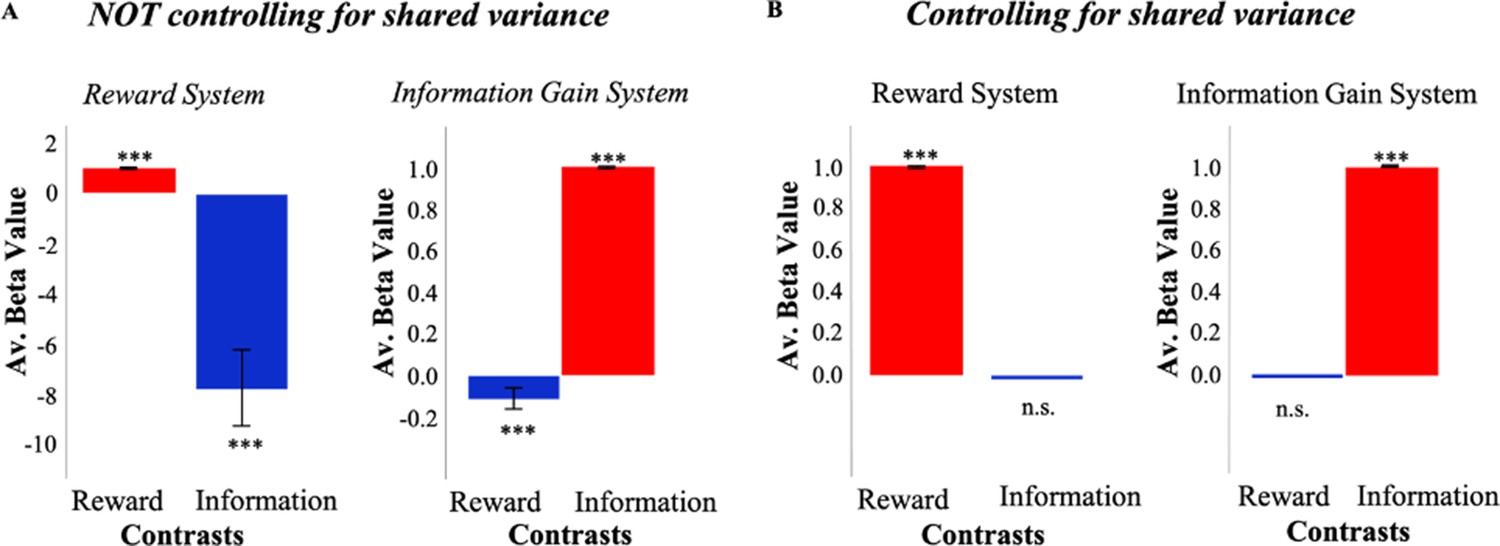
Simulations of a model with independent value systems.
(A) When not controlling for shared variance between reward and information, an RL model which consists of independent reward (RelReward) and information value systems (Information Gain; see Materials and methods for more details) shows overlapping activity between reward and information signals. To simulate activity of the reward system, a linear regression predicting RelReward with RelReward as independent variable was adopted in the reward contrast; while a linear regression predicting RelReward with Information Gain was used in the information contrast. To simulate activity of the information system, a linear regression predicting Information Gain with RelReward as independent variable was adopted in the reward contrast; while a linear regression predicting Information Gain with Information Gain as independent variable was adopted in the information contrast. The model was simulated 63 times and model parameters were selected in the range of those estimated in our human sample. The figure shows averaged betas for these linear regressions. A one-sample t-test was conducted to test significance against zero. (B) When controlling for the shared variance, reward and information activities from the same RL model do not overlap anymore. To account for the shared variance, RelReward and Information Gain predictors were orthogonalized using serial orthogonalization. We simulated activity for both the reward system and information system in the same fashion as explained in (A). The analysis of those activities was however different. In the information contrast, we entered the orthogonalized (with respect to RelReward) Information Gain as an independent variable, while in the reward contrast, we entered the orthogonalized (with respect to Information Gain) RelReward. In all the panels, * is p<0.05, ** is p<0.01, *** is p<0.001. RL, reinforcement Learning.
Figure 2
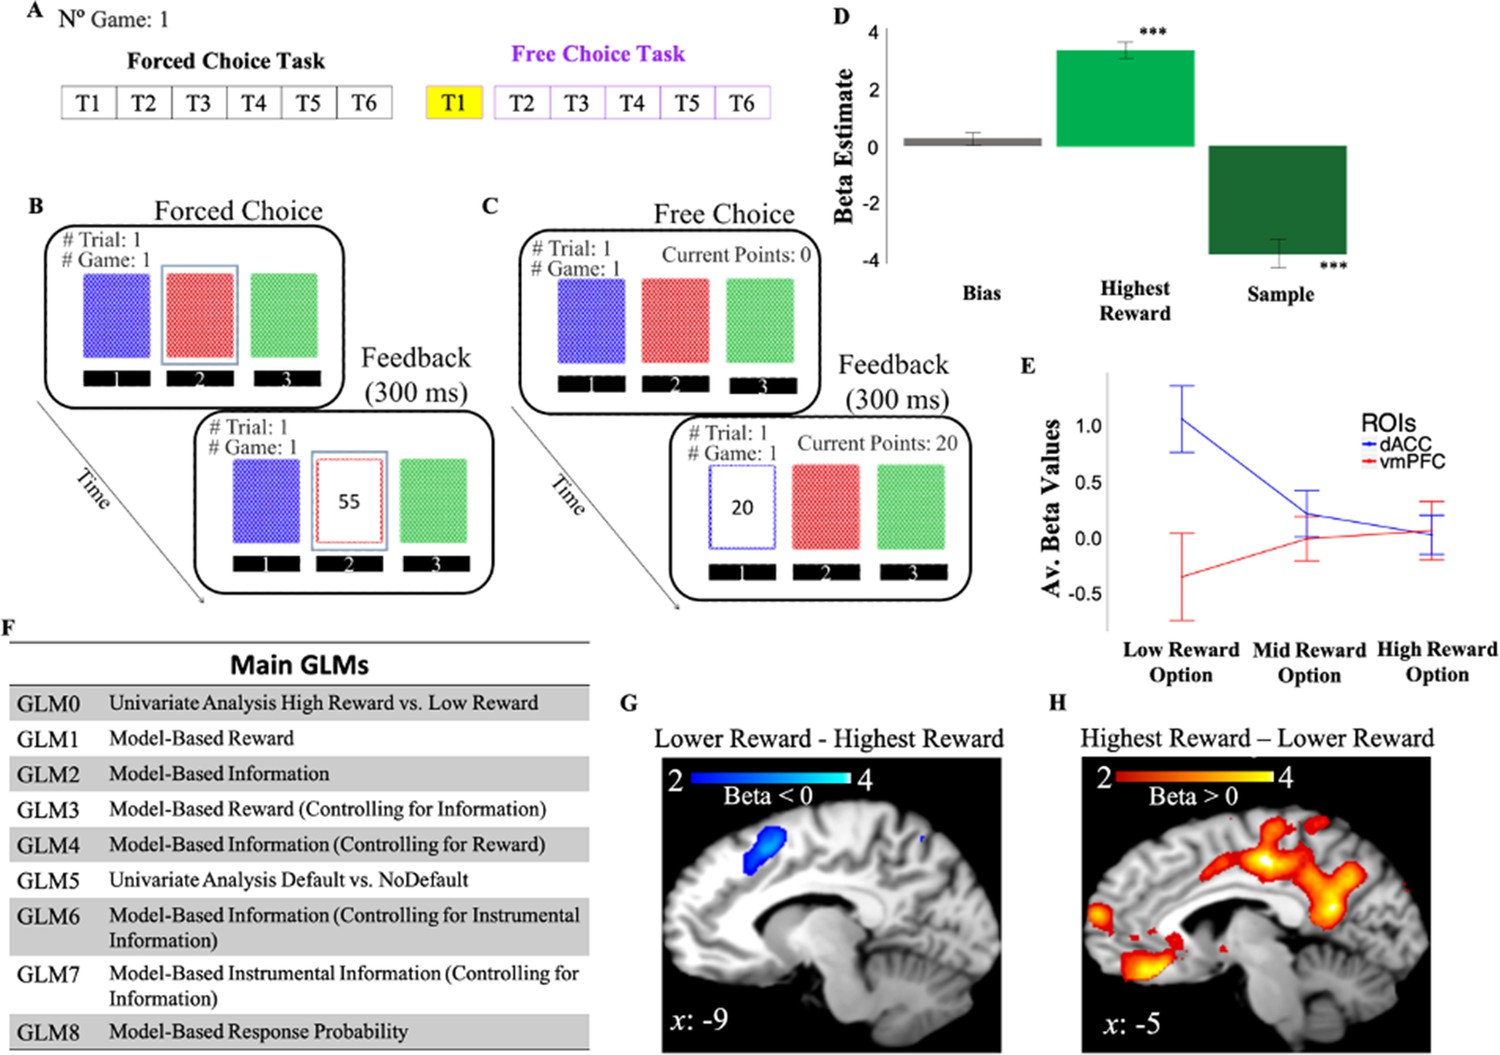
Behavioral task and behavior.
(A) One game of the behavioral task consisted of six consecutive forced-choice trials and from 1 to 6 free-choice trials. fMRI analyses focused on the first free-choice trial (shown in yellow). (B) In the forced-choice task, participants chose a pre-selected deck of cards (outlined in blue). (C) In the free-choice task, they were instead free to choose a deck of cards in order to maximize the total number of points. (D) Participants’ behavior was predicted by both experienced reward (Highest Reward) and the number of times the options were chosen in previous trials (Sample). The figure shows beta weights from a logistic regression with participants’ exploitative choices as dependent variable and Highest Reward and Sample as independent variables. Exploitative choices were classified as those choices in which participants chose the option in the first free-choice trial associated with the highest average of points collected during the forced-choice task of the same game. (E) DACC and vmPFC activities follow a symmetrical opposite pattern. Activity is split as a function of reward levels (low, mid, and high). (F) Main GLMs adopted in the fMRI analyses. (G) DACC activity correlates with selecting the lower reward option. (H) VMPFC activity correlates with selecting the highest reward option. Activity scale represents z-score. dACC, dorsal anterior cingulate cortex; fMRI, functional magnetic resonance imaging; vmPFC, ventromedial prefrontal cortex.
Figure 3
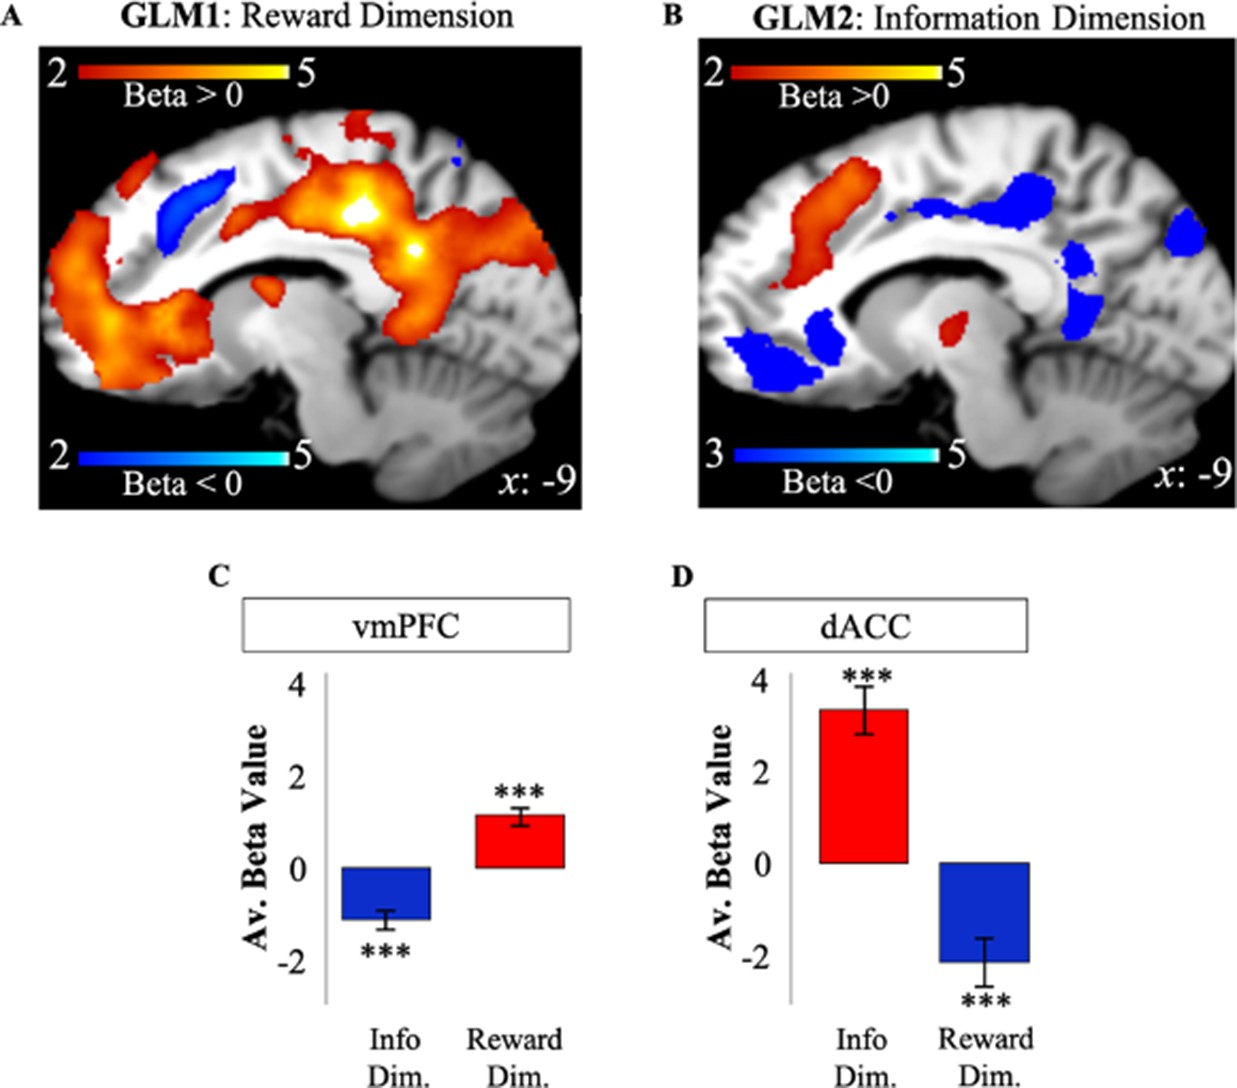
Apparent overlapping activity between reward and information.
(A) VMPFC positively correlated with model-based relative reward value for the selected option (in red), while dACC negatively correlated with it (in blue). (B) DACC (in red) positively correlated with model-based information gain, while vmPFC negatively correlated with it (in blue). Activity scale represents z-score. (C) Averaged BOLD beta estimates for vmPFC in GLM1 (Reward Dim.=Reward Dimension) and GLM2 (Info Dim.=Information Dimension). (D) Averaged BOLD beta estimates for dACC in GLM1 (Reward Dim.=Reward Dimension) and GLM2 (Info Dim.=Information Dimension). In all the panels, * is p<0.05, ** is p<0.01, *** is p<0.001. dACC, dorsal anterior cingulate cortex; vmPFC, ventromedial prefrontal cortex.
Figure 4
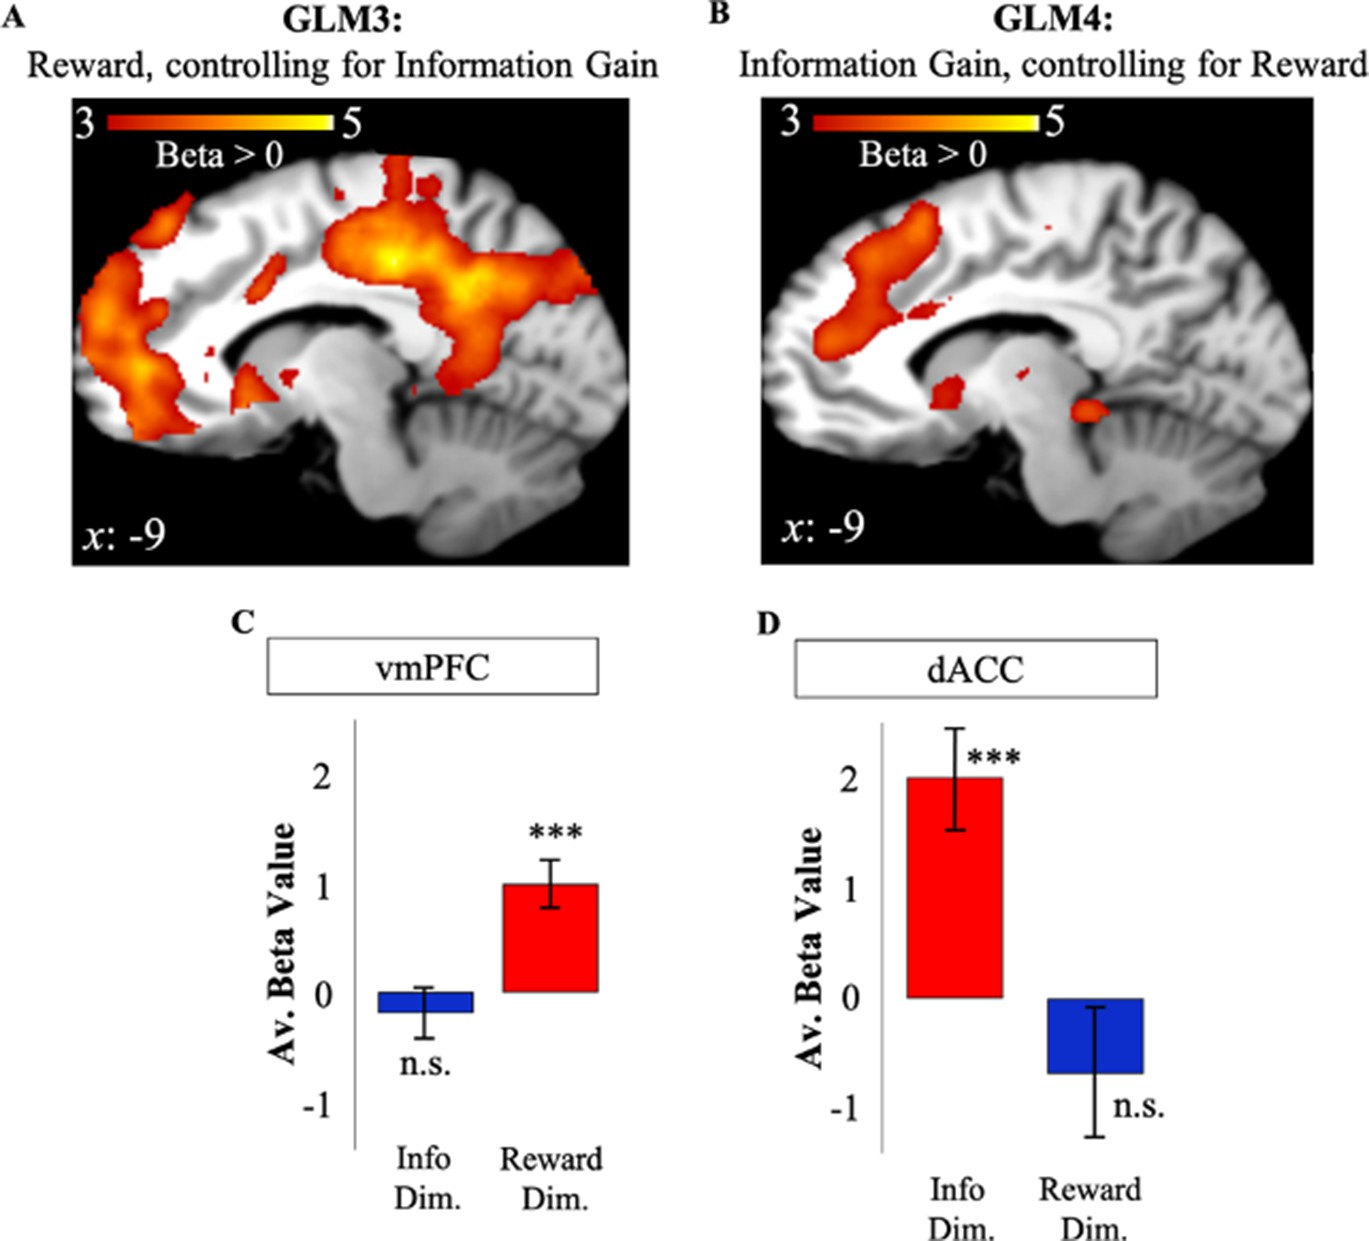
Independent value systems for reward and information in PFC.
(A) After controlling for information (GLM3), vmPFC activity (in red) positively correlated with model-based relative reward value (RelReward), while no correlations were observed for dACC. (B) After controlling for reward (GLM4), dACC activity (in red) positively correlated with model-based information gain (Information Gain), while no correlation was observed for vmPFC. Averaged BOLD beta estimates for vmPFC in GLM1 (Reward Dim.=Reward Dimension) and GLM2 (Info Dim.=Information Dimension). (D) Averaged BOLD beta estimates for dACC in GLM1 (Reward Dim.=Reward Dimension) and GLM2 (Info Dim.=Information Dimension). In all the panels, * is p<0.05, ** is p<0.01, *** is p<0.001. dACC, dorsal anterior cingulate cortex; vmPFC, ventromedial prefrontal cortex.
Figure 5
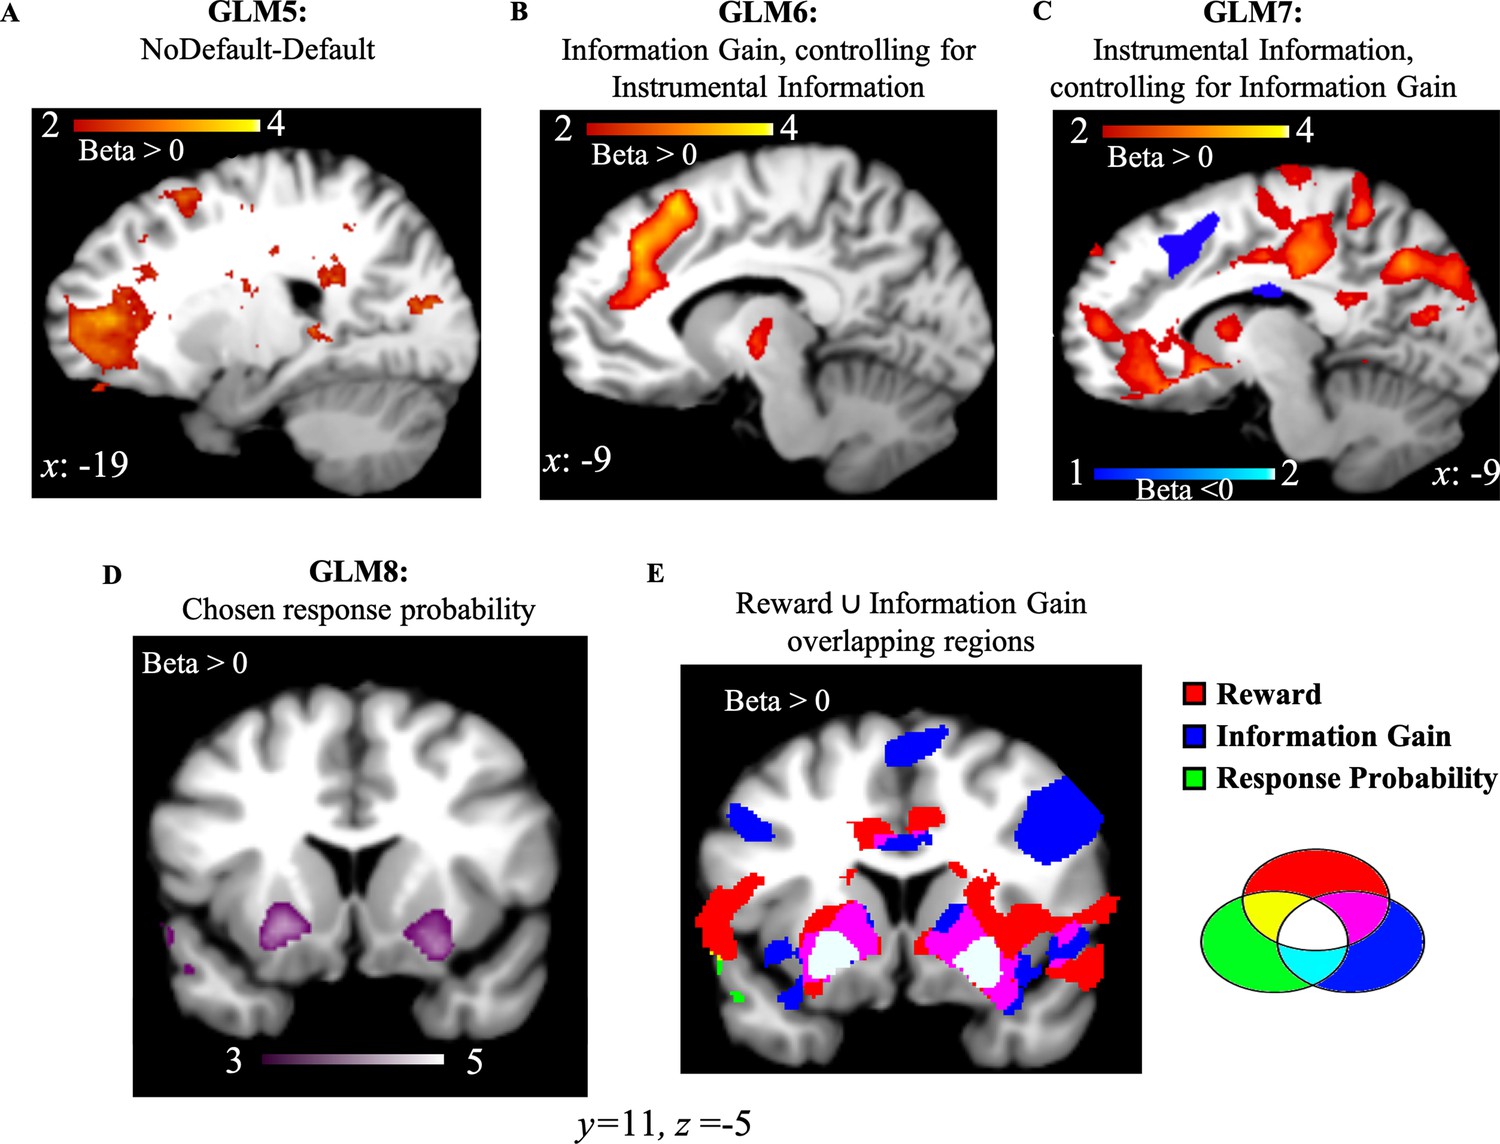
NoDefault vs. default behavior, instrumental information and combination of reward and information signals in subcortical regions.
(A) Activity in the frontopolar region—a region often associated with exploration—correlated with NoDefault behavior (not choosing the most informative options)—Default behavior (choosing most informative options). (B) Activity in dACC correlated with Information Gain after controlling for the variance explained by the instrumental value of information. (C) Activity in vmPFC and dACC correlated with the instrumental value of information after accounting for the variance explained by Information Gain. (D) Activity in the ventral putamen (striatum region) correlated with response probabilities derived from the RL model. (E) RelReward, Information Gain, and response probabilities overlap in the striatum region (in white). Activity scale represents z-score. dACC, dorsal anterior cingulate cortex; RL, reinforcement Learning; vmPFC, ventromedial prefrontal cortex.
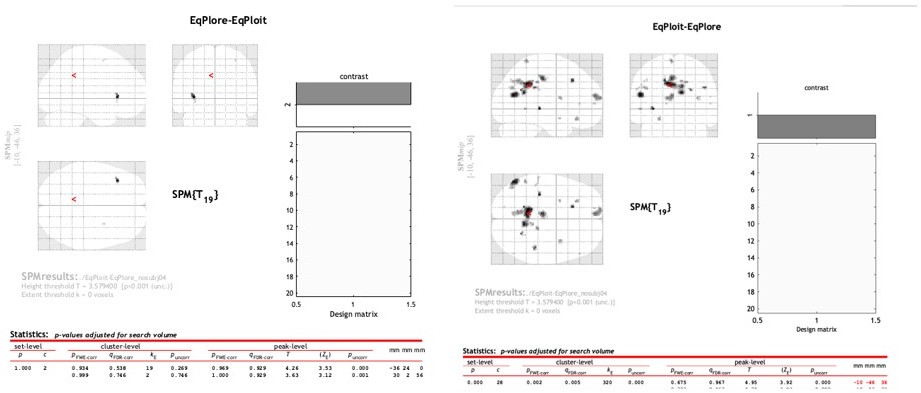
Author response image 1
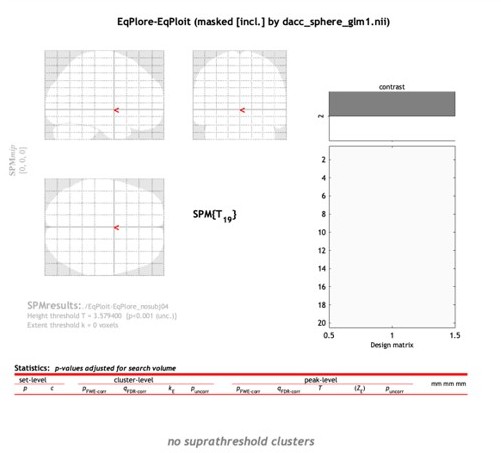
Author response image 2
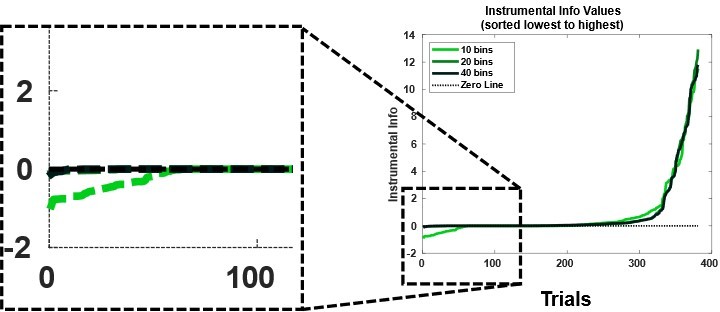
Author response image 3
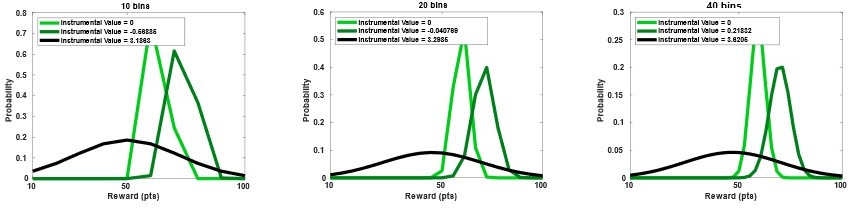
Author response image 4
Author response image 5
Author response image 6
Author response image 7
Author response image 8
Tables
Author response table 1
| Subject | Pvalues |
|---|---|
| Subject2 | 0.698 |
| Subject3 | 0.926 |
| Subject5 | 0.878 |
| Subject6 | 0.9 |
| Subject7 | 0.844 |
| Subject8 | 0.988 |
| Subject9 | 0.73 |
| Subject10 | 0.866 |
| Subject11 | 0.968 |
| Subject12 | 0.38 |
| Subject13 | 0.98 |
| Subject14 | 0.476 |
| Subject15 | 0.198 |
| Subject16 | 0.958 |
| Subject17 | 0.92 |
| Subject18 | 0.34 |
| Subject19 | 0.998 |
| Subject20 | 0.922 |
| Subject21 | 0.976 |
| Subject22 | 0.666 |
Additional files
-
Supplementary file 1
Model estimated parameters from participants’ behavior.
The table shows parameter estimates after fitting the model to participants’ data. Group mean and standard deviation are also reported for each parameter.
- https://cdn.elifesciences.org/articles/66358/elife-66358-supp1-v2.docx
-
Supplementary file 2
Individual BICs.
The table shows individual BIC for both standard RL and gkRL.
- https://cdn.elifesciences.org/articles/66358/elife-66358-supp2-v2.docx
-
Supplementary file 3
Correlation of covariates with relative reward value.
The table shows correlation coefficients between relative reward value and the covariates for each subject.
- https://cdn.elifesciences.org/articles/66358/elife-66358-supp3-v2.docx
-
Supplementary file 4
GLMs for fMRI data.
The table shows the 17 GLMs adopted in the fMRI data analysis all referring to activity associated with the onset of the first-free-choice trial. GLM0 and 5 are the univariate analyses, whereas the other GLMs relate with the model-based analysis.
- https://cdn.elifesciences.org/articles/66358/elife-66358-supp4-v2.docx
-
Supplementary file 5
Brain activity no reported in the text.
The table shows brain activity not reported in the main text. PCC: Posterior Cingulate Cortex; mOFC: medial Orbitofrontal Cortex; aInsula: anterior Insula.
- https://cdn.elifesciences.org/articles/66358/elife-66358-supp5-v2.docx
-
Supplementary file 6
Brain activity in GLM1bis.
The figure shows brain activity in GLM1bis
- https://cdn.elifesciences.org/articles/66358/elife-66358-supp6-v2.docx
-
Supplementary file 7
Brain activity in GLM4bis.
The figure shows brain activity in GLM4bis
- https://cdn.elifesciences.org/articles/66358/elife-66358-supp7-v2.docx
-
Supplementary file 8
Brain activity in GLM4rew.
The figure shows brain activity in GLM4rew.
- https://cdn.elifesciences.org/articles/66358/elife-66358-supp8-v2.docx
-
Supplementary file 9
Brain activity in GLM3bis.
The figure shows brain activity in GLM3bis
- https://cdn.elifesciences.org/articles/66358/elife-66358-supp9-v2.docx
-
Supplementary file 10
Brain activity in GLM4diff.
The figure shows brain activity in GLM4diff
- https://cdn.elifesciences.org/articles/66358/elife-66358-supp10-v2.docx
-
Supplementary file 11
Information gain and omega parameter.
- https://cdn.elifesciences.org/articles/66358/elife-66358-supp11-v2.docx
-
Transparent reporting form
- https://cdn.elifesciences.org/articles/66358/elife-66358-transrepform1-v2.pdf
Download links
A two-part list of links to download the article, or parts of the article, in various formats.
Downloads (link to download the article as PDF)
Open citations (links to open the citations from this article in various online reference manager services)
Cite this article (links to download the citations from this article in formats compatible with various reference manager tools)
Independent and interacting value systems for reward and information in the human brain
eLife 11:e66358.
https://doi.org/10.7554/eLife.66358


