Fast deep neural correspondence for tracking and identifying neurons in C. elegans using semi-synthetic training
- Department of Physics, Princeton University, United States
- Princeton Neuroscience Institute, Princeton University, United States
- Department of Statistics, Stanford University, United States
- Wu Tsai Neurosciences Institute, Stanford University, United States
Figures
Figure 1
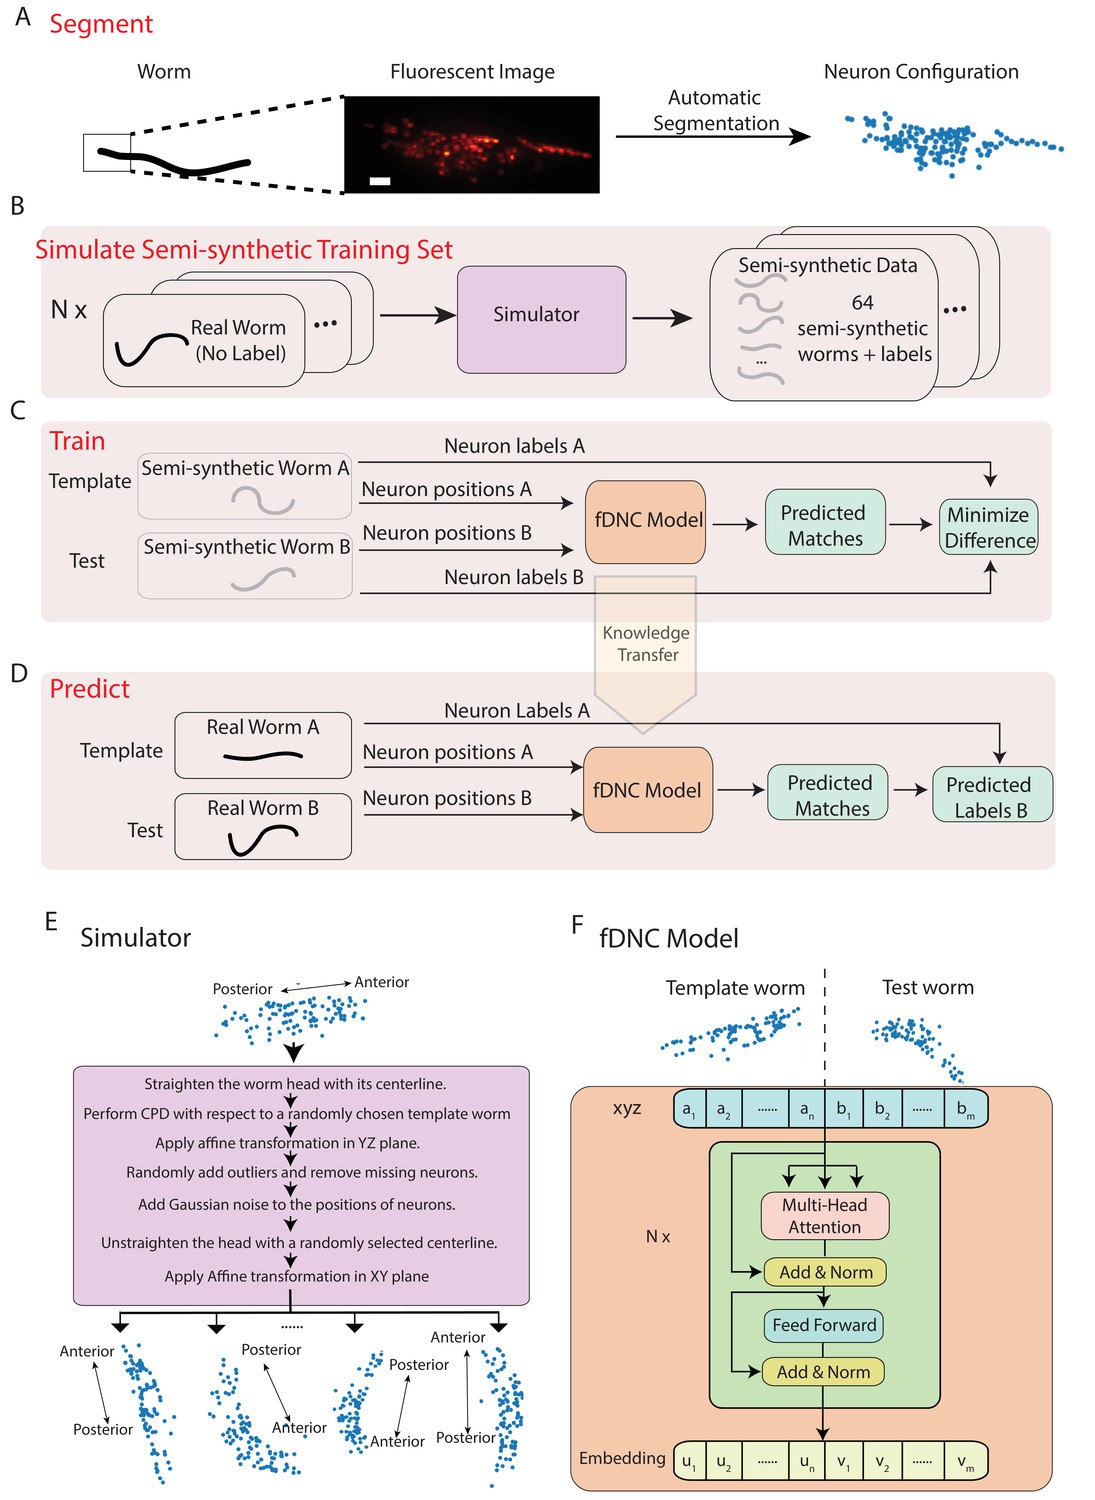
Fast deep neural correspondence model.
(A–D) Schematic of training and analysis pipeline for using the fast Deep Neural Correspondence (fDNC) model to predict correspondence between neurons across individuals. (A) Volumetric images of fluorescent labeled neuronal nuclei are segmented to extract neuron positions. (Scale bar, 10 µm). (B) Semi-synthetic training data is generated with a simulator. The simulator transforms the neural positions of a real worm and introduces noise to generate new semi-synthetic individuals. Approximately neuron configurations without labels from 12 moving worms were used to generate 2.304 × 10⁵ labeled semi-synthetic worms for training. (C) During training, the fDNC model finds optimal internal parameters to minimize the difference between predicted neural correspondence and true correspondence in pairs of semi-synthetic worms. (D) Given positions for neurons in real worm A and positions for neurons in real worm B, the trained model predicts correspondences between them. Furthermore,if labels for neurons in A are known, the model can then assign corresponding labels to neurons in worm B. (E) Detailed schematic of the simulator from panel B. (F) Transformer architecture of the fDNC model. The position features of a template worm with neurons and a test worm with neurons are taken as input. The features are computed via a multi-head attention mechanism. ‘Add and Norm’ refers to an addition and layer normalization step. and are neuron positions and and are embeddings for the template and test, respectively. We choose the number of layers and the embedding dimension by evaluating the performance on a held-out validation set.
Figure 2 with 1 supplement
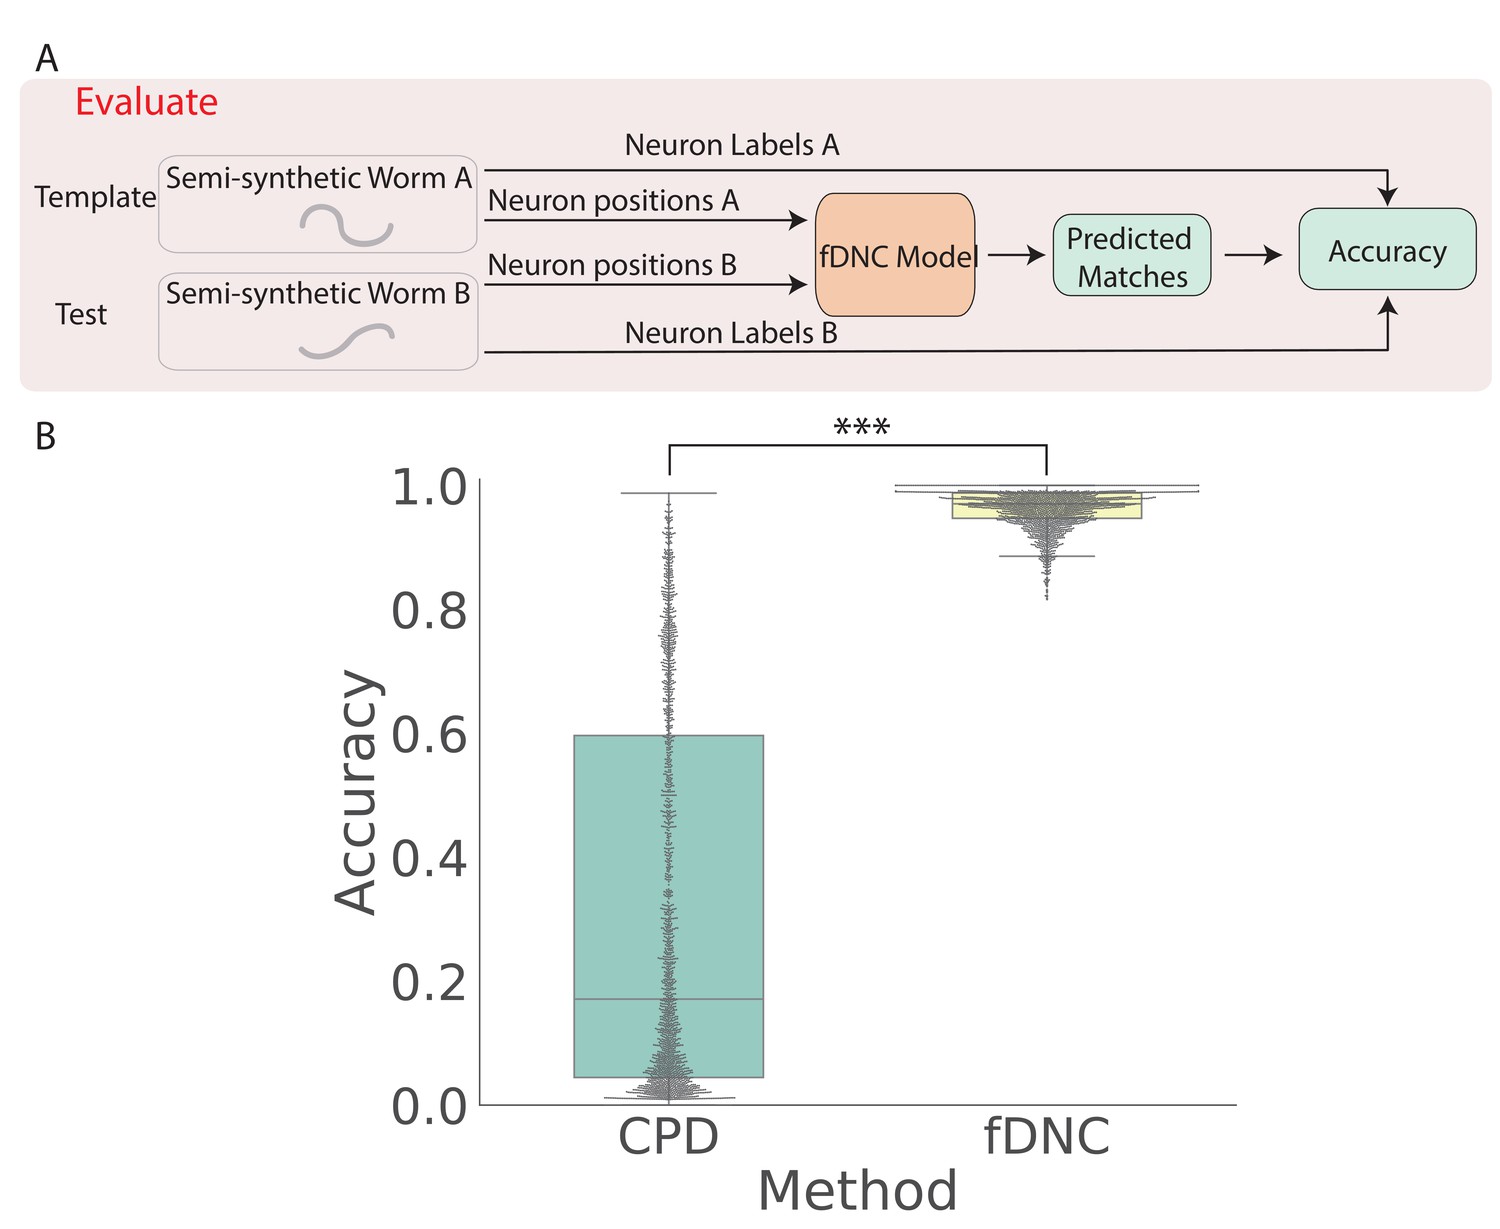
fDNC accurately predicts matches between neuron from semi-synthetic worms (A) Schematic of evaluation pipeline.
fDNC model performance is evaluated on pairs of semi-synthetic worms with known correspondence that had been held out from training. Given neural positions in worms A and B, the model predicts matches between A and B. Accuracy is the number of correctly predicted matches divided by the total number of ground truth matches for the A-B pair. (B) Model performance of a Coherent Point Drift Registration (CPD) is compared to the fDNC model on 2000 randomly selected pairs of held-out semi-synthetic individuals, without replacement. (, Wilcoxon signed rank test).
Figure 2—figure supplement 1
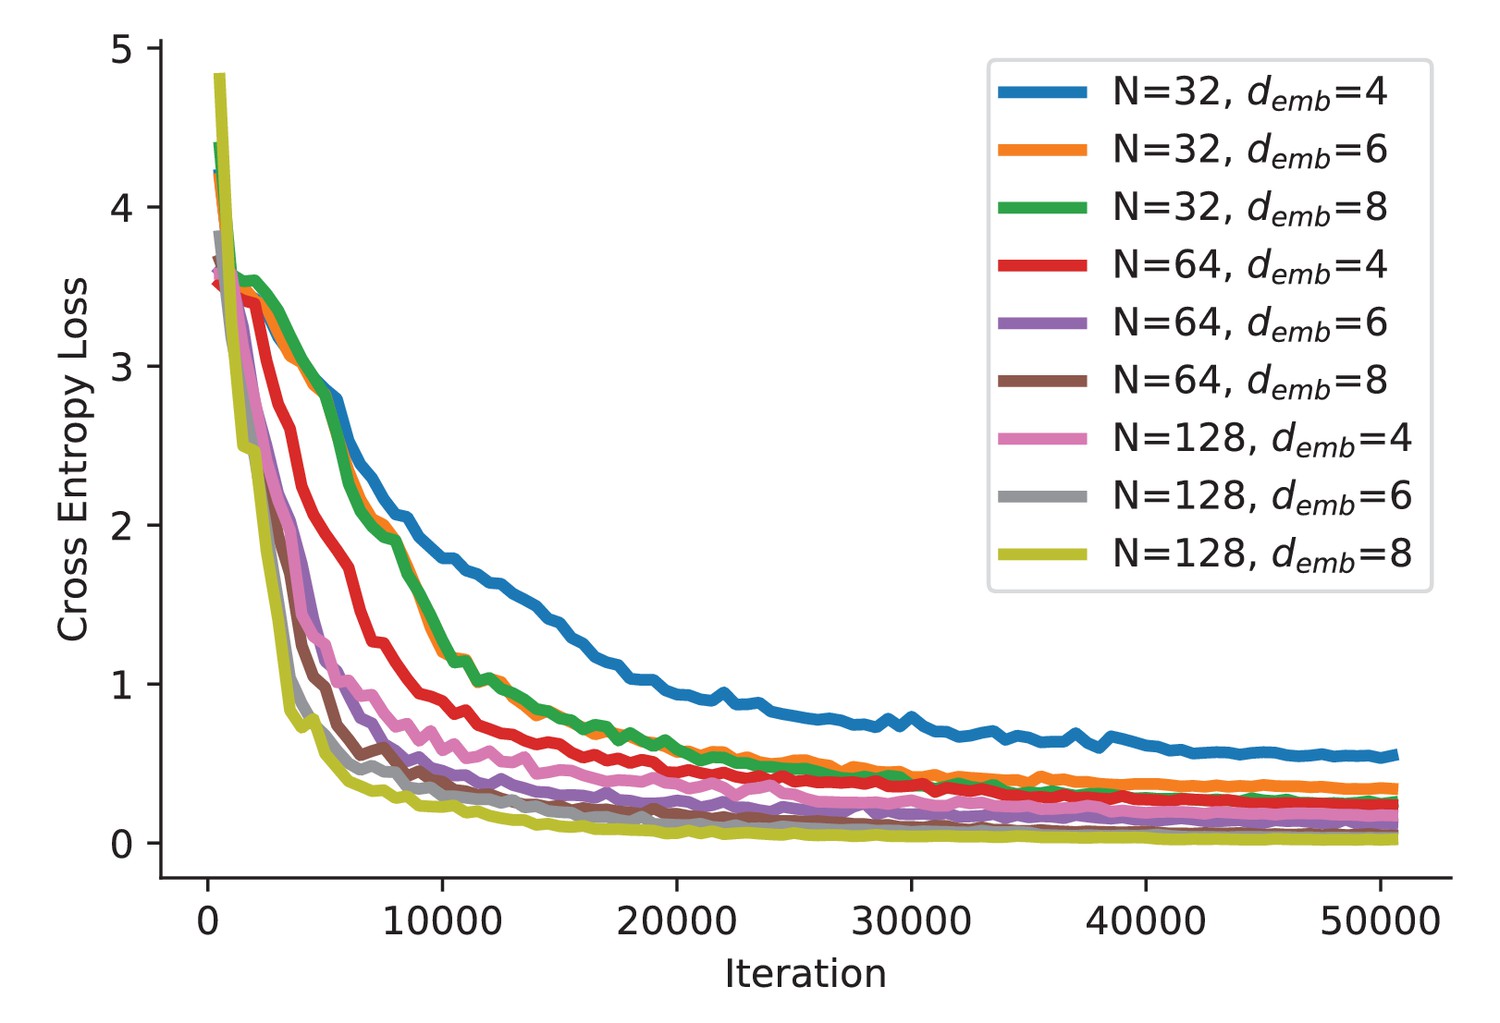
fDNC model training curve.
The loss was evaluated on a held-out test set consisting of 12,800 semi-synthetic worms for every 500 iterations.
Figure 3 with 1 supplement
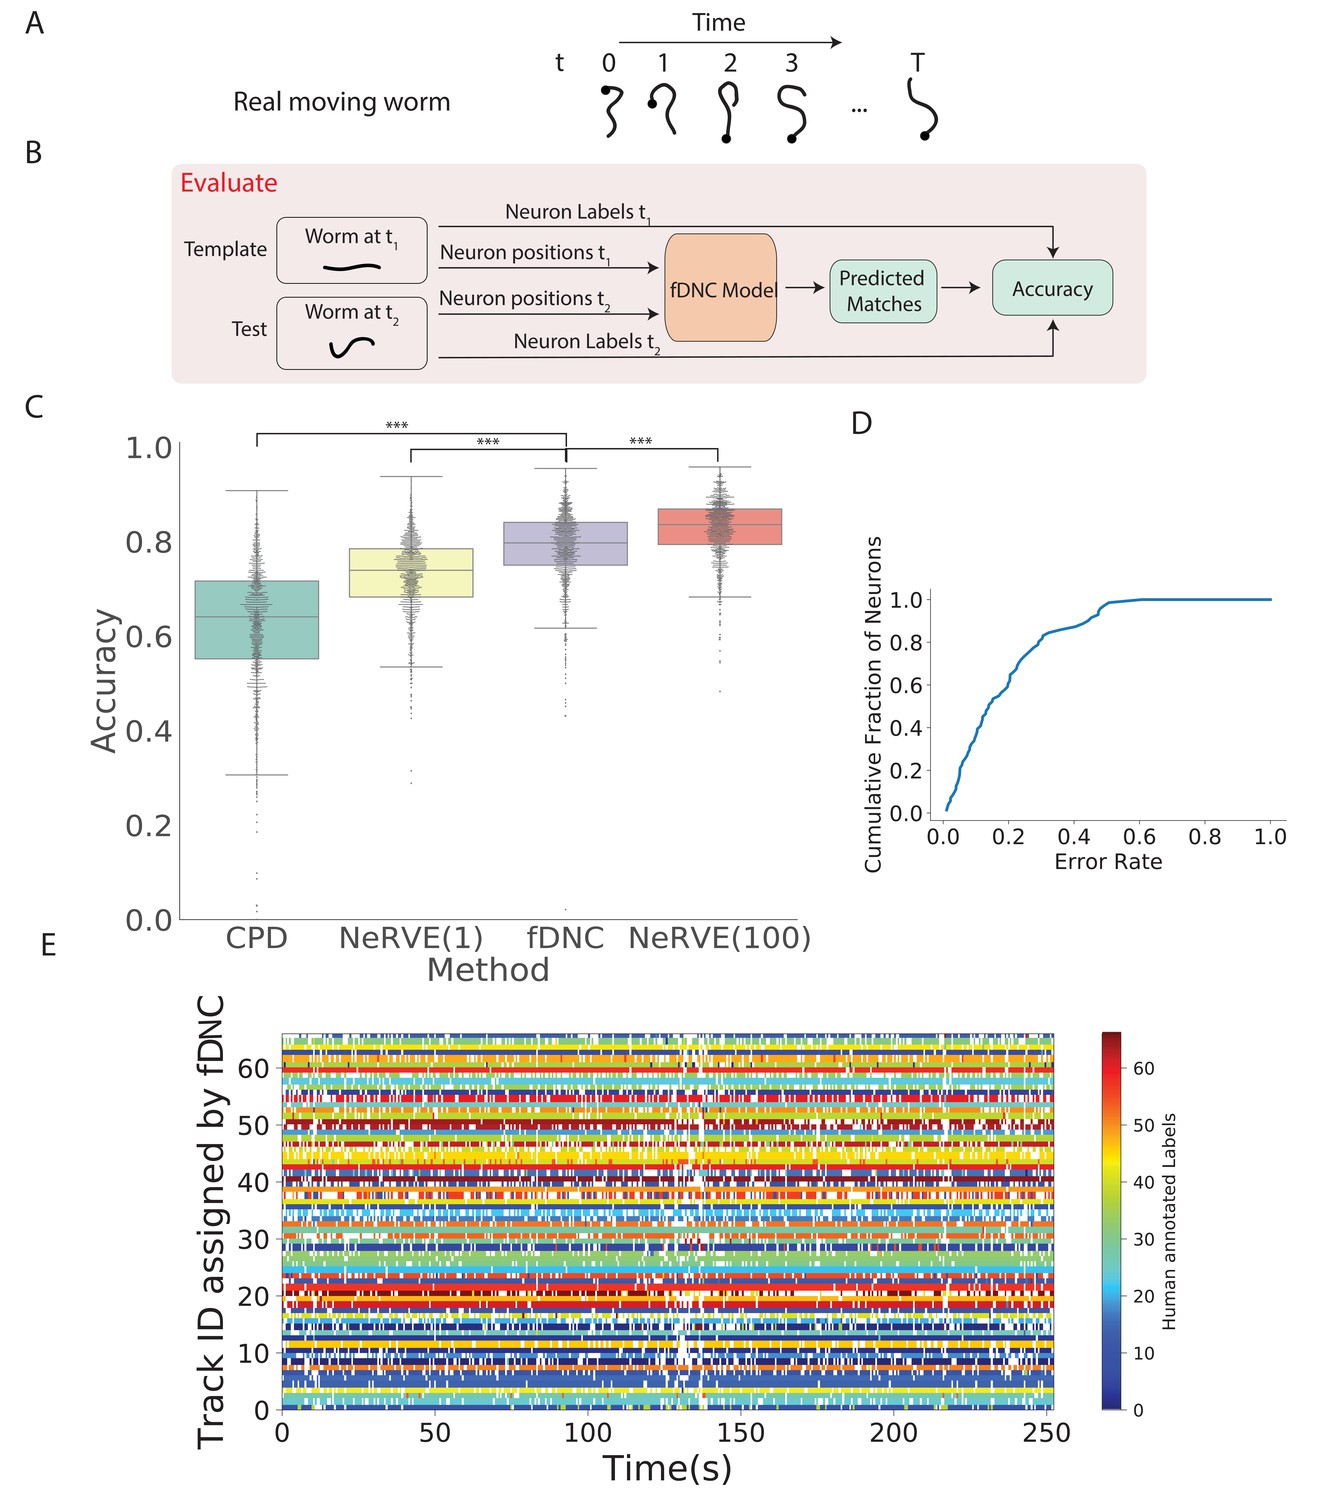
Tracking neurons within an individual across time.
(A) Schematic shows how the pose and orientation of a freely moving animal change with time. Black dot indicates head. (B) Pipeline to evaluate the fDNC model at tracking neurons within an individual across time. The fDNC model takes in positional features of a template neuron configuration from one time t1 of a freely moving worm, and predicts the correspondence at another time t2, called the test. Recording is of a moving animal undergoing calcium imaging from Nguyen et al., 2017. Ground truth neuron correspondence are provided by manual human annotation. The same time point is used as the template for all 1513 template-test pairs. (C) Performance of fDNC and alternative models at tracking neurons within an individual are displayed in order of mean performance. CPD refers to Coherent Point Drift. NeRVE(1) refers to the restricted NeRVE model that has access to only the same template as CPD and fDNC. NeRVE(100) refers to the full NeRVE model which uses 100 templates from the same individual to make a single prediction. A Wilcoxon signed rank significance test of fDNC’s performance compared to CPD, NeRVE(1) and NeRVE(100) yields and , respectively. Boxplots show median and interquartile range. (D) fDNC tracking performance by neuron. Cumulative fraction of neurons is shown as a function of the acceptable error rate. (E) Detailed comparison of fDNC tracking to human annotation of a moving GCaMP recording from Nguyen et al., 2017. Color at each time point indicates the neuron label manually annotated by a human. White gaps indicate that the neuron is missing at that time point. In the case of perfect agreement between human and fDNC, each row will have only a single color or white.
Figure 3—figure supplement 1
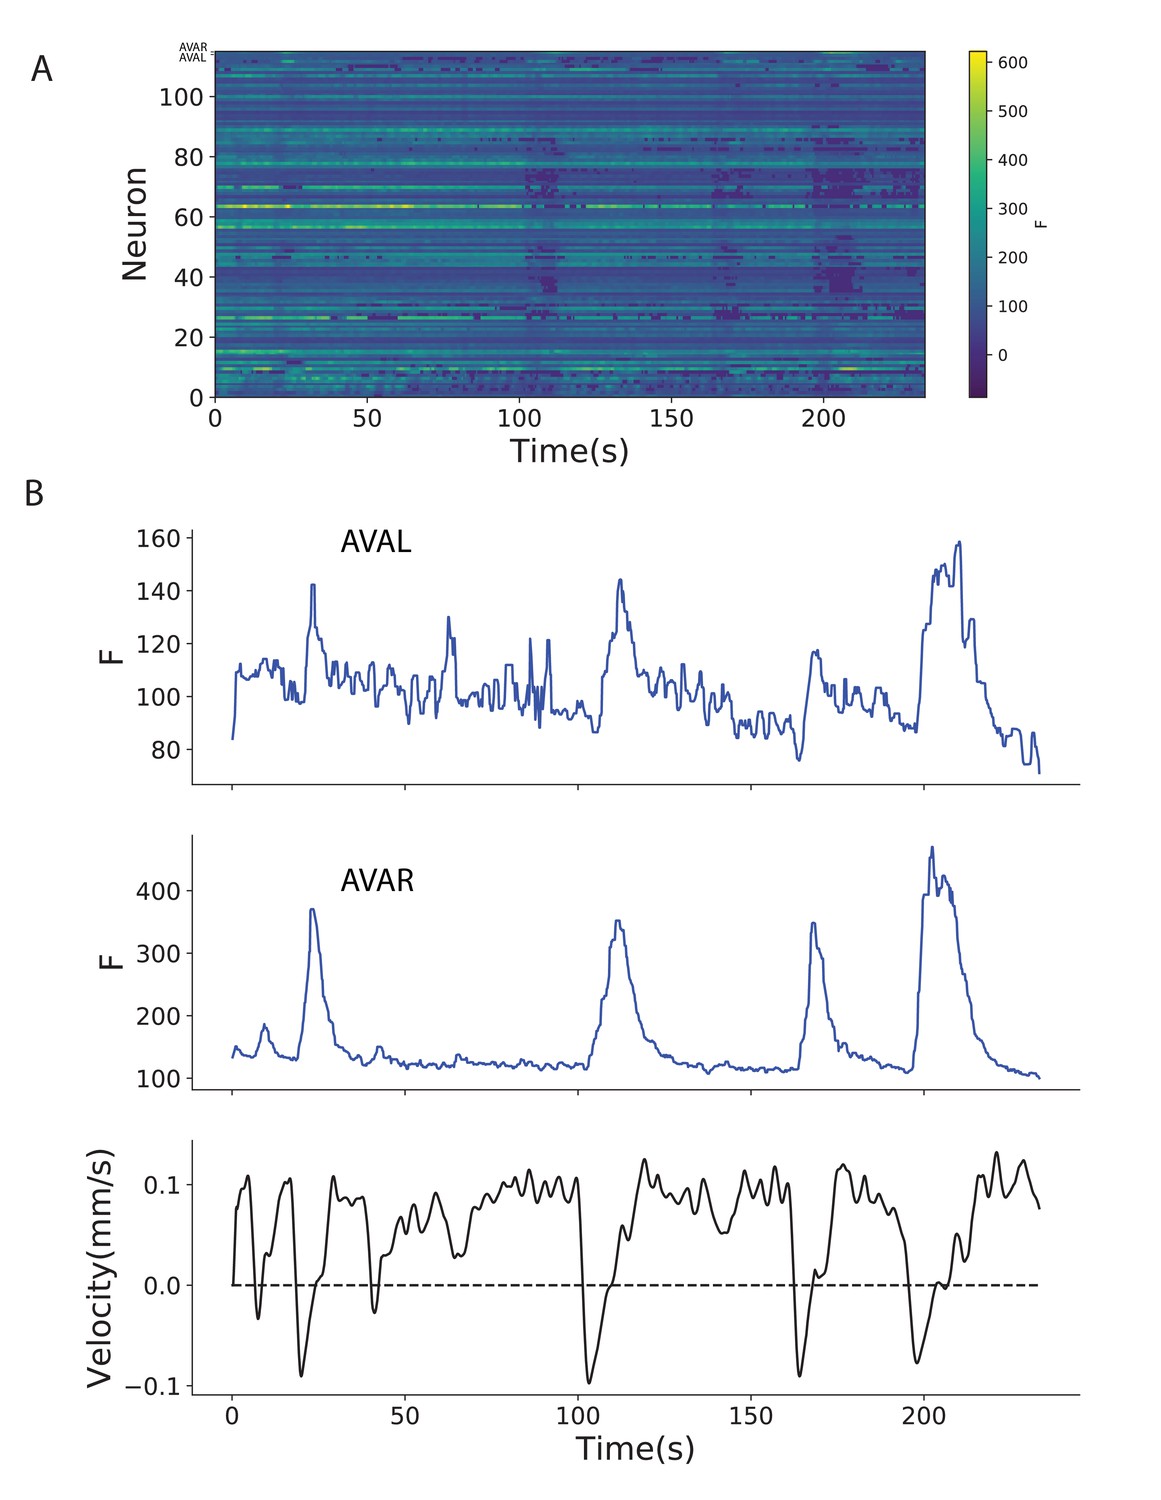
Example of fDNC used to track neurons during free moving calcium imaging.
fDNC applied to a published calcium imaging dataset of a freely moving worm with an additional label in neurons AVAL and AVAR (Hallinen et al., 2021). (a) Calcium activity extracted using fDNC. (b) Neurons AVAL and AVAR exhibit expected calcium transients when the worm exhibits negative velocity. AVAL and AVAR’s identity were confirmed by cell-specific BFP expression. The fDNC model was blinded to the BFP channel.
Figure 4
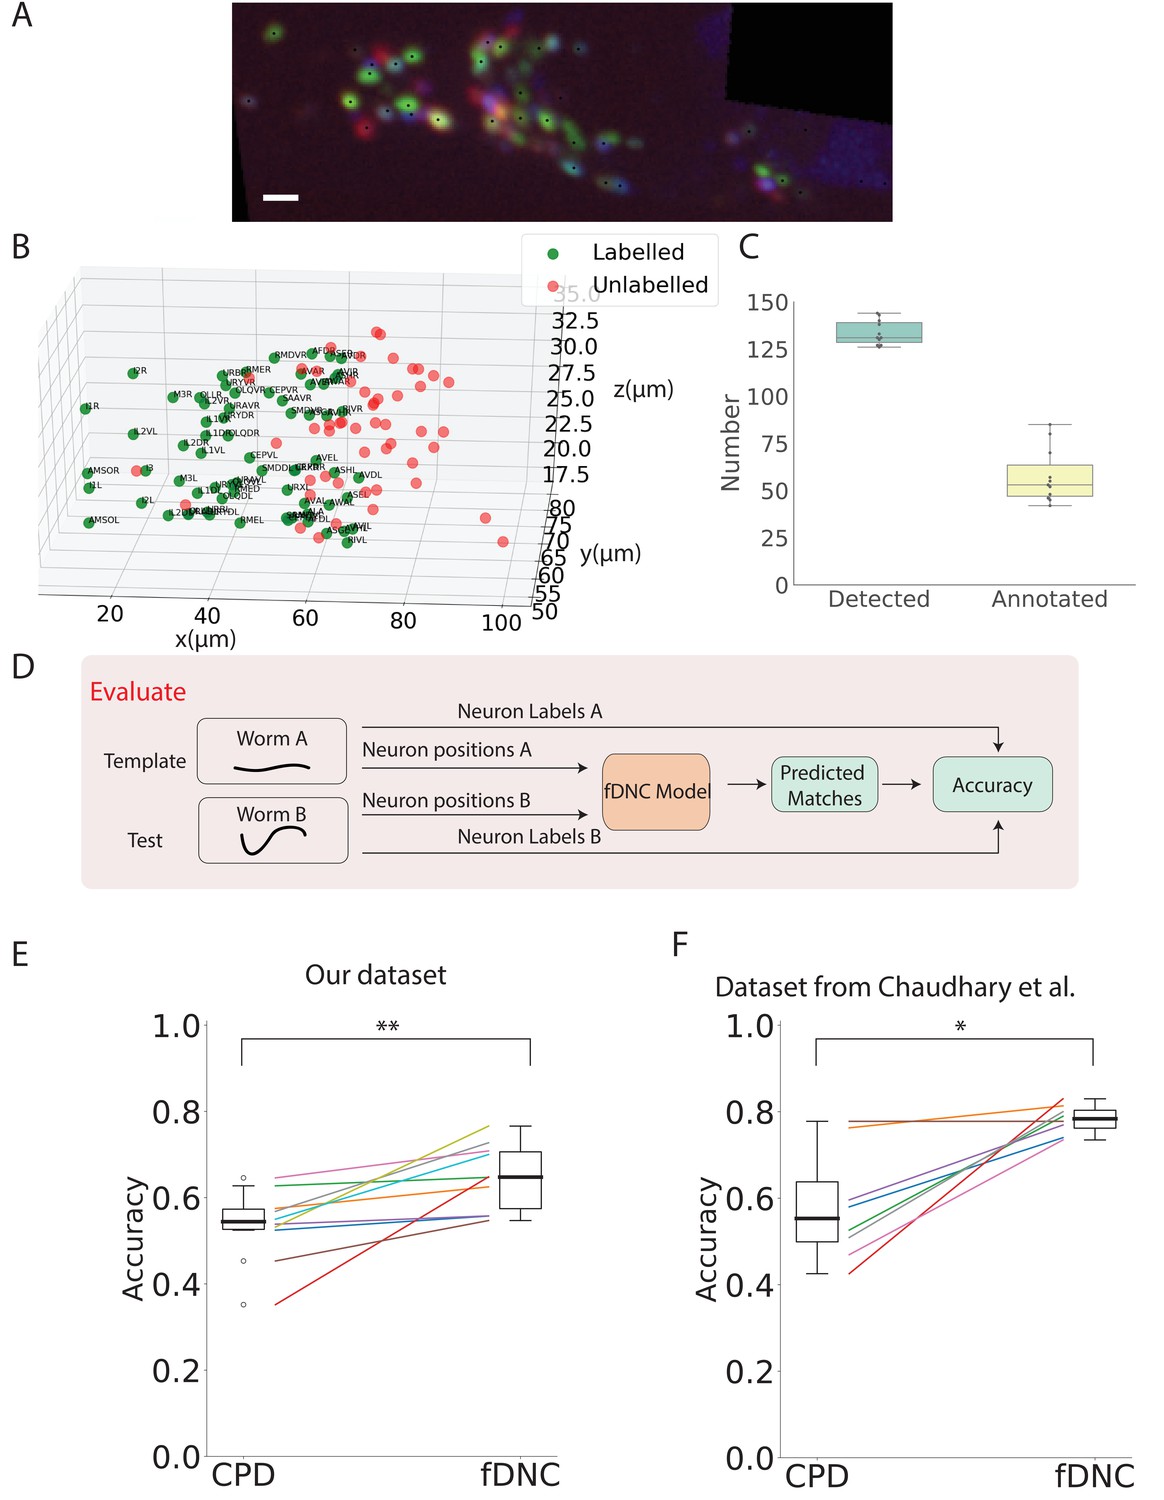
fDNC model finds neural correspondence across individuals.
(A) Fluorescence image shows neuronal nuclei of a NeuroPAL worm. A single optical slice is shown from an optical stack. (Scale bar, 10 µm). Genetically encoded color labels in NeuroPAL animals aid ground truth manual neural identification (Yemini et al., 2021) and are used here to evaluate performance. Black dots indicate neurons found via automatic segmentation. (B) Locations of all segmented neurons from A. Neurons that additionally have a human annotated label are shown in green. Those that a human was unable to label are red. (C) Number of segmented neurons (mean 133.6) and subset of those that were given human annotations (mean 57.5) is shown for 11 NeuroPAL individuals. Box plot shows median and interquartile range. (D) Pipeline to evaluate fDNC model performance across NeuroPAL individual is shown. Predicted labels are compared with human annotated labels to compute accuracy. (E) Performance of the fDNC model and CPD is shown evaluated on NeuroPAL recordings using position information alone. Accuracy is the fraction of labeled neurons present in both test and template that are correctly matched. Performance is evaluated on 10 pairs of 11 recordings, where the template is always the same (Worm A). (, Wilcoxon signed-rank test). (F) Performance evaluated on a separate publicly accessible dataset of nine NeuroPAL individuals from Chaudhary et al., 2021 (, Wilcoxon signed-rank test).
Figure 5
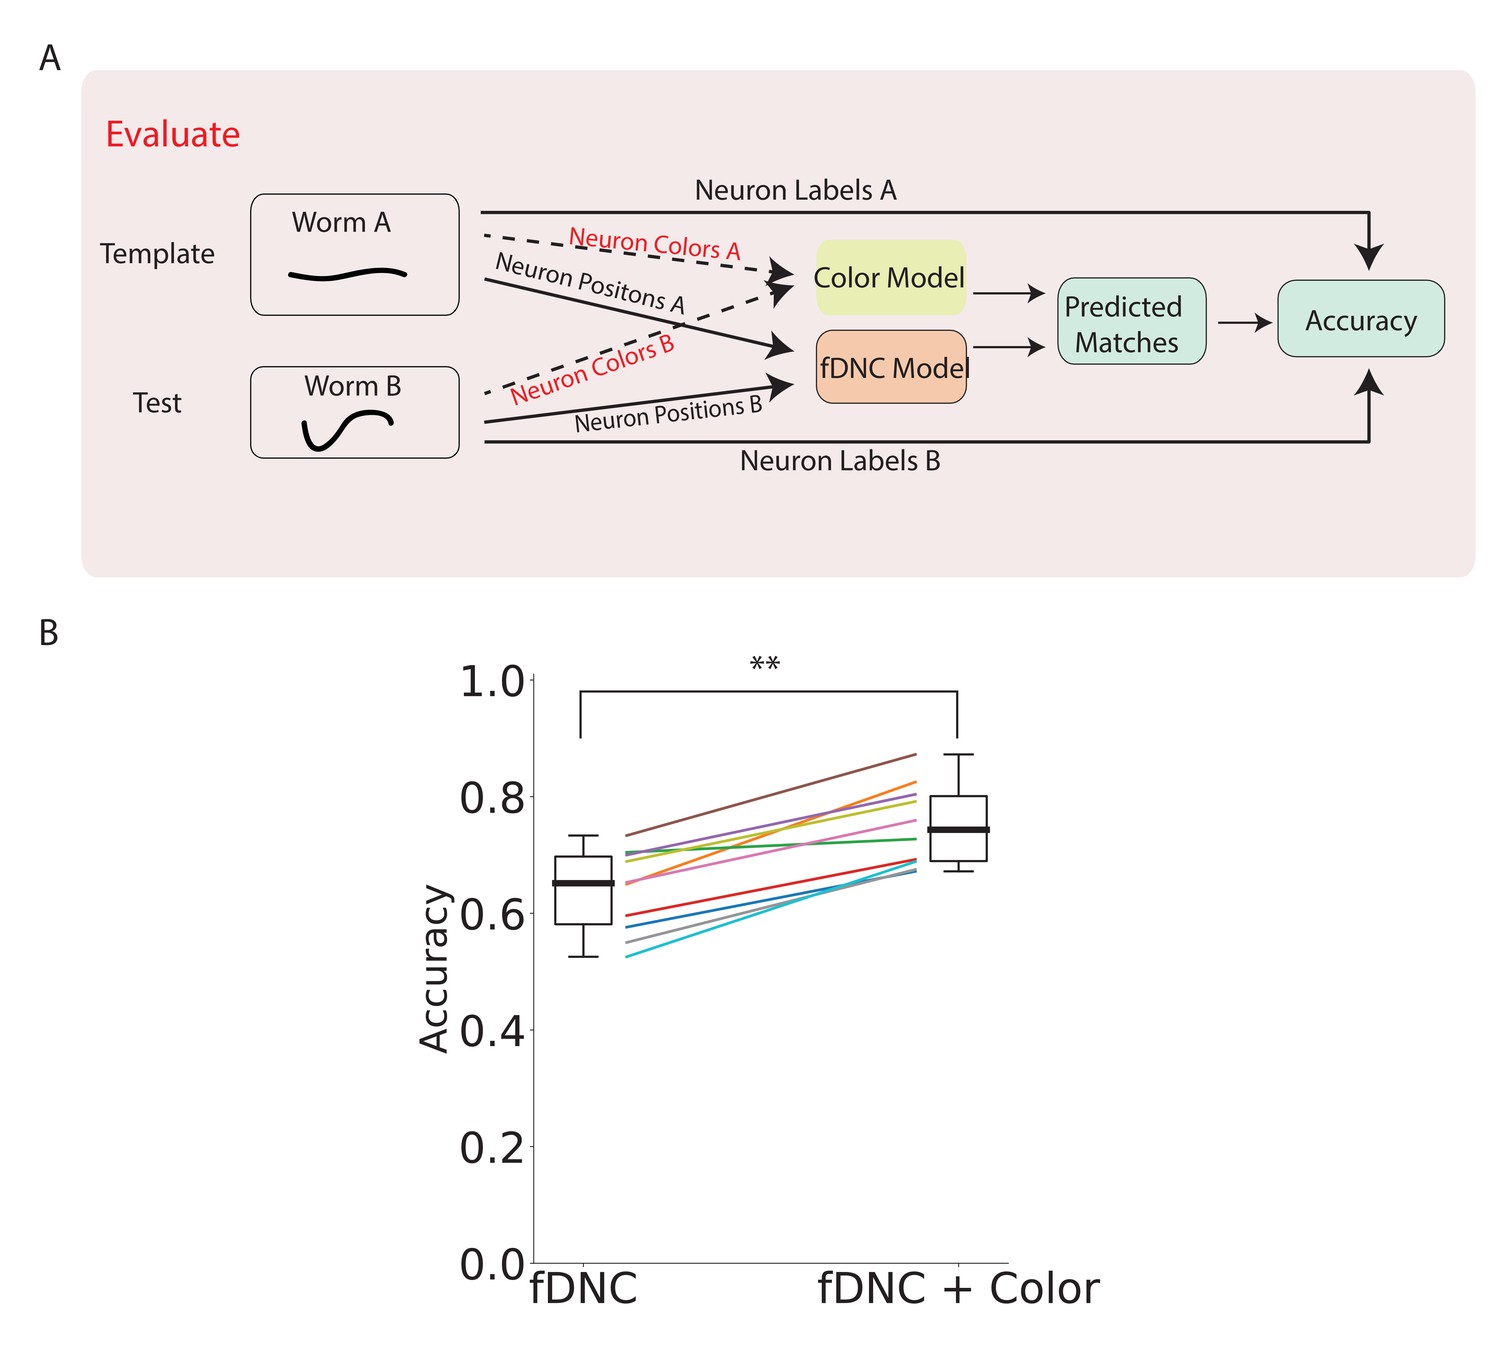
fDNC performance when incorporating color features.
(A) Pipeline to evaluate fDNC performance across animals with additional color features. A simple color model is added in parallel to the fDNC model to use both color and position information from 11 NeuroPAL recordings. Accuracy is calculated from ground truth human annotation and is the fraction of labeled neurons present in both test and template that are correctly matched. Matching probabilities from the color and fDNC models are combined to form the final matching probabilities. (B) Accuracy of the position-only fDNC model and the combined fDNC and color model are evaluated on 11 NeuroPAL recordings (same recordings as in Figure 4). , Wilcoxon signed rank test.
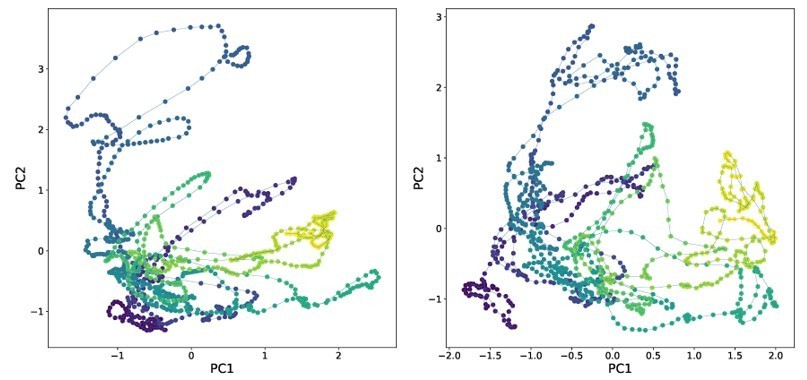
Author response image 1
Videos
Video 1
Video of neuron tracking during calcium imaging in moving animal.
fDNC algorithm is applied to a calcium imaging recording from Hallinen et al., 2021 (six volumes per second, 200 planes per second). Same recording as in Figure 3—figure supplement 1. Images are shown from the RFP channel and show nuclear localized tagRFP in each neuron. For each volume, a single optical plane is shown that contains neuron AVAR (labeled in pink). Labels assigned by fDNC are shown. Color indicates whether the neuron resides in the displayed optical plane (green), or up to two planes above or below (white). The time of the video corresponding to Figure 3—figure supplement 1 is shown on the left top corner.
Tables
Table 1
Time required to predict neural correspondence.
Table shows the measured time per volume required for different models to predict neural correspondence of a single volume. Time required is measured after neuron segmentation is complete and a configuration of neural positions has been loaded into memory. The same hardware is used for all models.
| Method | Time (s/Volume) |
|---|---|
| CPD (Myronenko and Song, 2010) | 0.93 |
| NeRVE(1) (Nguyen et al., 2017) | 10 |
| NeRVE(100) (Nguyen et al., 2017) | >10 |
| fDNC [this work] | 0.01 |
Table 2
Comparison of across-animal model performance on additional dataset.
Table lists reported mean accuracy of different models evaluated on the same publicly accessible dataset from Chaudhary et al., 2021. We note in the text an assumption needed to compare these methods. indicates the number of template-test pairs used to calculate accuracy. (CRF method uses an atlas as the template, whereas we randomly take one of the nine individuals and designate that as the template). CPD and fDNC performance on this dataset are also shown in Figure 4F.
| Method | Accuracy | Reported in | |
|---|---|---|---|
| CPD | 59% | 8 | This work |
| CRF (open atlas) | % | 9 | Chaudhary et al., 2021 |
| CRF (data driven atlas) | 74% | 9 | Chaudhary et al., 2021 |
| fDNC | 78% | 8 | This work |
Key resources table
| Reagent type (species) or resource | Designation | Source or reference | Identifiers | Additional information |
|---|---|---|---|---|
| Strain, strain background (C. elegans) | AML320 | this work | See Table 4 | |
| Strain, strain background (C. elegans) | OH15262 | Yemini et al., 2021 | RRID:WB-STRAIN:WBStrain00047397 |
Table 3
Ground truth content, by dataset.
Table lists ground truth properties for each dataset used in this work to evaluate the model. None of the datasets listed here were used for training. ‘Vol’ refers to volume and ‘indiv’ refers to individuals. Ground truth ‘matches pair−1’ indicates the average number of ground truth matches for random pairs of test and template, which is a property of the ground truth dataset, and does not depend on the model tested.
| Held-out semi-synthetic testset | Ca2+ imaging | NeuroPAL | NeuroPAL | Ca2+ imaging | |
|---|---|---|---|---|---|
| Figure | Figure 2 | Figure 3 | Figures 4 and 5 | Figure 4F | Figure 3—figure supplement 1 |
| Type | - | moving | immobile | immobile | moving |
| Correspondence | across indiv | within indiv | across indiv | across indiv | within indiv |
| Ground Truth | simulator | human | human | human | - |
| Ground truth matches pair−1 | 85.7 | 64.4 | 50.1 | 50.5 | - |
| Ground truth labels vol−1 | 102.1 | 69.2 | 57.5 | 64.3 | - |
| Segmented neurons vol−1 | 114.1 | 118.4 | 133.6 | 118.8 | 131.1 |
| Total Vols | 2000 | 1514 | 11 | 9 | 1400 |
| Individuals | 2000 | 1 | 11 | 9 | 1 |
| Vols indiv−1 | 1 | 1514 | 1 | 1 | 1400 |
| Vols s−1 | - | 6 | - | - | 6 |
| Strain | - | AML32 | AML320 (via OH15262) | OH15495 | AML310 |
| Reference | this work | Nguyen et al., 2017 | this work | Chaudhary et al., 2021 | Hallinen et al., 2021 |
Table 4
List of all strains mentioned in this work.
| Strain | RRID | Genotype | Notes | Ref |
|---|---|---|---|---|
| AML32 | RRID:WB-STRAIN:WBStrain00000192 | wtfIs5[Prab-3::NLS::GCaMP6s; Prab-3::NLS::tagRFP] | Nguyen et al., 2017 | |
| AML310 | RRID:WB-STRAIN:WBStrain00048356 | wtfIs5[Prab-3::NLS::GCaMP6s; Prab-3::NLS::tagRFP]; wtfEx258 [Prig-3::tagBFP::unc-54] | Hallinen et al., 2021 | |
| AML320 | (otIs669[NeuroPAL] V 14x; wtfIs145 [pBX + rab-3::his-24::GCaMP6::unc-54]) | derived from OH15262 | this work | |
| OH15262 | RRID:WB-STRAIN:WBStrain00047397 | otIs669[NeuroPAL] | Yemini et al., 2021 | |
| OH15495 | RRID:WB-STRAIN:WBStrain00047403 | otIs696[NeuroPAL] | Yemini et al., 2021; Chaudhary et al., 2021 |
Table 5
List of emission filters for multicolor imaging.
| Filter label | Filters (Semrock part n.) |
|---|---|
| F1 | FF01-440/40 |
| F2 | FF01-607/36 |
| F3 | FF02-675/67 + FF01-692/LP |
Table 6
Imaging channels used.
| Channel | Excitation λ (nm) | Emission window (nm) [filter] | Primary fluorophore |
|---|---|---|---|
| ch0 | 405 | 420–460 [F1] | mtagBFP |
| ch1 | 488 | 589–625 [F2] | CyOFP |
| ch2 | 561 | 589–625 [F2] | tagRFP-t |
| ch3 | 561 | 692–708 [F3] | mNeptune |
Table 7
Model validation for hyperparameters selection.
Table lists losses of models with different hyperparameter values. represents the number of layers for the transformer architecture. is the dimension of the embedding space. The loss shown is the average cross entropy loss evaluated on a held out validation set.
 | 32 | 64 | 128 |
|---|---|---|---|
| 4 | 83.1% | 88.4% | 90.7% |
| 6 | 86.3% | 94.6% | 96.8% |
| 8 | 90.5% | 96.4% | 96.8% |
Additional files
Download links
A two-part list of links to download the article, or parts of the article, in various formats.
Downloads (link to download the article as PDF)
Open citations (links to open the citations from this article in various online reference manager services)
Cite this article (links to download the citations from this article in formats compatible with various reference manager tools)
Fast deep neural correspondence for tracking and identifying neurons in C. elegans using semi-synthetic training
eLife 10:e66410.
https://doi.org/10.7554/eLife.66410


