Adult stem cell-derived complete lung organoid models emulate lung disease in COVID-19
- Department of Cellular and Molecular Medicine, University of California San Diego, United States
- HUMANOID CoRE, University of California San Diego, United States
- Department of Computer Science and Engineering, Jacobs School of Engineering, University of California San Diego, United States
- Department of Pathology, University of California San Diego, United States
- Department of Immunology and Microbiology, The Scripps Research Institute, United States
- Division of Cardiothoracic Surgery, University of California San Diego, United States
- Division of Cardiology, Department of Internal Medicine, UC San Diego Medical Center, United States
- Pulmonary Critical Care Section, Veterans Affairs (VA) San Diego Healthcare System, United States
- Division of Pulmonary and Critical Care, Department of Medicine, University of California, San Diego, United States
- Cell Applications Inc., United States
- Division of Infectious Diseases, Department of Medicine, University of California, San Diego, United States
- Department of Pediatrics, University of California, San Diego, United States
- Department of Medicine, University of California, San Diego, United States
Figures
Figure 1 with 1 supplement
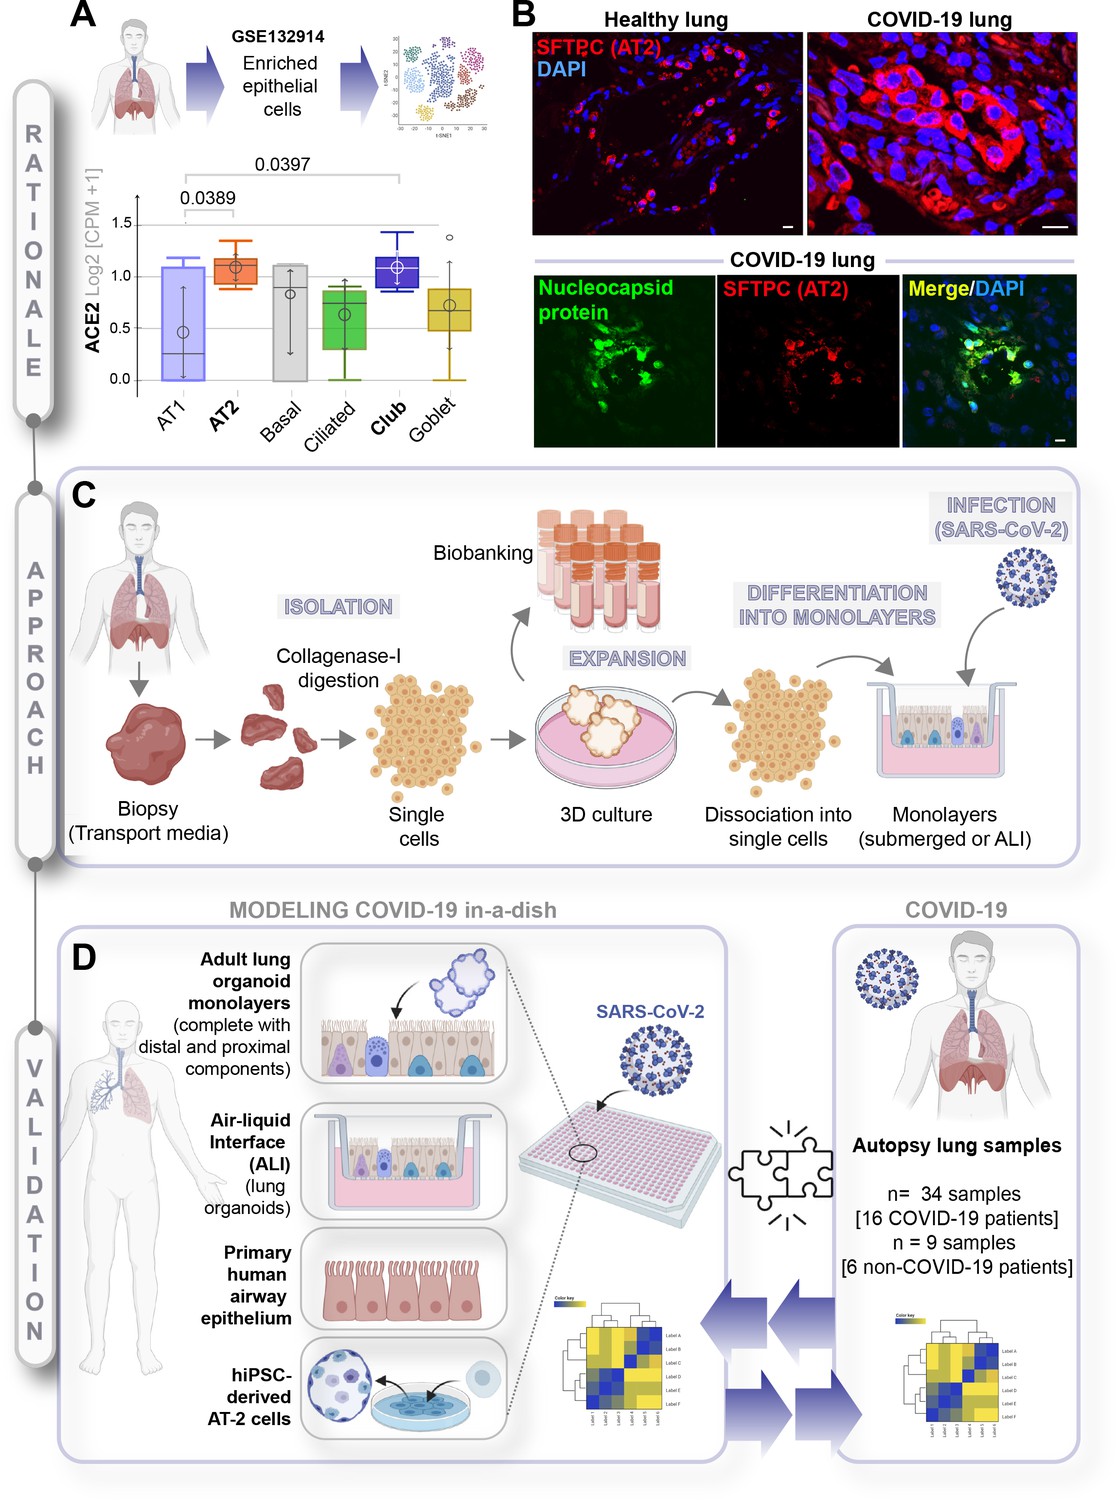
A rationalized approach to building and validating human preclinical models of COVID-19.
A) Whisker plots display relative levels of angiotensin-converting enzyme II (ACE2) expression in various cell types in the normal human lung. The cell types were annotated within a publicly available single-cell sequencing dataset (GSE132914) using genes listed in Table 1. p-values were analyzed by one-way ANOVA and Tukey’s post hoc test. (B) Formalin-fixed paraffin-embedded sections of the human lung from normal and deceased COVID-19 patients were stained for SFTPC, alone or in combination with nucleocapsid protein and analyzed by confocal immunofluorescence. Representative images are shown. Scale bar = 20 µm. (C) Schematic showing key steps generating an adult stem cell-derived, propagable, lung organoid model, complete with proximal and distal airway components for modeling COVID-19-in-a-dish. See Materials and methods for details regarding culture conditions. (D) A transcriptome-based approach is used for cross-validation of in vitro lung models of SARS-CoV-2 infection (left) versus the human disease, COVID-19 (right), looking for a match in gene expression signatures.
Figure 1—figure supplement 1
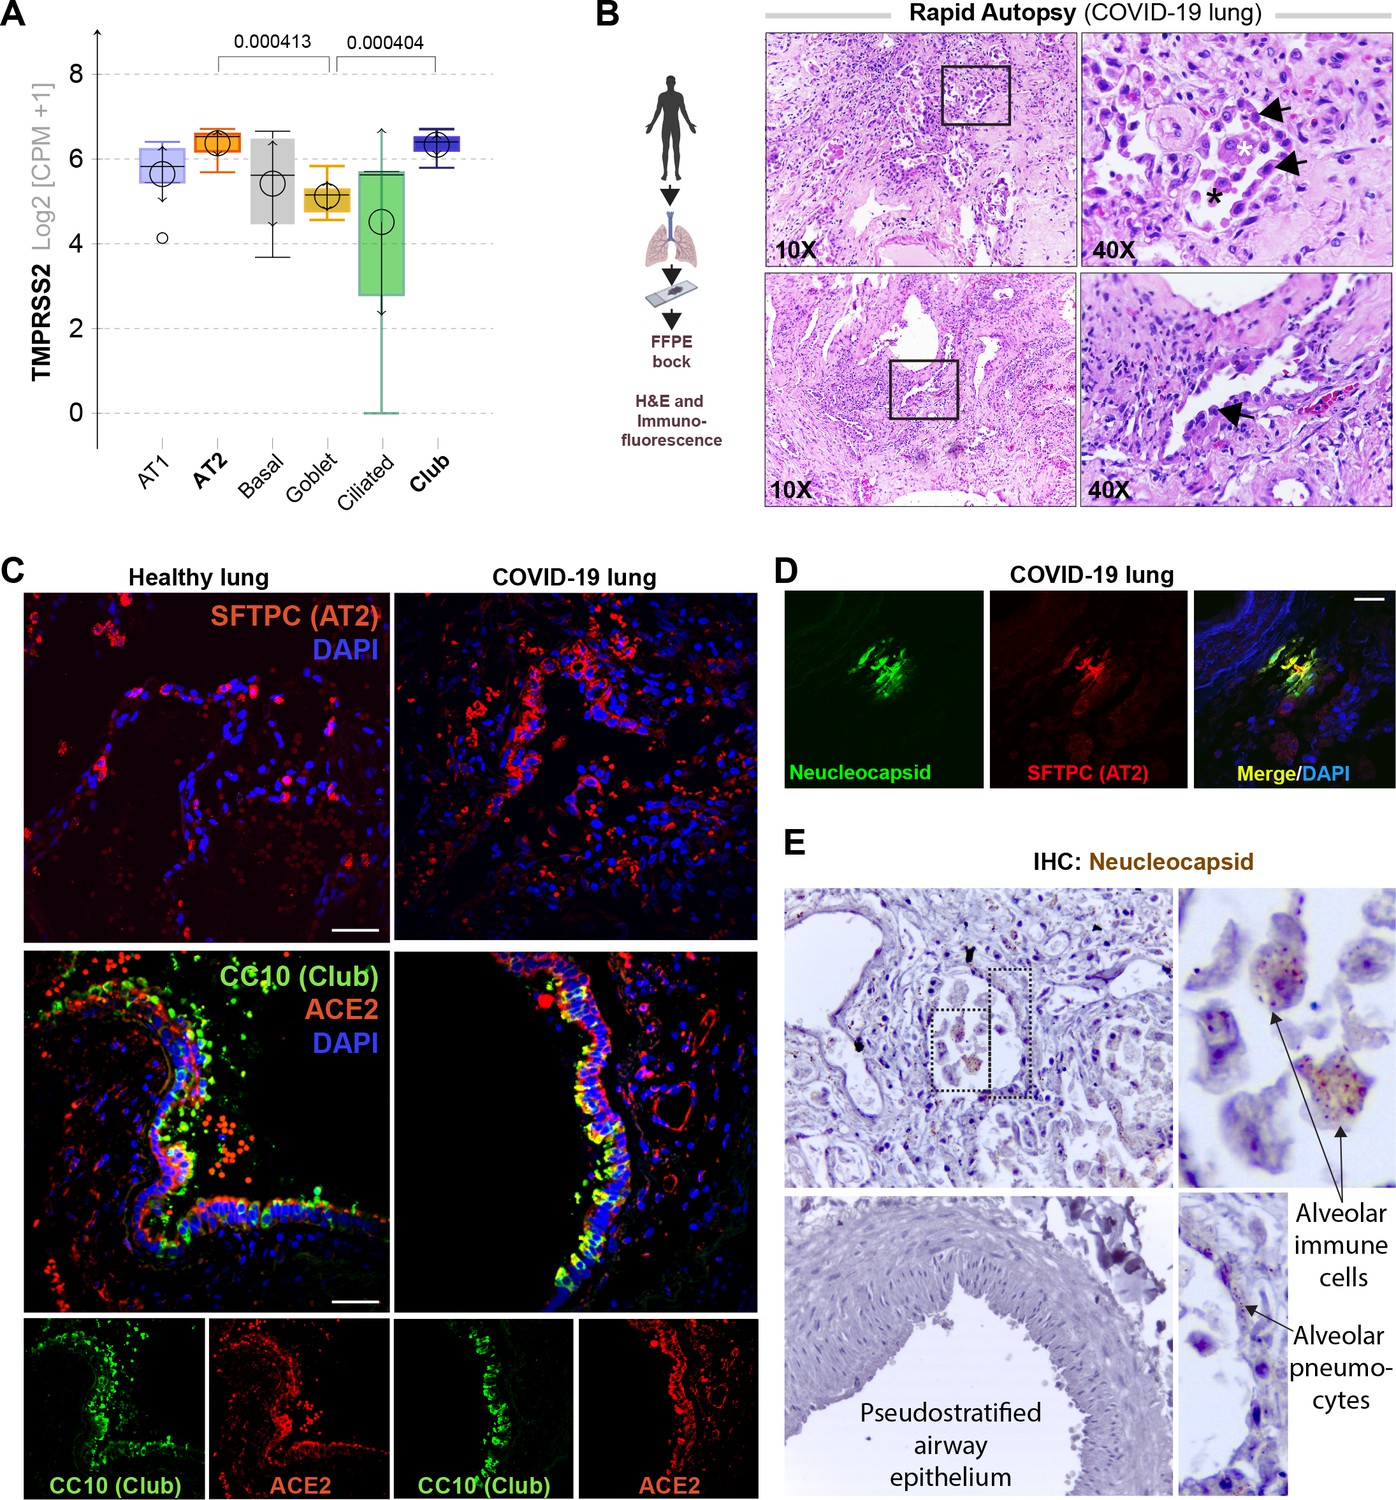
Alveolar type II pneumocyte hyperplasia is a pathognomonic feature of lung injury in COVID-19.
(A) Whisker plots display relative levels of TMPRSS2 expression in various cell types in the normal human lung. The cell types were annotated within a publicly available single-cell sequencing dataset (GSE132914) using genes listed in Table 2. p-values were analyzed by one-way ANOVA and Tukey’s post hoc test. (B) Formalin-fixed paraffin-embedded (FFPE) sections of the human lung from deceased COVID-19 patients were analyzed by H&E staining. Representative fields are shown. Images on the right are magnified areas indicated with boxes on the left. Arrows indicate alveolar type II pneumocyte hyperplasia. (C, D) FFPE sections of the human lung from normal and deceased COVID-19 patients were stained for AT2 and club cell markers and either ACE2 or viral nucleocapsid protein and analyzed by confocal immunofluorescence. Representative images are shown. Scale bar = 50 µm. (E) FFPE sections of the human lung from normal and deceased COVID-19 patients were stained for viral nucleocapsid antibody. Representative images are shown. Arrows indicate infected cells.
Figure 2 with 5 supplements
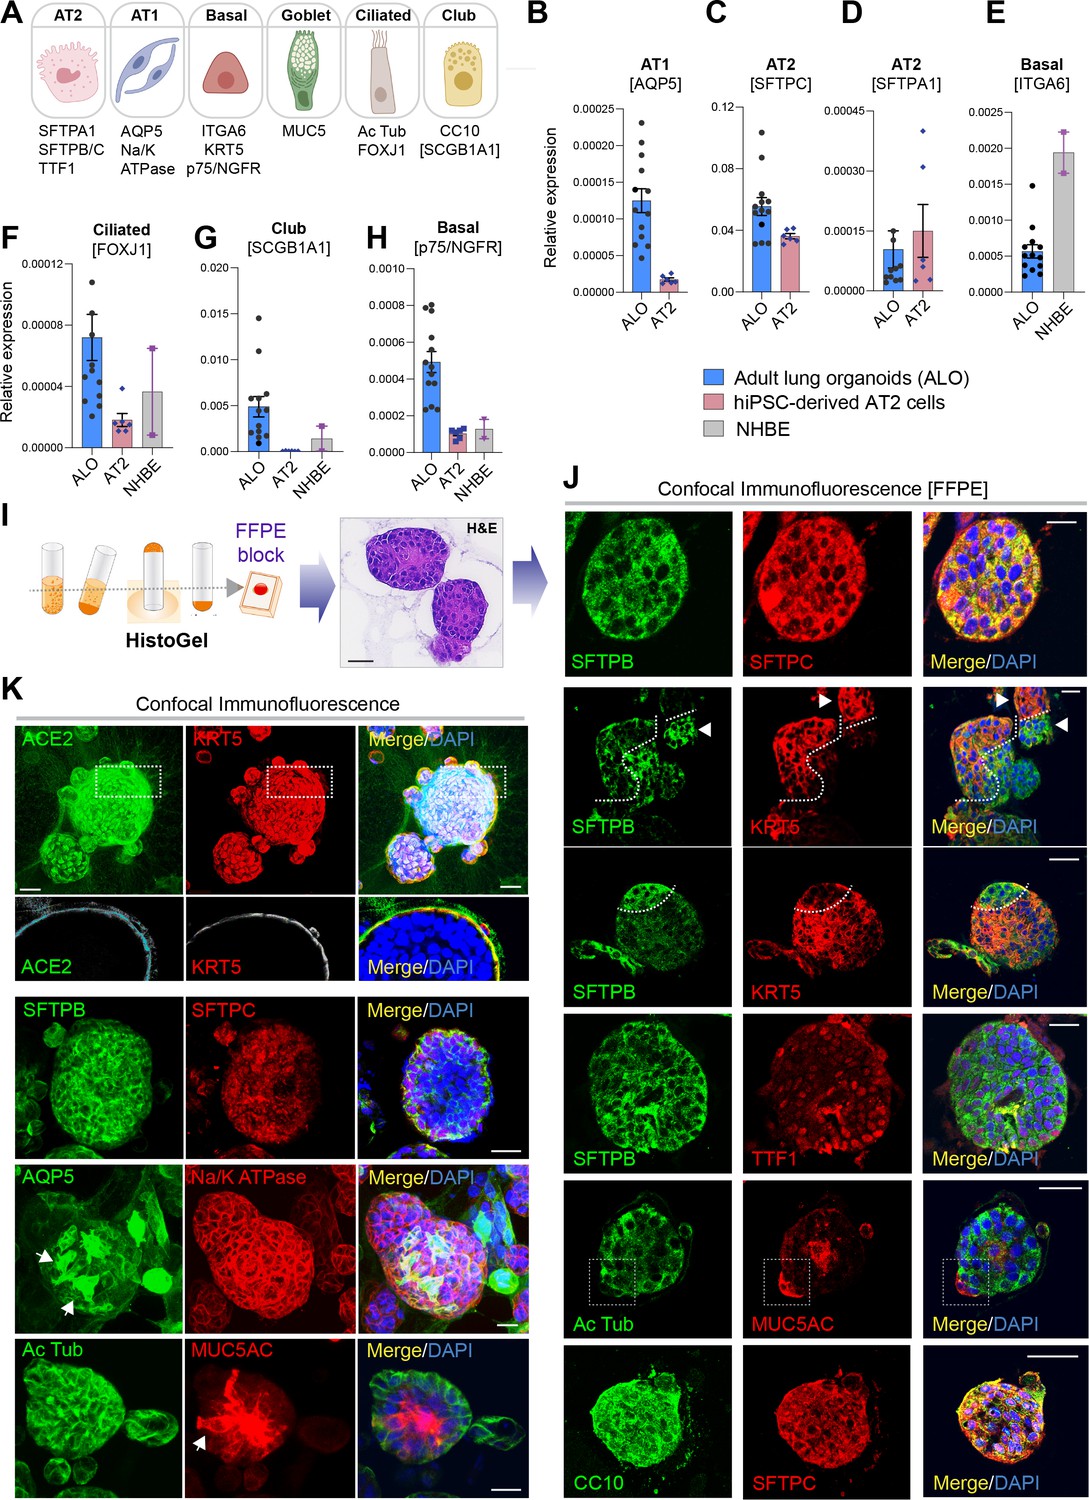
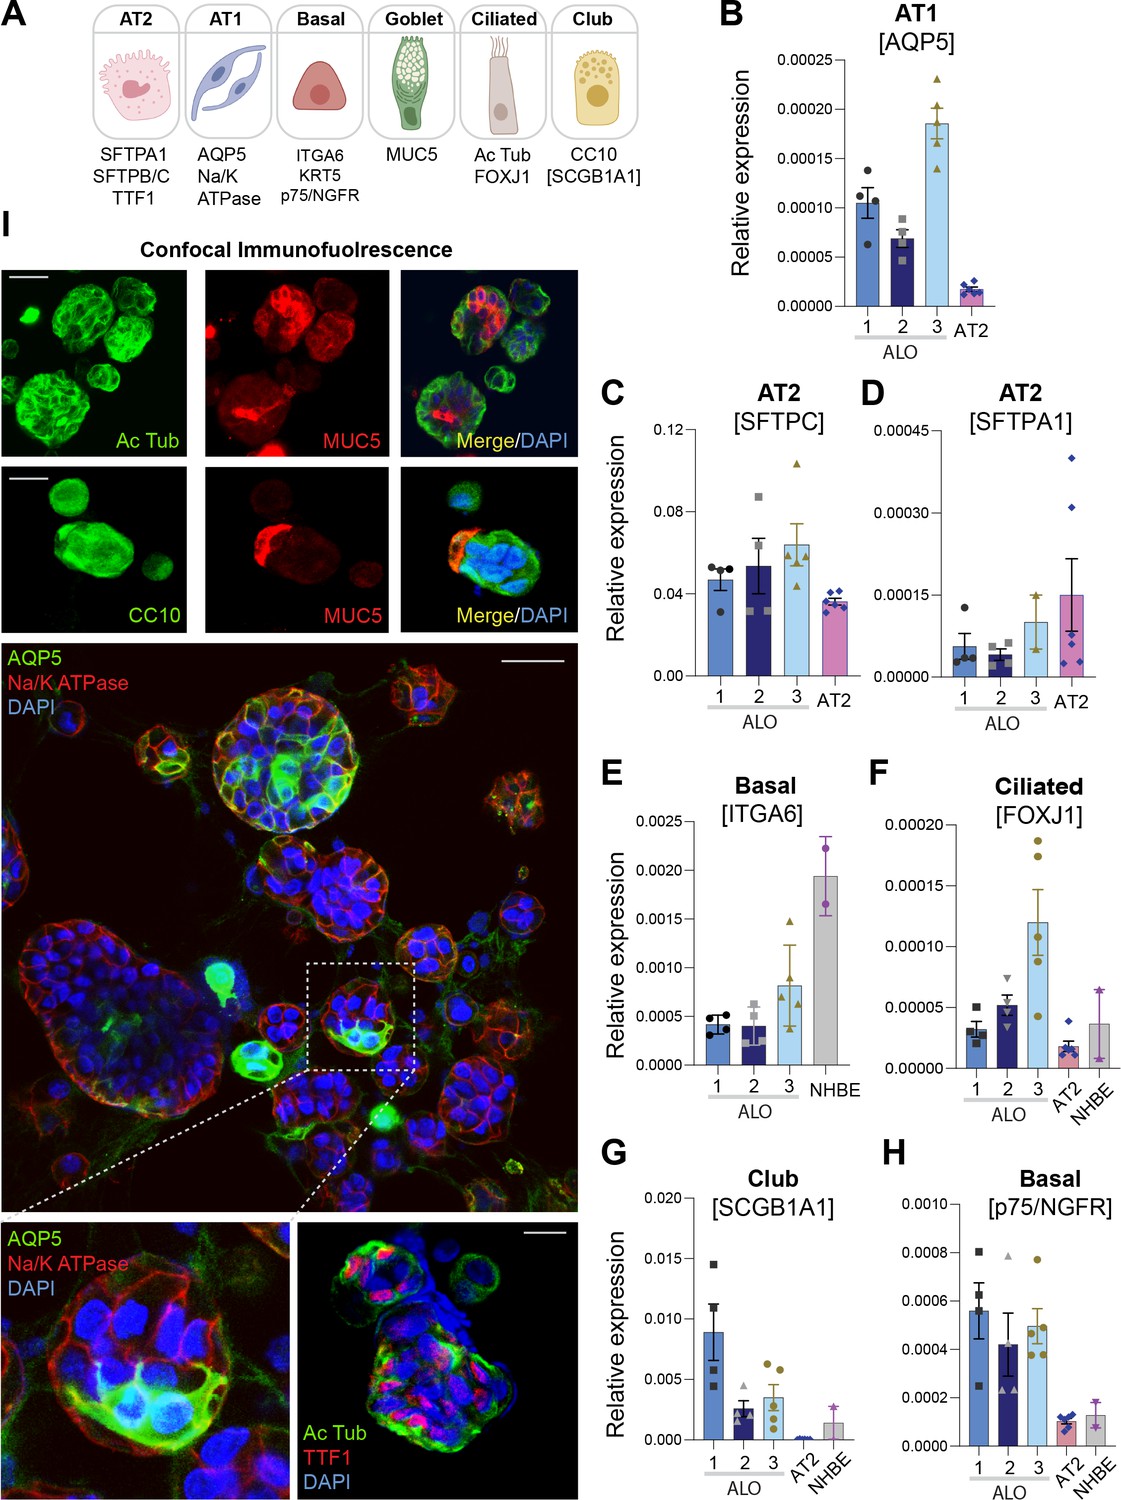
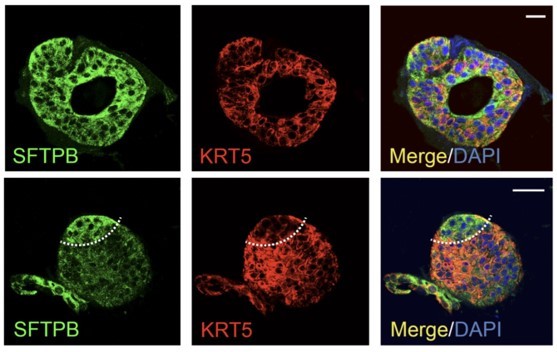
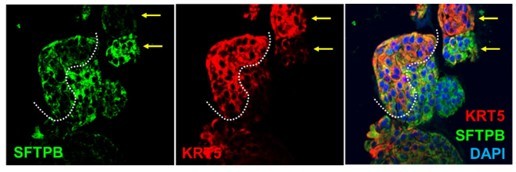
Adult stem cell-derived lung organoids are propagatable models with both proximal and distal airway components.
(A) Schematic lists the various markers used here for qPCR and immunofluorescence to confirm the presence of all cell types in the 3D lung organoids here and in 2D monolayers later (in Figure 3). (B–H) Bar graphs display the relative abundance of various cell-type markers (normalized to 18S) in adult lung organoids (ALO), compared to the airway ( normal human bronchial epithelial cell [NHBE]) and/or alveolar (AT2) control cells, as appropriate. p-values were analyzed by one-way ANOVA. Error bars denote SEM; n = 3–6 datasets from three independent ALOs and representing early and late passages. See also Figure 2—figure supplement 2 for individual ALOs. (I, J). H&E-stained cell blocks were prepared using HistoGel (I). Slides were stained for the indicated markers and visualized by confocal immunofluorescence microscopy. Representative images are shown in (J). Scale bar = 50 µm. (K) 3D organoids grown in 8-well chamber slides were fixed, immunostained, and visualized by confocal microscopy as in (J). Scale bar = 50 µm. See also Figure 2—figure supplement 2. Top row (ACE2/KRT5-stained organoids) displays the single and merged panels as max projections of z-stacks (top) and a single optical section (bottom) of a selected area. For the remaining rows, the single (red/green) channel images are max projections of z-stacks; however, merged panels are optical sections to visualize the centers of the organoids. All immunofluorescence images showcased in this figure were obtained from ALO lines within passage #3–6. See also Figure 2—figure supplements 3–5 for additional evidence of mixed cellularity of ALO models, their similarity to lung tissue of origin, and stability of cellular composition during early (#1–8) and late (#8–15) passages, as determined by qPCR and flow cytometry.
Figure 2—figure supplement 1
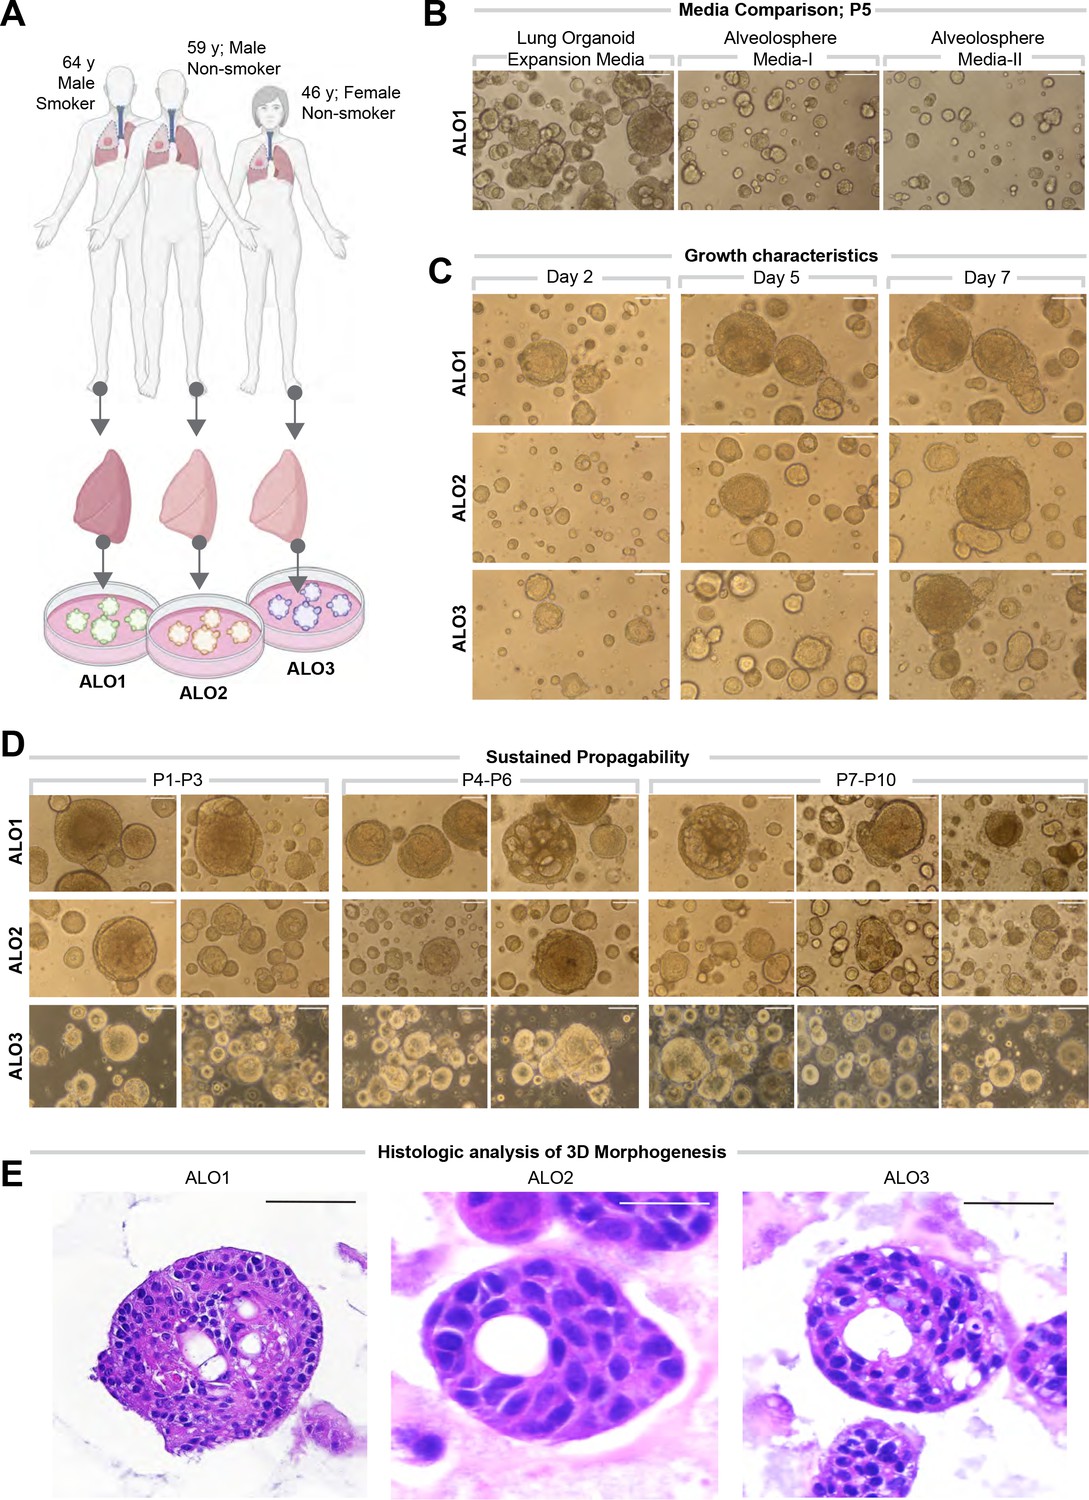
Lung organoids are reproducibly established from three different donors and propagated in each case over 10 passages.
(A) Schematic displaying the key demographics of the patients who served as donors of the lung tissue as a source of adult stem cells for the generation of organoids. Three organoid lines were generated, ALO1-3. ALO, adult lung organoids. (B–D) Bright-field microscopy of organoids in 3D culture grown in different media/conditions (B), imaged serially over days (C), and at different passages (D). Scale bar = 100 µm. (E) Serial cuts of HistoGel-embedded organoids were analyzed by H&E staining. Scale bar = 50 µm.
Figure 2—figure supplement 2
Adult stem cell-derived lung organoids are propagatable models with both proximal and distal airway components.
(A) Schematic lists the various markers used here for qPCR and immunofluorescence to confirm the presence of all cell types in the 3D lung organoids here and in 2D monolayers later (in Figure 3). (B–H) Bar graphs display the relative abundance of various cell-type markers (normalized to 18S) in adult lung organoids (ALO), compared to the airway ( normal human bronchial epithelial cell [NHBE]) and/or alveolar (AT2) control cells, as appropriate. p-values were analyzed by one-way ANOVA. Error bars denote SEM; n = 3–6 datasets. (I) 3D organoids grown in 8-well chamber slides were fixed, immunostained, and visualized by confocal microscopy, as in Figure 2K. Scale bar = 50 µm.
Figure 2—figure supplement 3

Adult stem cell-derived lung organoids (ALO) generally recapitulate cell-type-specific gene expression patterns observed in the adult lung tissue (ALT) from which they originate.
(A, B) Schematics depict the study goal in this figure, that is, analysis of cell-type-specific transcripts in ALO vs. ALT. (C–L) Bar graphs display the relative abundance of various cell-type markers (normalized to 18S) in adult lung organoids from early passage (ALO), compared to the adult lung tissue (ALT) from which they were derived. p-values were analyzed by one-way ANOVA. Error bars denote SEM; n = 3–6 datasets. Statistically significant differences were not noted in any of the transcripts analyzed.
Figure 2—figure supplement 4
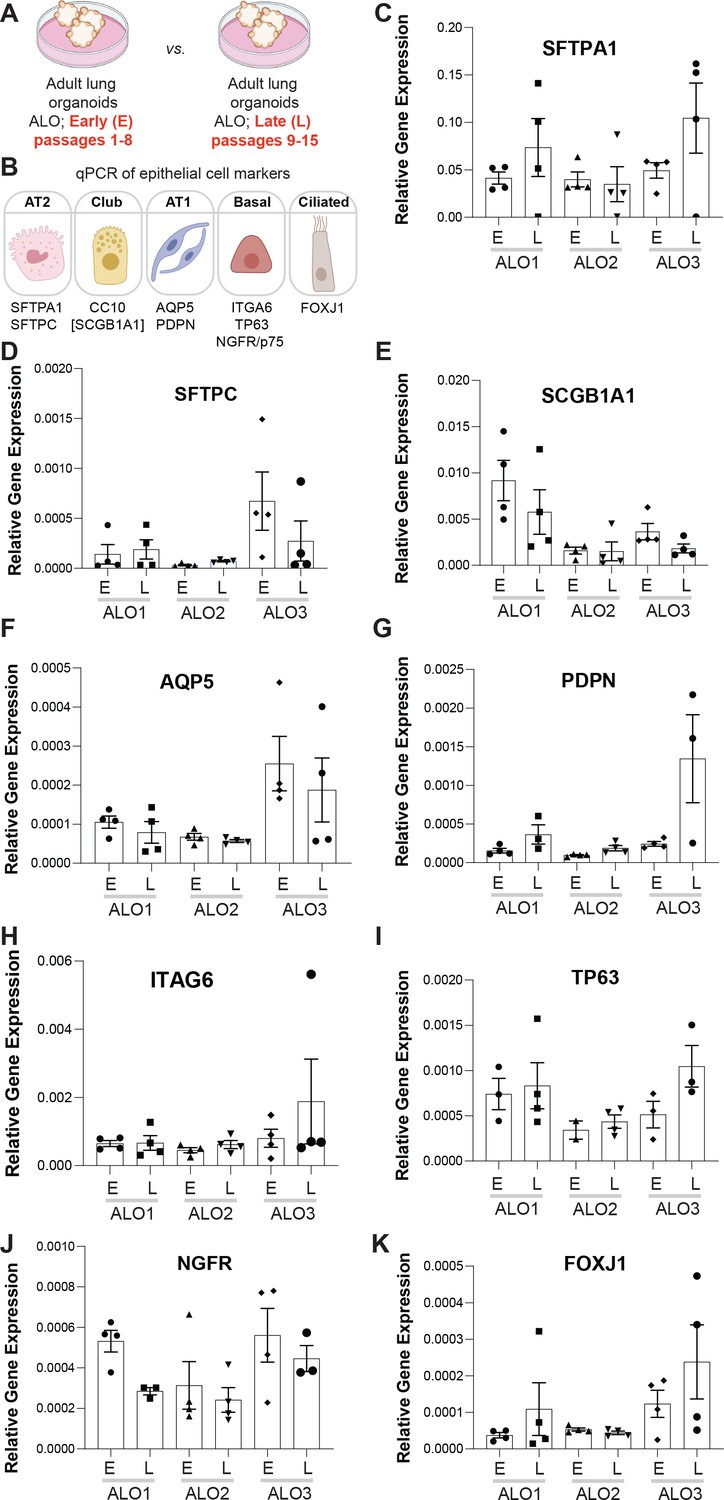
Adult stem cell-derived lung organoids (ALO) generally maintain their cellular composition from early (E) to late (L) passages, as determined by cell-type-specific gene expression by qPCR.
(A, B) Schematics depict the study goal in this figure, that is, analysis of cell-type-specific transcripts in early (E) vs. late (L) passages of ALO1-3 lines. (C–K) Bar graphs display the relative abundance of various cell-type markers (normalized to 18S) in adult lung organoids from either early (E) or late (L) passages of ALO lines 1–3. p-values were analyzed by one-way ANOVA. Error bars denote SEM; n = 3–6 datasets. Statistically significant differences were not noted in any of the transcripts analyzed.
Figure 2—figure supplement 5
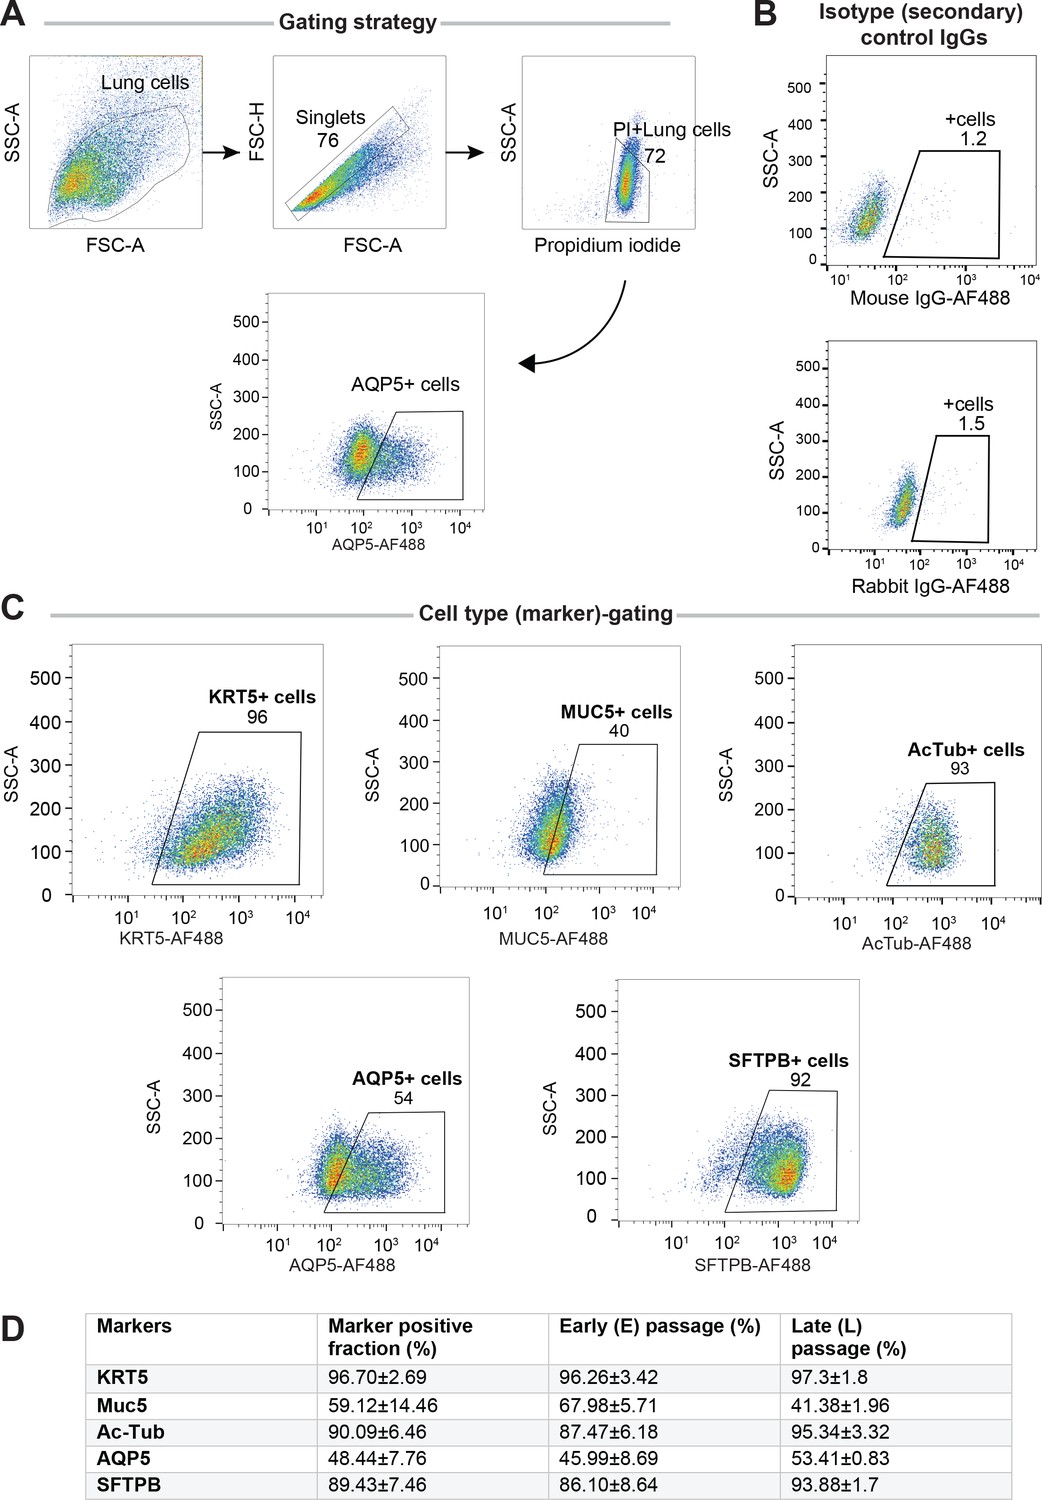
Adult stem cell-derived lung organoids (ALO) comprised both proximal and distal airway epithelial population and generally maintain such diversity from early (E) to late (L) passages, as determined by FACS.
Lung monolayers were dissociated into single cells and analyzed using flow cytometry. Gating strategy depicted in (A), isotype controls in (B) and (C) show various lung cell types. Numbers denote %.Table in (D) lists marker-positive cell fractions in ALO1-3, presented either as averaged over both early and late passages combined (column 2), or separated into early (column 3) or late (column 4) passages. These findings are consistent with others’ findings by multichannel FACS (Bonser et al., 2021) showing that although many of these markers are highly expressed in a certain cell type, they are shared at lower levels among other cell types.
Figure 3 with 3 supplements
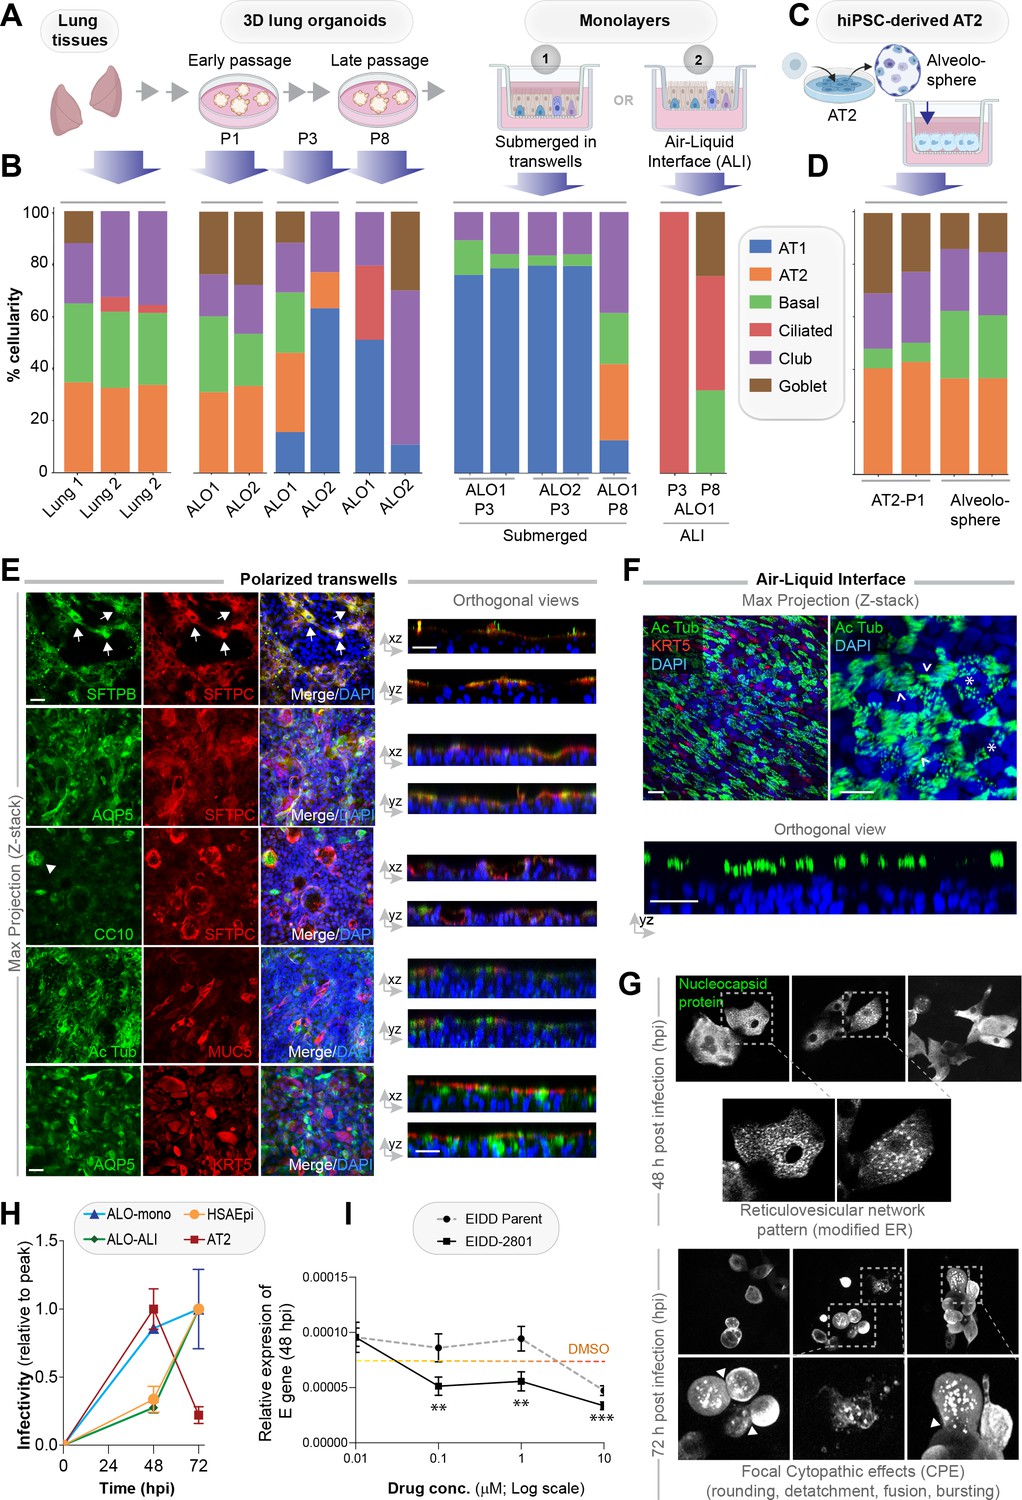
Monolayers derived from lung organoids differentiate into proximal and distal airway components.
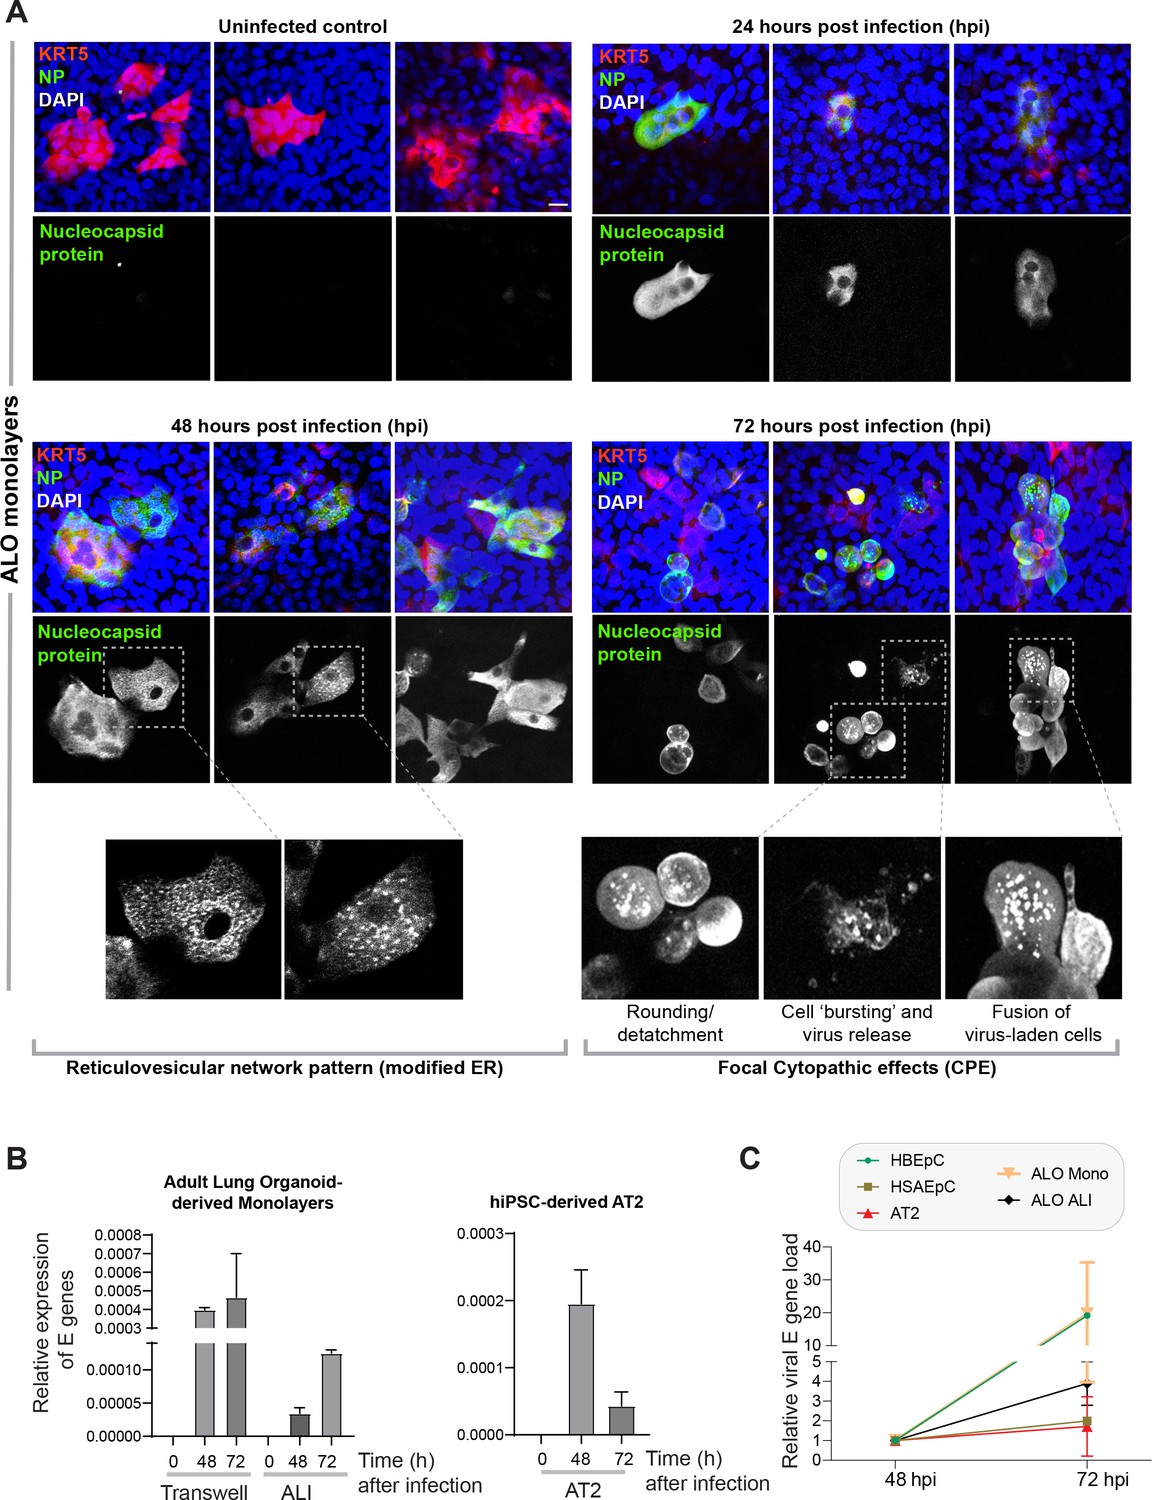
(A, B) Samples collected at various steps of lung organoid isolation and expansion in culture, and from the two types of monolayers prepared using the lung organoids were analyzed by bulk RNA seq and the datasets were compared for % cellular composition using the deconvolution method, CYBERSORTx. Schematic in (A) shows the workflow steps, and bar plots in (B) show the relative proportion of various lung cell types. (C, D) hiPSC-derived AT2 cells and alveolospheres (C) were plated as monolayers and analyzed by RNA seq. Bar plots in (D) show % cellular composition. (E, F) Submerged adult lung organoids (ALO) monolayers in transwells (E) or monolayers were grown as air-liquid interphase (ALI) models (F) were fixed and stained for the indicated markers and visualized by confocal immunofluorescence microscopy. The representative max projected z-stack images (left) and the corresponding orthogonal images (right) are displayed. Arrows in (E) indicate AT2 cells; arrowheads in (E) indicate club cells; asterisk in (F) indicates bundles of cilia standing perpendicular to the plane of the ALI monolayers; arrowheads in (F) indicate bundles of cilia running parallel to the plane of the ALI monolayers. Scale bar = 20 µm. (G) Monolayers of ALO1-3 were challenged with SARS-CoV-2 for indicated time points prior to fixation and staining for KRT5, SARS-COV2 viral nucleocapsid protein and DAPI and visualized by confocal microscopy. A montage of representative images are shown, displaying reticulovesicular network patterns and various cytopathic effects. Scale bar = 15 µm. (H) Monolayers of ALO, hiPSC-derived AT2 cells, and other alternative models (see Figure 3—figure supplements 1–2) were infected or not with SARS-CoV-2 and analyzed for infectivity by qPCR (targeted amplification of viral envelope, E gene). See also Figure 3—figure supplement 3B, C for comparison of the degree of peak viral amplification across various models. (I) ALO monolayers pretreated for 4 hr with either vehicle (DMSO) control or EIDD-parent (NHC) or its metabolite EIDD-2801/MK-4482 were infected with SARS-CoV-2 and assessed at 48 hpi for infectivity as in (H). Line graphs display the relative expression of E gene. Error bars display SEM. p value **<0.01; ***<0.001.
Figure 3—figure supplement 1
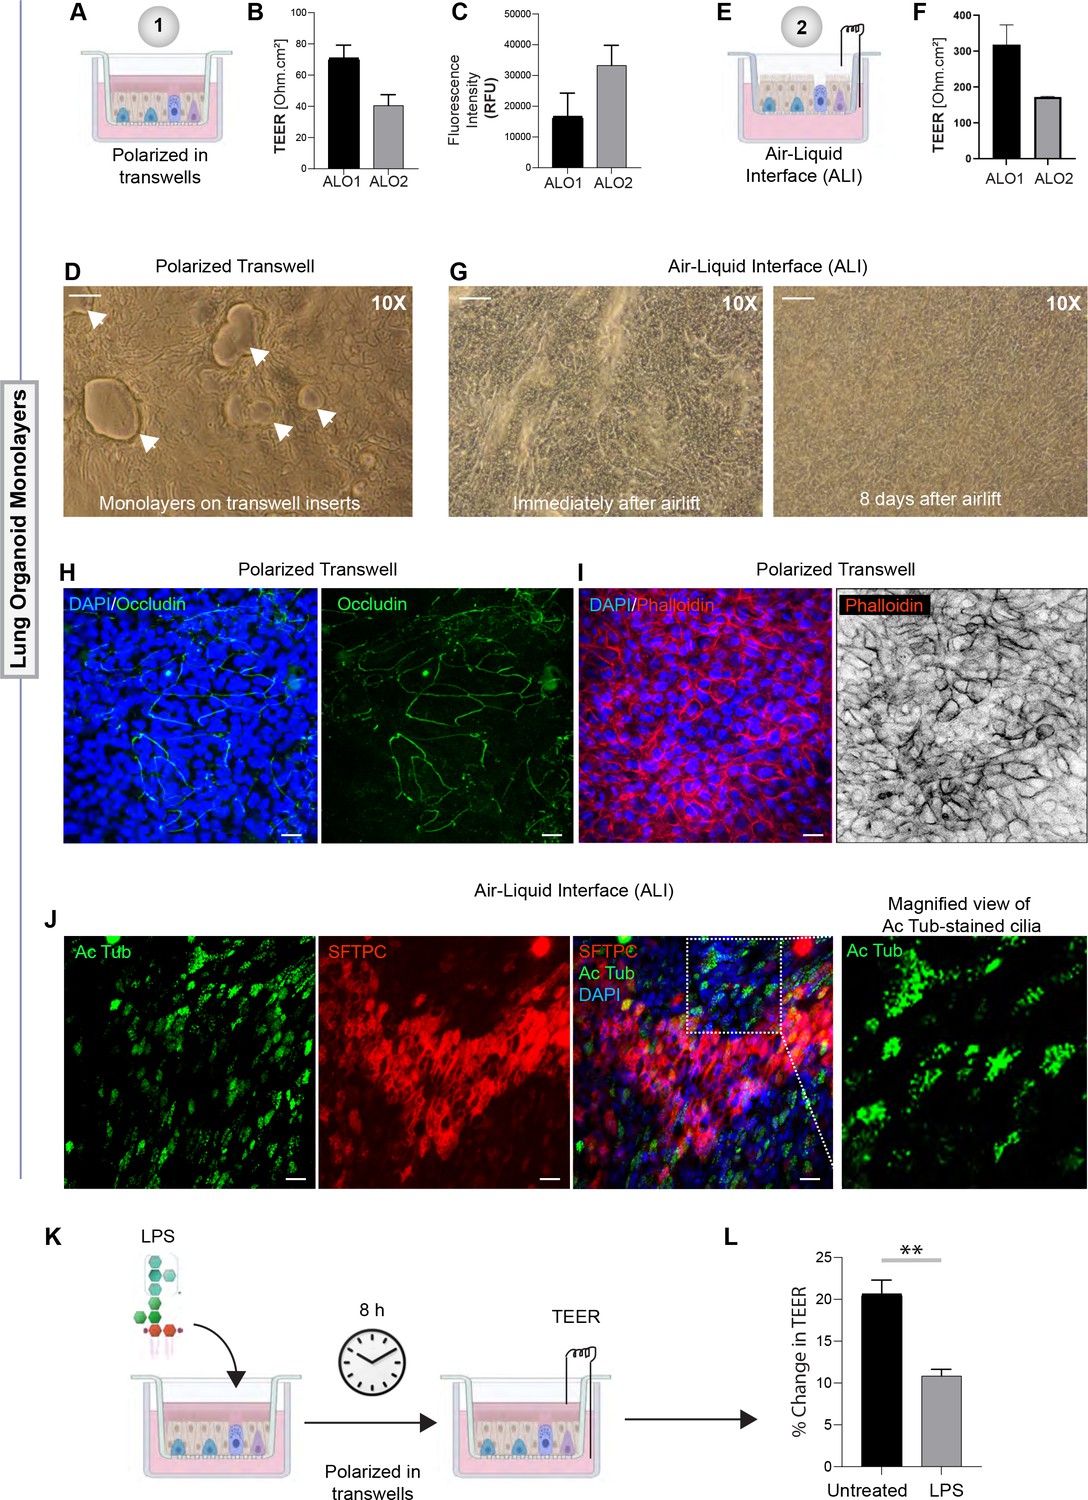
Monolayers derived from adult lung organoids (ALO) can form an epithelial barrier.
(A–G) Two different types of 2D polarized monolayers are prepared using adult lung organoids. Schematics in (A) and (E) show growth as submerged or air-liquid interphase (ALI) models, respectively. Panel (B) shows bar graphs with transepithelial electrical resistance (TEER) across submerged monolayers grown in transwells. Panel (C) shows bar graphs for relative fluorescence unit (RFU) of the FITC-labeled dextran flux from the apical to basolateral chambers of a submerged monolayer. (D) Brightfield images show representative fields of submerged monolayers grown on transwells. Scale bar = 100 µm. Arrows indicate self-organized vacuolar regions were seen. (F) Bar graphs with TEER across ALO-derived monolayers grown as ALI models. (G) Brightfield images show representative fields of ALI monolayers at two different time points during culture. Scale bar = 100 µm. (H, I) Submerged monolayers of ALO were fixed with methanol (H) or paraformaldehyde (I) prior to co-staining with DAPI (blue; nuclei) and either occludin (green [H] or phalloidin [red; I]). Scale bar = 20 µm. (J) ALO monolayers were grown as ALI models were fixed and co-stained for SFTPC (red), Ac-Tub (green), and DAPI (blue; nuclei) and visualized by confocal immunofluorescence microscopy. Scale bar = 20 µm. (K, L) Schematic in (K) shows the study design for challenging submerged monolayers with 500 ng/ml LPS, followed by TEER measurement. Bar graphs in (L) display the % change in TEER observed with or without LPS treatment normalized to the baseline TEER. p-values were analyzed by one-way ANOVA. Error bars denote SEM; n = 3–6 datasets. **p< 0.01.
Figure 3—figure supplement 2

Alternative models of lung epithelial cells used in this work for modeling SARS-CoV-2 infection and/or as a control for gene expression studies.
(A–D) Monolayers of primary airway epithelial cells (small airway epi; A B; bronchial epi; C, D) were visualized by bright field microscopy (A, C) or by fixing, staining, and visualizing by confocal microscopy (B, D). Representative images in (B) and (D) are presented as maximum projected z-stacks on the left and as an orthogonal view on the right. (E–G) hiPSC-derived AT2 cells, prepared using the i-HAEpC2 cell kit, were grown in monolayers on transwell inserts to form a polarized. Brightfield images are shown in (F). Monolayers were fixed and stained for several markers and analyzed by confocal microscopy. Representative images are shown in (G). Scale bar = 20 µm.
Figure 3—figure supplement 3
Proof of SARS-CoV-2 infectivity.
(A) Monolayers of ALO1-3 were challenged with SARS-CoV-2 for indicated time points prior to fixation and staining for KRT5 (red) and viral nucleocapsid protein (green) and DAPI (blue; nuclei) and visualized by confocal microscopy. Representative images are shown, displaying various cytopathic effects. Scale bar = 15 µm. (B) Monolayers of adult lung organoids (ALO) (either transwell submerged models or air-liquid interphase [ALI], left) and monolayers of hiPSC-derived AT2 cells (right) were infected or not with SARS-CoV-2 and analyzed for viral envelope gene (E gene). Bar graphs display the relative expression of E gene in infected ALO monolayers, indicative of viral infection. (C) Line graphs show the change in E gene expression in infected monolayers over 24 hr period (from 48 hpi to 72 hpi) where values at 72 hpi are normalized to that at 48 hpi. Data is presented as SEM of three independent repeats.
Figure 4 with 2 supplements

Gene expression patterns in the lungs of patients with COVID-19 (actual disease) are recapitulated in lung organoid monolayers infected with SARS-CoV-2 (disease model).
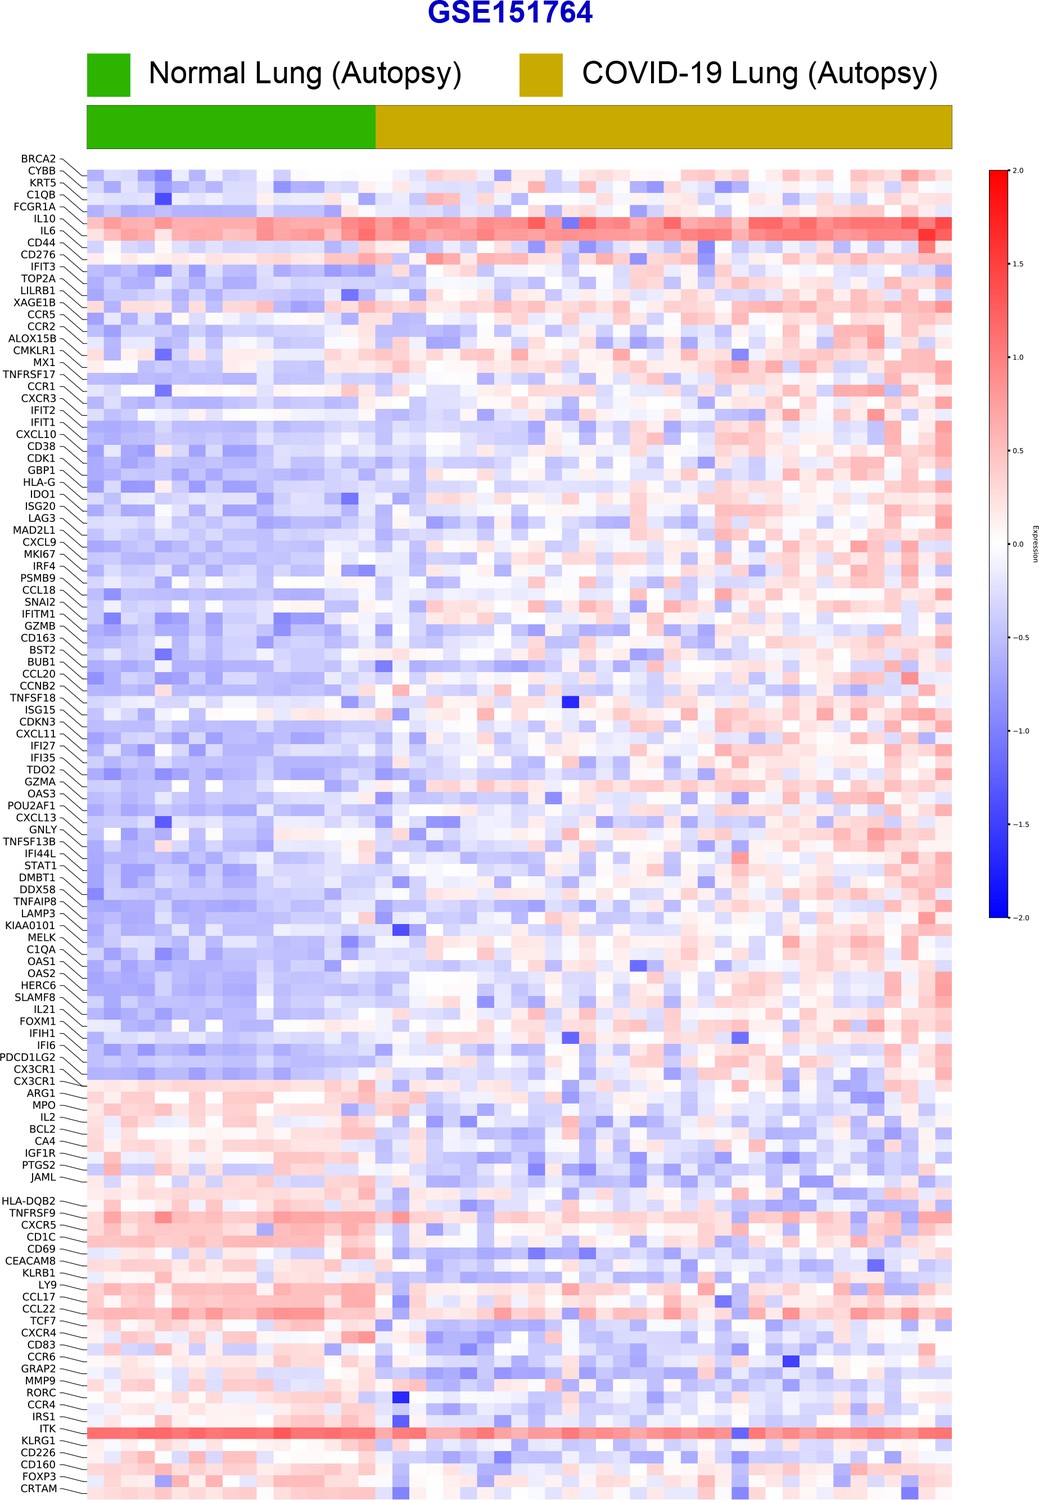
(A–C) Publicly available RNA seq datasets (GSE151764) of lung autopsies from patients who were deceased due to COVID-19 or noninfectious causes (healthy normal control) were analyzed for differential expression of genes (B). The differentially expressed genes (DEGs) are displayed as a heatmap labeled with selected genes in (C). See also Figure 4—figure supplement 1 for the same heatmap with all genes labeled. (D) Reactome-pathway analysis shows the major pathways up- or downregulated in the COVID-19-afflicted lungs. See also Figure 4—figure supplement 2 for visualization as hierarchical ReacFoam. (E) Bar plots display the ability of the DEGs in the test cohort (GSE151764) to classify human COVID-19 respiratory samples from four other independent cohorts. (F) Bar plots display the ability of the DEGs in the test cohort (GSE151764) to classify published in vitro models for SARS-CoV-2 infection where RNA seq datasets were either generated in this work or publicly available. (G, H) Bar (top) and violin (bottom) plots compare the relative accuracy of disease modeling in four in vitro models used in the current work, as determined by the induction of COVID-19 lung signatures in each model. (G) Monolayer (left) and air-liquid interphase (ALI) models (right) prepared using adult lung organoids (ALOs). (H) Primary human small airway epithelium (left) and hiPSC-derived AT2 monolayers (right). Table 6 lists details regarding the patient cohorts/tissue or cell types represented in each transcriptomic dataset.
Figure 4—figure supplement 1
Differential expression analysis of RNA seq datasets from lung autopsies (normal vs. COVID-19).
Publicly available RNA seq datasets (GSE151764) of lung autopsies from patients who were deceased due to COVID-19 or noninfectious causes (normal lung control) were analyzed for differential expression of genes and displayed as a heatmap.
Figure 4—figure supplement 2
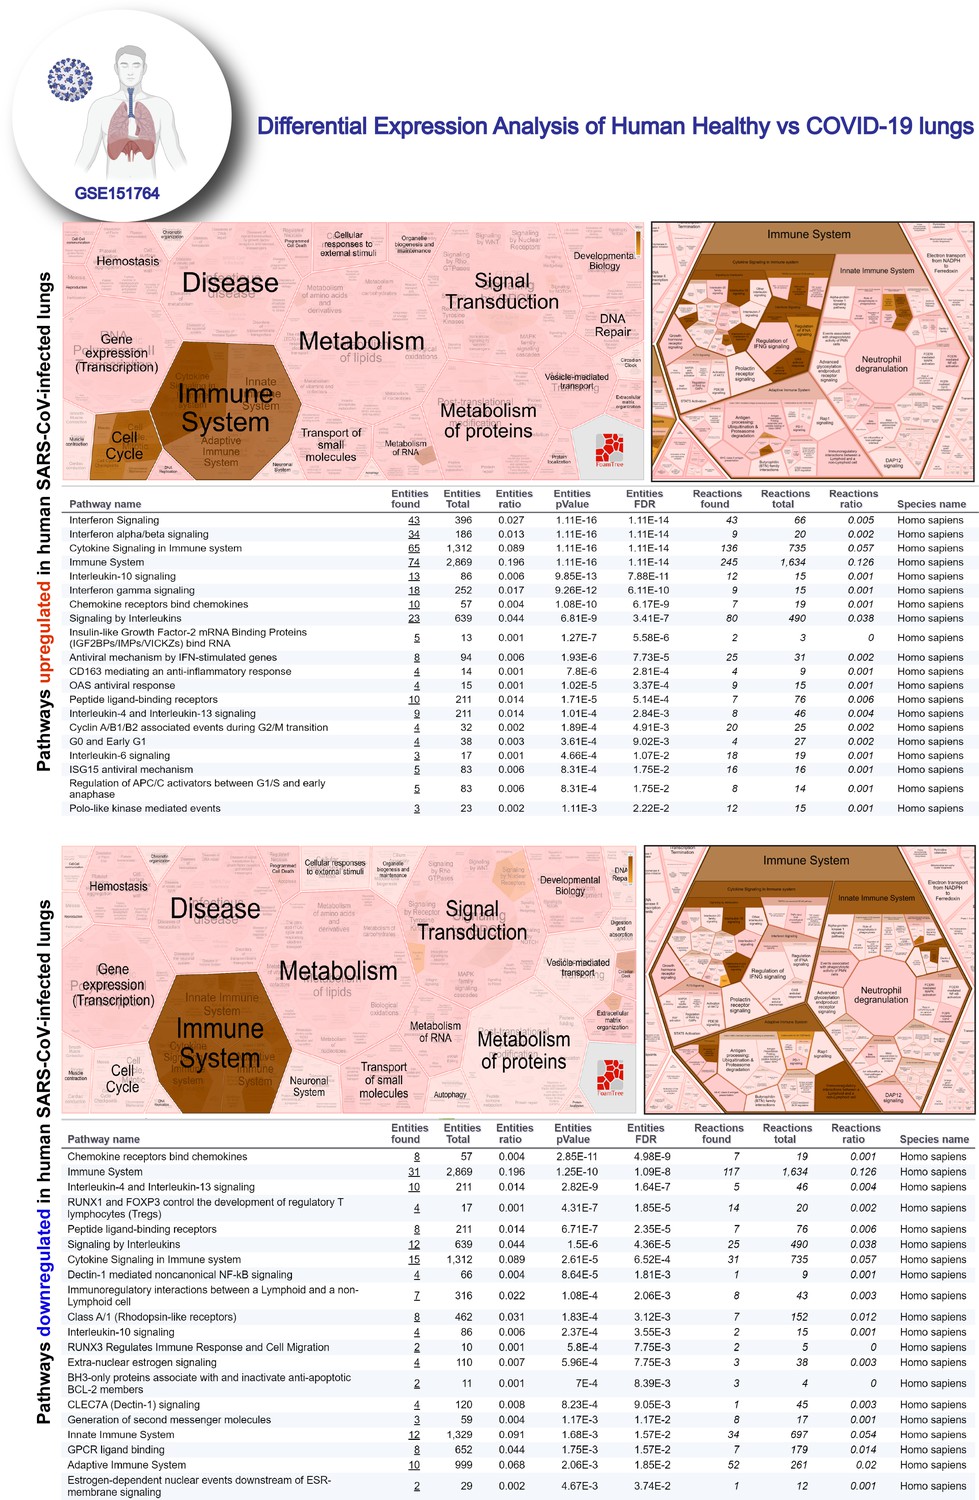
Reactome-pathway analysis of differentially expressed genes in lung autopsies (normal vs. COVID-19).
Reactome-pathway analysis of the differentially expressed genes shows the major pathways upregulated in COVID-19-affected lungs. Top: visualization as flattened (left) and hierarchical (right, insets) reactome. Bottom: visualization of the same data as tables with statistical analysis indicative of the degree of pathway enrichment.
Figure 5 with 3 supplements
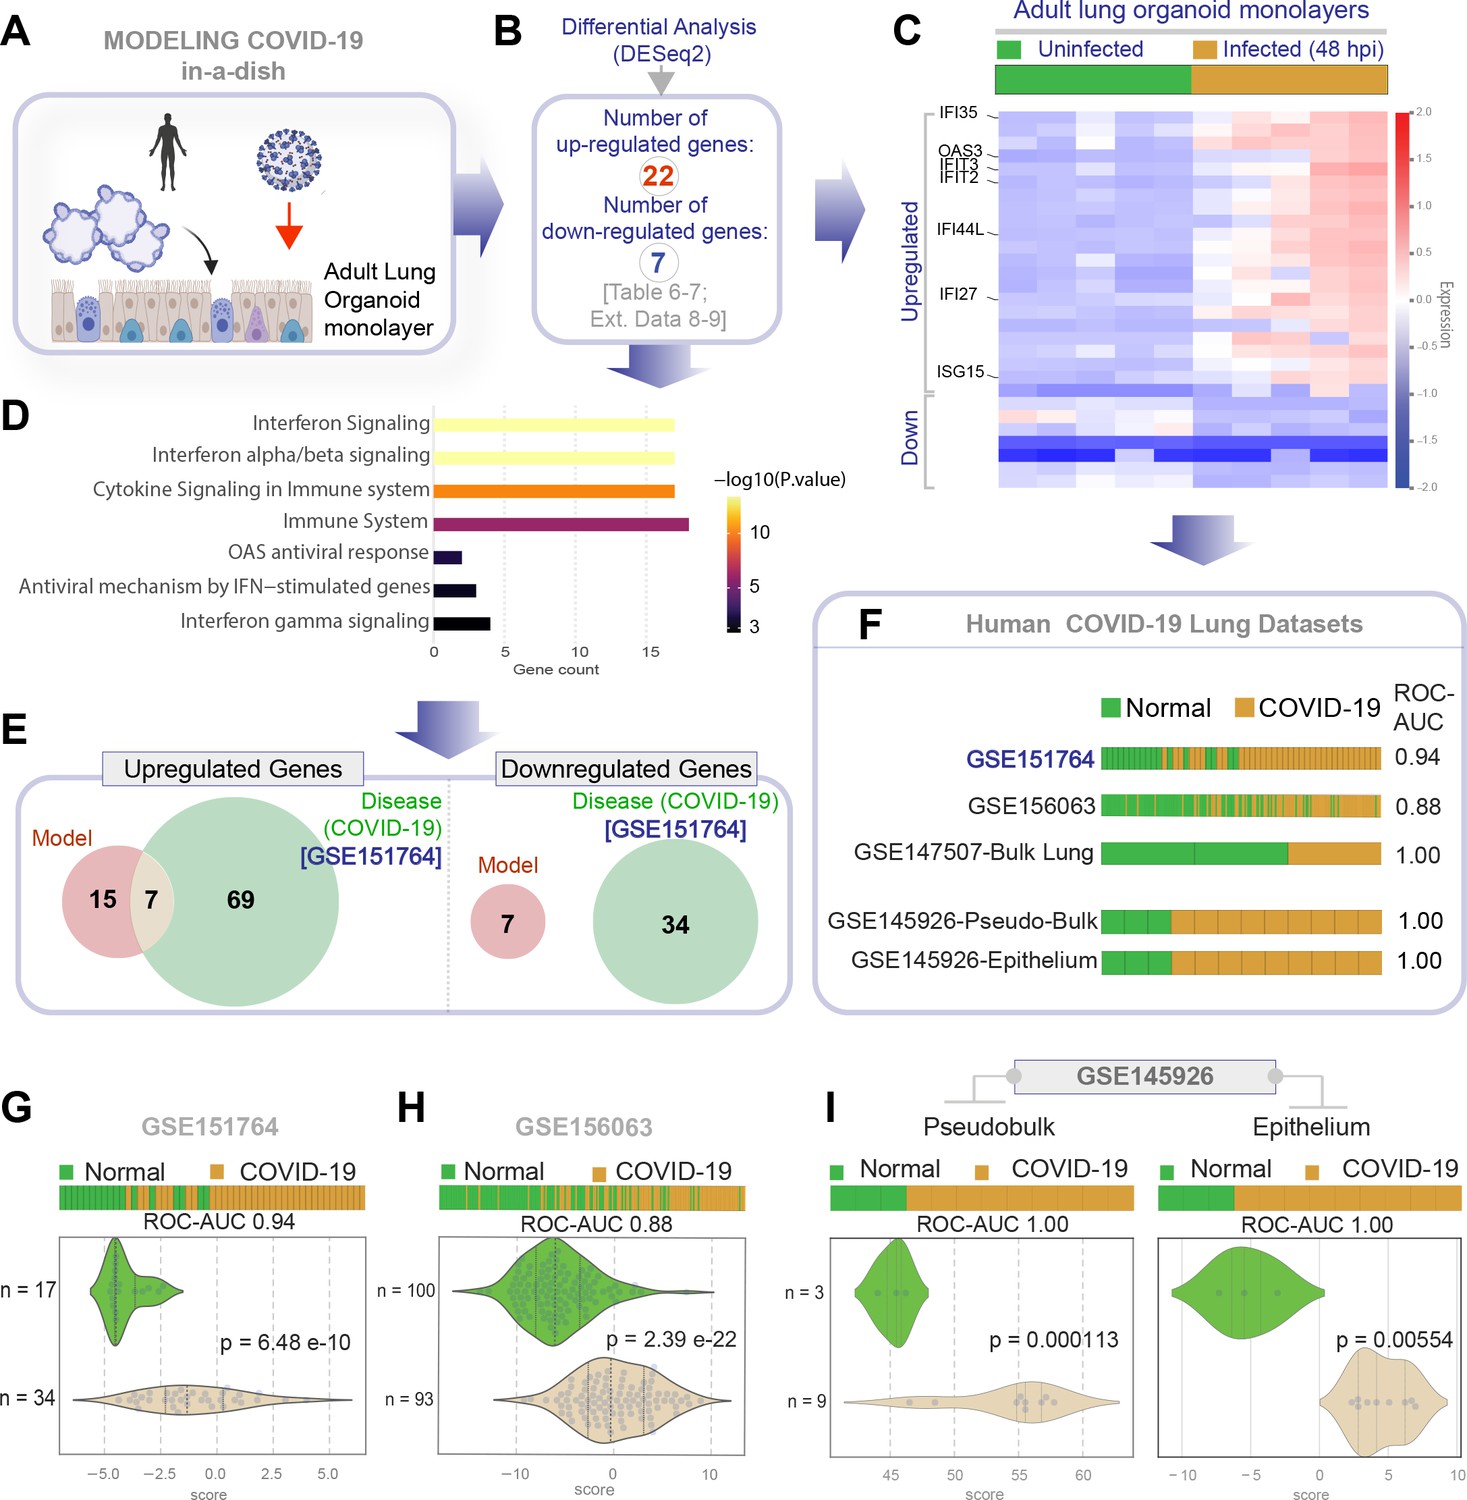
Genes and pathways induced in the SARS-CoV-2-infected lung organoid monolayers (disease model) are induced also in the lungs of COVID-19 patients (actual disease).
(A–C) Adult lung organoid monolayers infected or not with SARS-CoV-2 were analyzed by RNA seq and differential expression analysis. Differentially expressed genes (DEGs; B) are displayed as a heatmap in (C). While only selected genes are labeled in panel (C) (which represent overlapping DEGs between our organoid model and publicly available COVID-19 lung dataset, GSE151764), the same heatmap is presented in Figure 5—figure supplement 1 with all genes labeled. (D) Reactome-pathway analysis shows the major pathways upregulated in SARS-CoV-2-infected lung organoid monolayers. See also Figure 5—figure supplement 2 for visualization as hierarchical ReacFoam. (E) A Venn diagram showing overlaps in DEGs between model (current work; B) and disease (COVID-19 lung dataset, GSE151764; Figure 4). (F) Bar plots display the ability of the DEGs in infected lung monolayers to classify human normal vs. COVID-19 respiratory samples from five independent cohorts. (G–I) Bar (top) and violin (bottom) plots compare the accuracy of disease modeling in three publicly available human lung datasets, as determined by the significant induction of the DEGs that were identified in the SARS-CoV-2-challenged monolayers. See also Table 6, which enlists details regarding the patient cohorts/tissue or cell types represented in each transcriptomic dataset.
Figure 5—figure supplement 1
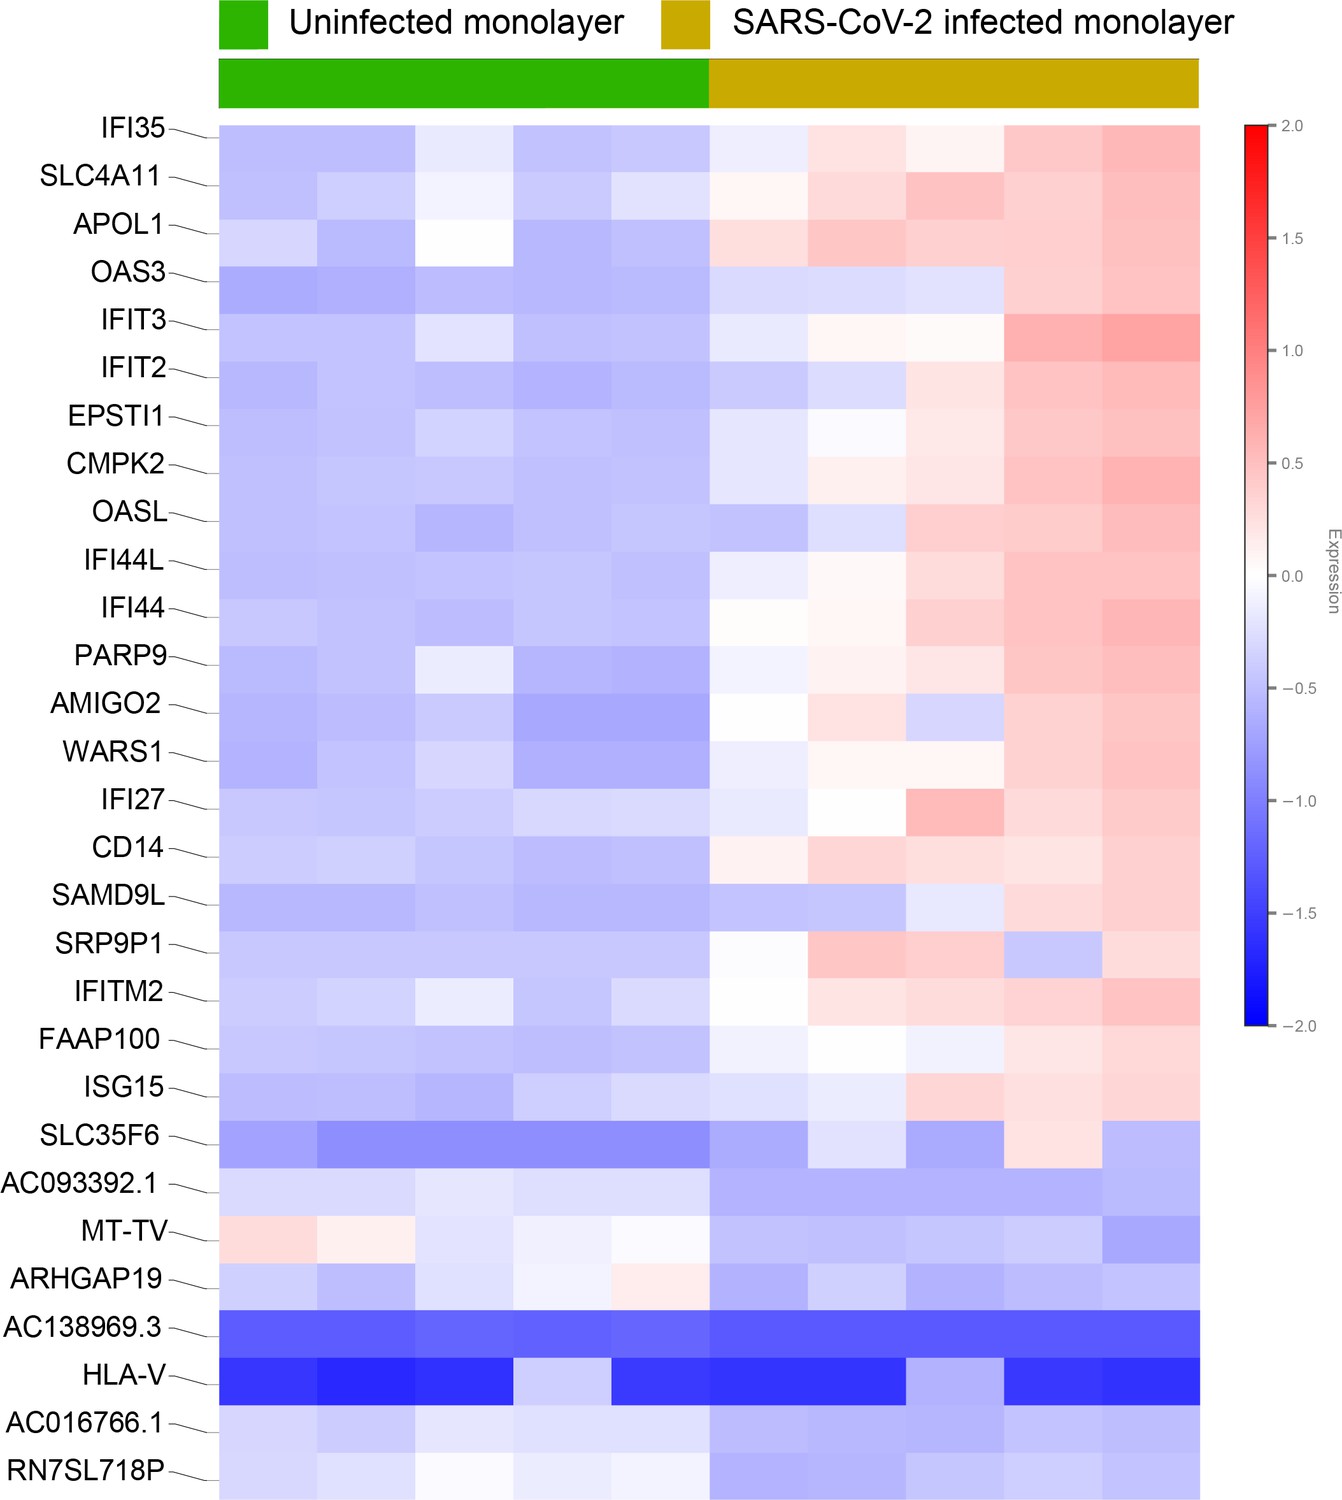
Differential expression analysis of RNA seq datasets from adult lung organoid monolayers, infected or not, with SARS-CoV-2.
Adult lung organoid (ALO)-derived grown in transwells as submerged monolayers were infected or not with SARS-CoV-2 were analyzed by RNA seq and differential expression analysis. Differentially expressed genes are displayed as a heatmap.
Figure 5—figure supplement 2
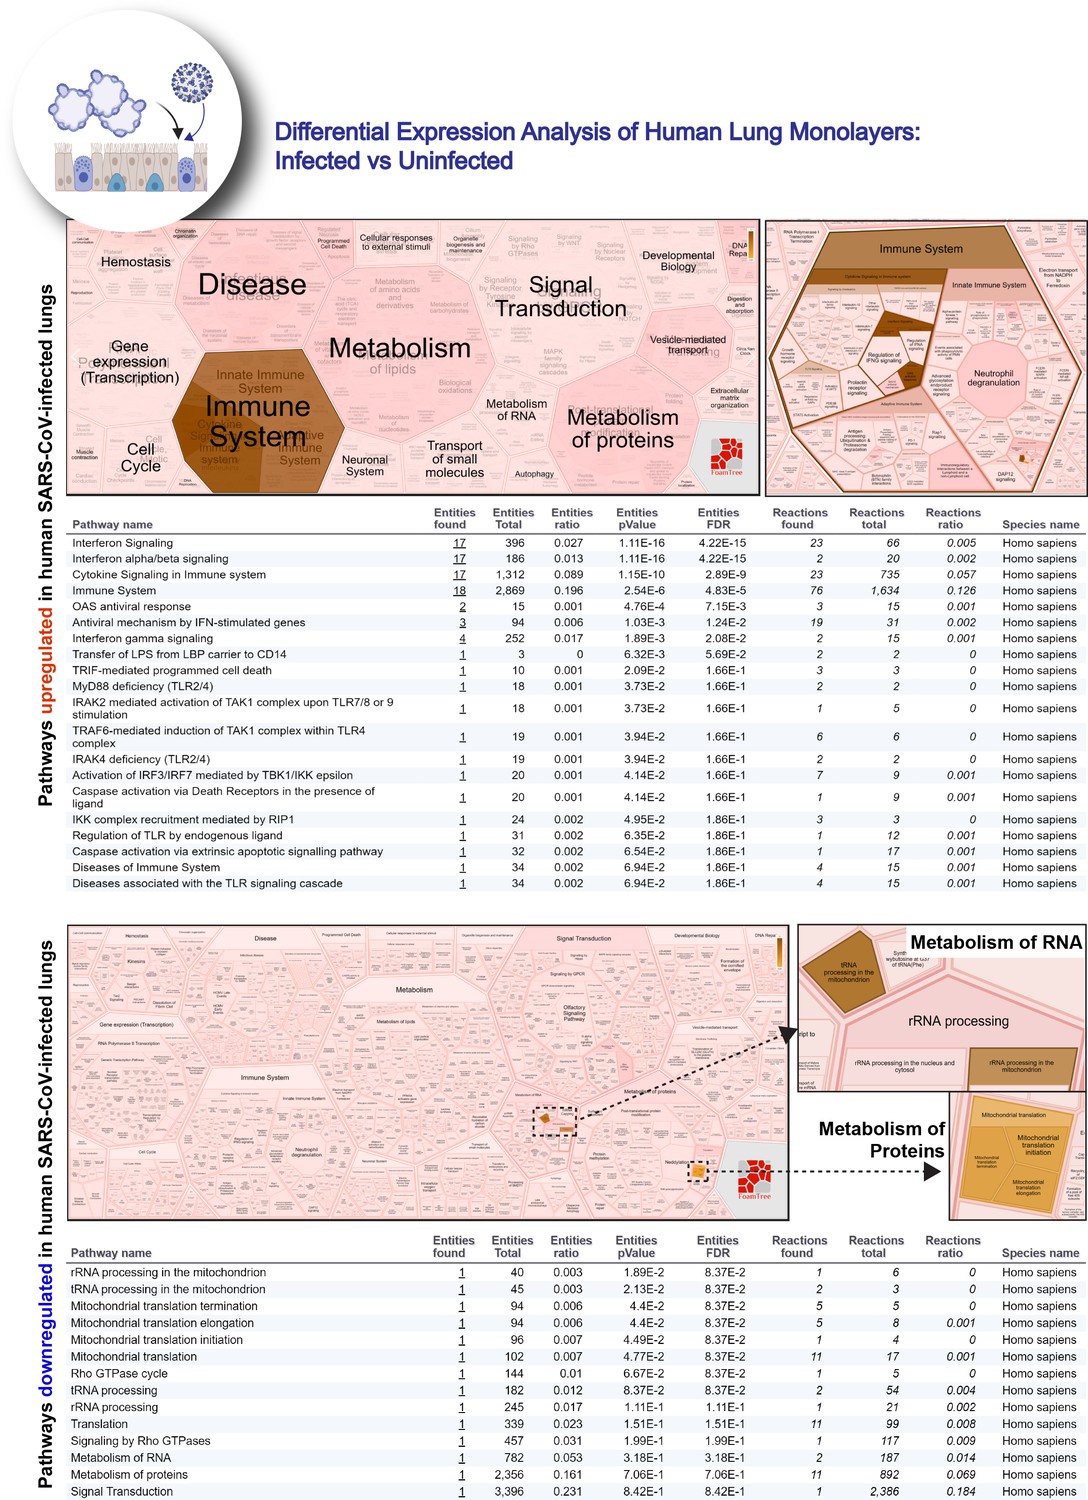
Reactome-pathway analysis of differentially expressed genes in lung organoid monolayers infected with SARS-CoV-2.
Reactome-pathway analysis of the differentially expressed genes shows the major pathways upregulated in SARS-CoV-2-infected lung organoid monolayers. Top: visualization as flattened (left) and hierarchical (right, insets) ReacFoam. Bottom: visualization of the same data as tables with statistical analysis indicative of the degree of pathway enrichment.
Figure 5—figure supplement 3
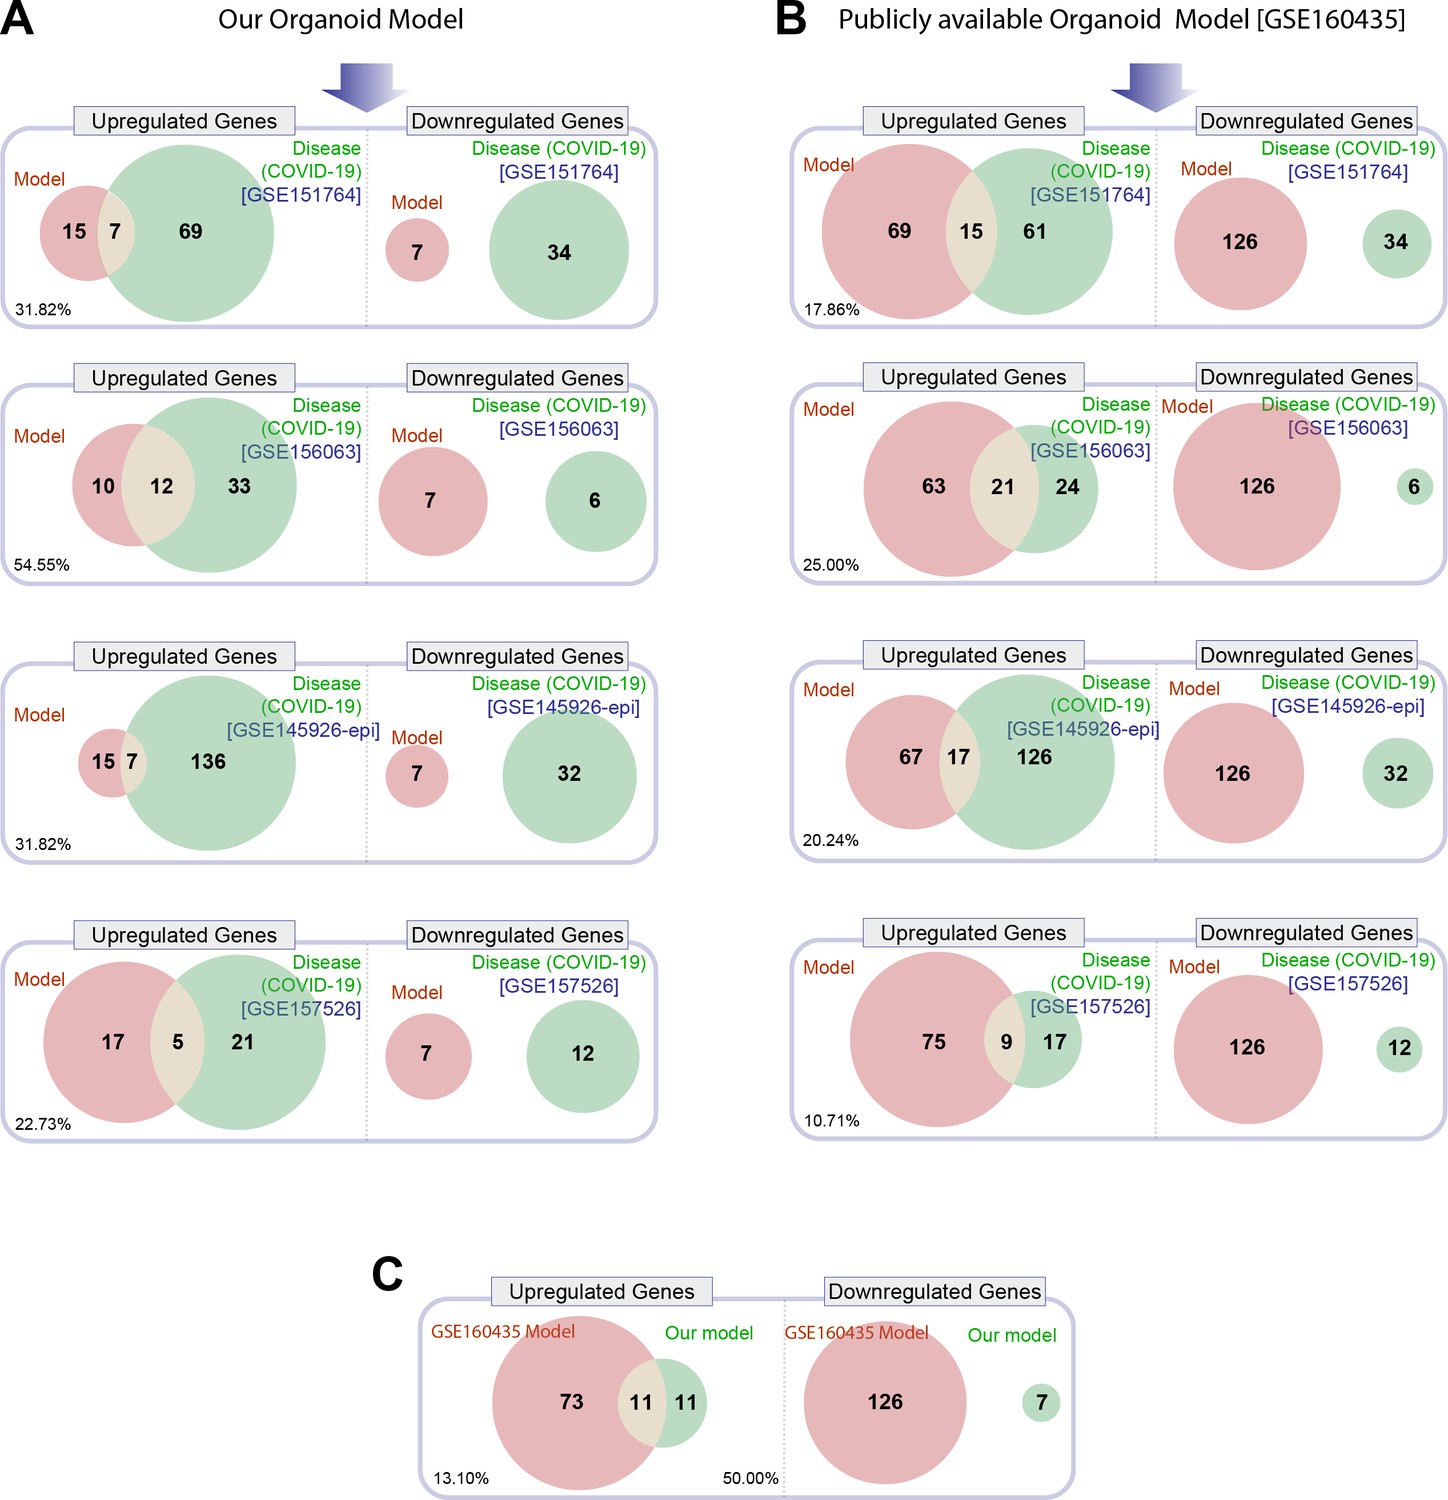
Head-to-head comparison of our adult lung organoid (ALO)-derived model of COVID-19 versus another lung organoid model in their ability to recapitulate the differentially expressed genes (DEGs) observed in lung tissues from fatal cases of COVID-19.
(A) Venn diagrams show the number of overlapping and nonoverlapping DEGs (both up- and downregulated genes) between our organoid model and four human COVID-19 patient-derived samples (left). GSE151764 represents postmortem COVID-19 and normal lung tissues; GSE156063 represents upper airway samples from patients with COVID-19; GSE145926 represents sorted epithelial population from bronchoalveolar lavage fluid (BALF) derived from patients with varying severity of COVID-19; GSE157526 represents tracheal-bronchial cells infected with SARS-Cov2. (B) Venn diagrams as in (A), comparing a publicly available SARS-Cov2-infected human lung organoid model (GSE160435) and the same four human COVID-19 respiratory cohorts as in (A). (C) Venn diagrams show the DEGs between our organoid model and the publicly available lung organoid model. The comparison was carried out by calculating the percentage of the common up/down DEGs represented within the total up/down DEG for the two models in each Venn diagram.
Figure 6
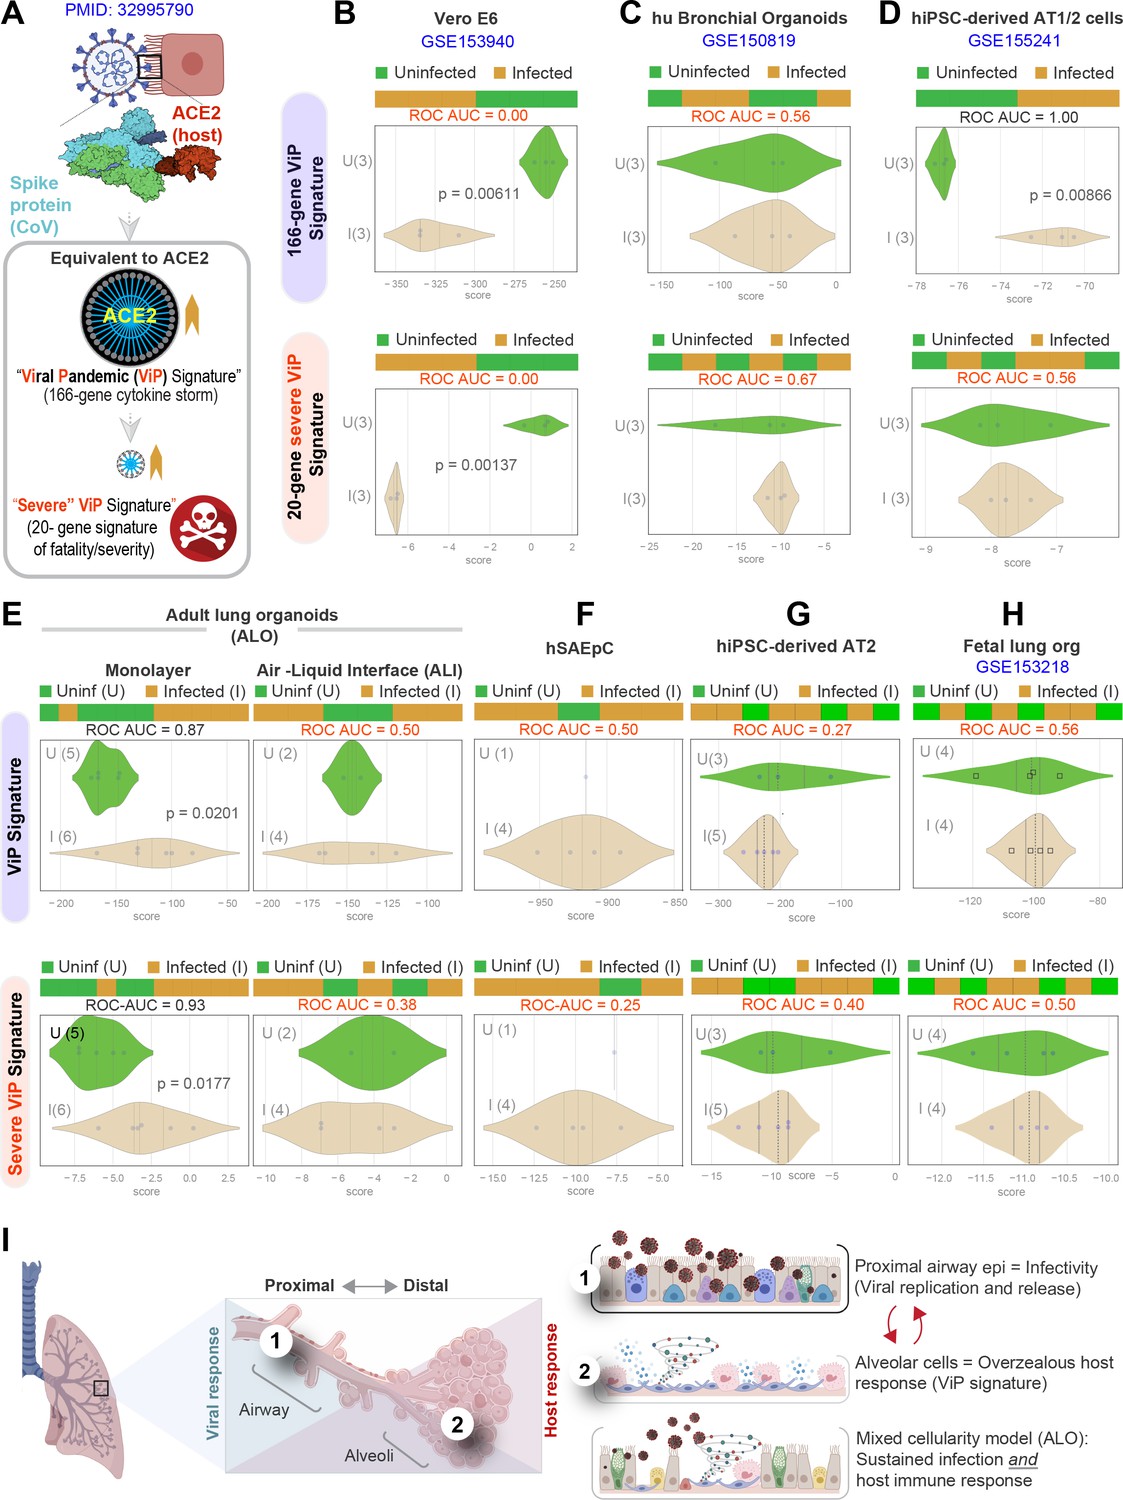
Both proximal and distal airway components are required to model the overzealous host response in COVID-19.
(A) Schematic summarizing the immune signatures identified based on ACE2-equivalent gene induction observed invariably in any respiratory viral pandemic. The 166-gene ViP signature captures the cytokine storm in COVID-19, whereas the 20-gene subset severe ViP signature is indicative of disease severity/fatality. (B–D) Publicly available RNA seq datasets from commonly used lung models, Vero E6 (B), human bronchial organoids (C), and hPSC-derived AT1/2 cell-predominant lung organoids are classified using the 166-gene ViP signature (top row) and 20-gene severity signature (bottom row). (E–G) RNA seq datasets generated in this work using either human small airway epithelial cells (E), adult lung organoids as submerged or air-liquid interphase (ALI) models (left and right, respectively, in F) and hiPSC-derived AT2 cells (G) were analyzed and visualized as in (B–D). (H) Publicly available RNA seq datasets from fetal lung organoid monolayers (Lamers et al., 2021) infected or not with SARS-CoV-2 were analyzed as in (B–D) for the ability of ViP signatures to classify infected (I) from uninfected (U) samples. Receiver operating characteristics area under the curve (ROC AUC) in all figure panels indicate the performance of a classification model using the ViP signatures. (I) Summary of findings in this work, its relationship to the observed clinical phases in COVID-19, and key aspects of modeling the same. Table 6 lists details regarding the patient cohorts/tissue or cell types represented in each transcriptomic dataset.
Author response image 1
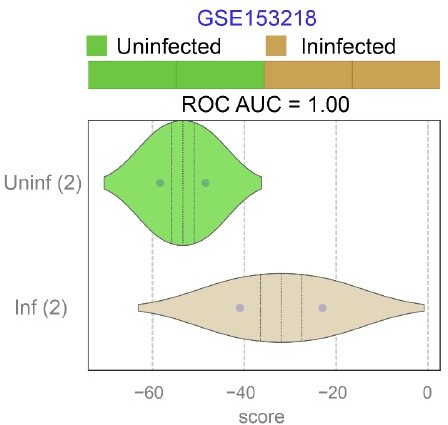
Publicly available RNA seq datasets (GSE153218) from Small Airway Epi (SAEp) monolayers12 infected or not with SARS-CoV-2 were analyzed for the ability of ViP signatures to classify infected (Inf) from uninfected (Uninf) samples.
ROC AUC indicate the performance of a classification model using the ViP signatures. Unlike the brochoalveolar monolayers (see Figure 6H in the revised manuscript) derived from fetal lung organoids in the same work, SAEp monolayers successfully induced the ViP signatures because the signatures were induced in infected monolayers.
Author response image 2
Author response image 3

Author response image 4
Tables
Table 1
A comparison of current versus existing lung organoid models available for modeling COVID-19.
| Author | Source of stem cells | Propagability | Cell types | SARS-COV-2 infection | Demonstrated reproducibility using more than one patient | Cost-effective (use of conditioned media) | Notes | |||||
|---|---|---|---|---|---|---|---|---|---|---|---|---|
| AT1 | AT2 | Club | Basal | Ciliated | Goblet | |||||||
| Zhou et alPMID: 29891677 | Small pieces of normal lung tissue adjacent to the diseased tissue from patients undergoing surgical resection for clinical conditions. | Long term culture > 1 y | Infection with H1N1 pandemic Influenza virus | Proximal differentiation (PD) of human Adult Stem Cell-derived airway organoid (AO) culture. Differentiation conditions (PneumaCult-ALI medium) increase ciliated cells. Serine proteases known to be important for productive viral infection, were elevated after PD. | ||||||||
| Sachs et alPMID: 30643021 | Generation of normal and tumor organoids from resected surplus lung tissue of patients with lung cancers. | long term culture for over 1 year | Not clearly mentioned | airway organoid (AO) expressed no mesenchyme or alveolar transcripts. Strongly enriched for bulk lung and small airway epithelial signature limited to basal, club, and ciliated cells Withdrawal of R-spondin terminated AO expansion after 3–4 passages similar to the withdrawal of FGFs | ||||||||
| Duan et alPMID: 32839764 | hPSC derived lung cells and macrophages | Low | SARS-CoV-2 infection mediated damage onset by macrophages. | Co-culture of lung cells and macrophages. Protocol followed enables alveolar differentiation process, although described presence of almost all lung cell types. | ||||||||
| Salahudeen et alPMID: 33238290 | Cells sorted from human peripheral lung tissues. | Distal Lung organoid with possibility of long-term culture | From differentiation of AT2 | After diff of basal cells | Infection and presence of dsRNA and nucleocapsid | No RNA seq of infected samples to compare with COVID Differentiation to different cell types SARS CoV2 infection in apical-out organoids (not polarized monolayers). The combination of EGF and the Noggin was optimal, without any additional growth-promoting effects of either WNT3A or R-spondin | ||||||
| Han et alPMID: 33116299 | hPSC-derived lung organoids | Organoids were generated by 50 days of differentiation | SARS-CoV-2 and SARS-CoV-2-Pseudo-Entry Viruses. | AT1, AT2, stromal cells, low number of pulmonary neuroendocrine cells, proliferating cells, and airway epithelial cells were reported. Mostly AT2 based ACE2 receptor was used for virus infection. High throughput screen using hPSC-derived lung organoids identified FDA-approved drug candidates, including imatinib and mycophenolic acid, as inhibitors of SARS-CoV-2 entry. | ||||||||
| Youk et alPMID: 33142113 | Adult alveolar stem cells isolated from distal lung parenchymal tissues by collagenase, dispase and sorting | Multiple passages upto 10 months | From AT2; Lost in higher passages | In the organoid form | Single cell transcriptomic profiling identified two clusters and type I interferon signal pathway are highly elevated at three dpi | |||||||
| Mulay et alPMID: 32637946doi.org/10.1101/2020.06.29.174623 | Alv organoids with distal lung epithelial cells with lung fibroblast cells | In the organoid form | Infection of AT2 cells trigger apoptosis that may contribute to alveolar injury. Alteration of innate immune response genes from AT2 cells | |||||||||
| Proximal airway ALI with heterogenous cells | Infection of ciliated and goblet cells Two separate models for SARS-CoV2 infection | |||||||||||
| Huang JPMID:32979316 | iPSC derived AT2 cell ALI model | Bulk RNA seq after day 1 and day four infection. The infection induces rapid inflammatory responses. | ||||||||||
| Abo et alPMID: 32577635doi: 10.1101/2020.06.03.132639 | iPSC derived basal cells as oranoids or 2D ALI | iPSCs transcripts match human lung better than cancer cell lines. iPSC AT2 cells express host genes mportant for SARS-CoV-2 infection. | ||||||||||
| iPSC AT2 cells as organoids or 2D ALI | ||||||||||||
| Rock et alPMID: 19625615 | Bronchospheres were isolated from human lung tissue. | Bronchospheres derived from human lung can act as stem cells and can differentiate into other cell types. | ||||||||||
| Lamers et alPMID: 33283287 | Lung organoids derived from fetal Lung epithelial bud tips and differentiated ALI model. | 14 passages | Detected SCGB3A2(ATII/club marker) | 2 subjects were mentioned | Organoid model derived from fetal lung bud tip tissue consists primarily of SOX2+ SOX9+ progenitor cells. Differentiation under ALI conditions is necessary to achieve mature alveolar epithelium. ALI model was found to contain mostly ATII and ATI cells, with small basal and rare neuroendocrine populations. SFTPC + Alveolar type II like cells were most readily infected by SARS-CoV-2. The infectious virus titer is much higher (five log) compared to other established model. | |||||||
| Suzuki et aldoi: https://doi.org/10.1101/2020.05.25.115600 | Commercially available adult HBEpC cells were used to generate human bronchial organoids. | In the organoid form | Organoids derived from HBEpC cells undergo differentiation process to achieve mature phenotype. Organoids are lacking distal epithelial cell types SARS-CoV-2 infection was performed on organoids and only the basolateral region came in to contact with the virus. Treatment with a TMPRSS2 inhibitor prior to infection demonstrated a reduction in infectivity. | |||||||||
| Tiwari et alPMID: 33631122 | Differentiated human iPSCs into lung organoids. | 80 days | In the organoid form | Organoids originated from iPSC cells and have proximal and distal epithelial cells. Infected organoids with SARS-CoV-2 and pseudovirus. SARS-CoV-2 pseudovirus entry was blocked by viral entry inhibitors. | ||||||||
| Tindle et al [Current study] | Deep lung tissue sections surgically obtained from patients undergoing lobe resections for lung cancers. | RNA Seq and cross-validation of COVID-19 model. Single model with all the cells types and infection of SARS-CoV2 in the 2D form with Apical accessibility that close to physiologic state. | ||||||||||
-
ACE2: angiotensin-converting enzyme II; ALI: air-liquid interphase; TMPRSS2: transmembrane serine protease 2.
-
Blue color cells denote the presence of the features.
-
Red color cells denote the absence of the features.
-
Grey color cells denote information not found.
Table 2
Markers used to identify various cell types in the lung.
| Cell type | Markers |
|---|---|
| AT1 | AQP5*$, PDPN*$$, Carboxypeptidase M, CAV-1, CAV-2, HTI56, HOPX, P2R × 4*$$, Na+/K + ATPase$, TIMP3*++, SEMA3F PDPN* AQP5* P2R × 4* TIMP3* SERPINE* |
| AT2 | ABCA3*$$, CC10 (SCGB1A1*)+, CD44v6, Cx32, gp600++, ICAM-1++, KL-6, LAMP3*$$, MUC1, SFTPA1*$$, SFTPB*$, SFTPC*+, SFTPD*, SERPINE1 |
| Club | CC10 (SCGB1A1*)+, CYP2F2*, ITAG6*$$, SCGB3A2*$$, SFTPA1*$$, SFTPB*$, SFTPD* |
| Goblet | CDX-2*, MUC5AC*, MUC5B*, TFF3*, UEA1+ |
| Ciliated | ACT (ACTG2*)$, BTub4 (TUBB4A*), FOXA3*++, FOXJ1*, SNTN* |
| Basal | CD44v6 (CD44*), ITGA6*$$, KRT5*$, KRT13*, KRT14*, p63 (CKAP4*), p75 (NGFR*)$$ |
| Generic Lung Lineage | Cx43 (GJA1*), TTF-1 (TTF1*; Greatest in AT2 & Club), EpCAM (EPCAM*) |
-
*Markers used for single-cell gating (Figure 1A).
-
$ denotes markers used in this work for Immunofluorescence (IF).
-
$$ denotes markers used in this work for qPCR.
-
+ denotes markers used in both IF and qPCR.
-
++ denotes obscure markers (Not a lot of research relative to lung).
Table 3
Characteristics of patients enrolled into this study for obtaining lung tissues to serve as source of stem cells to generate lung organoids.
| Name | Date of surgery | Age | Sex | Smoking history | Reason for surgery | Histology |
|---|---|---|---|---|---|---|
| ALO1 | 4/17/2020 | 64 | Male | Current, chronic smokerPacks/day: 0.50Years: 53Pack years: 26.5 | Lung carcinoma | Invasive squamous cell carcinoma, non-keratinizing |
| ALO2 | 4/17/2020 | 59 | Male | Non-smoker | Lung carcinoma | Invasive adenocarcinoma |
| ALO3 | 7/7/2020 | 46 | Female | Non-smoker | Left lower lobe nodule | Invasive adenocarcinoma |
Table 4
Upregulated genes and pathways: healthy vs COVID-19 lung (GSE151764).
| Genes | ||||
|---|---|---|---|---|
| BRCA2 | XAGE1B | CDK1 | SNAI2 | CXCL11 |
| CYBB | CCR5 | GBP1 | IFITM1 | IFI27 |
| KRT5 | CCR2 | HLA-G | GZMB | IFI35 |
| C1QB | ALOX15B | IDO1 | CD163 | TDO2 |
| FCGR1A | CMKLR1 | ISG20 | CD38 | GZMA |
| IL10 | MX1 | LAG3 | BST2 | OAS3 |
| IL6 | TNFRSF17 | MAD2L1 | BUB1 | POU2AF1 |
| CD44 | CCR1 | CXCL9 | CCL20 | CXCL13 |
| CD276 | CXCR3 | MKI67 | CCNB2 | GNLY |
| DMBT1 | SLAMF8 | IFIT2 | TNFSF18 | IFIT3 |
| DDX58 | IL21 | IFIT1 | ISG15 | TOP2A |
| TNFAIP8 | FOXM1 | CXCL10 | CDKN3 | LILRB1 |
| LAMP3 | IFIH1 | IRF4 | C1QA | HERC6 |
| KIAA0101 | IFI6 | PSMB9 | OAS1 | TNFSF13B |
| MELK | PDCD1LG2 | CCL18 | OAS2 | IFI44L |
| Pathways | STAT1 | |||
| Name | p-value | FDR | ||
| Interferon signaling | 1.11E-16 | 1.11E-14 | ||
| Interferon alpha/beta signaling | 1.11E-16 | 1.11E-14 | ||
| Cytokine signaling in immune system | 1.11E-16 | 1.11E-14 | ||
| Immune ssystem | 1.11E-16 | 1.11E-14 | ||
| Interleukin-10 signaling | 9.85E-13 | 7.88E-11 | ||
| Interferon gamma signaling | 9.26E-12 | 6.11E-10 | ||
| Chemokine receptors bind chemokines | 1.08E-10 | 6.17E-09 | ||
| Signaling by interleukins | 6.81E-09 | 3.41E-07 | ||
| Insulin-like growth factor-2 mRNA binding proteins (IGF2BPs/IMPs/VICKZs) bind RNA | 1.27E-07 | 0.000005581122619 | ||
| Antiviral mechanism by IFN-stimulated genes | 0.000001933058349 | 0.00007732233398 | ||
| CD163 mediating an anti-inflammatory response | 0.000007798676169 | 0.0002807523421 | ||
| OAS antiviral response | 0.00001020870997 | 0.0003368874291 | ||
| Peptide ligand-binding receptors | 0.00001714057687 | 0.0005142173062 | ||
| Interleukin-4 and Interleukin-13 signaling | 0.0001014948661 | 0.002841856252 | ||
| Cyclin A/B1/B2-associated events during G2/M transition | 0.0001887816465 | 0.00490832281 | ||
| G0 and early G1 | 0.0003607121838 | 0.009017804596 | ||
| Interleukin-6 signaling | 0.0004656678444 | 0.01071036042 | ||
| ISG15 antiviral mechanism | 0.0008313991988 | 0.01745938317 | ||
| Regulation of APC/C activators between G1/S and early anaphase | 0.0008313991988 | 0.01745938317 | ||
| Polo-like kinase-mediated events | 0.001110506513 | 0.02221013026 | ||
| APC/C-mediated degradation of cell cycle proteins | 0.001308103581 | 0.02354586446 | ||
| Regulation of mitotic cell cycle | 0.001308103581 | 0.02354586446 | ||
| G2/M DNA replication checkpoint | 0.001750156332 | 0.02975265764 | ||
| Class A/1 (rhodopsin-like receptors) | 0.002355063045 | 0.03537666782 | ||
| Interleukin-6 family signaling | 0.002358444521 | 0.03537666782 | ||
| TNFs bind their physiological receptors | 0.002358444521 | 0.03537666782 |
Table 5
Downregulated genes and pathways: healthy vs COVID-19 lung (GSE151764).
| Genes | ||||
|---|---|---|---|---|
| CX3CR1 | JAML | KLRB1 | GRAP2 | CD226 |
| ARG1 | CX3CR1 | LY9 | MMP9 | CD160 |
| MPO | HLA-DQB2 | CCL17 | RORC | FOXP3 |
| IL2 | TNFRSF9 | CCL22 | CCR4 | CRTAM |
| BCL2 | CXCR5 | TCF7 | IRS1 | CCR6 |
| CA4 | CD1C | CXCR4 | ITK | CEACAM8 |
| IGF1R | CD69 | CD83 | KLRG1 | PTGS2 |
| Pathways | ||||
| Name | p-value | FDR | ||
| Chemokine receptors bind chemokines | 2.85E-11 | 4.98E-09 | ||
| Immune system | 1.25E-10 | 1.09E-08 | ||
| Interleukin-4 and interleukin-13 signaling | 2.82E-09 | 1.64E-07 | ||
| RUNX1 and FOXP3 control the development of regulatory T lymphocytes (Tregs) | 4.31E-07 | 0.00001853717999 | ||
| Peptide ligand-binding receptors | 6.71E-07 | 0.00002348305743 | ||
| Signaling by Interleukins | 0.000001503658493 | 0.0000436060963 | ||
| Cytokine signaling in Immune system | 0.00002606505855 | 0.0006516264636 | ||
| Dectin-1-mediated noncanonical NF-kB signaling | 0.00008640543215 | 0.001814514075 | ||
| Immunoregulatory interactions between a lymphoid and a non-lymphoid cell | 0.0001083388675 | 0.002058438482 | ||
| Class A/1 (rhodopsin-like receptors) | 0.0001833048828 | 0.003116183008 | ||
| Interleukin-10 signaling | 0.0002366961934 | 0.0035504429 | ||
| RUNX3 regulates immune response and cell migration | 0.0005791814113 | 0.007747184934 | ||
| Extra-nuclear estrogen signaling | 0.0005959373026 | 0.007747184934 | ||
| BH3-only proteins associate with and inactivate anti-apoptotic BCL-2 members | 0.0006992547523 | 0.008391057028 | ||
| CLEC7A (Dectin-1) signaling | 0.0008228035145 | 0.00905083866 | ||
| Generation of second messenger molecules | 0.001171991908 | 0.01171991908 | ||
| Innate immune system | 0.001676404092 | 0.01572360367 | ||
| GPCR ligand binding | 0.001747067074 | 0.01572360367 | ||
| Adaptive immune system | 0.002059835991 | 0.01853852391 | ||
| Estrogen-dependent nuclear events downstream of ESR-membrane signaling | 0.00467005583 | 0.03736044664 | ||
| C-type lectin receptors (CLRs) | 0.00545804495 | 0.0436643596 | ||
| Transcriptional regulation by RUNX3 | 0.008124332599 | 0.05687032819 | ||
| BMAL1:CLOCK, NPAS2 activates circadian gene expression | 0.009518272709 | 0.06662790896 | ||
| ESR-mediated signaling | 0.01207376237 | 0.08451633662 | ||
| Transcriptional regulation by RUNX1 | 0.01288156371 | 0.08786708747 | ||
| TCR signaling | 0.01464451458 | 0.08786708747 |
Table 6
The list of GSE numbers used in the figures.
| GSE# | Cell type/tissue | References | Figure |
|---|---|---|---|
| GSE132914 | Tissue from idiopathic pulmonary fibrosis subjects and donor controls | PMID:32991815 | Figure 1A |
| GSE151764 | COVID-19 and normal lung tissue post-mortem | PMID:33033248 | Figure 4A–E, Figure 5E–G |
| GSE155241 | hPSC lung organoids and colon organoids infected with SARS-CoV-2 | PMID:33116299 | Figure 4E,F, Figure 6D |
| GSE156063 | Upper airway of COVID-19 patients and other acute respiratory illnesses | PMID:33203890 | Figure 4E, Figure 5F,H |
| GSE147507 | A549 cells and bulk lung | PMID:32416070; PMID:33782412 | Figure 4E,F, Figure 5F |
| GSE145926 | Bronchoalveolar lavage fluid (BALF) immune cells from COVID-19 and healthy subjects | PMID:32398875 | Figure 4E, Figure 5F,I |
| GSE150819 | Human bronchial organoids | From commercially available HBEpC | Figure 4F, Figure 6C |
| GSE149312 | Intestinal organoids infected with SARS-CoV or SARS-CoV-2 | PMID:32358202 | Figure 4F |
| GSE151803 | hPSC-derived pancreatic and lung organoids infected with SARS-CoV-2 | No publication yet | Figure 4F |
| GSE153940 | Vero E6 control or SARS-CoV-2-infected cells | PMID:32707573 | Figure 6B |
| GSE153218 | SARS-CoV-2-infected bronchoalveolar cells derived from organoids grown using progenitor cells from human fetal lung but tip (LBT). | PMID:33283287 | Figure 6H |
Table 7
Upregulated genes and pathways: uninfected vs infected (48 hpi) lung organoid monolayers.
| Genes | |||
|---|---|---|---|
| IFI35 | EPSTI1 | AMIGO2 | IFITM2 |
| SLC4A11 | CMPK2 | WARS1 | FAAP100 |
| APOL1 | OASL | IFI27 | ISG15 |
| OAS3 | IFI44L | CD14 | SLC35F6 |
| IFIT3 | IFI44 | SAMD9L | |
| IFIT2 | PARP9 | SRP9P1 | |
| Pathways | |||
| Name | p-value | FDR | |
| Interferon signaling | 1.11E-16 | 4.22E-15 | |
| Interferon alpha/beta signaling | 1.11E-16 | 4.22E-15 | |
| Cytokine signaling in Immune system | 1.15E-10 | 2.89E-09 | |
| Immune system | 0.000002540114879 | 0.00004826218271 | |
| OAS antiviral response | 0.0004764545663 | 0.007146818495 | |
| Antiviral mechanism by IFN-stimulated genes | 0.001033347261 | 0.01240016713 | |
| Interferon gamma signaling | 0.001889694619 | 0.02078664081 | |
| Transfer of LPS from LBP carrier to CD14 | 0.006318772245 | 0.05686895021 | |
| TRIF-mediated programmed cell death | 0.02091267586 | 0.1656073329 | |
| MyD88 deficiency (TLR2/4) | 0.03733748271 | 0.1656073329 | |
| IRAK2-mediated activation of TAK1 complex upon TLR7/8 or 9 stimulation | 0.03733748271 | 0.1656073329 | |
| TRAF6-mediated induction of TAK1 complex within TLR4 complex | 0.03937173812 | 0.1656073329 | |
| IRAK4 deficiency (TLR2/4) | 0.03937173812 | 0.1656073329 | |
| Activation of IRF3/IRF7 mediated by TBK1/IKK epsilon | 0.04140183322 | 0.1656073329 | |
| Caspase activation via death receptors in the presence of ligand | 0.04140183322 | 0.1656073329 | |
| IKK complex recruitment mediated by RIP1 | 0.04948077476 | 0.1855013265 |
Table 8
Downregulated genes and pathways: uninfected vs. infected (48 hpi) lung organoid monolayers.
| AC093392.1 | ARHGAP19 | HLA-V | RN7SL718P |
| MT-TV | AC138969.3 | AC016766.1 | |
| Pathways | |||
| Name | p-value | FDR | |
| rRNA processing in the mitochondrion | 0.01892731246 | 0.08366120773 | |
| tRNA processing in the mitochondrion | 0.02127149105 | 0.08366120773 | |
| Mitochondrial translation termination | 0.04399155446 | 0.08366120773 | |
| Mitochondrial translation elongation | 0.04399155446 | 0.08366120773 | |
| Mitochondrial translation initiation | 0.04490921762 | 0.08366120773 | |
| Mitochondrial translation | 0.04765767844 | 0.08366120773 |
Key resources table
| Reagent type (species) or resource | Designation | Source or reference | Identifiers | Additional information |
|---|---|---|---|---|
| Antibody | Anti-ACE2 (mouse monoclonal) | Santa Cruz | Cat# sc390851RRID::AB_2861379 | IF (1:100) |
| Antibody | Anti-human ACE2 (rat monoclonal) | BioLegend | Cat# 375802RRID::AB_2860959 | IF (1:50) |
| Antibody | Anti-acetylated ɑ tubulin (mouse monoclonal) | Santa Cruz | Cat# sc23950RRID::AB_628409 | IF (1:500)FC (1:8000) |
| Antibody | Anti-AQP5 (mouse monoclonal) | Santa Cruz | Cat# sc514022RRID::AB_2891066 | IF (1:100)FC (1:800) |
| Antibody | Anti-CC10 (mouse monoclonal) | Santa Cruz | Cat# sc365992RRID::AB_10915481 | IF (1:100) |
| Other | DAPI | Invitrogen | Cat# D1306RRID::AB_2629482 | IF (1:500) |
| Antibody | Recombinant anti-cytokeratin 5 (rabbit monoclonal) | Abcam | Cat# ab52635RRID::AB_869890 | IF (1:100)FC (1:8000) |
| Antibody | Recombinant anti-mucin 5AC (rabbit monoclonal) | Abcam | Cat# ab229451RRID::AB_2891067 | IF (1:150)FC (1:800) |
| Antibody | Anti-sodium potassium ATPase (rabbit monoclonal) | Abcam | Cat# ab76020RRID::AB_1310695 | IF (1:400) |
| Antibody | Anti-occludin (mouse monoclonal) | Thermo Fisher | Cat# OC-3F10RRID::AB_2533101 | IF (1:500) |
| Other | Phalloidin, Alexa Fluor 594 | Invitrogen | Cat# A12381RRID:AB_2315633 | IF (1:500) |
| Other | Propidium iodide | Invitrogen | V13241 | FC (1:100) |
| Antibody | SARS-CoV/SARS-CoV-2 nucleocapsid antibody (mouse monoclonal) | Sino Biological | Cat# 40143-MM05RRID::AB_2827977 | IF (1:250)IHC (1:500) |
| Antibody | Anti-SARS spike glycoprotein (mouse monoclonal) | Abcam | Cat# ab273433RRID::AB_2891068 | IHC (1:250) |
| Antibody | anti-SP-B (mouse monoclonal) | Santa Cruz | Cat# sc133143RRID::AB_2285686 | IF (1:100)FC (1:8000) |
| Antibody | Anti-prosurfactant protein C (rabbit polyclonal) | Abcam | Cat# ab90716RRID::AB_10674024 | IF (1:150) |
| Antibody | Goat anti-rat IgG H&L secondary antibody, Alexa Flour 594 | Invitrogen | Cat# A-11007RRID:AB_10561522 | IF (1:500) |
| Antibody | Goat anti-rabbit IgG H&L secondary antibody, Alexa Fluor 594 | Invitrogen | Cat# A-11012RRID:AB_2534079 | IF (1:500) |
| Antibody | Goat anti-mouse IgG H&L secondary antibody, Alexa Fluor 488 | Invitrogen | Cat# A-11011RRID:AB_143157 | IF (1:500)FC (1:1000) |
| Antibody | Goat anti-rabbit IgG H&L secondary antibody, Alexa Fluor 488 | Abcam | Cat# ab150077RRID:AB_2630356 | FC (1:1000) |
| Other | Countess II Automated Cell Counter | Thermo Fisher Scientific | AMQAX1000 | Section‘The preparation of lung organoid-derived monolayers’ |
| Other | Epithelial Volt-Ohm (TEER) Meter | Millipore | MERS00002 | Section ‘Permeability of lung monolayer using FITC-dextran’ |
| Other | Leica TCS SPE Confocal | Leica Microsystems | TCS SPE | Section‘Immunofluorescence’ |
| Other | Power Pressure Cooker XL | Tristar Products | Section‘Immunohistochemistry’ | |
| Other | Canon Rebel XS DLSR | Canon | Figure 2—figure supplement 1 | |
| Other | MiniAmp Plus Thermal Cycler | Applied Biosystems | Cat# A37835 | Section‘Quantitative (q)RT-PCR’ |
| Other | QuantStudio5 | Applied Biosystems | Cat# A28140 RRID:SCR_020240 | Section‘Quantitative (q)RT-PCR’ |
| Other | Light Microscope (brightfield images) | Carl Zeiss LLC | Axio Observer, Inverted; 491917-0001-000 | Figure 2—figure supplement 1 |
| Other | Spark 20 M Multimode Microplate Reader | Tecan | Section‘Permeability of lung monolayer using FITC-dextran’ | |
| Other | Guava easyCyte Benchtop Flow Cytometer | Millipore | Guava easyCyte 62L | Section‘The characterization of lung cell types using flow cytometry’ |
| Software, algorithm | ImageJ | ImageJ | RRID:SCR_003070 | |
| Software, algorithm | GraphPad Prism | GraphPad Prism | RRID:SCR_002798 | |
| Software, algorithm | LAS AF Software | LAS AF Software | ||
| Software, algorithm | QuantStudio Design & Analysis Software | QuantStudio Design & Analysis Software | ||
| Software, algorithm | CIBERSORTx | CIBERSORTx | ||
| Software, algorithm | FlowJo | FlowJo V10, BD BioSciences | RRID:SCR_008520 | |
| Chemical compound, drug | Zinc formalin | Fisher Scientific | Cat# 23-313096 | |
| Chemical compound, drug | Xylene | VWR | Cat# XX0060-4 | |
| Chemical compound, drug | Hematoxylin | Sigma-Aldrich Inc | Cat# MHS1 | |
| Chemical compound, drug | Ethanol | Koptec | Cat# UN1170 | |
| Chemical compound, drug | Sodium citrate | Sigma-Aldrich | Cat# W302600 | |
| Chemical compound, drug | DAB (10×) | Thermo Fisher | Cat# 1855920 | (1:10) |
| Chemical compound, drug | Stable peroxidase substrate buffer (10×) | Thermo Fisher | Cat# 34062 | (1:10) |
| Chemical compound, drug | 3%hydrogen peroxide | Target | Cat# 245-07-3628 | |
| Chemical compound, drug | Horse serum | Vector Labs | Cat# 30022 | |
| Commercial assay or kit | HRP Horse Anti-Rabbit IgG Polymer Detection Kit | Vector Laboratories | Cat# MP-7401 | |
| Chemical compound, drug | Paraformaldehyde 16% Solution, EM Grade | Electron Microscopy Sciences | Cat# 15710 | |
| Chemical compound, drug | 100%methanol | Supelco | Cat# MX0485 | |
| Chemical compound, drug | Glycine | Fisher Scientific | Cat# BP381-5 | |
| Chemical compound, drug | Bovine serum albumin | Sigma-Aldrich | Cat# A9647-100G | |
| Chemical compound, drug | Triton-X 100 | Sigma-Aldrich | Cat# X100-500ML | |
| Chemical compound, drug | ProLong Glass | Invitrogen | Cat# P36984 | |
| Chemical compound, drug | Nail Polish (Rapid Dry) | Electron Microscopy Sciences | Cat# 72180 | |
| Chemical compound, drug | Gill Modified Hematoxylin (Solution II) | Millipore Sigma | Cat# 65066-85 | |
| Chemical compound, drug | HistoGel | Thermo Scientific | Cat# HG4000012 | |
| Chemical compound, drug | TrypLE Select | Thermo Scientific | Cat# 12563-011 | |
| Chemical compound, drug | Advanced DMEM/F-12 | Thermo Scientific | Cat# 12634-010 | |
| Chemical compound, drug | HEPES buffer | Life Technologies | Cat# 15630080 | |
| Chemical compound, drug | Glutamax | Thermo Scientific | Cat# 35050-061 | |
| Chemical compound, drug | Penicillin-streptomycin | Thermo Scientific | Cat# 15140-122 | |
| Chemical compound, drug | Collagenase type I | Thermo Scientific | Cat# 17100-017 | |
| Chemical compound, drug | Matrigel | Corning | Cat# 354234 | |
| Chemical compound, drug | B-27 | Thermo Scientific | Cat# 17504044 | |
| Chemical compound, drug | N-acetyl-L-cysteine | Sigma-Aldrich | Cat# A9165 | |
| Chemical compound, drug | Nicotinamide | Sigma-Aldrich | Cat# N0636 | |
| Chemical compound, drug | FGF-7 (KGF) | PeproTech | Cat# 100-19-50ug | |
| Chemical compound, drug | FGF10 | PeproTech | Cat# 100-26-50ug | |
| Chemical compound, drug | A-83-01 | Bio-Techne Sales Corp. | Cat# 2939/50 | |
| Chemical compound, drug | SB202190 | Sigma-Aldrich | Cat# S7067-25MG | |
| Chemical compound, drug | Y-27632 | R&D Systems | Cat# 1254/50 | |
| Chemical compound, drug | DPBS | Thermo Scientific | Cat# 14190-144 | |
| Chemical compound, drug | Ultrapure Water | Invitrogen | Cat# 10977-015 | |
| Chemical compound, drug | EDTA | Thermo Scientific | Cat# AM9260G | |
| Chemical compound, drug | Hydrocortisone | STEMCELL Technologies | Cat# 7925 | |
| Chemical compound, drug | Heparin | Sigma-Aldrich | Cat# H3149 | |
| Other | PneumaCult Ex-Plus Medium | STEMCELL Technologies | Cat# 5040 | Section‘The preparation of lung organoid-derived monolayers’ |
| Other | PneumaCult ALI Medium | STEMCELL Technologies | Cat# 5001 | Section‘ALImodel of lung organoids’ |
| Chemical compound, drug | Goat serum | Vector Laboratories | Cat# MP-7401 | |
| Chemical compound, drug | Fetal bovine serum | Sigma-Aldrich | Cat# F2442-500ML | |
| Chemical compound, drug | Animal Component-Free Cell Dissociation Kit | STEMCELL Technologies | Cat# 5426 | |
| Chemical compound, drug | Red Blood Cell Lysis Buffer | Invitrogen | Cat# 00-4333-57 | |
| Chemical compound, drug | Cell Recovery Solution | Corning | Cat# 354253 | |
| Chemical compound, drug | Sodium azide | Fisher Scientific | Cat# S227I-100 | |
| Chemical compound, drug | Cyto-Fast Fix/Perm Buffer Set | BioLegend | Cat# 426803 | |
| Chemical compound, drug | FITC-dextran | Sigma-Aldrich | Cat# FD10S | |
| Commercial assay or kit | Quick-RNA MicroPrep Kit | Zymo Research | Cat# R1051 | |
| Commercial assay or kit | Quick-RNA MiniPrep Kit | Zymo Research | Cat#R1054 | |
| Chemical compound, drug | Ethyl alcohol, pure | Sigma-Aldrich | Cat# E7023 | |
| Chemical compound, drug | TRI Reagent | Zymo Research | Cat# R2050-1-200 | |
| Sequence-based reagent | 2x SYBR Green qPCR Master Mix | Bimake | Cat# B21203 | |
| Sequence-based reagent | qScript cDNA SuperMix | Quanta Biosciences | Cat# 95048 | |
| Sequence-based reagent | Applied Biosystems TaqMan Fast Advanced Master Mix | Thermo Scientific | Cat# 4444557 | |
| Sequence-based reagent | 18S, Hs99999901_s1 | Thermo Scientific | Cat# 4331182 | |
| Sequence-based reagent | E_Sarbeco_F1 Forward Primer | IDT | Cat# 10006888 | |
| Sequence-based reagent | E_Sarbeco_R2 Reverse Primer | IDT | Cat# 10006890 | |
| Sequence-based reagent | E_Sarbeco_P1 Probe | IDT | Cat# 10006892 | |
| Other | 12-well Tissue Culture Plate | CytoOne | Cat# CC7682-7512 | Section‘Isolation and culture of human whole lung-derived organoids’ |
| Other | Transwell Inserts (6.5 mm, 0.4µm pore size) | Corning | Cat# 3470 | Section‘The preparation of lung organoid-derived monolayers’ |
| Other | Microscope Cover Glass (#1 Thickness) 24 × 50 mm | VWR | Cat# 16004-098 | Section‘Immunofluorescence’ |
| Other | Microscope Cover Glass (#1 Thickness) 25 mm diameter | Chemglass Life Sciences | Cat# CLS-1760-025 | Section‘Immunofluorescence’ |
| Other | Millicell EZ Slide 8-Well Chamber | Millipore Sigma | Cat# PEZGS0816 | Section‘Immunofluorescence’ |
| Other | Trypan Blue Stain | Invitrogen | Cat# T10282 | (1:2) |
| Other | 70µm Cell Strainer | Thermo Fisher Scientific | Cat# 22-363-548 | Section‘The preparation of lung organoid-derived monolayers’ |
| Other | 100 µm Cell Strainer | Corning | Cat# 352360 | Section‘Isolation and culture of human whole lung-derived organoids’ |
| Other | Noyes Spring Scissors – Angled | Fine Science Tools | Cat# 15013-12 | Section‘Isolation and culture of human whole lung-derived organoids’ |
Author response table 1
| Approach | PROS | CONS | Major conclusion | Caution |
|---|---|---|---|---|
| FACS of dispersed cells from organoids | HighthroughputanalysisAnalyzes protein, nottranscripts | Ab-related artifactsHas the potential to introduce artifactsduring dissociation | Mixed cellularity was confirmed in all 3 ALO lines.Mixed cellularity is retained despite the passage | This methodology, standalone, is not appropriate to draw conclusions regarding the absolute proportions of each cell type because of shared markers, and antibody limitations |
| Targeted qPCR | Highly sensitive andspecific | Low-throughputanalysis that only measures transcript, but does not inform about protein translation | Mixed cellularity was confirmed in all 3 ALO lines.Mixed cellularity is retained despite passage | this methodology, standalone, is not sufficient to draw conclusions regarding the proportions of each cell type because of shared transcripts between cell types. |
| RNASeq>deconvolution using CYBERSORTx | highthroughput analysis | Results are as good as our collective knowledge of cell type markers, many of which are shared | Mixed cellularity was confirmed in all 3 ALO lines.Mixed cellularity is retained despite the passage | this methodology, standalone, is not sufficient to draw conclusions regarding the proportions of each cell type because of shared transcripts between cell types |
| In situ detection of protein by immunostaining of3D/2D organoids | Detection of protein (not just transcript) and with fewerartifactsbecause of in situ analysis | Low-throughput qualitative analysis | We prioritized this methodology over others and used two different approaches (FFPE samples after embedding in Histogel Figure 2I-J and direct fixation with PFA/methanol, Figure 2K) to reduce the fixation related aritfacts of any one particular methodology. | Although this approach was the best way to show mixed cellularity in each line, and at times, within the same 3D organoid structure, it is low throughput and qualitative (not quantitative), and hence, not suitable to be used for serial imaging of markers to estimate % cellularity/composition. |
Additional files
Download links
A two-part list of links to download the article, or parts of the article, in various formats.
Downloads (link to download the article as PDF)
Open citations (links to open the citations from this article in various online reference manager services)
Cite this article (links to download the citations from this article in formats compatible with various reference manager tools)
Adult stem cell-derived complete lung organoid models emulate lung disease in COVID-19
eLife 10:e66417.
https://doi.org/10.7554/eLife.66417


