Parallel evolution between genomic segments of seasonal human influenza viruses reveals RNA-RNA relationships
- Department of Microbiology & Molecular Genetics, University of Pittsburgh, United States
- Center for Evolutionary Biology and Medicine, University of Pittsburgh, United States
- Center for Vaccine Research, University of Pittsburgh School of Medicine, United States
- Department of Cell Biology, Center for Biologic Imaging, University of Pittsburgh, United States
- Department of Biomedical Informatics, University of Pittsburgh, United States
Figures
Figure 1 with 2 supplements

Experimental overview.
(A) Human H3N2 or H1N1 virus sequences were downloaded from the Influenza Research Database and subset into two time periods each: 1995 to 2004 and 2005 to 2014 (H3N2 viruses); 2000 to 2008 and 2010 to 2018 (H1N1 viruses). The H3N2 virus dataset (1995 to 2004) is illustrated here. All eight viral RNA (vRNA) segments from each strain were concatenated into a full-length genome from which alignments were made. (B) A species tree was built clustering strains into operational taxonomic unit with at least 97% sequence identity. Arrowheads denote clusters 1–12. Seven replicate strains were randomly selected from each cluster for further analysis. (C) Full-length genomic sequences were partitioned into individual vRNA gene sequence alignments and maximum-likelihood phylogenetic trees were reconstructed from each vRNA gene segment in each replicate. Tree similarity was determined by the Robinson-Foulds distance (RF) and clustering information distance (CID) in each pair of trees. Left, a pair of highly similar trees with a low tree distance plotted in a tanglegram (e.g. back-to-back trees), with intersecting blue lines matching tips. Right, a tanglegram of a pair of dissimilar trees with a high tree distance. Scale bars indicate substitutions per site. (D) Colocalization of vRNA segments exhibiting high and low tree similarity were assessed by fluorescence in situ hybridization (FISH). Cells were infected with viruses representative of those analyzed in (A–C) and fixed and stained with FISH probes specific for vRNA segments of interest. Cells were imaged using confocal microscopy and colocalization between vRNA segments was quantified.
Figure 1—figure supplement 1
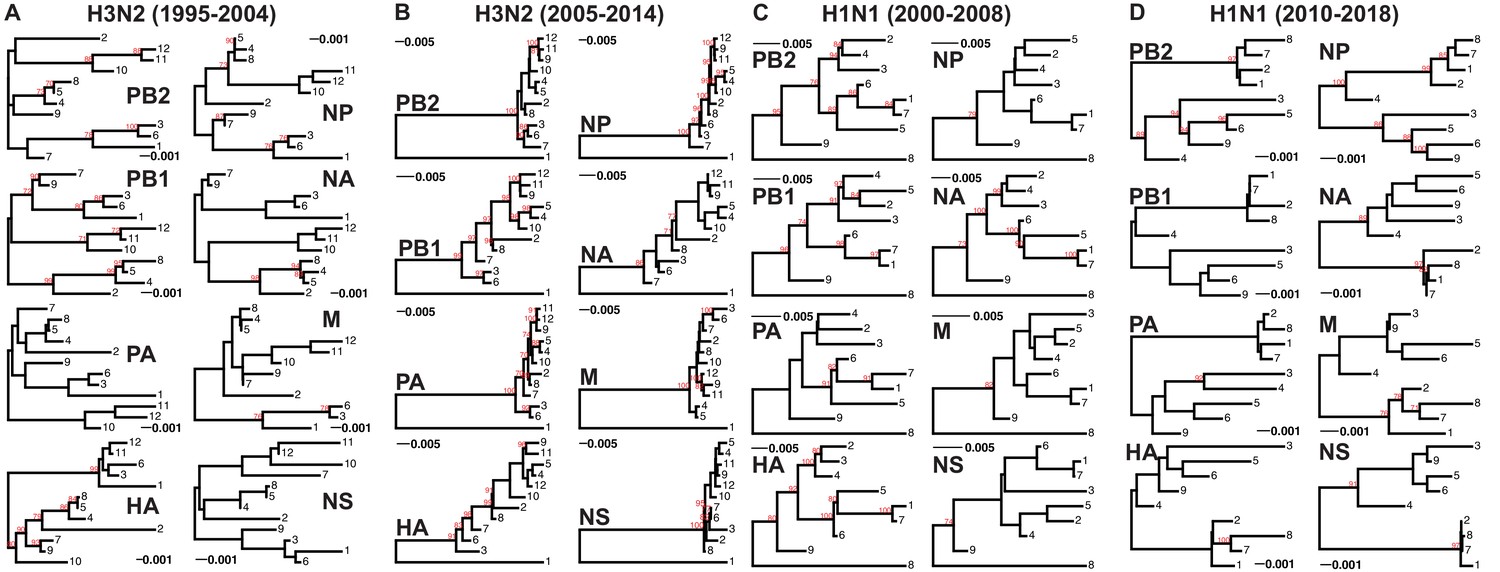
Genomic viral RNA (vRNA) segment trees.
Maximum-likelihood phylogenetic reconstruction of each vRNA segment from H3N2 and H1N1 virus sequences shown in Supplementary files 1-4. Representative trees from replicate 2 for H3N2 viruses from 1995 to 2004 (A), replicate 7 for H3N2 viruses from 2005 to 2014 (B), replicate 6 for H1N1 viruses from 2000 to 2008 (C), and replicate 3 for H1N1 viruses from 2010 to 2018 (D). Sequences are coded by cluster. Bootstrapping was performed with 100 replicates (bootstrap values greater than 70 are shown in red). Scale bars indicate substitutions per site.
Figure 1—figure supplement 2
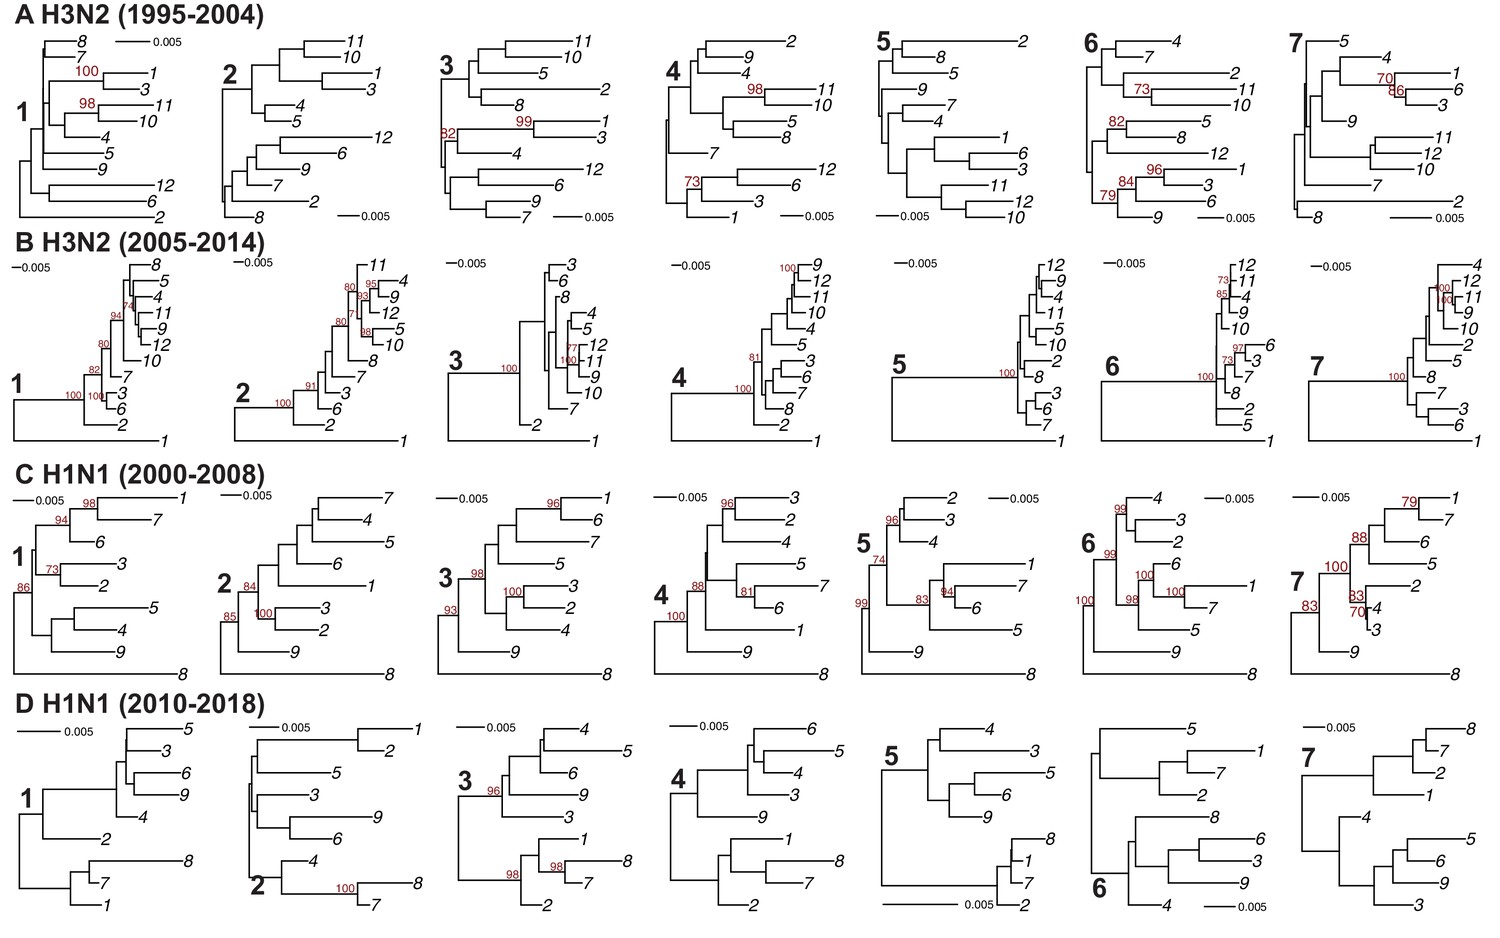
Full-length concatenated genome trees.
Maximum-likelihood phylogenetic reconstruction of full-length H3N2 virus (A–B) and H1N1 virus (C–D) genomic sequences shown in Supplementary files 1-4. Sequences are coded by cluster. The numbers 1–7 in bold indicate replicates. Bootstrapping was performed with 1000 replicates (bootstrap values greater than 70 are shown in red). Scale bars indicate substitutions per site.
Figure 2 with 4 supplements
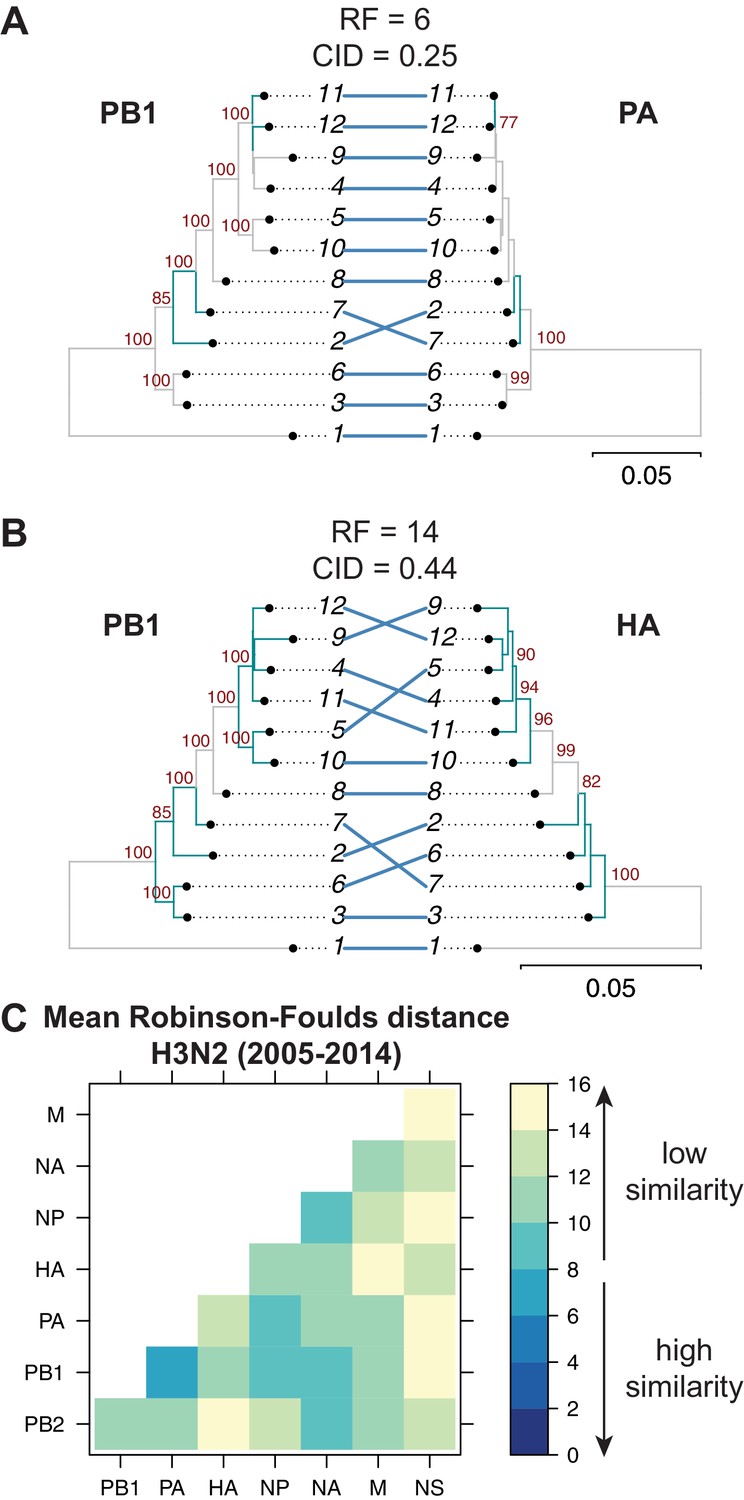
Parallel evolution between viral RNA (vRNA) segments varies in H3N2 viruses from 2005 to 2014.
Seven replicate maximum-likelihood trees were reconstructed for each vRNA gene segment from human H3N2 virus sequences (2005 to 2014) as described in Figure 1. (A–B) Highly similar (PB1 and PA gene segments) (A) or dissimilar (PB1 and HA gene segments) trees (B) from replicate one were plotted as tanglegrams with discrepancies in branch topology highlighted in green. Robinson-Foulds distances (RF) and clustering information distances (CID) are shown above the tanglegram. Intersecting lines map leaves on the left tree to the corresponding leaves on the right. Strains are coded by cluster number; strain identities can be found in Supplementary file 2. Bootstrap values greater than 70 are shown in red. Scale bars indicate substitutions per site. (C) Pairwise RF were calculated between each pair of trees in each replicate. Mean tree distances were visualized in a heatmap. Refer to Figure 2—figure supplement 1 for the standard error of the mean RF of each pair of trees.
-
Figure 2—source data 1
Mean Robinson-Foulds distance (RF) of pairwise replicate tree comparisons of H3N2 viruses from 2005 to 2014 (corresponding to Figure 2C).
- https://cdn.elifesciences.org/articles/66525/elife-66525-fig2-data1-v2.xlsx
Figure 2—figure supplement 1

The standard error of the mean (SEM) of replicate Robinson-Foulds distances (RF).
The SEM of all pairwise RF was determined for H3N2 viruses from 2005 to 2014 (corresponding to the mean tree distances shown in Figure 2C).
Figure 2—figure supplement 2

The mean clustering information distance (CID) of replicate viral RNA (vRNA) trees.
The pairwise CID was calculated between each replicate vRNA tree from human H3N2 viruses from 2005 to 2014. The mean CID (A) and standard error of the mean (SEM) of all pairwise CID (B) were visualized in a heatmap.
-
Figure 2—figure supplement 2—source data 1
Pairwise clustering information distance (CID) for each replicate tree from H3N2 viruses from 2005 to 2014.
- https://cdn.elifesciences.org/articles/66525/elife-66525-fig2-figsupp2-data1-v2.xlsx
Figure 2—figure supplement 3
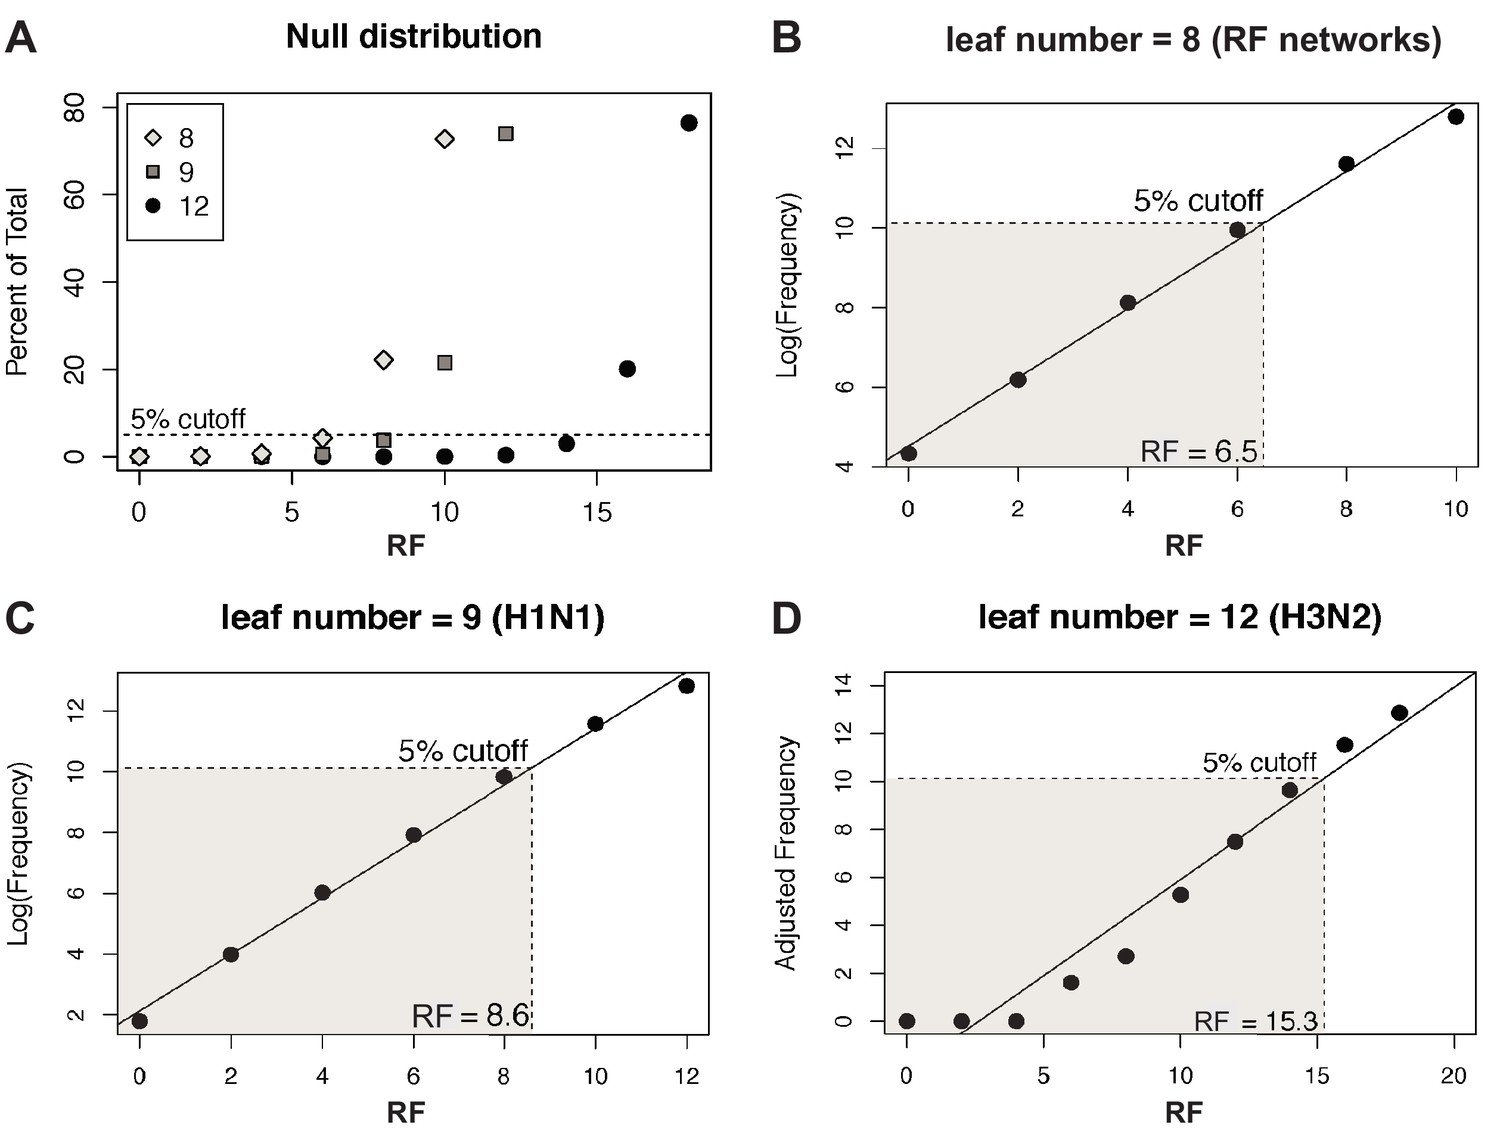
Null distribution of Robinson-Foulds distances (RF).
(A) The null distribution of RF in sets of 1000 randomly sampled, unrooted trees with either 8 (gray diamonds, corresponding to the number of tips in tree distance networks), 9 (gray squares, the number of tips in each H1N1 tree), or 12 (black circles, the number of tips in each H3N2 tree) leaf tips was determined. A dashed line demarcates the threshold for the 95% confidence interval. (B–D) The null distributions shown in (A) were log-transformed (B, C) or Yeo-Johnson-transformed (Yeo and Johnson, 2000) (D) and fit to a linear regression model to establish the cutoff for the first five percentiles (shaded region), which was set as the 95% confidence interval cutoff. The distance at which 95% confidence is exceeded is indicated.
Figure 2—figure supplement 4

Networks determined from pairwise tree distances.
Overall viral RNA (vRNA) relationships corresponding to H3N2 viruses from 2005 to 2014 were assessed with UPGMA trees derived from the mean Robinson-Foulds distance (RF) corresponding to Figure 2C (A) or the mean clustering information distance (CID) corresponding to Figure 2—figure supplement 2A (B). Scale bar corresponds to either RF or CID. The point at which edges merge is equivalent to 1/2 RF or 1/2 CID.
Figure 3 with 4 supplements
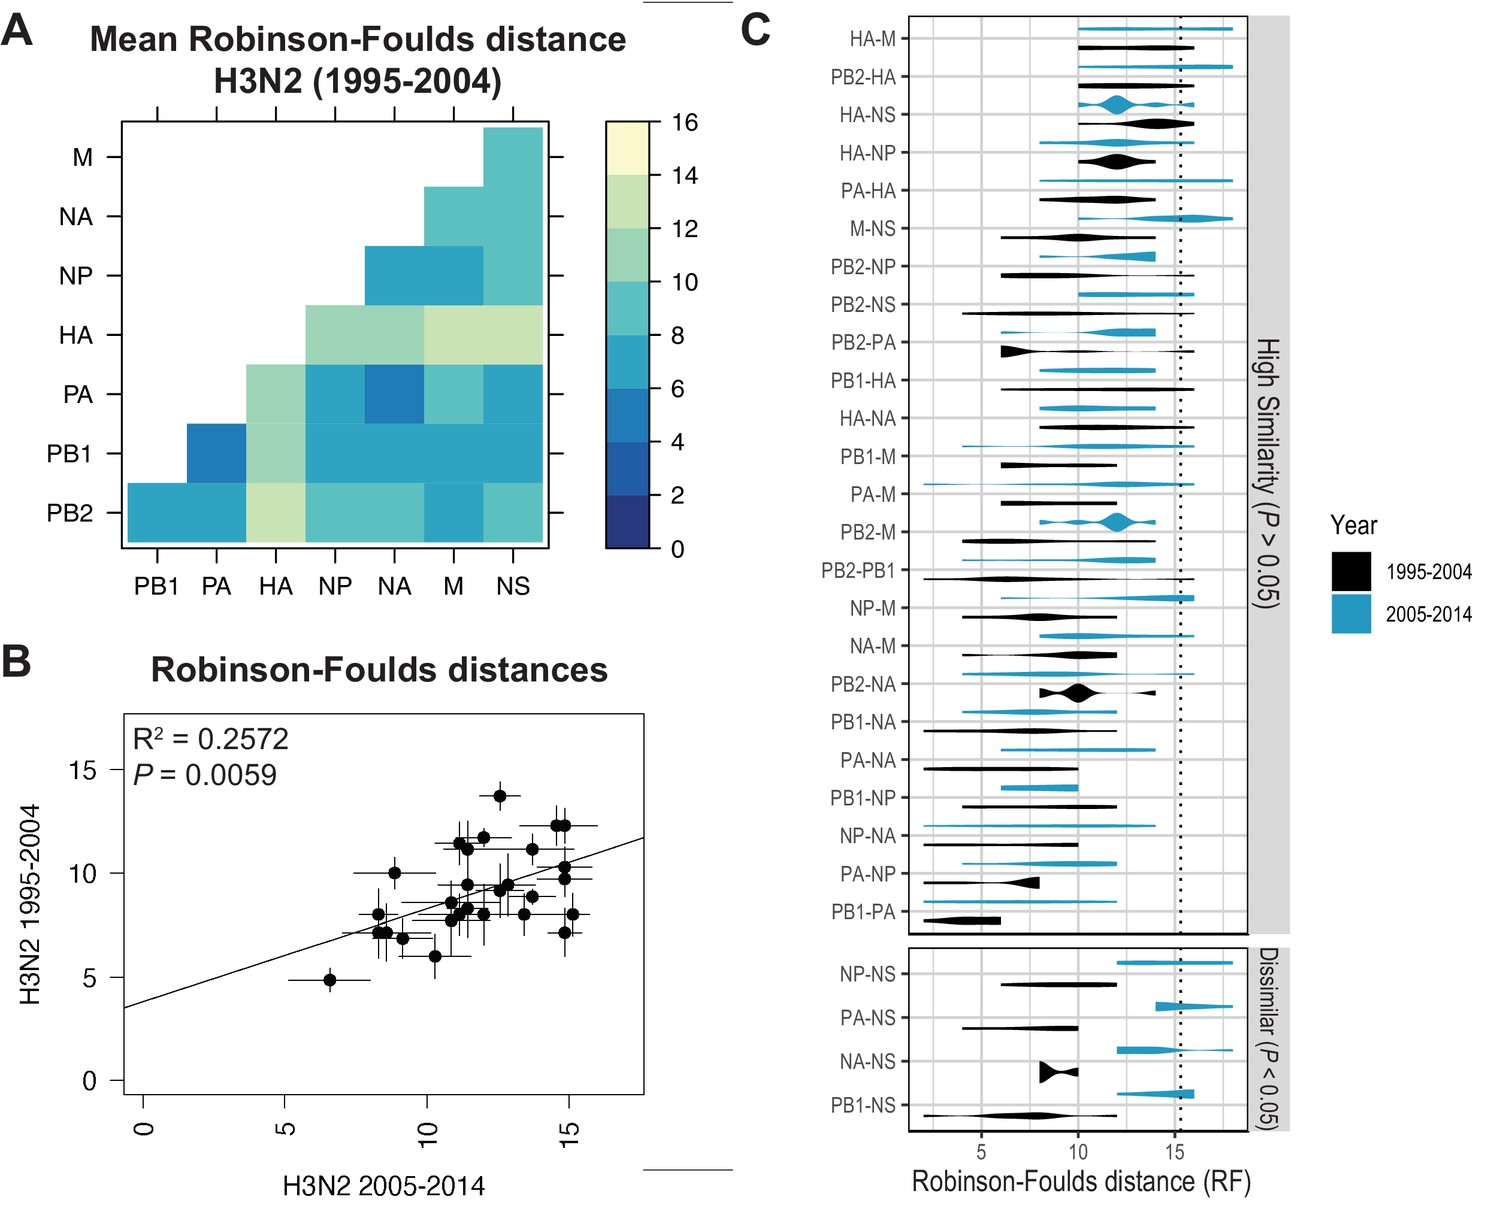
Parallel evolution of viral RNA (vRNA) segments from H3N2 viruses is conserved through antigenic drift.
(A) Seven replicate maximum-likelihood trees were reconstructed for each vRNA gene segment from human H3N2 virus sequences (1995 to 2004) as described in Figure 1. Pairwise Robinson-Foulds distances (RF) were calculated between each pair of trees in each replicate. Mean tree distances were visualized in a heatmap. Refer to Figure 3—figure supplement 1 for the standard error of the mean (SEM) of each pair. (B) Mean RF of replicate trees from H3N2 viruses from 1995 to 2004 were plotted against those from 2005 to 2014. The line of best fit was determined by linear regression (solid line). The R2 and p-value are indicated. Error bars indicate the SEM of all replicates. (C) Replicate tree distances were plotted comparing H3N2 viruses from 1995 to 2004 (black) to H3N2 viruses from 2005 to 2014 (turquoise). ‘Dissimilar’ pairs are grouped where p < 0.05 (Mann-Whitney U test with Benjamini-Hochberg correction; exact p-values reported in Supplementary file 6). Dashed line, 95% confidence interval for tree similarity (determined by a null dataset; refer to Figure 2—figure supplement 3).
-
Figure 3—source data 1
Mean Robinson-Foulds distance (RF) of pairwise replicate tree comparisons of H3N2 viruses from 1995 to 2004 (corresponding to Figure 3A).
- https://cdn.elifesciences.org/articles/66525/elife-66525-fig3-data1-v2.xlsx
-
Figure 3—source data 2
Pairwise Robinson-Foulds distance (RF) for each replicate tree from H3N2 viruses from 1995 to 2004 or 2005 to 2014, as indicated (corresponding to Figure 3B and C).
- https://cdn.elifesciences.org/articles/66525/elife-66525-fig3-data2-v2.xlsx
Figure 3—figure supplement 1

The standard error of the mean (SEM) of replicate Robinson-Foulds distances (RF).
The SEM of all pairwise RF was determined for H3N2 viruses from 1995 to 2004 (corresponding to the mean tree distances shown in Figure 3A).
Figure 3—figure supplement 2
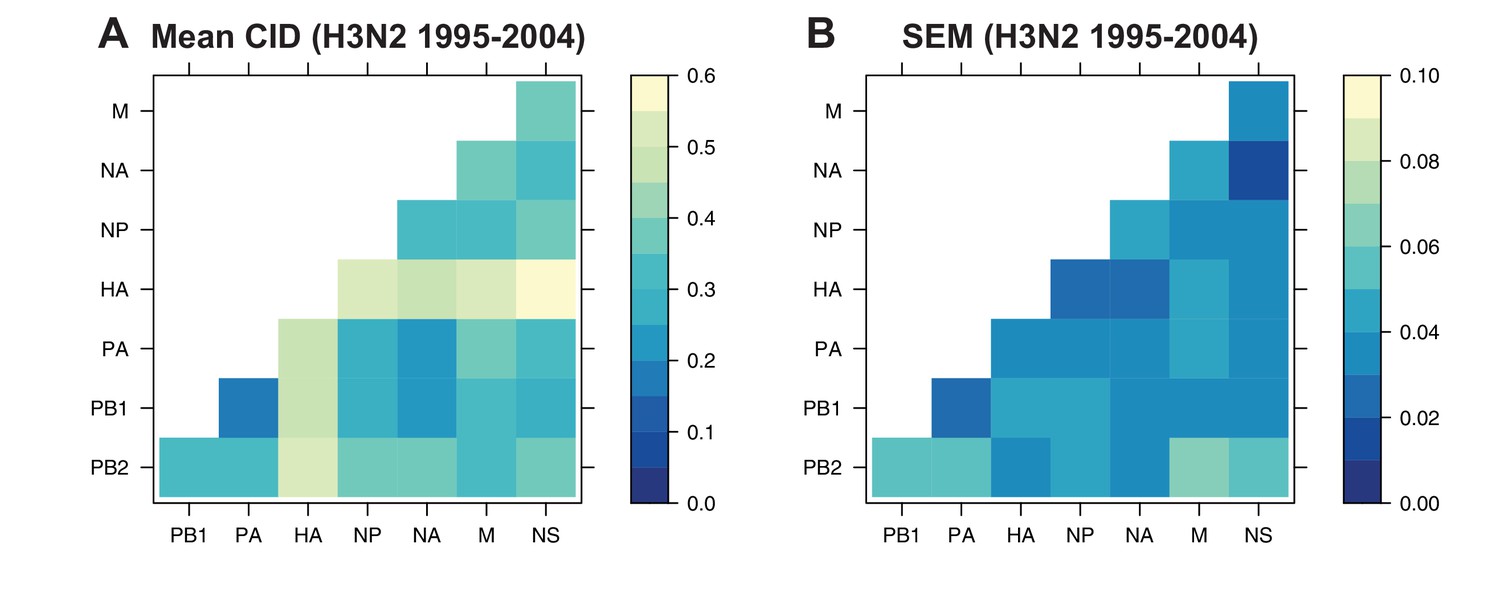
The mean clustering information distance (CID) of replicate viral RNA (vRNA) trees.
The pairwise CID was calculated between each replicate vRNA tree from human H3N2 viruses from 1995 to 2004. The mean CID (A) and standard error of the mean (SEM) of all pairwise CID (B) were visualized in a heatmap.
-
Figure 3—figure supplement 2—source data 1
Pairwise clustering information distance (CID) for each replicate tree from H3N2 viruses from 1995 to 2004.
- https://cdn.elifesciences.org/articles/66525/elife-66525-fig3-figsupp2-data1-v2.xlsx
Figure 3—figure supplement 3
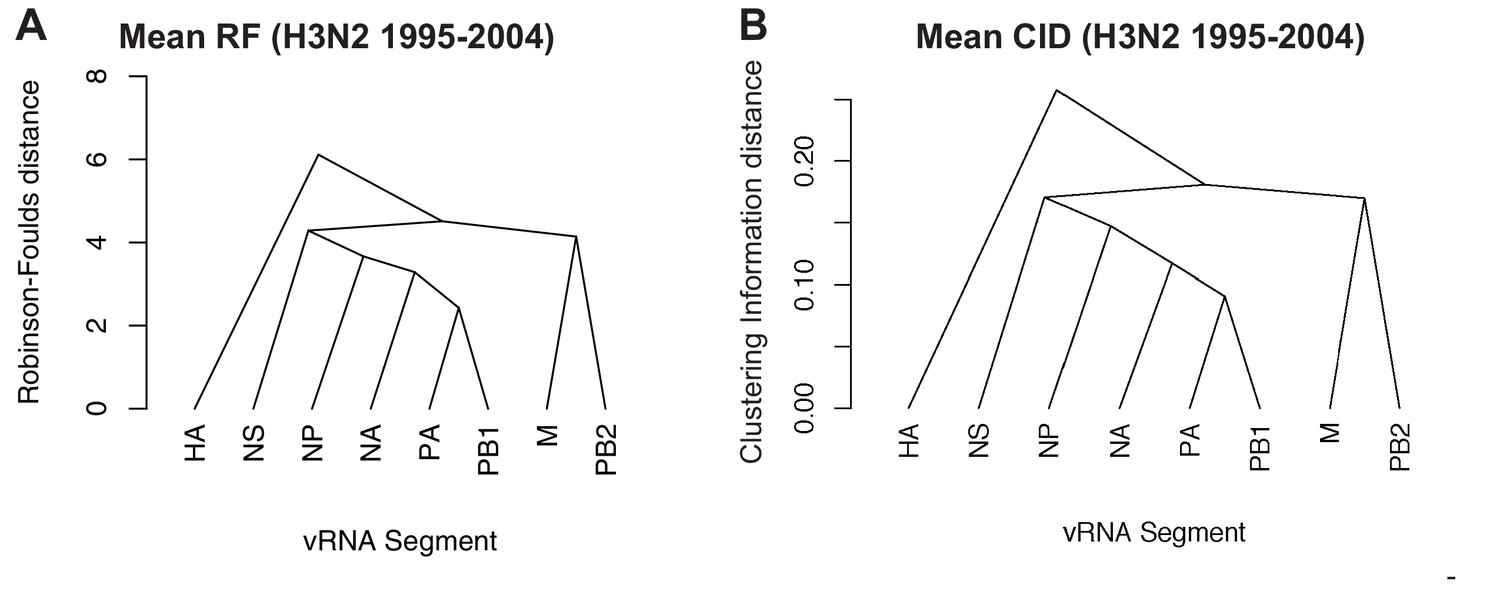
Networks determined from pairwise tree distances.
Overall viral RNA (vRNA) relationships corresponding to H3N2 viruses from 1995 to 2004 were assessed with UPGMA trees derived from the mean Robinson-Foulds distance (RF) corresponding to Figure 3A (A) or the mean clustering information distance (CID) corresponding to Figure 3—figure supplement 2A (B). Scale bar corresponds to either RF or CID. The point at which edges merge is equivalent to 1/2 RF or 1/2 CID.
Figure 3—figure supplement 4

Linear regression of tree distances determined by clustering information distances (CID).
Mean CID values of replicate trees from H3N2 viruses from 1995 to 2004 were plotted against those from H3N2 viruses from 2005 to 2014. The line of best fit was determined by linear regression (solid line). The R2 and p-value are indicated. Error bars indicate the SEM of all replicates.
Figure 4 with 4 supplements
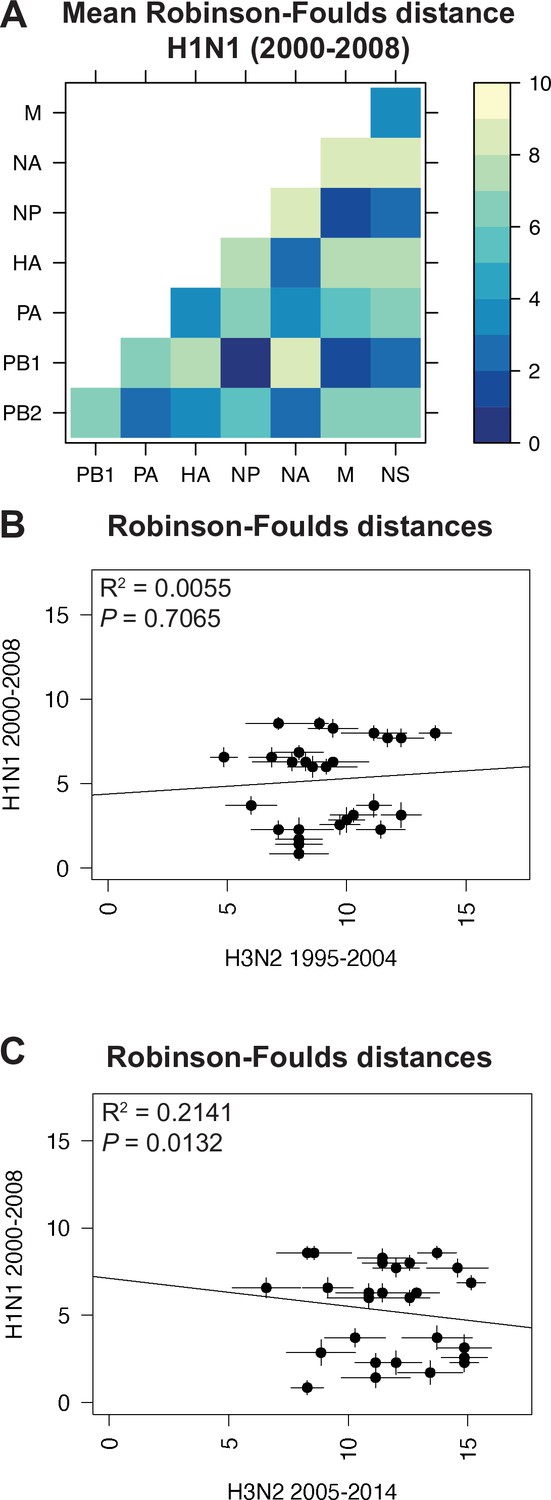
Parallel evolution between viral RNA (vRNA) segments is dependent upon subtype.
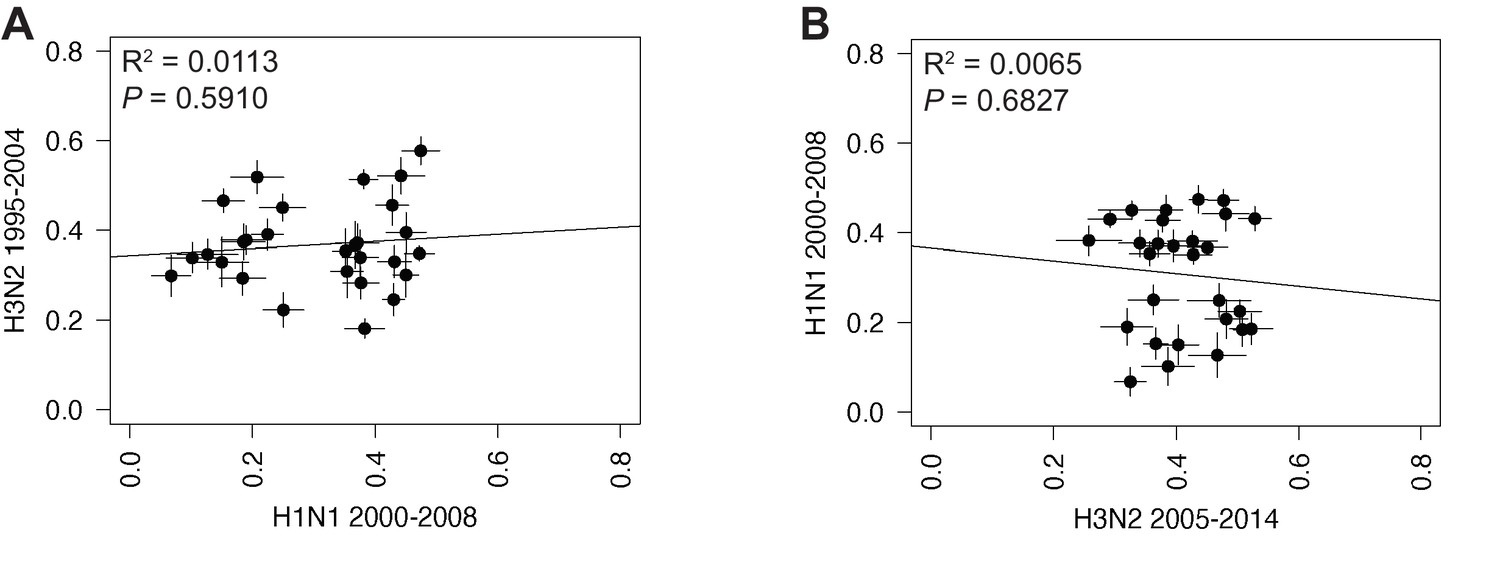
(A) Seven replicate maximum-likelihood trees were reconstructed for each vRNA gene segment from human H1N1 virus sequences from 2000 to 2008 as described in Figure 1. The pairwise Robinson-Foulds distance (RF) between trees was calculated for each set of replicate trees. Mean distances were visualized in a heatmap. Refer to Figure 4—figure supplement 1 for the standard error of the mean (SEM) of each pair. (B–C) Mean RF of replicate trees from H1N1 viruses from 2000 to 2008 were plotted against those from H3N2 viruses from 1995 to 2004 (B) and H3N2 viruses from 2005 to 2014 (C). The line of best fit was determined by linear regression (solid line). The R2 and p-value are indicated. Error bars indicate the SEM of all replicates.
-
Figure 4—source data 1
Mean Robinson-Foulds distance (RF) of pairwise replicate tree comparisons of H1N1 viruses from 2000 to 2008 (corresponding to Figure 4A).
- https://cdn.elifesciences.org/articles/66525/elife-66525-fig4-data1-v2.xlsx
Figure 4—figure supplement 1

The standard error of the mean (SEM) of replicate Robinson-Foulds distances (RF).
The SEM of all pairwise RF was determined for H1N1 viruses from 2000 to 2008 (corresponding to the mean tree distances from Figure 4A).
Figure 4—figure supplement 2

The mean clustering information distance (CID) of replicate viral RNA (vRNA) trees.
The pairwise CID was calculated between each replicate vRNA tree from human H1N1 viruses from 2000 to 2008. The mean CID (A) and standard error of the mean (SEM) of all pairwise CID (B) were visualized in a heatmap.
-
Figure 4—figure supplement 2—source data 1
Pairwise clustering information distances (CID) for each replicate tree from H1N1 viruses from 2000 to 2008.
- https://cdn.elifesciences.org/articles/66525/elife-66525-fig4-figsupp2-data1-v2.xlsx
Figure 4—figure supplement 3
Linear regression of tree distances determined by clustering information distances (CID).
Mean CID values of replicate trees from H1N1 viruses from 2000 to 2008 were plotted against those from H3N2 viruses from 1995 to 2004 (A), or H3N2 viruses from 2005 to 2014 (B). The line of best fit was determined by linear regression (solid line). The R2 and p-value are indicated. Error bars indicate the standard error of the mean (SEM) of all replicates.
Figure 4—figure supplement 4
Networks determined from pairwise tree distances.
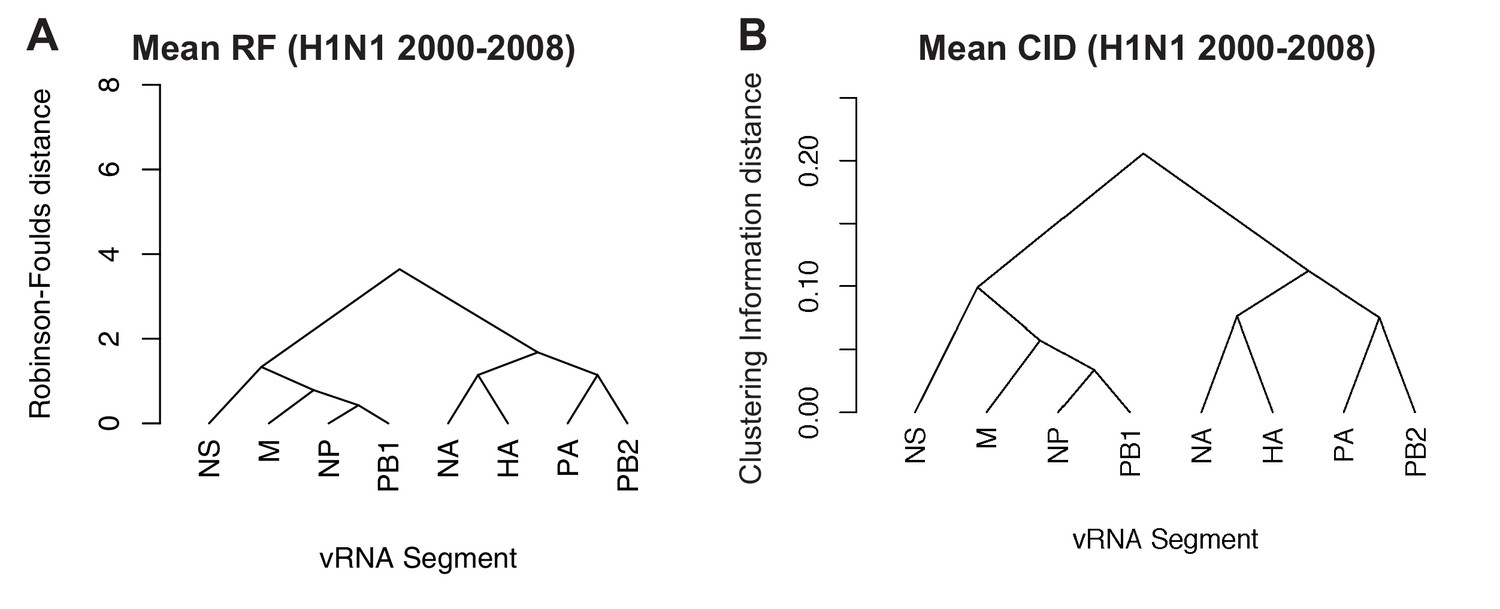
Overall viral RNA (vRNA) relationships corresponding to H1N1 viruses from 2000 to 2008 were assessed with UPGMA trees derived from the mean Robinson-Foulds distance (RF) corresponding to Figure 4A (A) or the mean clustering information distance (CID) corresponding to Figure 4—figure supplement 2A (B). Scale bar corresponds to either RF or CID. The point at which edges merge is equivalent to 1/2 RF or 1/2 CID.
Figure 5 with 5 supplements
Parallel evolution between viral RNA (vRNA) segments diverges in antigenically shifted H1N1 viruses.
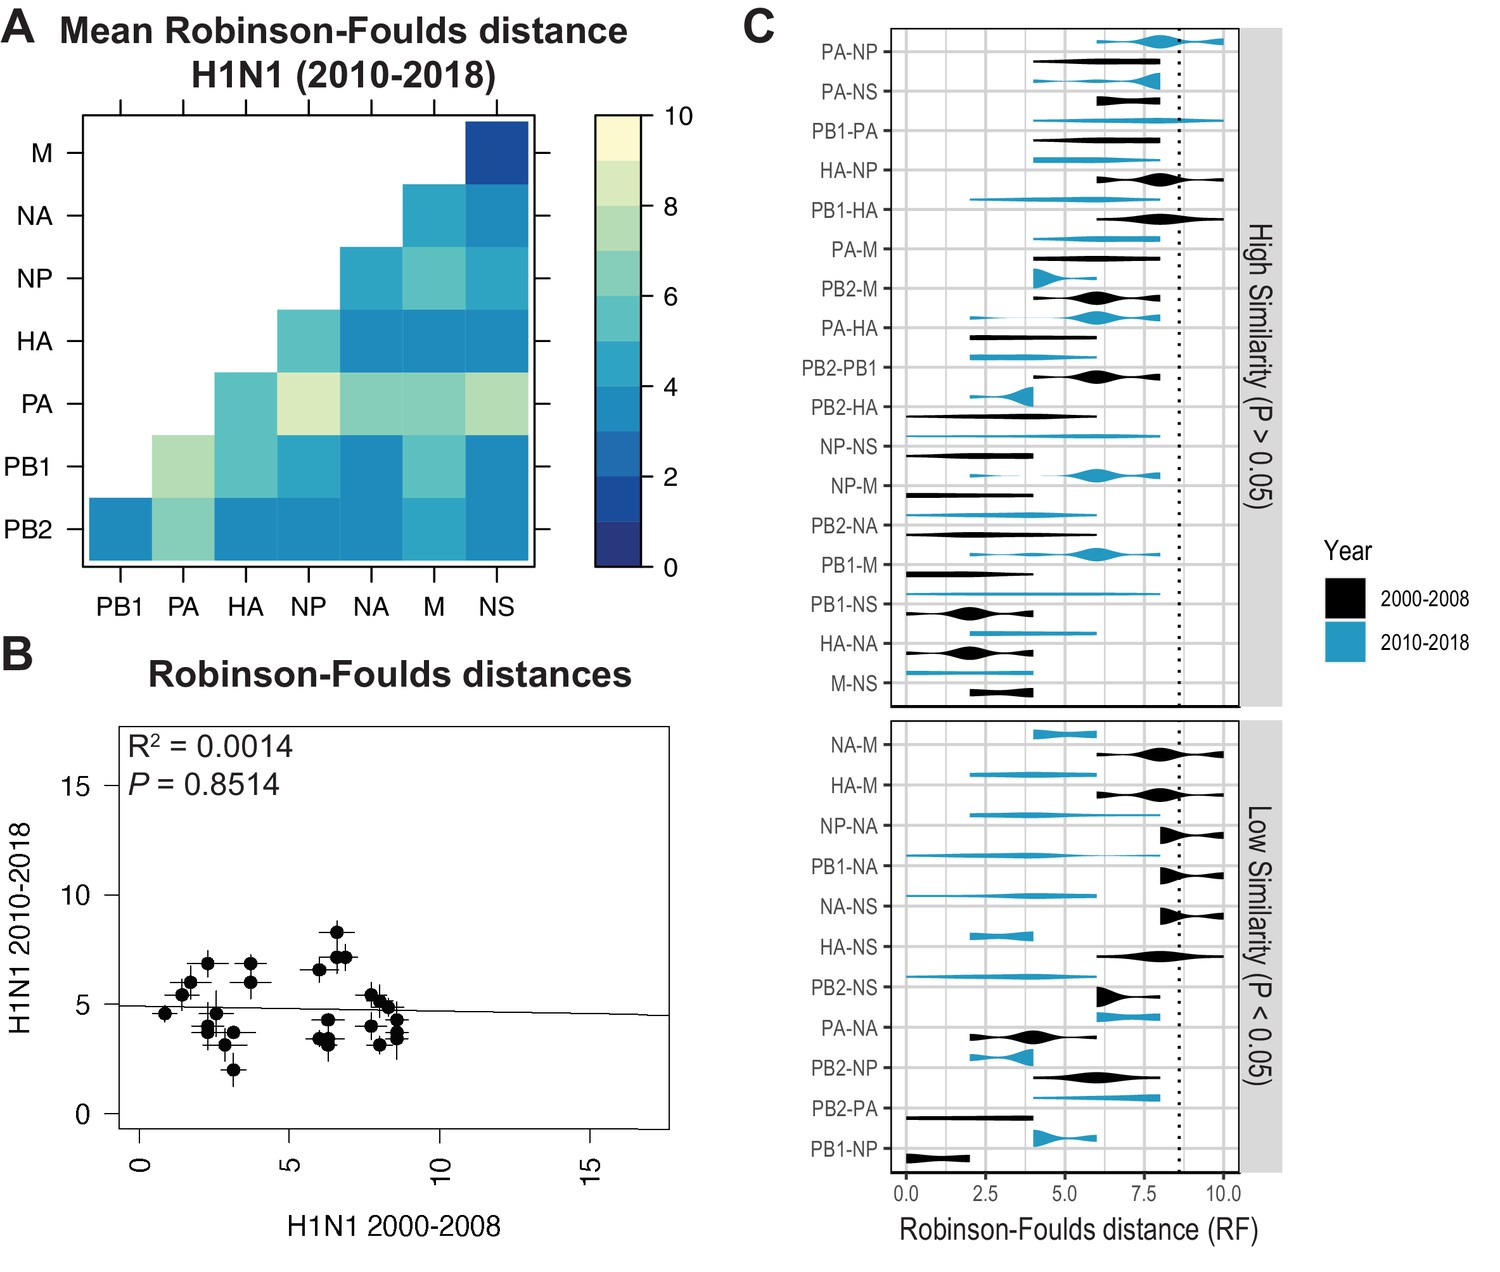
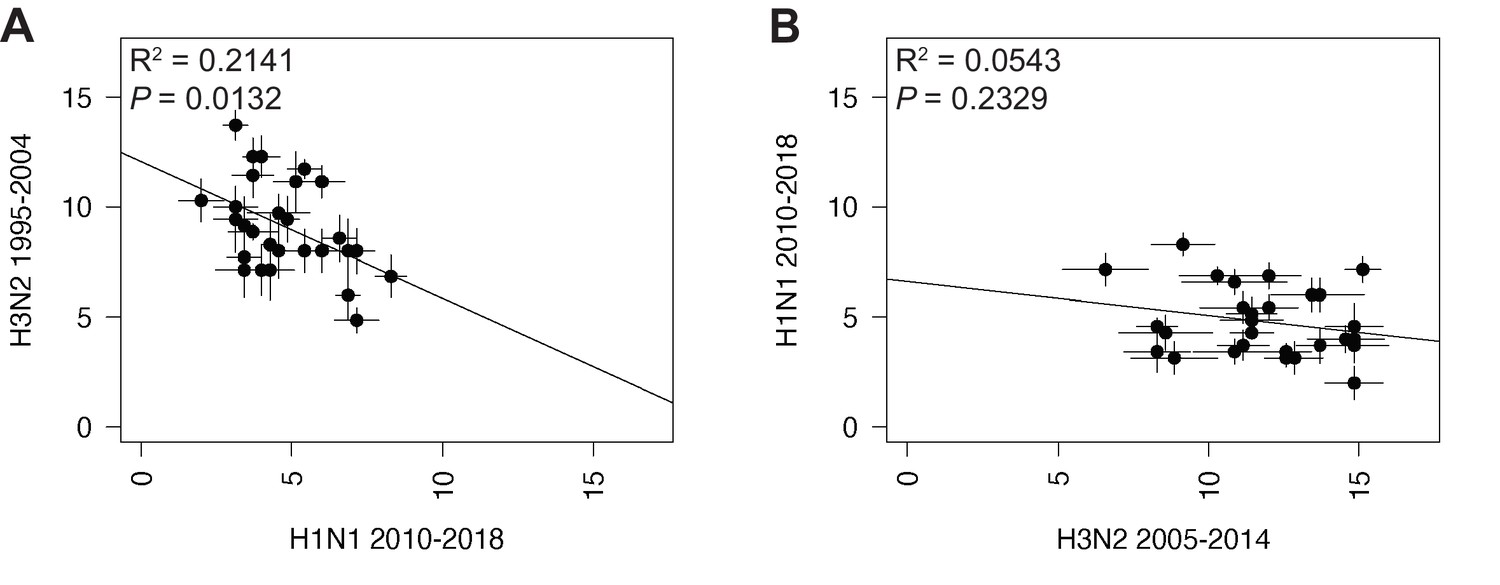
(A) Seven replicate maximum-likelihood trees were reconstructed for each vRNA gene segment from human H1N1 virus sequences from 2010 to 2018 as described in Figure 1. The pairwise Robinson-Foulds distance (RF) between trees was calculated for each set of replicate trees. Mean tree distances were visualized in a heatmap. Refer to Figure 5—figure supplement 1 for the standard error of the mean (SEM) of each pair. (B) Mean RF of replicate trees from H1N1 viruses from 2000 to 2008 were plotted against those from 2010 to 2018. The line of best fit was determined by linear regression (solid line). The R2 and p-value are indicated. Error bars indicate the SEM of all replicates. (C) Replicate RF were plotted comparing H1N1 viruses from 2000 to 2008 (black) to H1N1 viruses from 2010 to 2018 (turquoise). ‘Low similarity’ pairs are grouped where p < 0.05 (Mann-Whitney U test with Benjamini-Hochberg correction; exact p-values reported in Supplementary file 6). Dashed line, 95% confidence interval for tree similarity (determined by a null dataset; refer to Figure 2—figure supplement 3).
-
Figure 5—source data 1
Mean Robinson-Foulds distance (RF) of pairwise replicate tree comparisons of H1N1 viruses from 2010 to 2018 (corresponding to Figure 5A).
- https://cdn.elifesciences.org/articles/66525/elife-66525-fig5-data1-v2.xlsx
-
Figure 5—source data 2
Pairwise Robinson-Foulds distance (RF) for each replicate tree from H1N1 viruses from 2000 to 2008 or 2010 to 2018, as indicated (corresponding to Figure 5B and C).
- https://cdn.elifesciences.org/articles/66525/elife-66525-fig5-data2-v2.xlsx
Figure 5—figure supplement 1

The standard error of the mean (SEM) of replicate Robinson-Foulds distances (RF).
The SEM of all pairwise RF was determined for H1N1 viruses from 2010 to 2018 (corresponding to the mean tree distances from Figure 5A).
Figure 5—figure supplement 2
The mean clustering information distance (CID) of replicate viral RNA (vRNA) trees.
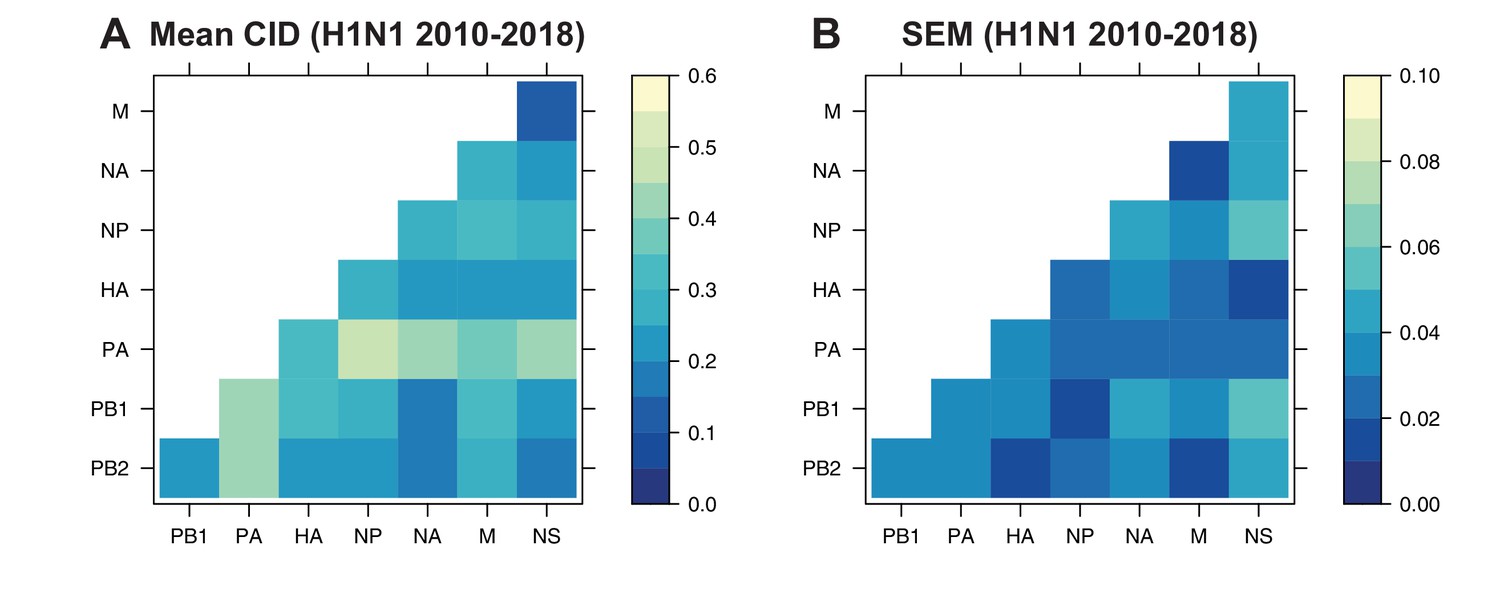
The pairwise CID was calculated between each replicate vRNA tree from human H1N1 viruses from 2010 to 2018. The mean CID (A) and standard error of the mean (SEM) of all pairwise CID (B) were visualized in a heatmap.
-
Figure 5—figure supplement 2—source data 1
Pairwise clustering information distance (CID) for each replicate tree from H1N1 viruses from 2010 to 2018.
- https://cdn.elifesciences.org/articles/66525/elife-66525-fig5-figsupp2-data1-v2.xlsx
Figure 5—figure supplement 3
Linear regression of tree distances determined by Robinson-Foulds distance (RF).
Mean RF of replicate trees from H1N1 viruses from 2010 to 2018 were plotted against those from H3N2 viruses from 1995 to 2004 (A) and H3N2 viruses from 2005 to 2014 (B). The line of best fit was determined by linear regression (solid line). The R2 and p-value are indicated. Error bars indicate the standard error of the mean (SEM) of all replicates.
Figure 5—figure supplement 4
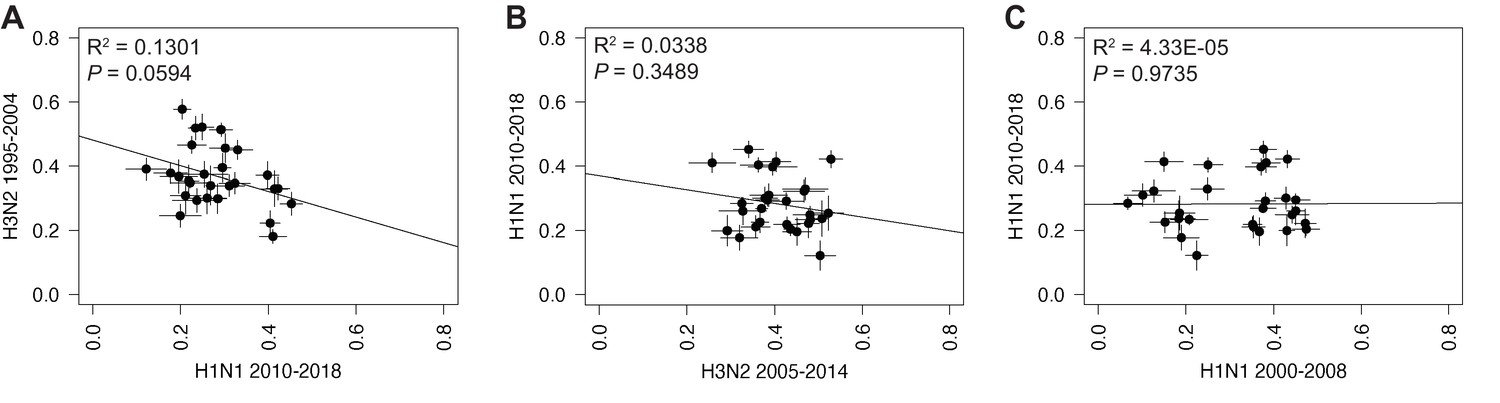
Linear regression of tree distances determined by clustering information distances (CID).
Mean CID values of replicate trees from H1N1 viruses from 2010 to 2018 were plotted against those from H3N2 viruses from 1995 to 2004 (A), H3N2 viruses from 2005 to 2014 (B), or H1N1 viruses from 2000 to 2008 (C). The line of best fit was determined by linear regression (solid line). The R2 and p-value are indicated. Error bars indicate the standard error of the mean (SEM) of all replicates.
Figure 5—figure supplement 5
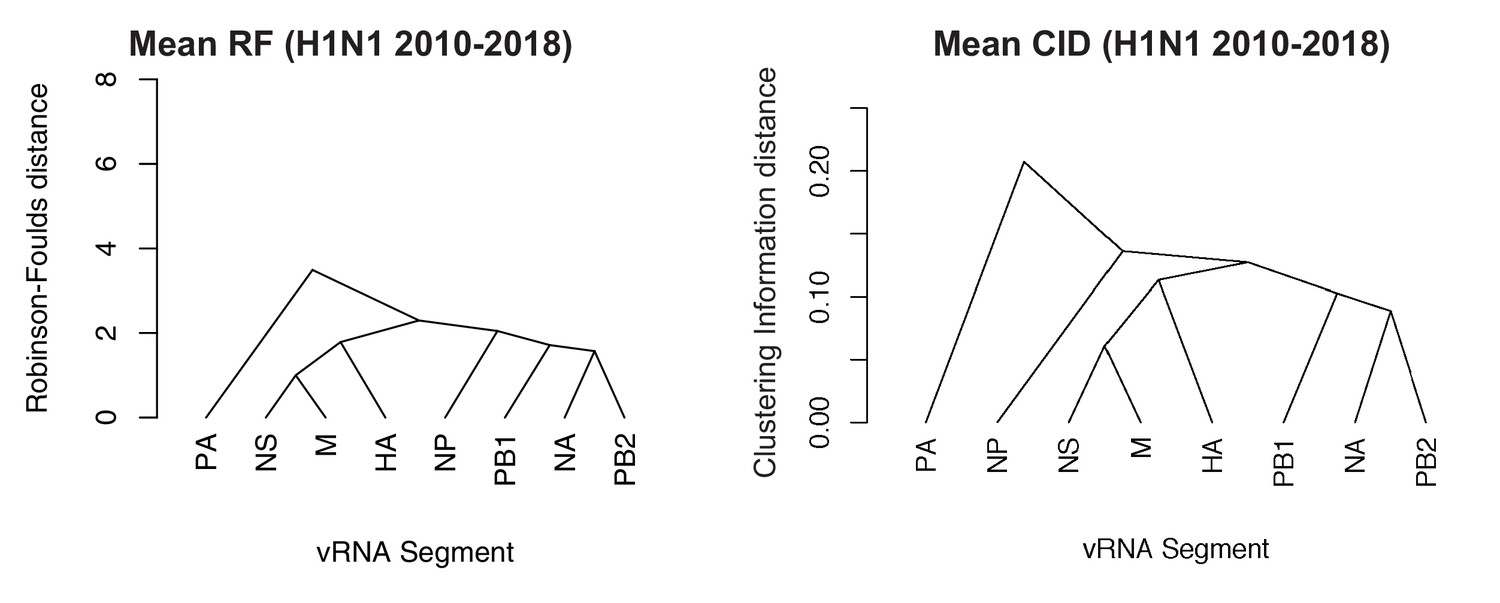
Networks determined from pairwise tree distances.
Overall viral RNA (vRNA) relationships corresponding to H1N1 viruses from 2010 to 2018 were assessed with UPGMA trees derived from the mean Robinson-Foulds distance (RF) corresponding to Figure 5A (A) or the clustering information distance (CID) corresponding to Figure 5—figure supplement 2A (B). Scale bar corresponds to either RF or CID. The point at which edges merge is equivalent to 1/2 RF or 1/2 CID.
Figure 6 with 1 supplement
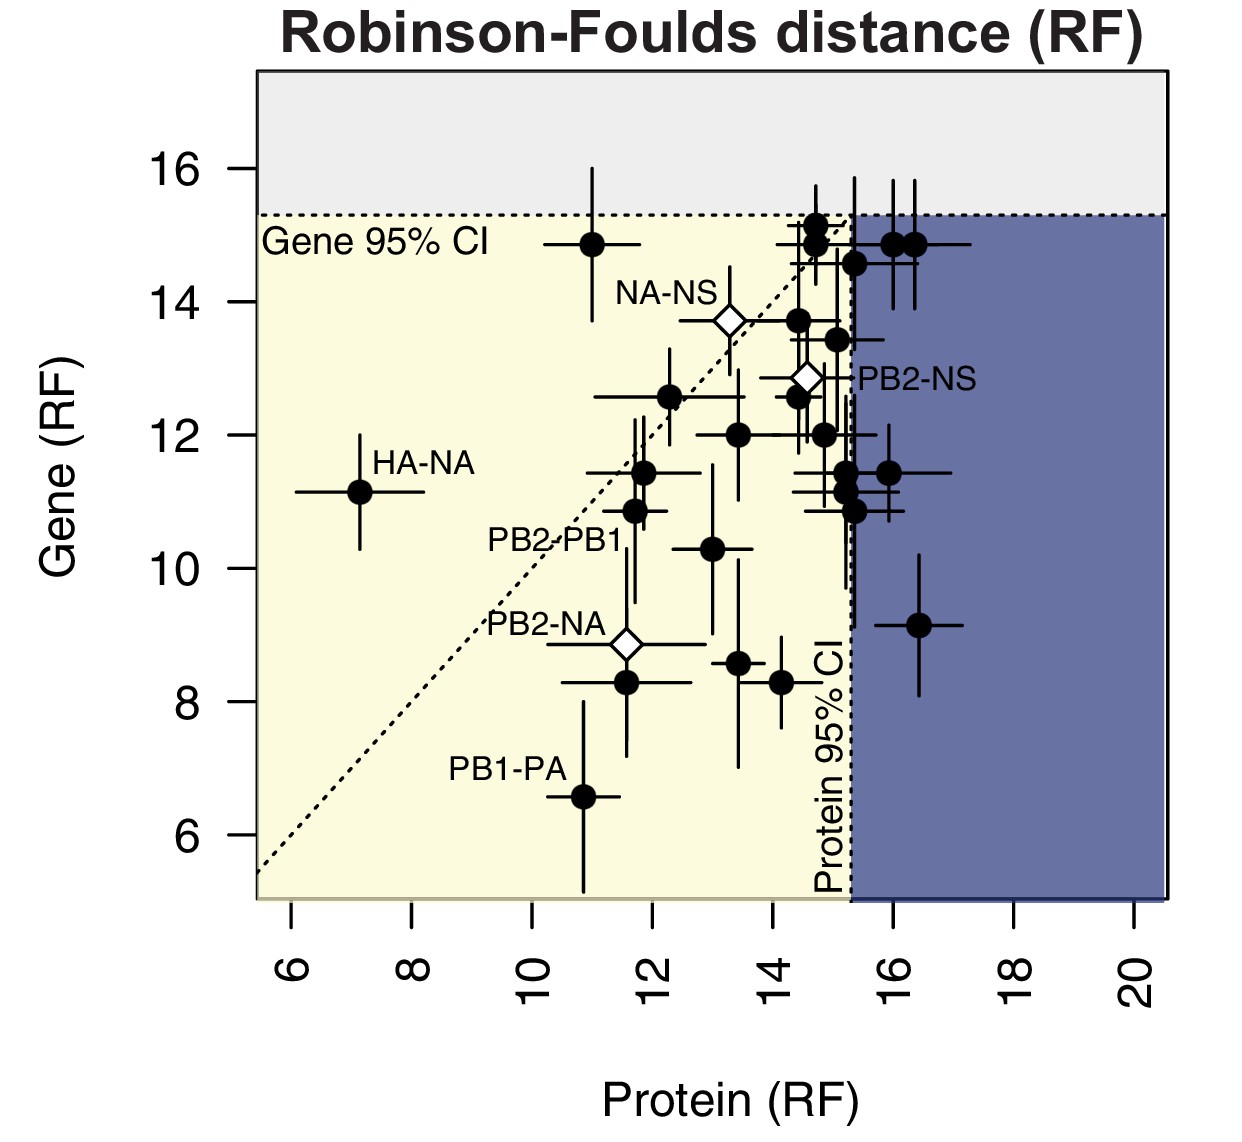
Protein-coding substitutions do not fully account for parallel evolution between genes.
H3N2 virus viral RNA (vRNA) gene sequence alignments from 2005 to 2014 were translated into the corresponding amino acid alignments. Neighbor-joining trees were reconstructed from these alignments and the Robinson-Foulds distance (RF) was tabulated for all protein tree pairs. The mean tree distance of each pair of protein trees was plotted against the mean tree distance of the corresponding gene trees. For the M and NS gene segments, which encode multiple protein products, tree distances were calculated for each protein tree individually and the average distances are shown. Error bars indicate the standard error of the mean (SEM) of replicate trees. Dashed horizontal and vertical lines, 95% confidence interval (CI) for tree similarity, as determined by a null dataset (refer to Figure 2—figure supplement 3). The region shaded yellow lies within the 95% CI for both gene and protein trees with the identity line plotted. The region shaded blue lies within the 95% CI for gene trees but not protein trees. The region shaded gray lies outside the 95% CI for both gene and protein trees.
-
Figure 6—source data 1
Mean Robinson-Foulds distance (RF) of pairwise replicate gene or protein tree comparisons from H3N2 viruses from 2005 to 2014.
- https://cdn.elifesciences.org/articles/66525/elife-66525-fig6-data1-v2.xlsx
Figure 6—figure supplement 1

Parallel evolution between proteins in H3N2 viruses from 2005 to 2014.
H3N2 virus viral RNA (vRNA) gene sequence alignments were translated into the corresponding amino acid alignments. Neighbor-joining trees were reconstructed from these alignments and the Robinson-Foulds distance (RF) was tabulated for all protein tree pairs. An RF network was constructed using a UPGMA tree. Scale bar corresponds to RF.
Figure 7
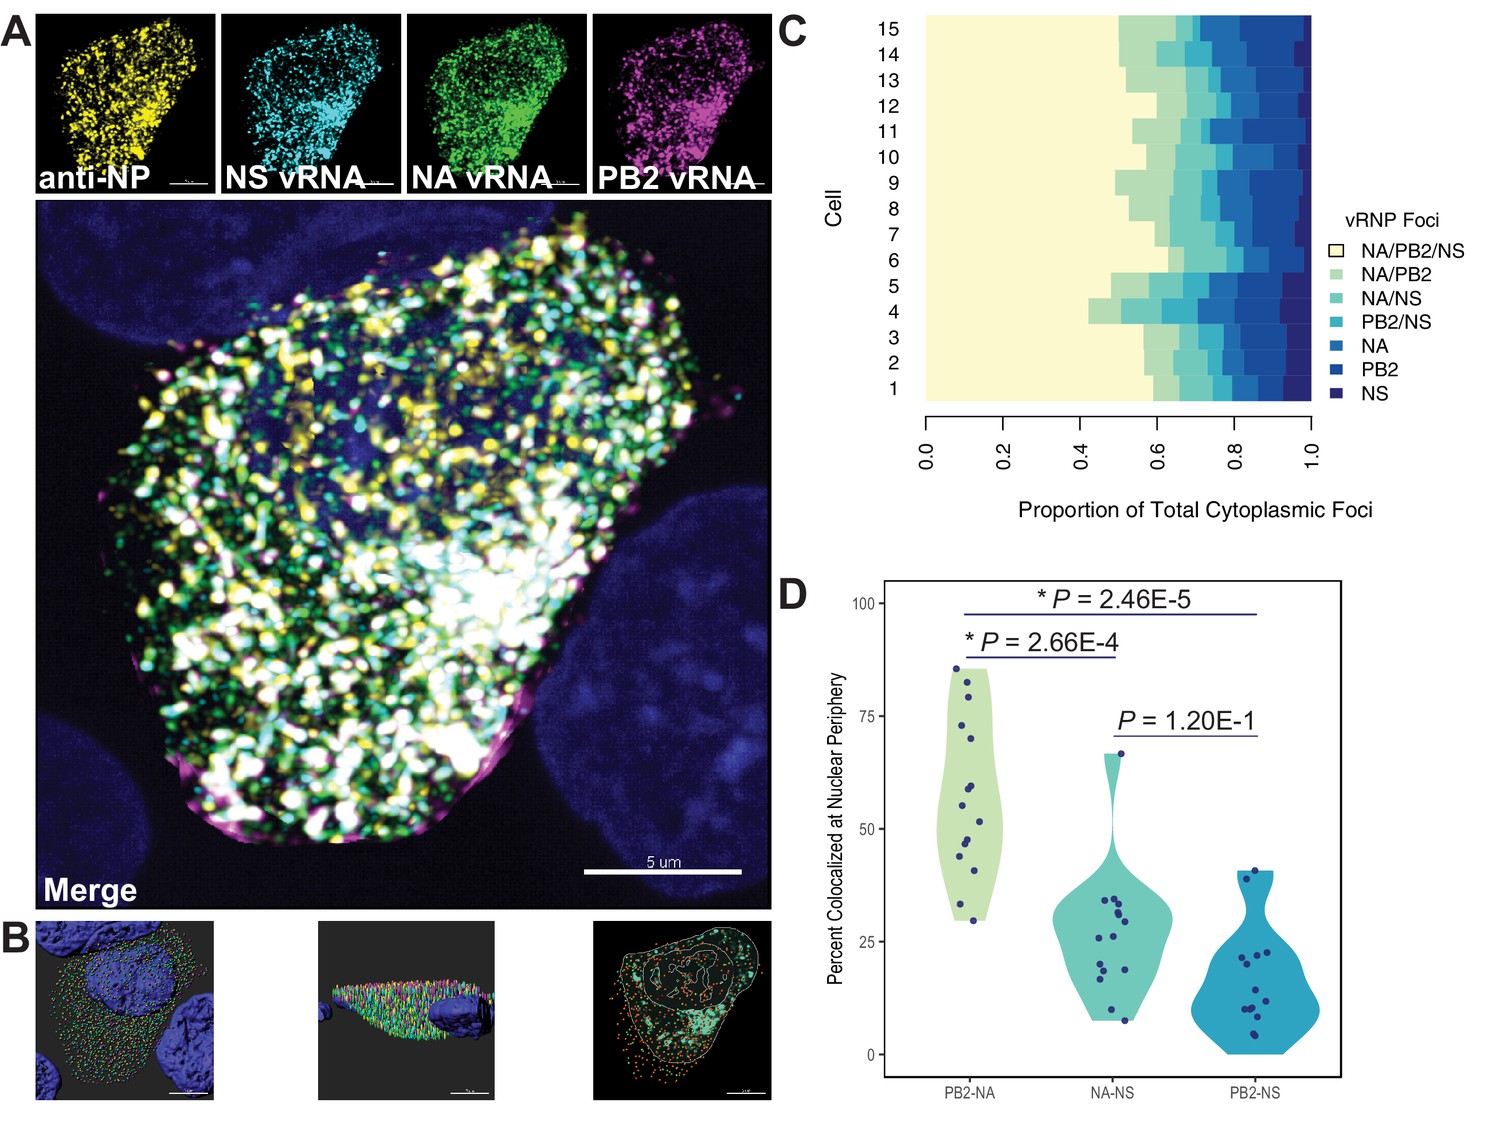
Colocalization of viral RNA (vRNA) segments at the nuclear periphery correlates with evolutionary relationships during productive viral infection.
A549 cells were infected with A/Perth/16/2009 (H3N2) at a multiplicity of infection (MOI) of 2 or mock-infected. Cells were fixed at 8 hr post-infection and combination fluorescence in situ hybridization/immunofluorescence (FISH and IF, respectively) was performed. FISH probes targeting the NS, NA, and PB2 vRNA segments were labeled with Alexa Fluor 488, Quasar 570, and Quasar 670, respectively. Antibodies targeting nucleoprotein (NP) were used with an anti-mouse Alexa Fluor 594 secondary antibody. Nuclei were labeled with DAPI. Coverslips were mounted and volumetric imaging was performed to obtain Nyquist sampling. (A) A maximum projection image of a representative cell is shown after cell segmentation. Scale bar corresponds to 5 µm. (B) A 3D rendering of the cell after analysis. (C) Colocalization of vRNA segments was assessed in 15 individual infected cells. (D) Quantification of each pair of vRNA segments within 300 nm of the nuclear border. Each point represents an individual cell (n = 15). Aggregate data from three independently performed experiments are shown. Asterisks (*) indicate p-adj < 0.05 (Mann-Whitney U test with Benjamini-Hochberg correction).
-
Figure 7—source data 1
Percent colocalization nucleoprotein (NP)-positive viral RNA (vRNA) foci (NA, PB2, or NS) during productive infection of A549 cells with A/Perth/16/2009 (H3N2).
- https://cdn.elifesciences.org/articles/66525/elife-66525-fig7-data1-v2.xlsx
Author response image 1
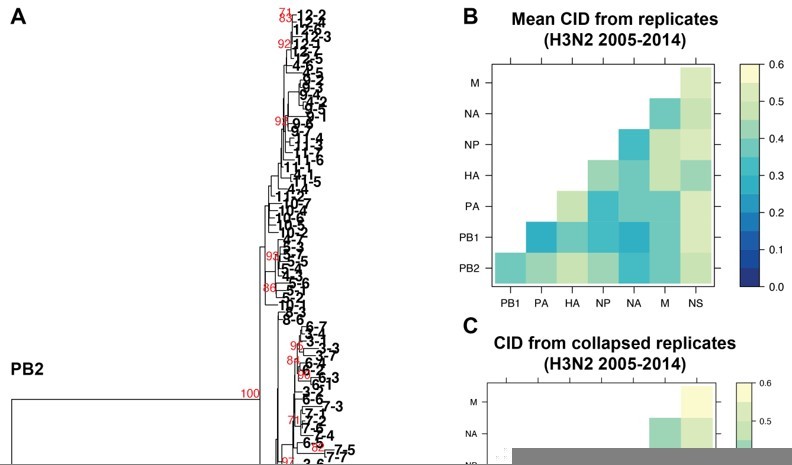
The impact of collapsing replicate trees into larger trees on tree distance.
A. Sequence alignments of H3N2 viruses from 2005-2014 from replicates 1-7 were combined into individual alignments for each vRNA segment and maximum-likelihood trees were constructed. The PB2 tree is shown with tree tips indicating the cluster and replicate Bootstrap values greater than or equal to 70 are shown in red. B. Pairwise mean Clustering Information Distance (CID) determined for replicate trees (reproduced from Supplemental figure 4B) are shown in a heatmap. C. Pairwise CID determined from collapsed trees are shown in a heatmap.
Tables
Table 1
Influenza A virus strain datasets.
Human H1N1 or H3N2 virus sequences for which full-length sequences are available (Influenza Research Database). Representative sequences were selected for further analyses by clustering. ‘Final clusters’ indicates the number of clusters after small clusters were collapsed or omitted.
| Subtype | Time period | Total strains | Clusters with >97% identity | Final clusters |
|---|---|---|---|---|
| H3N2 | 1995–2004 | 1026 | 16 | 12 |
| 2005–2014 | 3879 | 17 | 12 | |
| H1N1 | 2000–2008 | 821 | 11 | 9 |
| 2010–2018 | 4072 | 14 | 9 |
Key resources table
| Reagent type (species) or resource | Designation | Source or reference | Identifiers | Additional information |
|---|---|---|---|---|
| Gene (influenza A virus) | Seasonal human influenza A virus sequences | Influenza Research Database | Accession numbers provided in Supplementary files 1–4 | See Materials and methods, Data mining and subsampling section |
| Antibody | Anti-NP (mouse monoclonal) | Millipore | Cat# MAB8251, RRID:AB_95293 | IF (1:2000) |
| Antibody | Anti-Mouse IgG Alexa Fluor 594 (goat polyclonal) | Invitrogen | Cat# A-11005, RRID:AB_2534073 | IF (1:2000) |
| Recombinant DNA reagent | A/Perth/16/2009 (H3N2) reverse genetics plasmids | PMID:33919124 | Bidirectional pHW2000 backbone | |
| Peptide, recombinant protein | Trypsin, TPCK-treated | Worthington Biochemical | Cat# LS003750 | 1:1000 |
| Cell line (Homo sapiens) | A549 cells | ATCC | Cat# CCL-185, RRID:CVCL_0023 | Validation performed by U. of Arizona Genetics Core |
| Sequence-based reagent | H3N2 PB2 FISH probes conjugated to Quasar 670 | This paper | FISH probes | Oligo sequences provided in Supplementary file 6 |
| Sequence-based reagent | H3N2 NA FISH probes conjugated to Quasar 570 | This paper | FISH probes | Oligo sequences provided in Supplementary file 6 |
| Sequence-based reagent | Amine-labeled H3N2 NS FISH probes | This paper | FISH probes | Oligo sequences provided in Supplementary file 6 |
| Commercial assay or kit | Alexa Fluor 488 Oligonucleotide Amine Labeling Kit | Invitrogen | Cat# A20191 | |
| Other | DAPI | Sigma | Cat# D9542 | 0.2 µg/ml |
| Chemical compound, drug | ProLong Diamond antifade mountant | Thermo Fisher | Cat# P36965 | |
| Software, algorithm | R | CRAN | RRID:SCR_001905 | |
| Software, algorithm | Parallel Evolution Of Influenza Viral RNA (custom script) | This paper | See Materials and methods, Code availability section | |
| Software, algorithm | Huygens | Scientific Volume Imaging B.V. | RRID:SCR_014237 | |
| Software, algorithm | Imaris | Bitplane | RRID:SCR_007370 | |
| Software, algorithm | Matlab | MathWorks | RRID:SCR_001622 | |
| Software, algorithm | Matlab extension | PMID:28724771 | See Materials and methods, Validation of vRNA relationships section |
Additional files
-
Supplementary file 1
Human H3N2 sequences analyzed from 1995 to 2004 and the corresponding GenBank accession numbers.
Human H3N2 sequences from 1995 to 2004 were downloaded from the Influenza Research Database and full-length genomes were concatenated and grouped into operational taxonomic units (numbered 1–12 under Cluster ID) with at least 97% sequence identity. Representative sequences were selected from these clusters for further analysis. Each vertical column indicates one replicate (seven replicates total).
- https://cdn.elifesciences.org/articles/66525/elife-66525-supp1-v2.xlsx
-
Supplementary file 2
Human H3N2 sequences analyzed from 2005 to 2014 and the corresponding GenBank accession numbers.
Human H3N2 sequences from 2005 to 2014 were downloaded from the Influenza Research Database and full-length genomes were concatenated and grouped into operational taxonomic units (numbered 1–12 and labeled Cluster ID) with at least 97% sequence identity. Representative sequences were selected from these clusters for further analysis. Each vertical column indicates one replicate (seven replicates total). Asterisks (*) denote H3N2v (variant) strains.
- https://cdn.elifesciences.org/articles/66525/elife-66525-supp2-v2.xlsx
-
Supplementary file 3
Human H1N1 sequences analyzed from 2000 to 2008 and the corresponding GenBank accession numbers.
Human H1N1 sequences from 2000 to 2008 were downloaded from the Influenza Research Database and full-length genomes were concatenated and grouped into operational taxonomic units (numbered 1–9 under Cluster ID) with at least 97% sequence identity. Representative sequences were selected from these clusters for further analysis. Each vertical column indicates one replicate (seven replicates total).
- https://cdn.elifesciences.org/articles/66525/elife-66525-supp3-v2.xlsx
-
Supplementary file 4
Human H1N1 strains analyzed from 2010 to 2018 and the corresponding GenBank accession numbers.
Human H1N1 sequences from 2010 to 2018 were downloaded from the Influenza Research Database and full-length genomes were concatenated and grouped into operational taxonomic units (numbered 1–9 under Cluster ID) with at least 97% sequence identity. Representative sequences were selected from these clusters for further analysis. Each vertical column indicates one replicate (seven replicates total).
- https://cdn.elifesciences.org/articles/66525/elife-66525-supp4-v2.xlsx
-
Supplementary file 5
Fluorescence in situ hybridization (FISH) probe sequences.
Custom oligonucleotide probes targeting PB2 (A), NA (B), and NS (C) vRNA were designed from A/Panama/2007/1999 (H3N2) virus sequences using the Stellaris probe designer (BioSearch Technologies). Oligos exhibiting significant complementarity against other vRNA segments and/or positive-strand complementarity were excluded.
- https://cdn.elifesciences.org/articles/66525/elife-66525-supp5-v2.xlsx
-
Supplementary file 6
p-Values associated with Figures 3C and 5C.
A Mann-Whitney U test was performed to determine whether pairwise Robinson-Foulds distance (RF) of H3N2 viruses from 1995 to 2004 were significantly different from pairwise RF of H3N2 viruses from 2005 to 2014 (left) and whether pairwise RF of H1N1 viruses from 2000 to 2008 were significantly different from pairwise RF of H1N1 viruses from 2010 to 2018 (right). The ‘p-adj’ indicates adjusted p-values after Benjamini-Hochberg correction.
- https://cdn.elifesciences.org/articles/66525/elife-66525-supp6-v2.xlsx
-
Transparent reporting form
- https://cdn.elifesciences.org/articles/66525/elife-66525-transrepform1-v2.pdf
Download links
A two-part list of links to download the article, or parts of the article, in various formats.
Downloads (link to download the article as PDF)
Open citations (links to open the citations from this article in various online reference manager services)
Cite this article (links to download the citations from this article in formats compatible with various reference manager tools)
Parallel evolution between genomic segments of seasonal human influenza viruses reveals RNA-RNA relationships
eLife 10:e66525.
https://doi.org/10.7554/eLife.66525


