Neural basis for regulation of vasopressin secretion by anticipated disturbances in osmolality
- Division of Endocrinology, Diabetes, and Metabolism, Department of Medicine, Beth Israel Deaconess Medical Center, Harvard Medical School, United States
- Program in Neuroscience, Harvard Medical School, United States
Figures
Figure 1
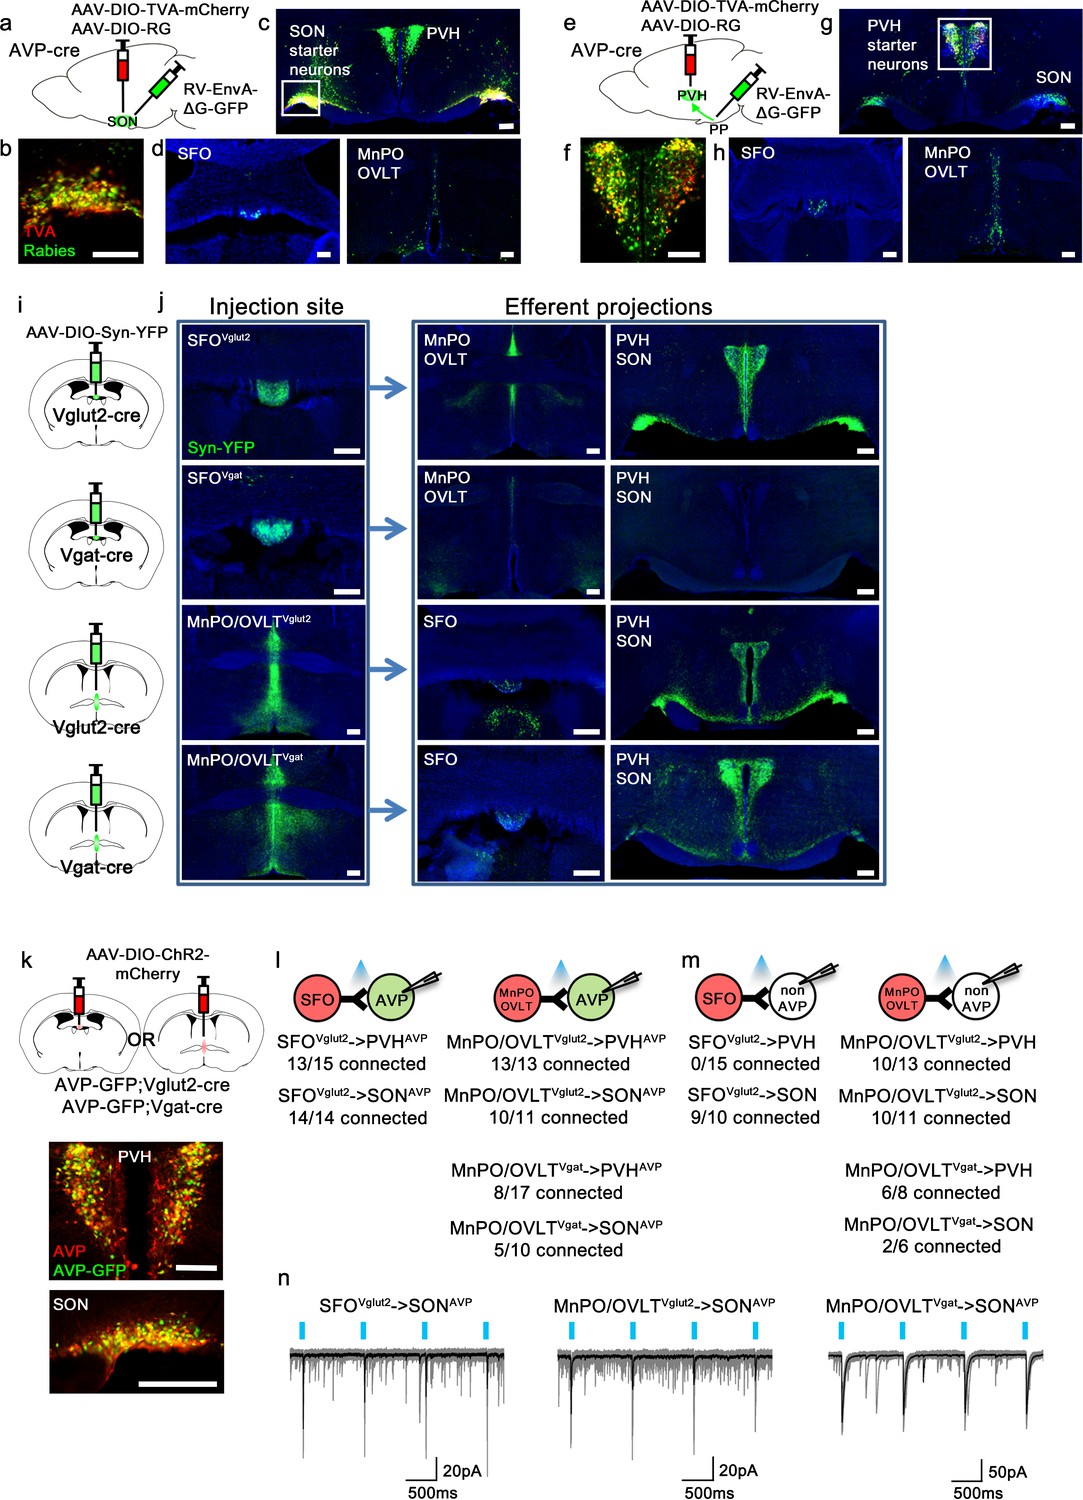
Magnocellular AVP neurons receive excitatory and inhibitory input from the LT.
(a, e) Schematic of monosynaptic rabies tracing from magnocellular PVHAVP (a) and SONAVP (e) neurons. To target magnocellular PVHAVP neurons, rabies virus was injected into the posterior pituitary. (b, f) Representative images showing magnocellular PVHAVP (b) and SONAVP (f) starter neurons as identified by co-expression of GFP and mCherry. (c, g), Representative images showing magnocellular PVHAVP (c) and SONAVP (g) starter neurons and dense rabies labeling in the SON (c) and PVH (g). (d, h) Representative images showing sites containing rabies-labeled neurons in the LT that are monosynaptically connected to magnocellular PVHAVP (d) and SONAVP (h) neurons. (i) Schematic of anterograde tracing from excitatory and inhibitory neurons in the SFO and MnPO/OVLT. (j) Representative images showing expression of Syn-YFP in excitatory and inhibitory neurons in the SFO and MnPO/OVLT (left box), and their efferent projections in the SFO, MnPO, OVLT, PVH, and SON (right box). Note lack of YFP-labeled fibers from SFOVgat neurons in the PVH and SON. (k) Schematic of CRACM (top) and representative images showing co-localization of GFP and AVP immunofluorescence (red) in the PVH (middle) and SON (bottom ) of AVP-GFP mice. (l, m) Number of PVHAVP and SONAVP neurons (l) and non-GFP PVH and SON neurons (m) receiving direct synaptic inputs from MnPO/OVLTVglut2, SFOVglut2, and MnPO/OVLTVgat neurons as identified by CRACM. Mice used include AVP-GFP;Vglut2-IRES-Cre (MnPO/OVLTVglut2 and SFOVglut2) and AVP-GFP;Vgat-IRES-Cre (MnPO/OVLTVgat). Scale bar, 200 µm. (n) Representative traces showing light-evoked responses in SFOVglut2 to SONAVP (left), MnPO/OVLTVglut2 to SONAVP (middle), and MnPO/OVLTVgat to SONAVP (right) CRACM. Black trace is an average of all traces (gray) in consecutive trials. AVP, vasopressin; CRACM, channelrhodopsin (ChR2)-assisted circuit mapping; LT, lamina terminalis; MnPO, median preoptic nucleus; OVLT, organum vasculosum lamina terminalis; PVH, paraventricular; SFO, subfornical organ; SON, supraoptic nuclei.
Figure 2 with 3 supplements
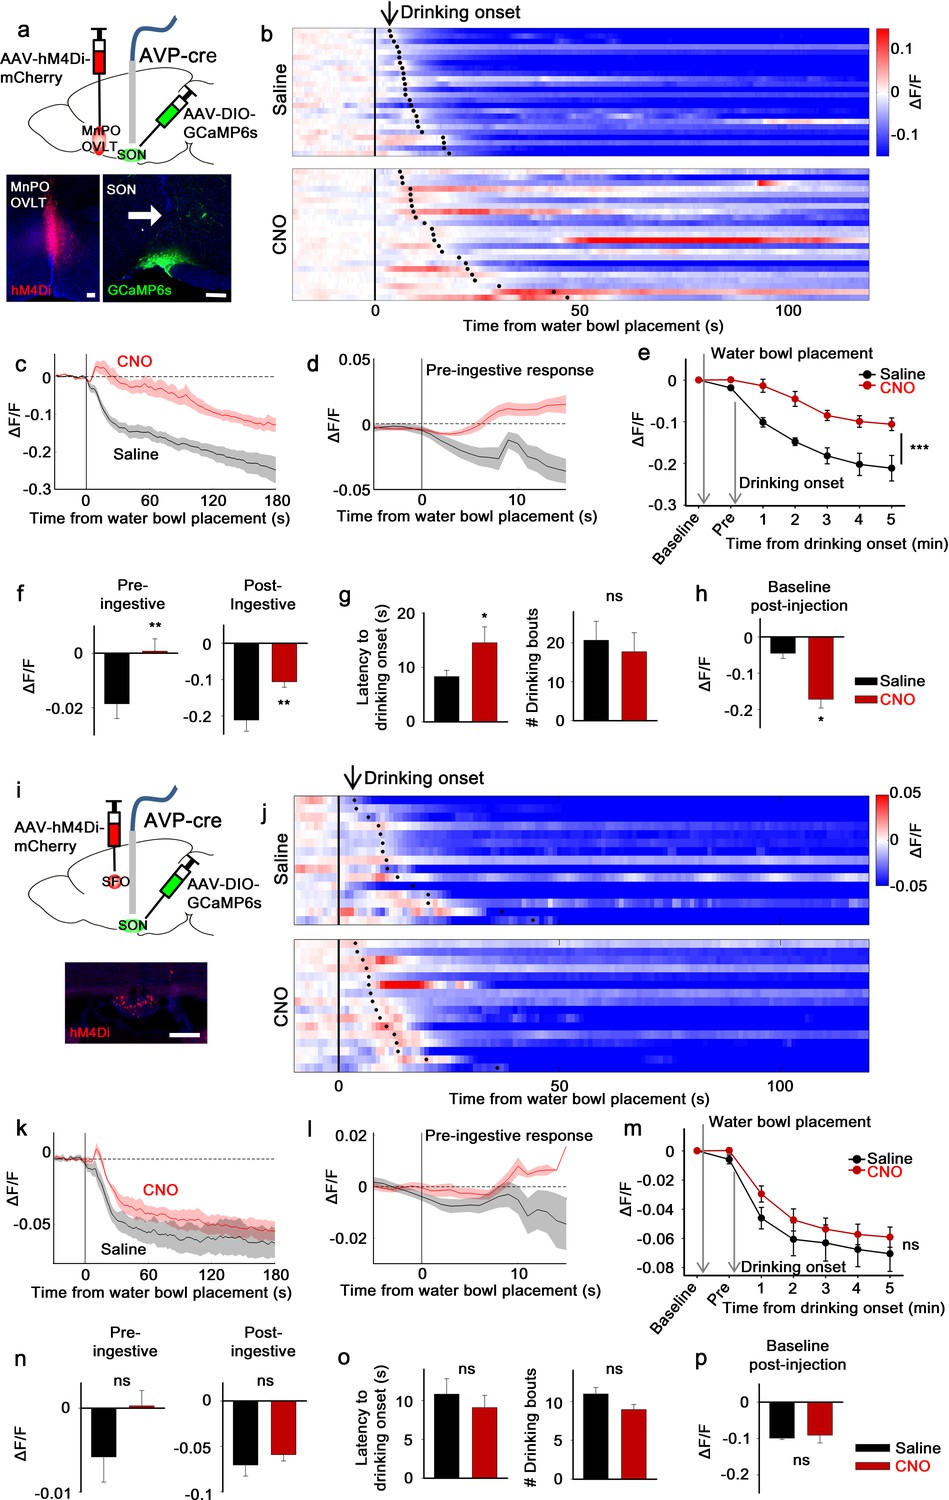
The LT mediates water-related presystemic regulation of SONAVP neurons.
(a, i) Schematic of SONAVP photometry experiment with hM4Di-mediated non-specific inhibition of neurons in the MnPO/OVLT (a) and SFO (i). (b, j) Single-trial timecourses of SONAVP population activity in response to water bowl placement in saline and CNO trials of mice expressing hM4Di in the MnPO/OVLT (b) and SFO (j). Trials are sorted according to latency from water bowl placement to drinking onset (black ticks). n=6 (MnPO), 5 (SFO) mice. (c, k), Average SONAVP population activity in response to water bowl placement in saline and CNO trials of mice expressing hM4Di in the MnPO/OVLT (c) and SFO (k). n=6 (MnPO), 5 (SFO) mice. (d, l) Average of pre-ingestive responses in saline and CNO trials of mice expressing hM4Di in the MnPO/OVLT (d) and SFO (l). n=6 (MnPO), 5 (SFO) mice. Values are means ± SEMs across trials. (e, m) Data from panels (c) (e) and (k) (m) binned across drinking periods. ***p<0.001; repeated measures (RM) two-way ANOVA, p<0.001 (MnPO), p>0.005 (SFO), n=6 (MnPO), 5 (SFO) mice. (f, n) Average pre- and post-ingestive responses in saline and CNO trials of mice expressing hM4Di in the MnPO/OVLT (f) and SFO (n). ns, p>0.05; *p<0.05; **p<0.01; paired t-test, p=0.00974, 0.00414 (MnPO), 0.101, 0.361 (SFO), n=6 (MnPO), 5 (SFO) mice. (g, o) Average latency to drinking onset and number of drinking bouts in saline and CNO trials of mice expressing hM4Di in the MnPO/OVLT (g) and SFO (o). ns, p>0.05; *p<0.05; **p<0.01; paired t-test, p=0.197, 0.0302 (MnPO), 0.0888, 0.141 (SFO), n=6 (MnPO), 5 (SFO) mice. (h, p) Average change in baseline activity in saline and CNO trials of mice expressing hM4Di in the MnPO/OVLT (h) and SFO (p). ns, p>0.05; *p<0.05; **p<0.01; paired t-test, p=0.0152 (MnPO), 0.692 (SFO), n=6 (MnPO), 3 (SFO) mice. Values are means ± SEMs across mice except for (d, l). See also Figure 2—figure supplements 1–3, AVP, vasopressin; LT, lamina terminalis; MnPO, median preoptic nucleus; OVLT, organum vasculosum lamina terminalis; PVH, paraventricular; SFO, subfornical organ; SON, supraoptic nuclei.
-
Figure 2—source data 1
SONAVP neuron response to water bowl placement after non-specific inhibition of the MnPO/OVLT and SFO.
- https://cdn.elifesciences.org/articles/66609/elife-66609-fig2-data1-v2.xlsx
Figure 2—figure supplement 1
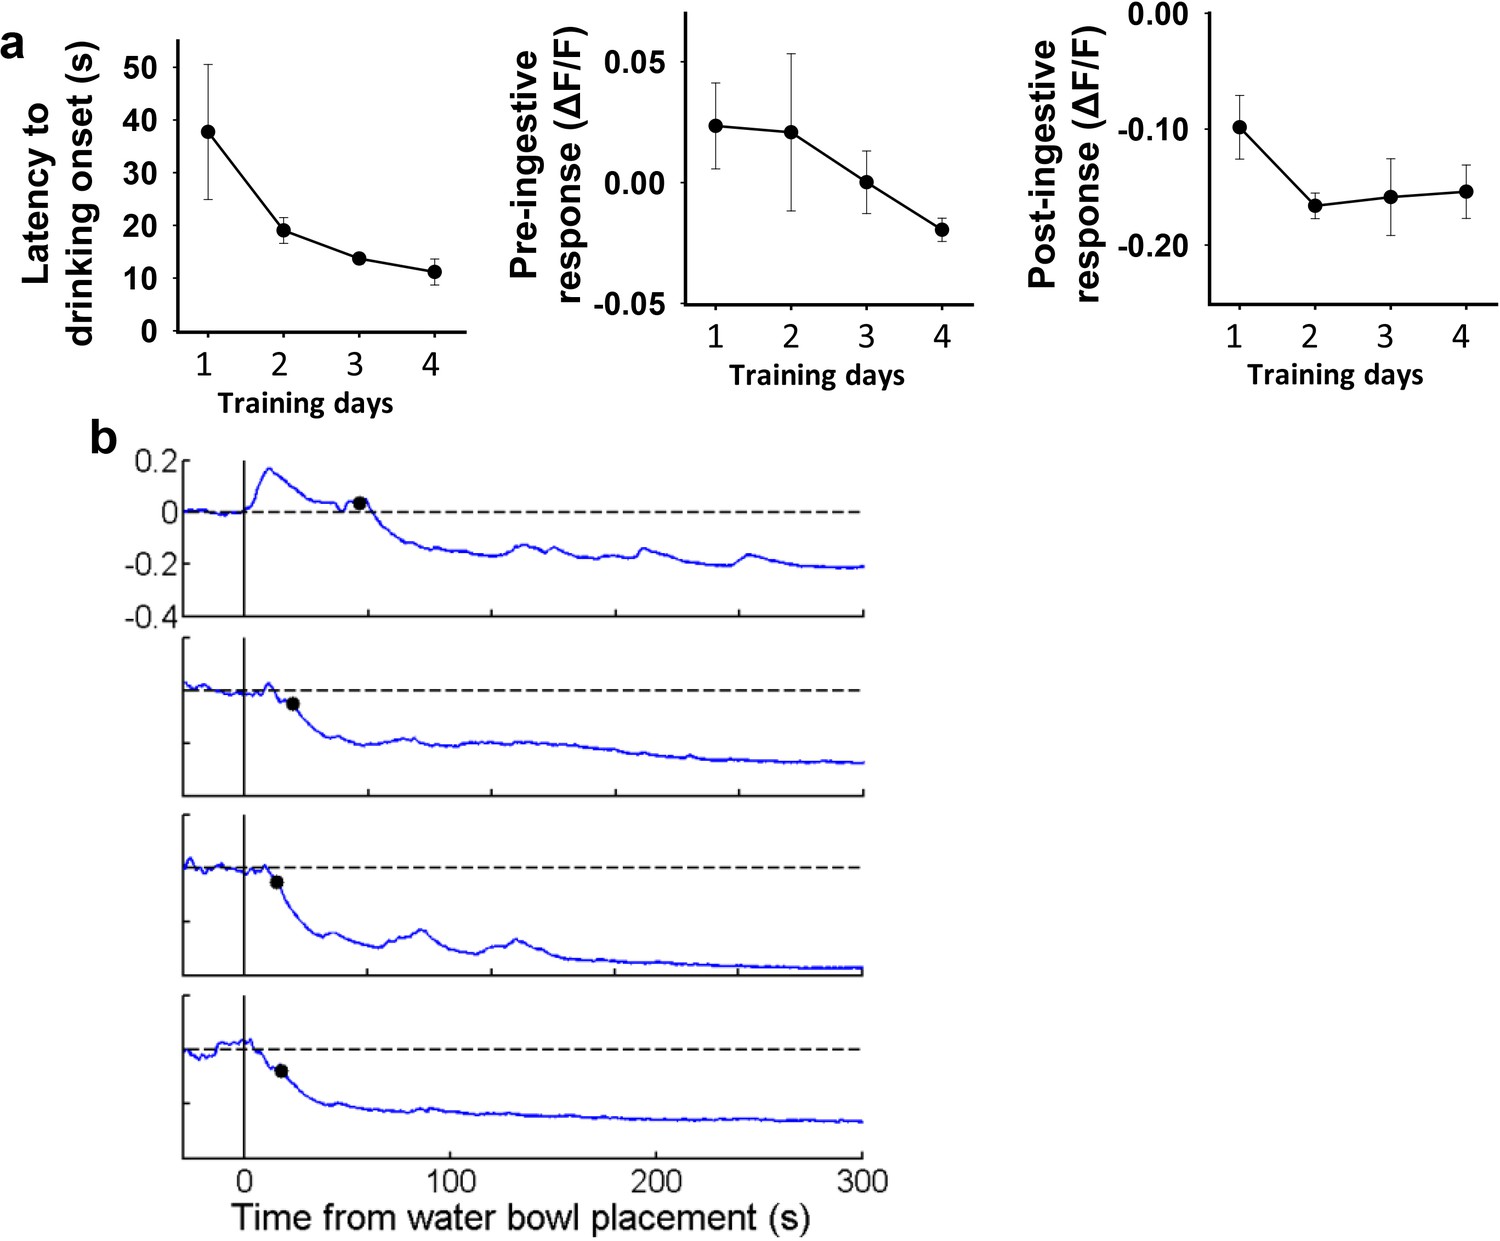
Pre-ingestive inhibition of SONAVP neurons by water cue develops gradually over training.
(a) Changes in latency to drinking onset, pre-ingestive, and post-ingestive response of SONAVP neurons over the first 4 consecutive days of training. (b) Representative traces showing SONAVP neuron activity in response to water bowl placement during the first 4 consecutive days of training. Black circles indicate drinking onset. n=4 mice. AVP, vasopressin; SON, supraoptic nuclei.
-
Figure 2—figure supplement 1—source data 1
Response of SONAVP neurons to water bowl placement during training.
- https://cdn.elifesciences.org/articles/66609/elife-66609-fig2-figsupp1-data1-v2.xlsx
Figure 2—figure supplement 2
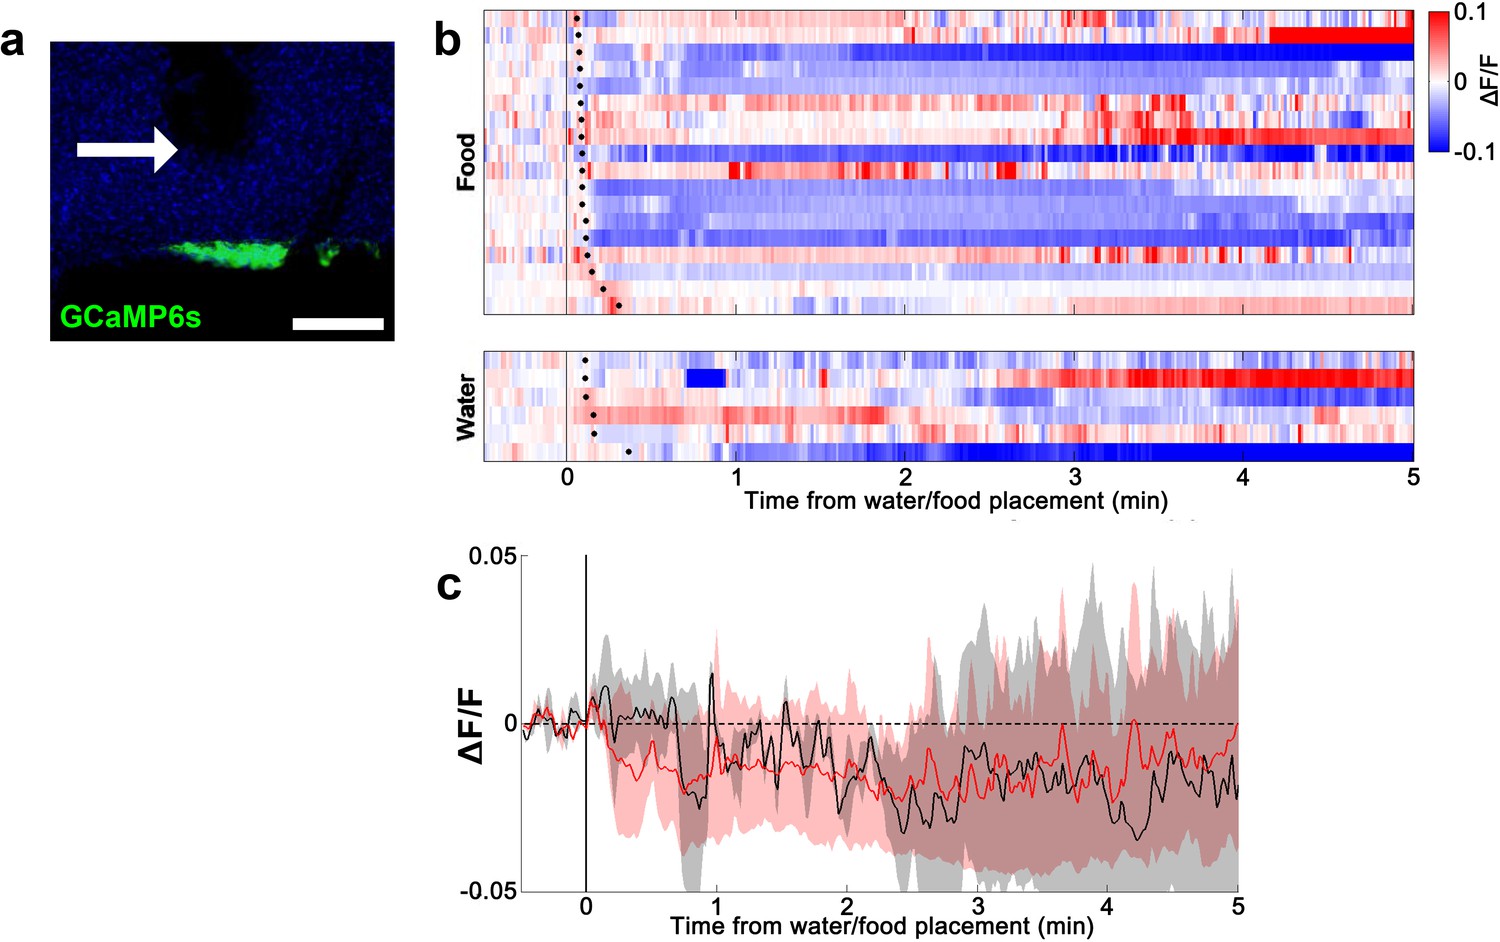
Lack of water- and food-induced responses in EYFP-expressing AVP-IRES-Cre mice.
(a) Representative image showing EYFP expression in SONAVP neurons. (b) Heatmap showing single-trial timecourses of fluorescence in response to water/food bowl placement. Trials are sorted according to latency from water/food bowl placement to drinking/feeding onset (black ticks). (c) Average fluorescence traces in response to water/food bowl placement. AVP, vasopressin; SON, supraoptic nuclei.
-
Figure 2—figure supplement 2—source data 1
Fluorescence changes in the SON of EYFP-expressing AVP-IRES-Cre mice in response to water and food bowl placement.
- https://cdn.elifesciences.org/articles/66609/elife-66609-fig2-figsupp2-data1-v2.xlsx
Figure 2—figure supplement 3
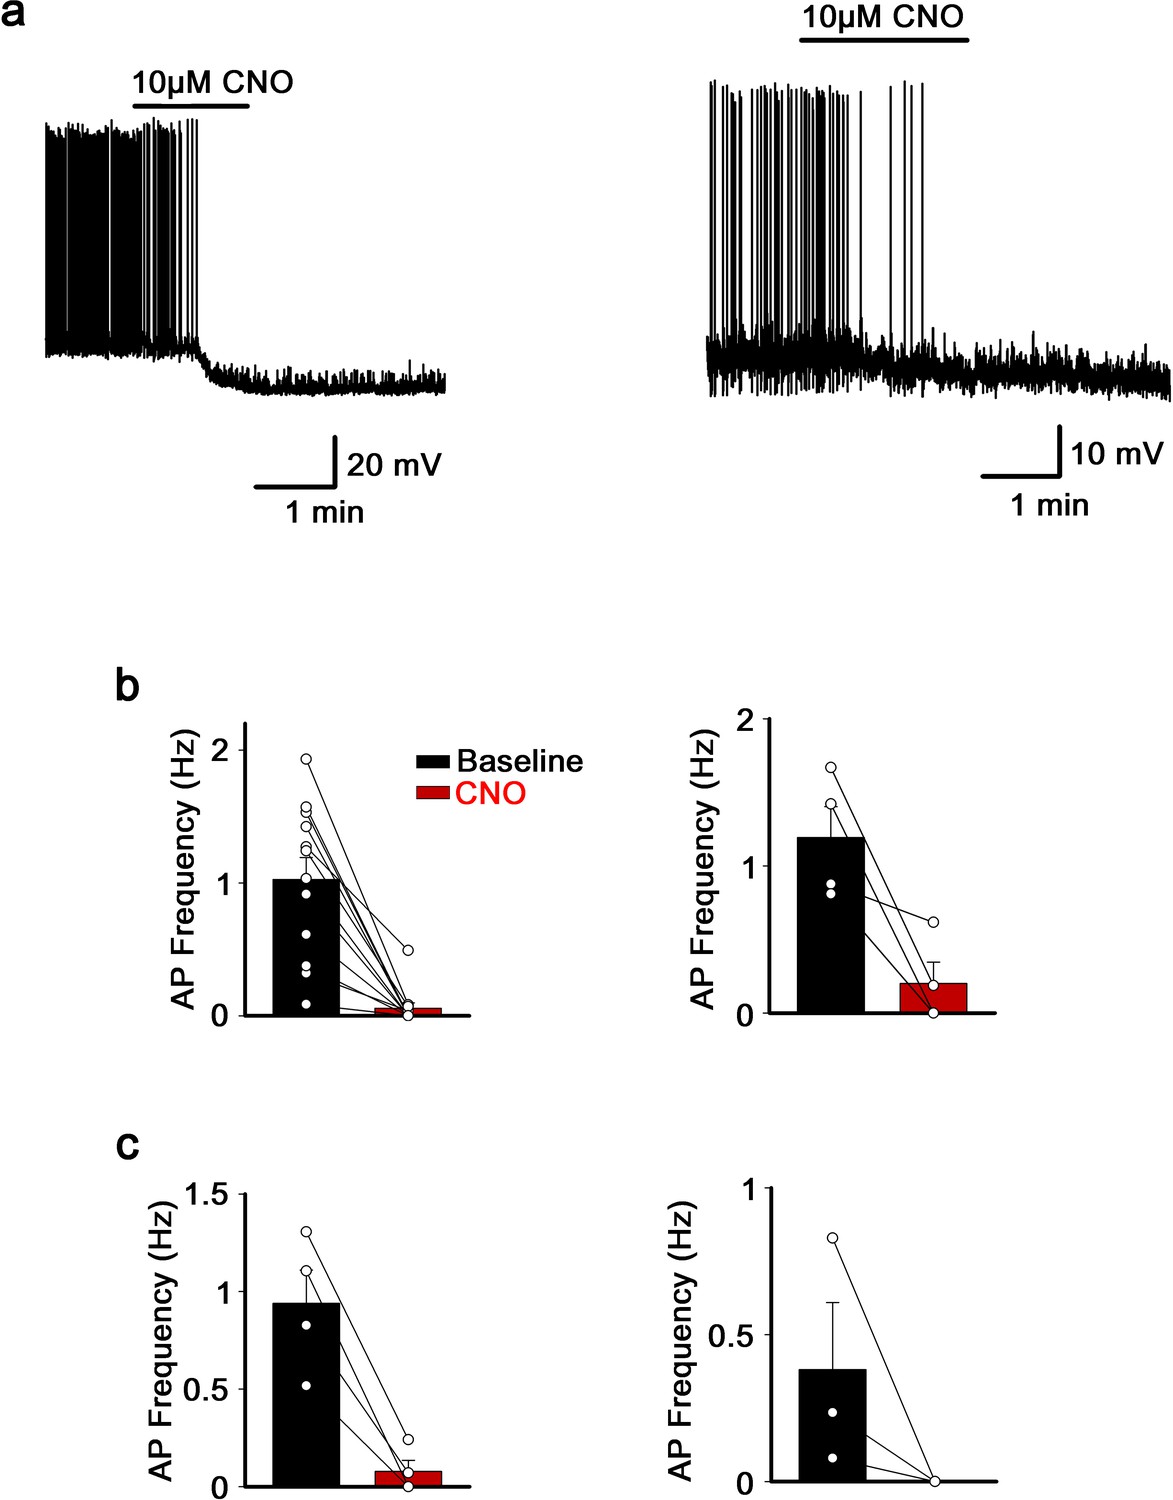
Effect of CNO application on hM4Di-expressing neurons of the MnPO/OVLT and the SFO.
(a) Representative traces showing effect of CNO application on hM4Di-expressing neurons of the MnPO/OVLT (left) and the SFO (right). (b) Frequency of action potential firings before and after CNO application in neurons of the MnPO/OVLT (left) and the SFO (right) infected with Cre-independent hM4Di virus. (c) Frequency of action potential firings before and after CNO application in neurons of the MnPO/OVLT infected with Flp-dependent hM4Di virus in Vglut2-IRES-Flp (left) and Vgat-IRES-Flp (right) mice. MnPO, median preoptic nucleus; OVLT, organum vasculosum lamina terminalis; SFO, subfornical organ.
-
Figure 2—figure supplement 3—source data 1
Effect of CNO application on hM4Di-expressing neurons of the MnPO/OVLT and the SFO.
- https://cdn.elifesciences.org/articles/66609/elife-66609-fig2-figsupp3-data1-v2.xlsx
Figure 3 with 1 supplement
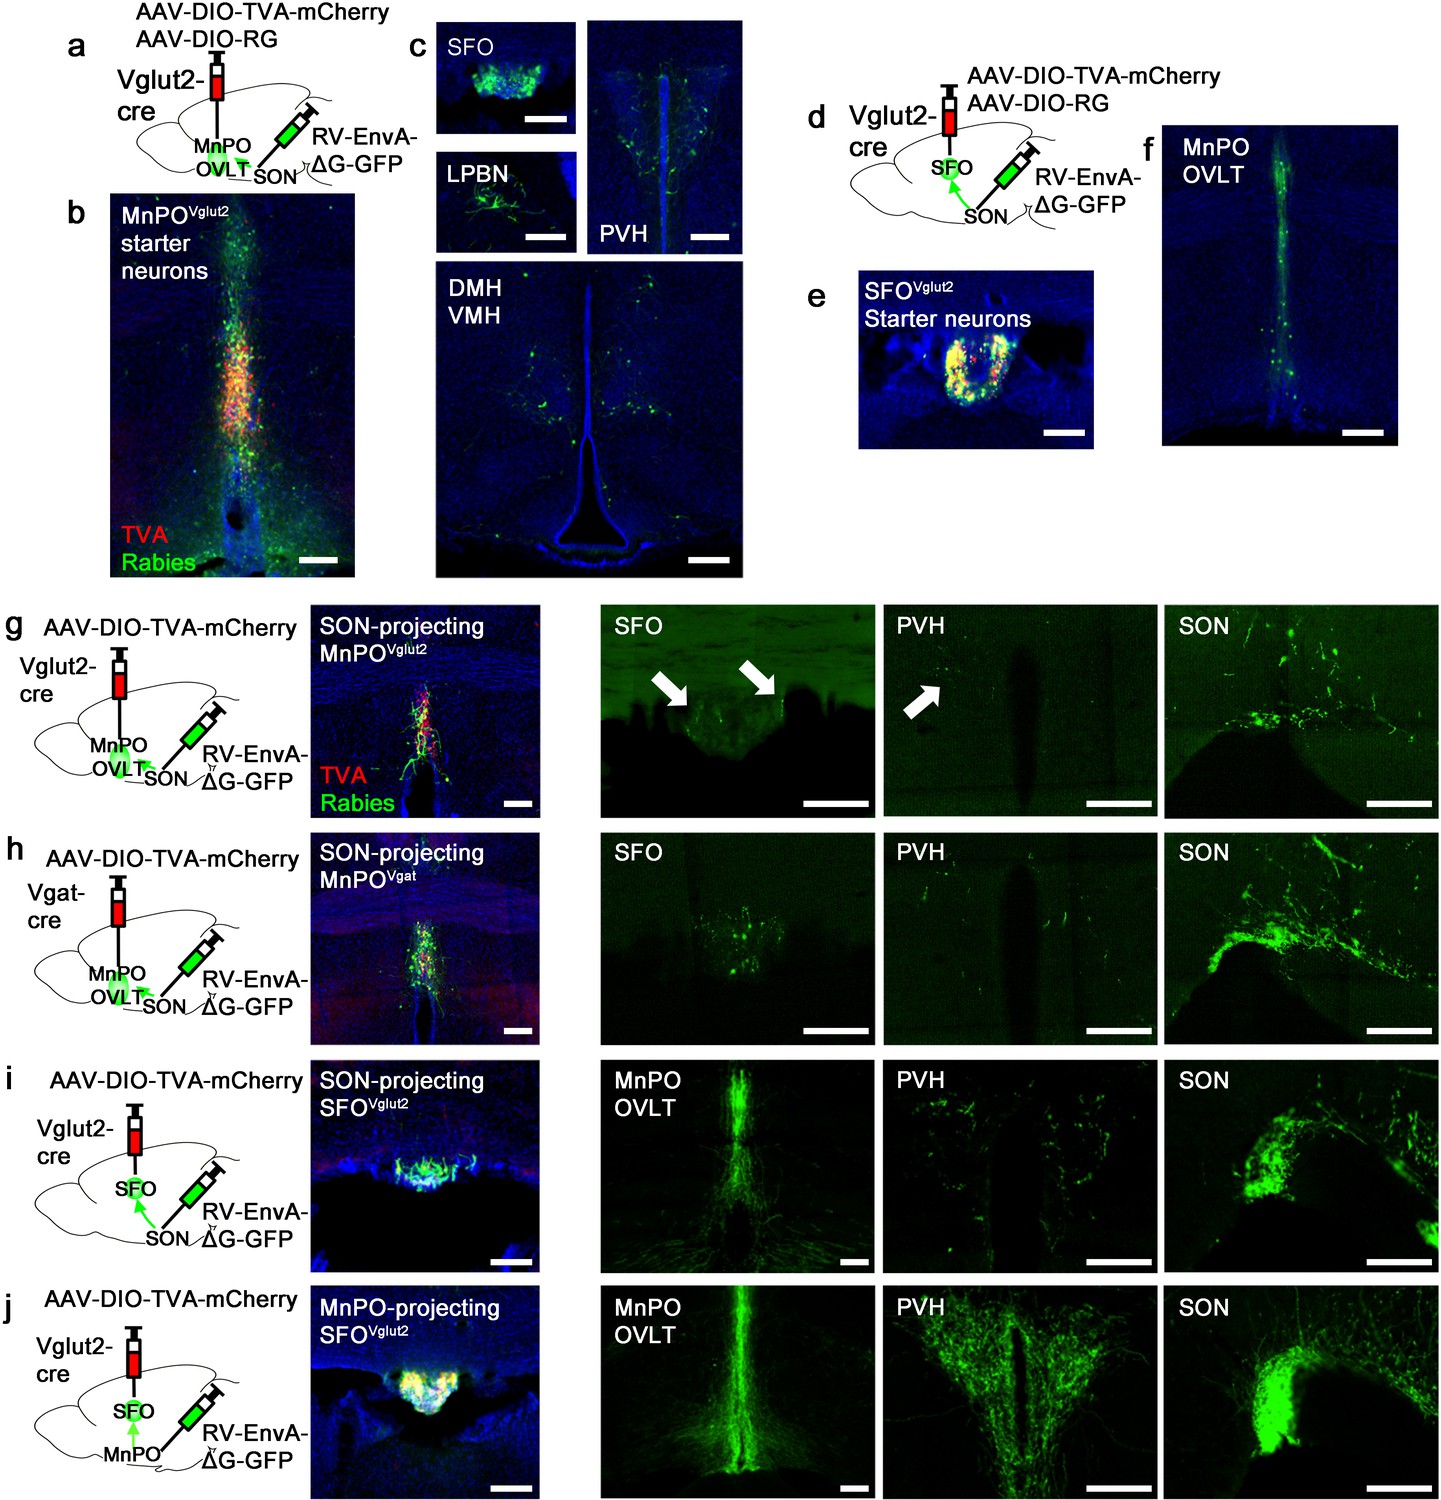
Organization of water-related presystemic neural circuit.
(a) Schematic of monosynaptic rabies tracing from MnPO/OVLTVglut2 neurons. (b, c) Representative images showing MnPO/OVLTVglut2 starter neurons as identified by co-expression of GFP and mCherry (b), and sites containing rabies-labeled neurons that are monosynaptically connected to MnPO/OVLTVglut2 neurons (c). (d) Schematic of monosynaptic rabies tracing from SFOVglut2 neurons. (e, f) Representative image showing SFOVglut2 starter neurons as identified by co-expression of GFP and mCherry (e), and sites containing rabies-labeled neurons that are monosynaptically connected to SFOVglut2 neurons (f). (g–j) Schematic of rabies-based axon collateral mapping (left), representative images showing starter neurons (middle), and rabies-labeled collateral projections (right) of SON-projecting MnPO/OVLTVglut2 (g), MnPO/OVLTVgat (h), and SFOVglut2 (i) neurons and MnPO/OVLT-projecting SFOVglut2 (j) neurons. Arrows, rabies-labeled collateral projections. Scale bar, 200 µm. See also Figure 3—figure supplement 1. MnPO, median preoptic nucleus; OVLT, organum vasculosum lamina terminalis; SFO, subfornical organ; SON, supraoptic nuclei.
Figure 3—figure supplement 1
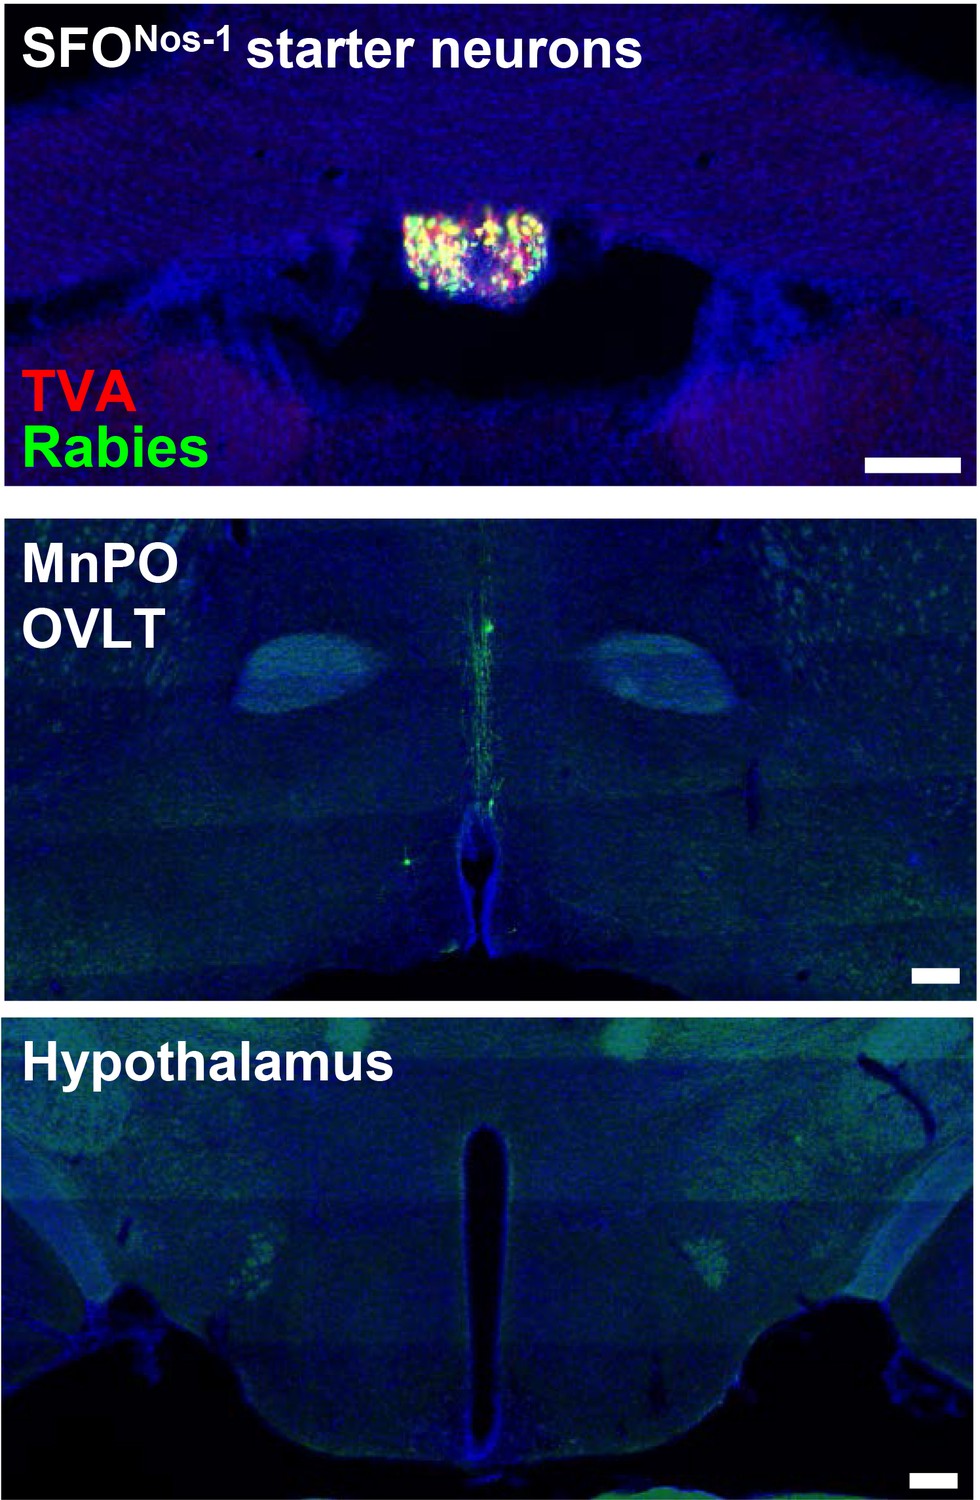
Monosynaptic rabies tracing from SON-projecting SFONos-1 neurons showing lack of extra LT afferents.
Representative image showing SFONos-1 starter neurons as identified by co-expression of GFP and mCherry (top), rabies-labeled neurons in the MnPO and OVLT that are monosynaptically connected to SFONos-1 neurons (middle), and lack of rabies-labeled neurons outside the LT as exemplified in the regions of hypothalamus (bottom). Scale bar, 200 µm. LT, lamina terminalis; MnPO, median preoptic nucleus; OVLT, organum vasculosum lamina terminalis; SON, supraoptic nuclei.
Figure 4
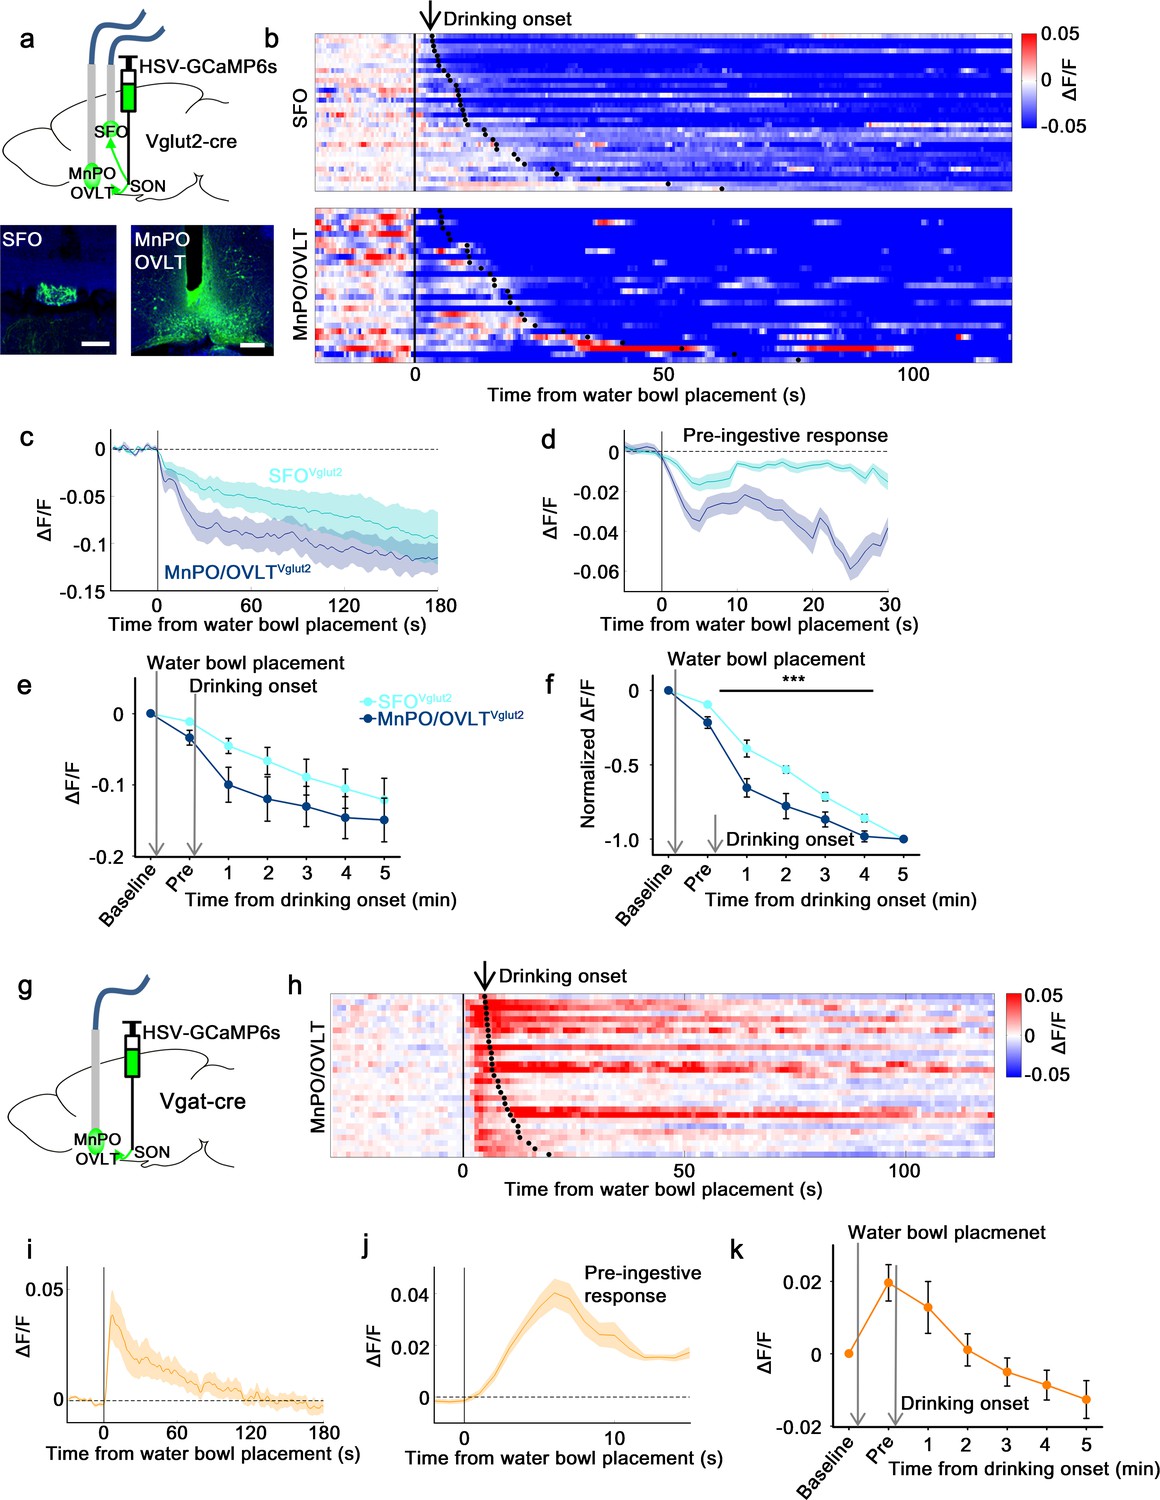
SON-projecting SFOVglut2, MnPO/OVLTVglut2, and MnPO/OVLTVgat neurons show presystemic responses to water bowl placement and drinking.
(a) Schematic of photometry experiment from SON-projecting SFOVglut2 and MnPO/OVLTVglut2 neurons. (b) Single-trial timecourses of SON-projecting SFOVglut2 (top) and MnPO/OVLTVglut2 (bottom) population activity in response to water bowl placement. Trials are sorted according to latency from water bowl placement to drinking onset (black ticks). n=7 (SFOVglut2), and 5 (MnPO/OVLTVglut2) mice. (c) Average population activity of SON-projecting SFOVglut2 (light blue) and MnPO/OVLTVglut2 (dark blue) neurons in response to water bowl placement. n=7 (SFOVglut2), and 5 (MnPO/OVLTVglut2) mice. (d) Average pre-ingestive responses of SON-projecting SFOVglut2 (light blue) and MnPO/OVLTVglut2 (dark blue) neurons. n=7 (SFOVglut2), and 5 (MnPO/OVLTVglut2) mice. Values are means ± SEMs across trials. (e) Data from panel (c) binned across drinking periods. n=7 (SFOVglut2), and 5 (MnPO/OVLTVglut2) mice. (f) Normalized average SON-projecting SFOVglut2 and MnPO/OVLTVglut2 population activity binned across drinking periods. Values are normalized to the total change. ***p<0.001; two-way ANOVA, p<0.001, n=7 (SFOVglut2), and 5 (MnPO/OVLTVglut2) mice. (g) Schematic of photometry experiment from SON-projecting MnPO/OVLTVgat neurons. (h) Single-trial timecourses of SON-projecting MnPO/OVLTVgat population activity in response to water bowl placement. Trials are sorted according to latency from water bowl placement to drinking onset (black ticks). n=9 mice. (i) Average population activity of SON-projecting MnPO/OVLTVgat neurons in response to water bowl placement. n=9 mice. (j) Average pre-ingestive responses of SON-projecting MnPO/OVLTVgat neurons. n=9 mice. Values are means ± SEMs across trials. (k) Data from panel (i) binned across drinking periods. n=9 mice. Scale bar, 200 µm. Values are means ± SEMs across mice except for (d, j). MnPO, median preoptic nucleus; OVLT, organum vasculosum lamina terminalis; SFO, subfornical organ; SON, supraoptic nuclei.
Figure 5
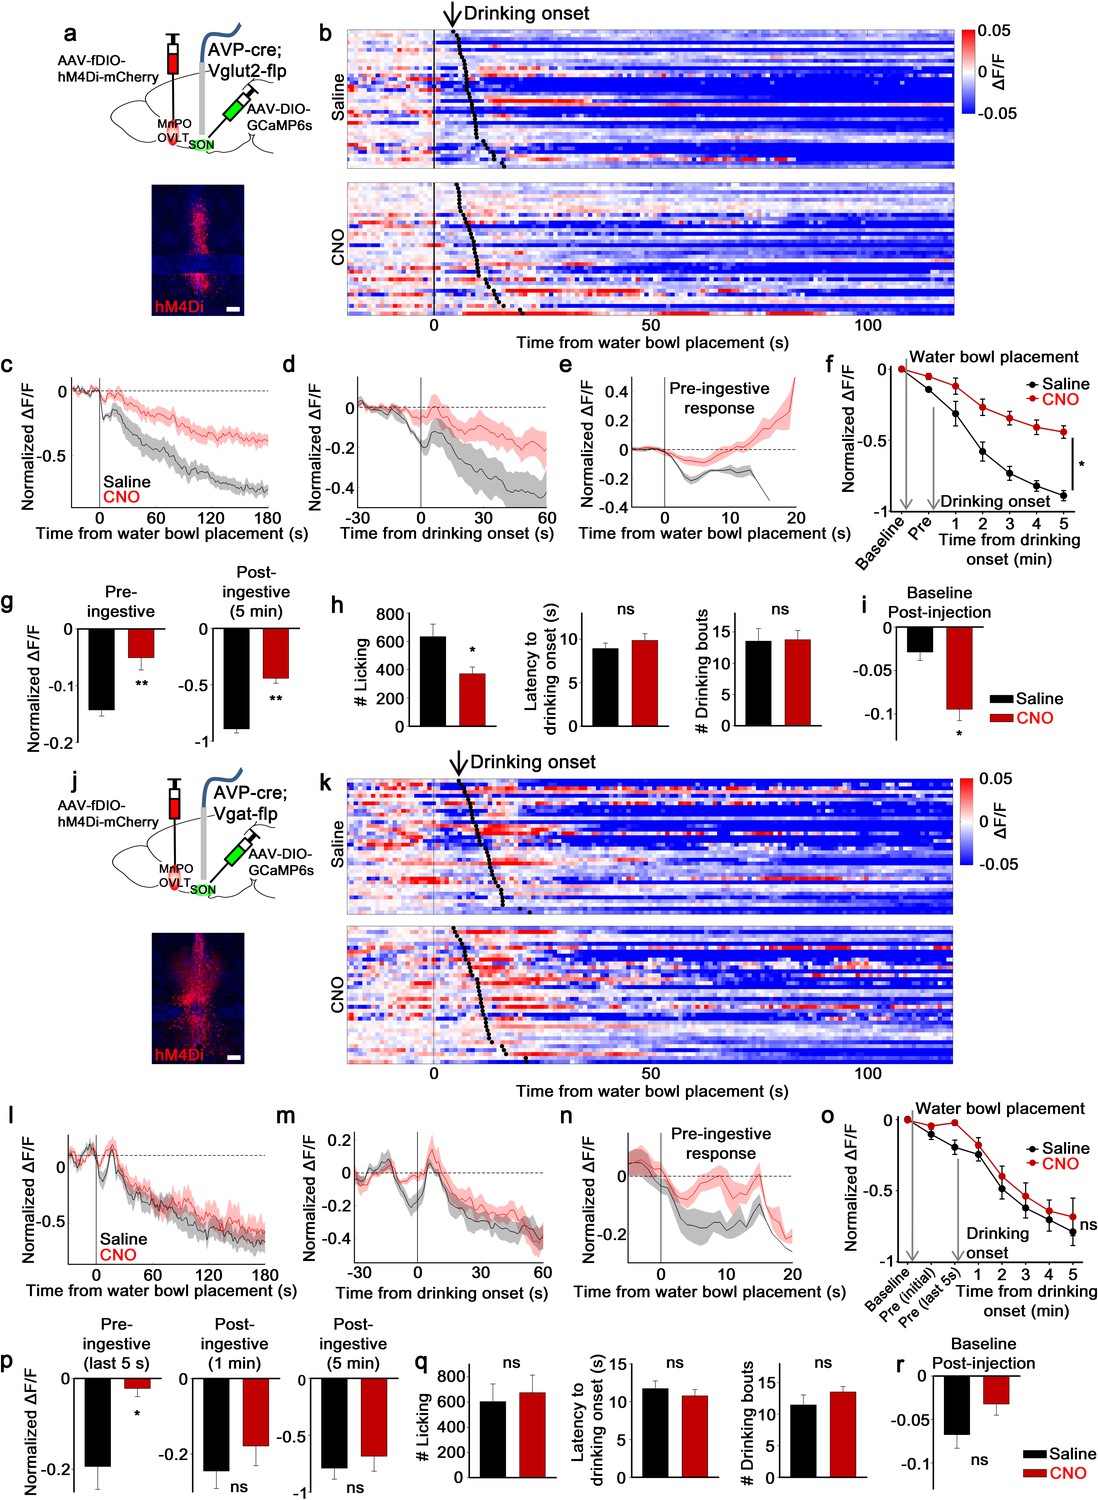
MnPO/OVLTVglut2 and MnPO/OVLTVgat neurons contribute to different aspects of water-related presystemic regulation of SONAVP neurons.
(a, j) Schematic of SONAVP photometry experiment with hM4Di-mediated inhibition of MnPO/OVLTVglut2 (a) and MnPO/OVLTVgat (j) neurons. (b, k) Single-trial timecourses of SONAVP population activity in response to water bowl placement in saline and CNO trials of mice expressing hM4Di in MnPO/OVLTVglut2 (b) and MnPO/OVLTVgat (k) neurons. Trials are sorted according to latency from water bowl placement to drinking onset (black ticks). n=6 (MnPO/OVLTVglut2), 6 (MnPO/OVLTVgat) mice. (c, l) Average SONAVP population activity in response to water bowl placement in saline and CNO trials of mice expressing hM4Di in MnPO/OVLTVglut2 (c) and MnPO/OVLTVgat (l) neurons. n=6 (MnPO/OVLTVglut2), 6 (MnPO/OVLTVgat) mice. (d, m) Average SONAVP population activity in response to drinking onset in saline and CNO trials of mice expressing hM4Di in MnPO/OVLTVglut2 (d) and MnPO/OVLTVgat (m) neurons. n=6 (MnPO/OVLTVglut2), 6 (MnPO/OVLTVgat) mice. (e, n) Average of pre-ingestive responses in saline and CNO trials of mice expressing hM4Di in MnPO/OVLTVglut2 (e) and MnPO/OVLTVgat (n) neurons. n=6 (MnPO/OVLTVglut2), 7 (MnPO/OVLTVgat) mice. (f, o) Data from panels (c) (f) and (l) ( o) binned across drinking periods. ns, p>0.05; *p<0.05; RM two-way ANOVA, p=0.002 (MnPO/OVLTVglut2), p>0.05 (MnPO/OVLTVgat), n=6 (MnPO/OVLTVglut2), 7 (MnPO/OVLTVgat) mice. (g, p) Average pre- and post-ingestive responses in saline and CNO trials of mice expressing hM4Di in MnPO/OVLTVglut2 (g) and MnPO/OVLTVgat (p) neurons. ns, p> 0.05; *p<0.05; **p<0.01; paired t-test, p=0.00474, 0.00189 (MnPO/OVLTVglut2), 0.0257, 0.413, 0.256 (MnPO/OVLTVgat), n=6 (MnPO/OVLTVglut2), 7 (MnPO/OVLTVgat) mice. (h, q) Effect of MnPO/OVLTVglut2 (h) and MnPO/OVLTVgat (q) neuron inhibition on drinking and average latency to drinking onset and number of drinking bouts in saline and CNO trials. ns, p>0.05; *p<0.05; paired t-test, p=0.0179, 0.116, 0.890 (MnPO/OVLTVglut2), 0.6, 0.317, 0.229 (MnPO/OVLTVgat), n=6, 6, 5 (MnPO/OVLTVglut2), 5, 7, 5 (MnPO/OVLTVgat) mice. (i, r) Average change in baseline activity in saline and CNO trials of mice expressing hM4Di in MnPO/OVLTVglut2 (i) and MnPO/OVLTVgat (r) neurons. ns, p>0.05; *p<0.05; paired t-test, p=0.0140 (MnPO/OVLTVglut2), 0.112 (MnPO/OVLTVgat), n=6 (MnPO/OVLTVglut2), 5 (MnPO/OVLTVgat) mice. Scale bar, 200 µm. Values are means ± SEMs across mice. AVP, vasopressin; MnPO, median preoptic nucleus; OVLT, organum vasculosum lamina terminalis; SFO, subfornical organ; SON, supraoptic nuclei.
-
Figure 5—source data 1
SONAVP neuron response to water bowl placement after specific inhibtion of MnPO/OVLTVglut2 and MnPO/OVLTVgat neurons.
- https://cdn.elifesciences.org/articles/66609/elife-66609-fig5-data1-v2.xlsx
Figure 6
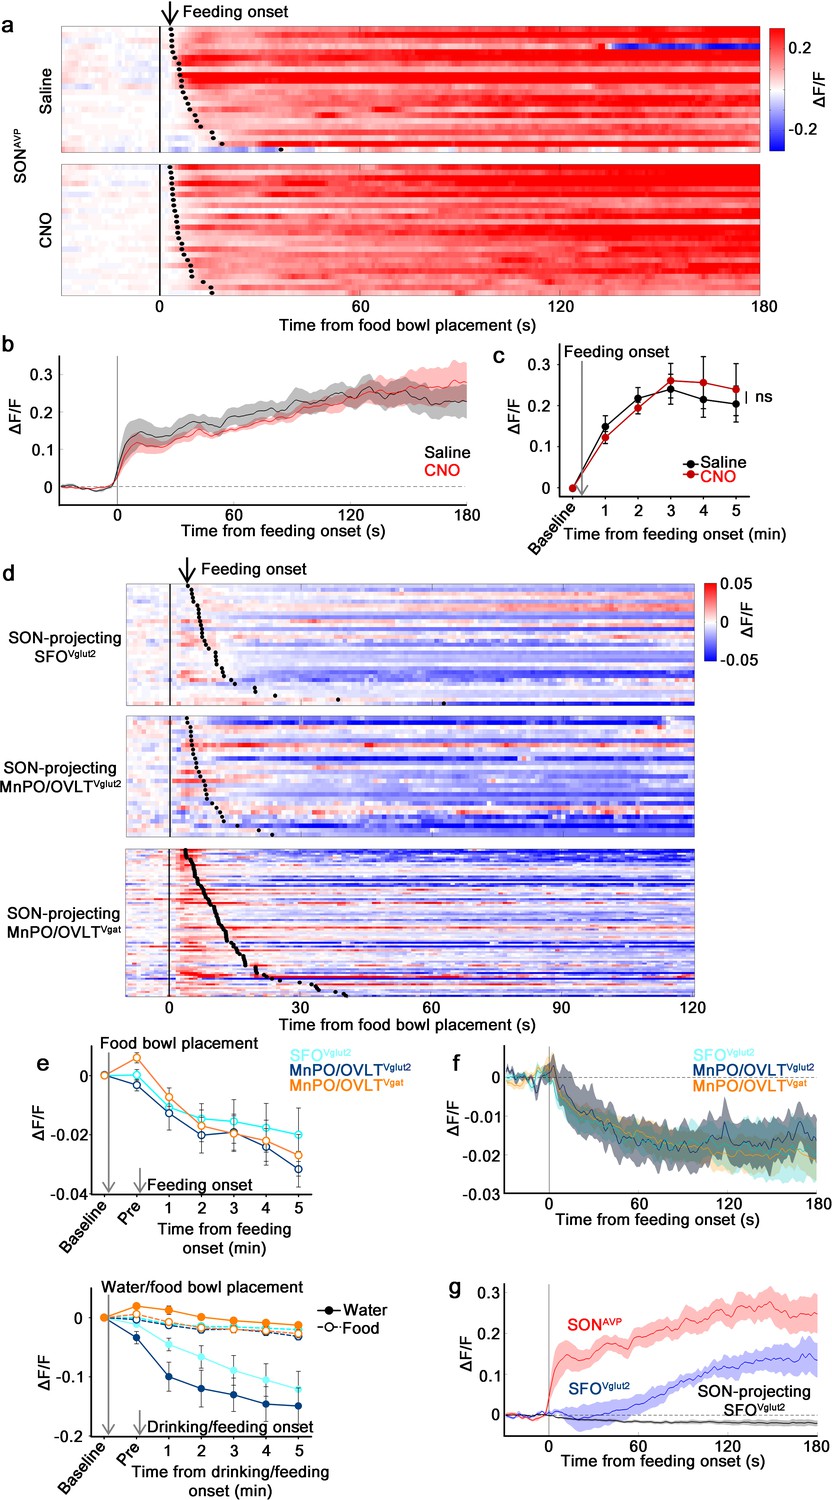
The MnPO/OVLT is not involved in food-related presystemic regulation of SONAVP neurons.
(a) Single-trial timecourses of SONAVP population activity in response to food bowl placement in saline and CNO trials. Trials are sorted according to latency from food bowl placement to feeding onset (black ticks). n=5 mice. (b) Average population activity of SONAVP neurons in response to feeding onset in saline and CNO trials. n=5 mice. (c) Data from panel (b) binned across feeding periods. ns, p>0.05; RM two-way ANOVA, p>0.05, n=5 mice. (d) Single-trial timecourses of SON-projecting SFOVglut2, MnPO/OVLTVglut2, and MnPO/OVLTVgat population activity in response to food bowl placement. Trials are sorted according to latency from food bowl placement to feeding onset (black ticks). n=7 (SFOVglut2), and 5 (MnPO/OVLTVglut2), and 12 (MnPO/OVLTVgat) mice. (e), Average population response of SON-projecting SFOVglut2, MnPO/OVLTVglut2, and MnPO/OVLTVgat neurons to food bowl placement (top) and water (closed circles, solid line) versus food (open circles, dotted line) bowl placement (bottom). (f) Average population activity of SON-projecting SFOVglut2, MnPO/OVLTVglut2, and MnPO/OVLTVgat neurons aligned to feeding onset. (g) Average population activity of SONAVP, SFOVglut2, and SON-projecting SFOVglut2 neurons aligned to feeding onset. n=5 (SONAVP, same data as b), 3 (SFOVglut2), and 7 (SON-projecting SFOVglut2) mice. Values are means ± SEMs across mice. AVP, vasopressin; MnPO, median preoptic nucleus; OVLT, organum vasculosum lamina terminalis; SFO, subfornical organ; SON, supraoptic nuclei.
-
Figure 6—source data 1
The MnPO/OVLT is not involved in food-related presystemic regulation of SONAVP neurons.
- https://cdn.elifesciences.org/articles/66609/elife-66609-fig6-data1-v2.xlsx
Figure 7 with 4 supplements
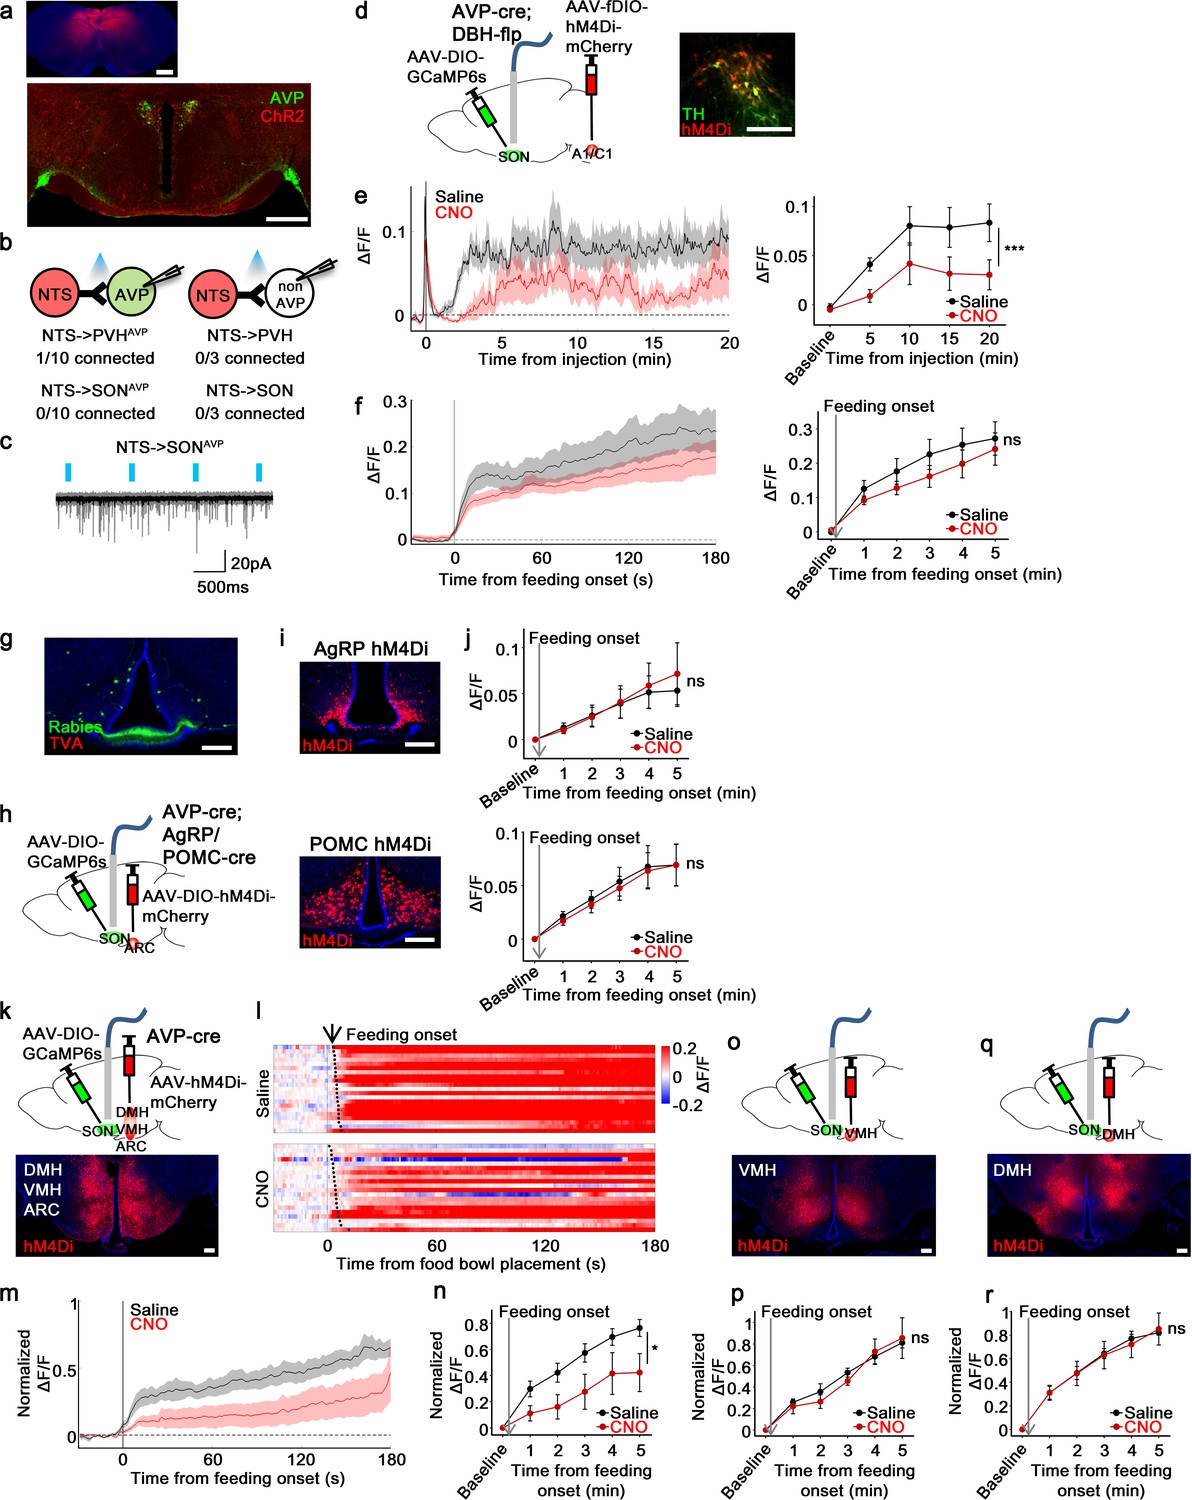
non-AgRP/POMC neurons in the ARC mediate food-related presystemic regulation of SONAVP neurons.
(a) Representative images showing expression of ChR2-mCherry in the NTS (top), and their efferent projections in the PVH and SON (bottom). (b) Number of PVHAVP and SONAVP neurons (left), and non-GFP PVH and SON neurons (right) receiving direct synaptic inputs from the NTS. (c) Representative traces showing light-evoked responses. Black trace is an average of all traces (gray) in consecutive trials. (d) Schematic of SONAVP photometry experiment with hM4Di-mediated inhibition of A1/C1 neurons. (e) Average SONAVP population activity to hypotension induced by vasodilating drug HDZ in saline and CNO trials (left). Data binned every 5 min (right). ***p<0.001; RM two-way ANOVA, p<0.001, n=9 mice. (f) Average SONAVP population activity in response to feeding onset in saline and CNO trials (left). Data binned across feeding periods (right). ns, p>0.05; RM two-way ANOVA, p>0.05, n=16 mice. (g) Representative image showing rabies-labeled neurons in the ARC that are monosynaptically connected to magnocellular SONAVP neurons. (h) Schematic of SONAVP photometry experiment with hM4Di-mediated inhibition of AgRP or POMC neurons. (i) Representative images showing hM4Di expression in AgRP (top) and POMC neurons (bottom). (j) Average SONAVP population activity binned across feeding periods in saline and CNO trials of AVP-IRES-Cre;Agrp-IRES-Cre (top) and AVP-IRES-Cre;Pomc-IRES-Cre (bottom) mice. ns, p>0.05; RM two-way ANOVA, p>0.05 (AgRP), p>0.05 (POMC), n=4 (AgRP), 8 (POMC). (k, o, q) Schematic of SONAVP photometry experiment with hM4Di-mediated non-specific inhibition of the ARC+VMH+DMH (k), VMH only (o), and DMH only (q). (l) Single-trial timecourses of SONAVP population activity in response to food bowl placement in saline and CNO trials of ARC+VMH+DMH group. Trials are sorted according to latency from food bowl placement to feeding onset (black ticks). n=5 mice. (m) Average SONAVP population activity in response to feeding onset in saline and CNO trials of ARC+VMH+DMH group. n=9 mice. (n, p, r) Average SONAVP population activity binned across feeding periods in saline and CNO trials of ARC+VMH+DMH (n), VMH only (p), and DMH only (r) groups. ns, p>0.05; *p<0.05; RM two-way ANOVA, p=0.033 (ARC+VMH+DMH), p>0.05 (VMH only), p>0.05 (DMH only), n=5 (ARC+VMH+DMH), 4 (VMH only), 7 (DMH only) mice. Scale bars, 500 µm (a, d), 200 µm (g, i, k, o, q). Values are means ± SEMs across mice. See also Figure 7—figure supplements 1–4. AVP, vasopressin; DMH, dorsomedial nuclei; SON, supraoptic nuclei; VMH, ventromedial.
-
Figure 7—source data 1
SONAVP neuron response to food bowl placement after inhibition of AgRP and POMC neurons, ARC, DMH, and VMH.
- https://cdn.elifesciences.org/articles/66609/elife-66609-fig7-data1-v2.xlsx
Figure 7—figure supplement 1
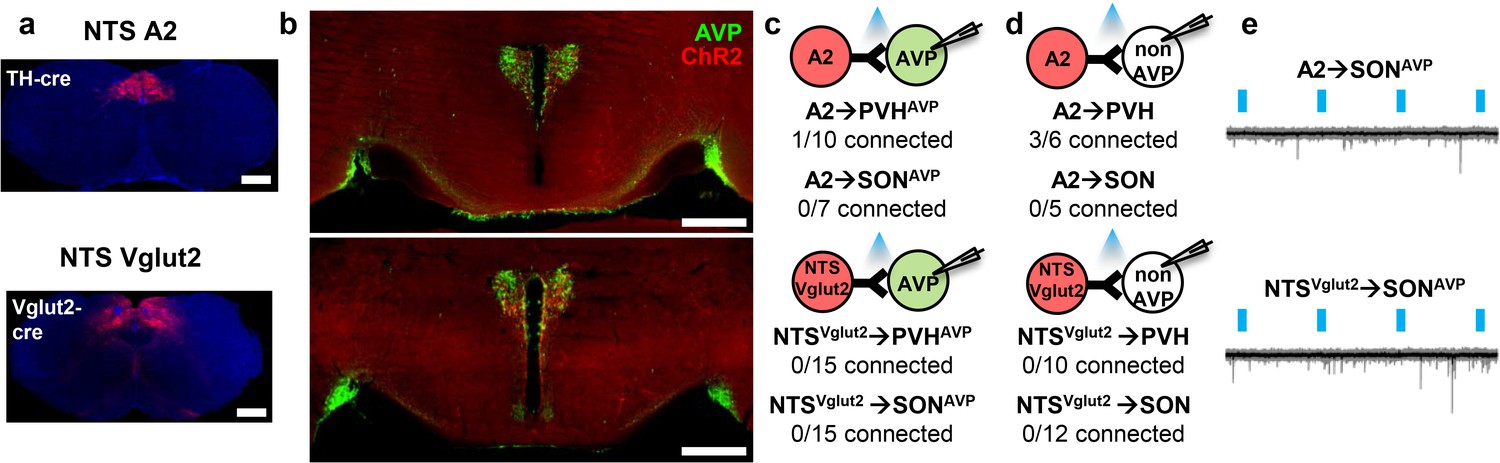
The NTS does not provide input to AVP neurons.
(a, b) Representative images showing expression of ChR2-mCherry in A2, NTSVglut2 neurons (a), and their efferent projections in the PVH and SON (b). (c, d) Number of PVHAVP and SONAVP neurons (c), and non-GFP PVH and SON neurons (d) receiving direct synaptic inputs from A2, NTSVglut2 neurons as identified by CRACM. Mice used include AVP-GFP;TH-IRES-Cre (A2) and AVP-GFP;Vglut2-IRES-Cre (NTSVglut2). (e) Representative traces showing light-evoked responses in A2 to SONAVP (top) and NTSVglut2 to SONAVP (bottom) CRACM. Black trace is an average of all traces (gray) in consecutive trials. AVP, vasopressin; CRACM, channelrhodopsin (ChR2)-assisted circuit mapping; PVH, paraventricular; SON, supraoptic nuclei.
Figure 7—figure supplement 2
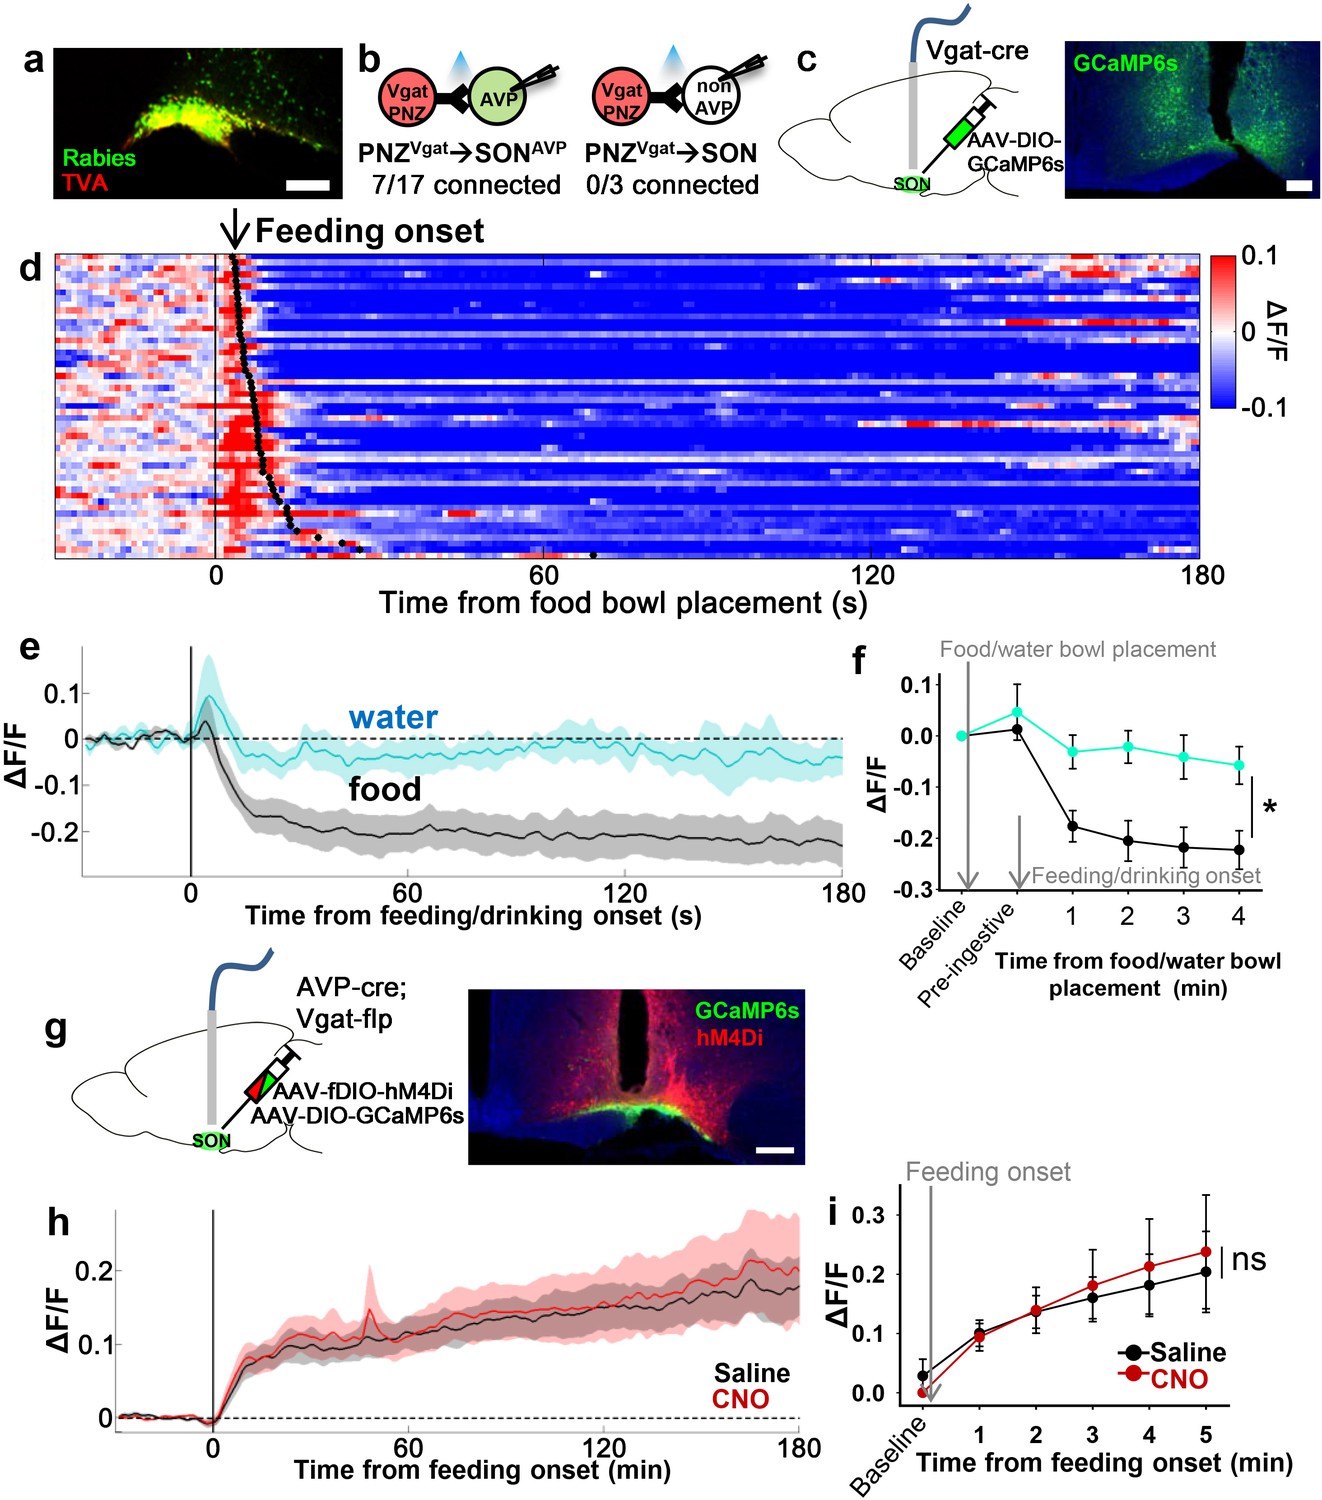
PNZGABA neurons show presystemic responses to feeding but are not required for food-related presystemic regulation of SONAVP neurons.
(a) Representative image showing rabies-labeled neurons in the PNZ that are monosynaptically connected to magnocellular SONAVP neurons. (b) Number of SONAVP neurons (left) and non-GFP SON neurons (right) receiving direct synaptic inputs from PNZGABA neurons as identified by CRACM in AVP-GFP;Vgat-IRES-Cre. (c) Schematic of PNZGABA photometry experiment. (d) Heatmap showing single-trial timecourses of PNZGABA population activity in response to food bowl placement. Trials are sorted according to latency from food bowl placement to feeding onset (black ticks). n=8 mice. (e) Average PNZGABA population activity in response to water/food bowl placement. n=3 mice. (f) Average PNZGABA population activity binned across drinking/feeding periods. *p<0.05; two-way ANOVA, p=0.03, n=3 mice. (g) Schematic of SONAVP photometry experiment with hM4Di-mediated inhibition of PNZGABA neurons. (h) Average of SONAVP population activity in response to feeding onset in saline and CNO trials. n=6 mice. (i) Average SONAVP population activity binned across feeding periods in saline and CNO trials. ns, p>0.05; two-way ANOVA, p>0.05, n=6 mice. Scale bar, 200 µm. Values are means ± SEMs. AVP, vasopressin; CRACM, channelrhodopsin (ChR2)-assisted circuit mapping; PNZ, perinuclear zone; SON, supraoptic nuclei.
-
Figure 7—figure supplement 2—source data 1
PNZGABA neurons show presystemic responses to feeding but are not required for food-related presystemic regulation of SONAVP neurons.
- https://cdn.elifesciences.org/articles/66609/elife-66609-fig7-figsupp2-data1-v2.xlsx
Figure 7—figure supplement 3
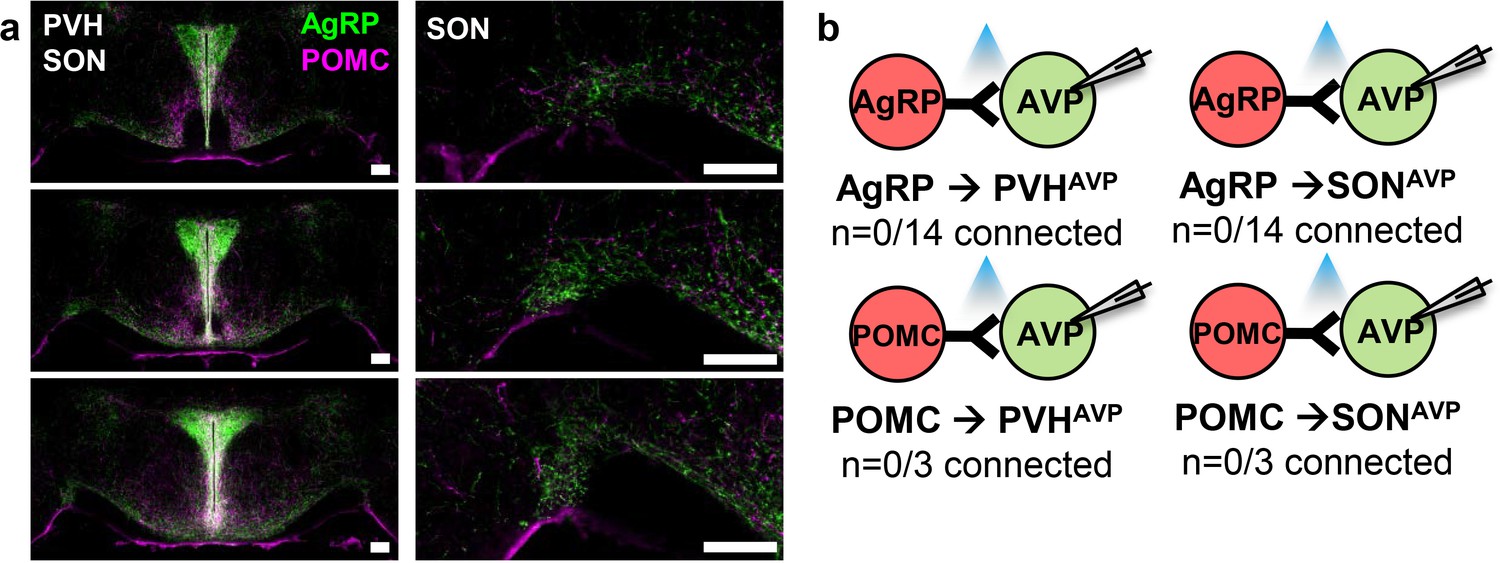
PVHAVP and SONAVP neurons do not receive direct synaptic inputs from AgRP and POMC neurons.
(a) Projections of AgRP and POMC neurons in the PVH and SON identified by immunostaining (left). Magnified view of the SON showing presence of AgRP and POMC fibers (right). (b) Lack of direct synaptic connections between AgRP neurons and PVHAVP and SONAVP neurons as identified by CRACM in AVP-GFP;Agrp-IRES-Cre. Scale bar, 200 µm. AVP, vasopressin; CRACM, channelrhodopsin (ChR2)-assisted circuit mapping; PVH, paraventricular; SON, supraoptic nuclei.
Figure 7—figure supplement 4
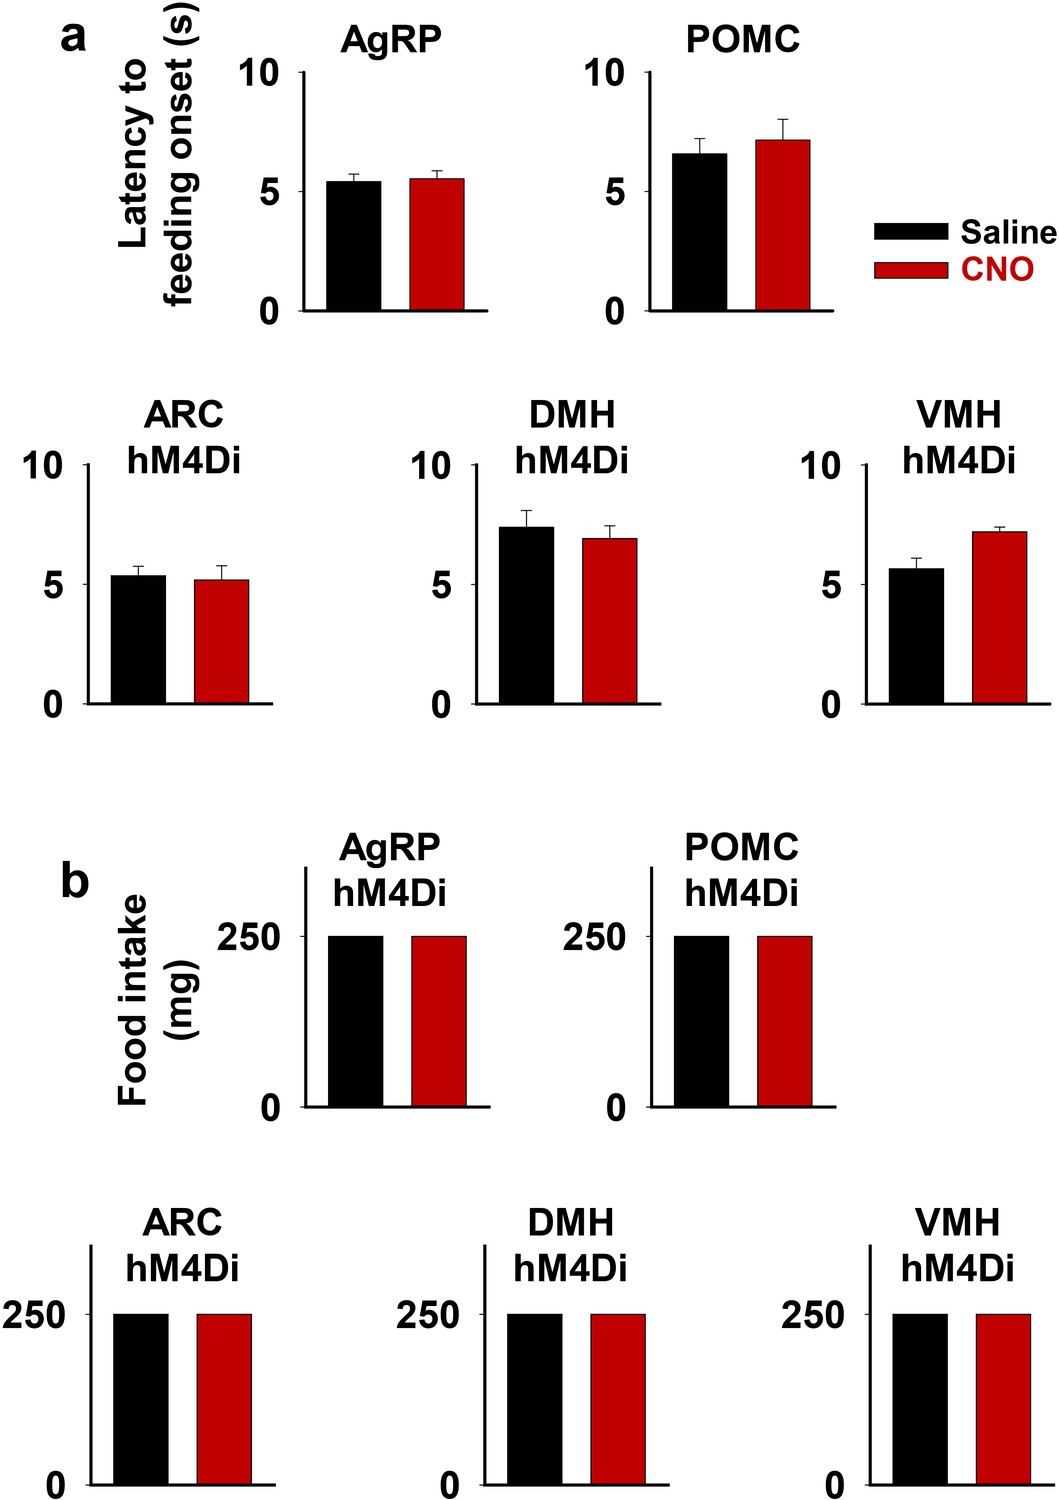
Inhibition of the ARC, DMH, or VMH does not affect short-term feeding behavior.
Latency to feeding onset (a) and amount of food intake during the first 5 min of experiment (b) in saline and CNO trials of fiber photometry experiments in Figure 7. One 250 mg pellet was provided in all trials. DMH, dorsomedial nuclei; VMH, ventromedial.
-
Figure 7—figure supplement 4—source data 1
Inhibition of the ARC, DMH, or VMH does not affect short-term feeding behavior.
- https://cdn.elifesciences.org/articles/66609/elife-66609-fig7-figsupp4-data1-v2.xlsx
Figure 8
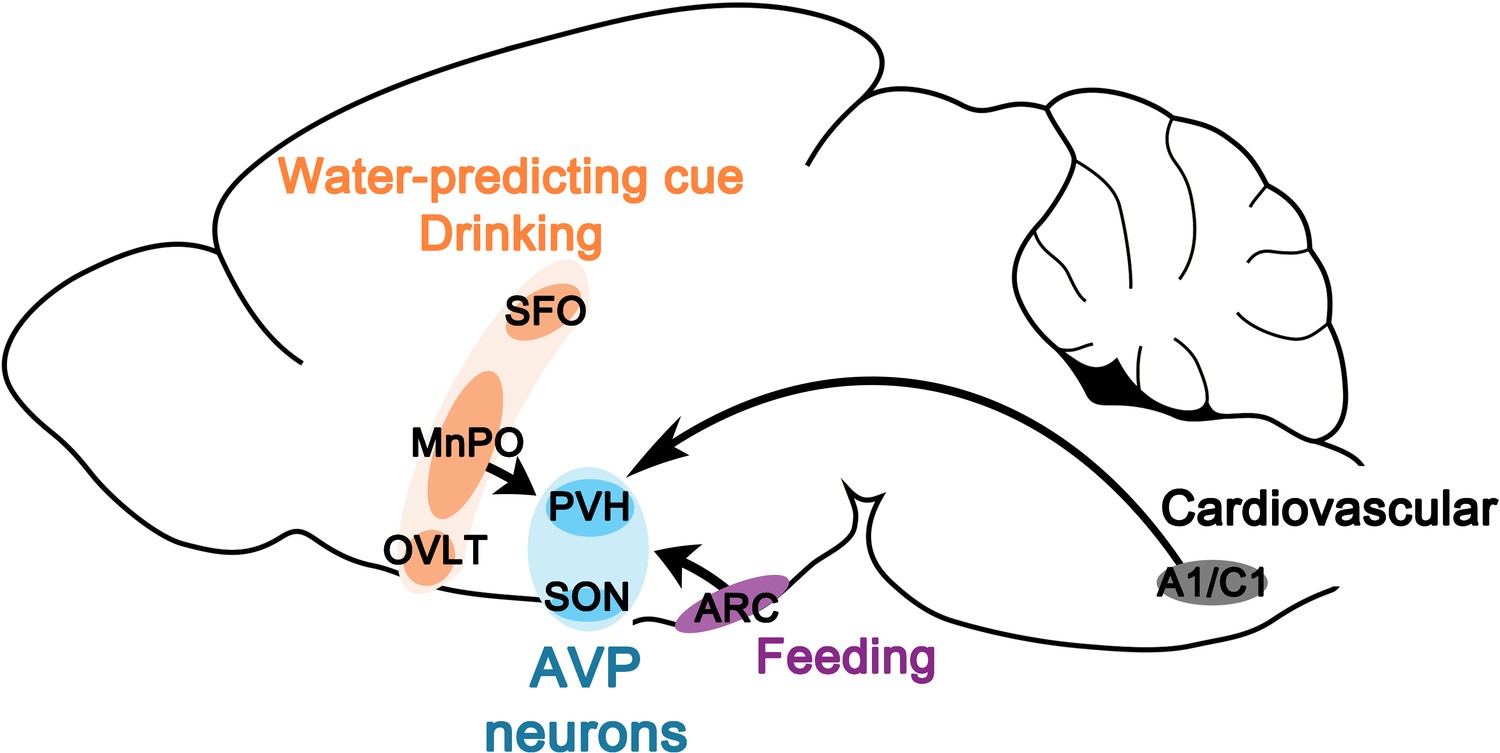
Neural circuits for presystemic regulation of AVP neurons.
AVP, vasopressin; MnPO, median preoptic nucleus; OVLT, organum vasculosum lamina terminalis; PVH, paraventricular; SFO, subfornical organ SON, supraoptic nuclei.
Tables
Table 1
Summary of the result.
| Afferents tested | Connection toAVP neurons(validation method)* | Presystemic response(pre-/post-ingestive) | Effect of inhibition on AVP neuron activity | |
|---|---|---|---|---|
| Water | Food | |||
| SON-projecting SFOVglut2, MnPO/OVLTVglut2 | ✓(Rabies mapping, CRACM, and projection mapping) | ↓ / ↓↓ | ↔ / ↔ | ▼ Water-related presystemic response(pre- and post-ingestive) |
| SON-projecting MnPO/OVLTVgat | ✓(Rabies mapping, CRACM, and projection mapping) | ↑ / ↔ | ↑ / ↔ | ▼ Water-related presystemic response(pre-ingestive only) |
| A1/C1 | ✓(CRACM and projection mapping) | ? | ? | ▼ Hypotension-induced activation |
| PNZVgat | ✓(Rabies mapping and CRACM) | ↑ / ↔ | ↑ / ↓↓ | No effect |
| AgRPa | X(Rabies mapping, CRACM, and projection mapping) | ↔ | ↓ / ↓↓ | No effect |
| POMCa | X(Rabies mapping, CRACM, and projection mapping) | ? | ↑ / ↑↑ | No effect |
| ARC | ✓(Rabies mapping) | ? | ? | ▼ Feeding-related presystemic response |
-
*
✓, connected; X, not connected; ↑, increase (↑<↑↑); ↓, decrease (↓<↓↓); ↔, no change;?, not tested; ▼, significantly attenuated; a, Betley et al., 2015; Chen et al., 2015; Mandelblat-Cerf et al., 2017.
Key resources table
| Reagent type (species) or resource | Designation | Source or reference | Identifiers | Additional information |
|---|---|---|---|---|
| Strain, strain background (Mus musculus) | Avp-IRES-Cre | PMID:24634830 | ||
| Strain, strain background (M. musculus) | Slc17a6-IRES-cre | The Jackson Laboratory | RRID:IMSR_JAX:016963 | PMID:21745644 |
| Strain, strain background (M. musculus) | Slc32a1-IRES-Cre | The Jackson Laboratory | RRID:IMSR_JAX:016962 | PMID:21745644 |
| Strain, strain background (M. musculus) | Nos1-IRES-cre | The Jackson Laboratory | RRID:IMSR_JAX:017526 | PMID:22522563 |
| Strain, strain background (M. musculus) | Slc17a6-IRES-Flp | The Jackson Laboratory | RRID:IMSR_JAX:030212 | |
| Strain, strain background (M. musculus) | Slc32a1-IRES-Flp | The Jackson Laboratory | RRID:IMSR_JAX:031331 | |
| Strain, strain background (M. musculus) | Th-Cre | The Jackson Laboratory | RRID:IMSR_JAX:008601 | PMID:16033881 |
| Strain, strain background (M. musculus) | Dbh-Flp | MMRRC | RRID:MMRRC_041575 | |
| Strain, strain background (M. musculus) | Avp-GFP | MMRRC | RRID:MMRRC_015858-UCD | |
| Strain, strain background (M. musculus) | Agrp-IRES-Cre | The Jackson Laboratory | RRID:IMSR_JAX:012899 | |
| Strain, strain background (M. musculus) | Pomc-IRES-Cre | PMID:27869800 | ||
| Genetic reagent (Adeno-associated virus) | AAV8-FLEX-TVA-mCherry | UNC Vector Core | RRID:Addgene_38044 | |
| Genetic reagent (Adeno-associated virus) | AAV1-CAG-FLEX-RG | UNC Vector Core | RRID:Addgene_48333 | |
| Genetic reagent (Adeno-associated virus) | SADΔG–EGFP (EnvA) rabies | Salk Gene Transfer Targeting and Therapeutics Core | RRID:Addgene_32635 | |
| Genetic reagent (Adeno-associated virus) | AAV9-EF1α-DIO-ChR2(H134R)-mCherry | Penn Vector Core | RRID:Addgene_20297 | |
| Genetic reagent (Adeno-associated virus) | AAV8.2-hEF1a-synaptophysin-EYFP | MGH Gene Delivery Technology Core | RN9 | |
| Genetic reagent (Adeno-associated virus) | AAV9-CAG-ChR2(H134R)-mCherry | Penn Vector Core | RRID:Addgene_100054 | |
| Genetic reagent (Adeno-associated virus) | HSV-hEF1a-LS1L-GCaMP6s | MGH Gene Delivery Technology Core | RN507 | |
| Genetic reagent (Adeno-associated virus) | AAV1-Syn-FLEX-GCaMP6s | Penn Vector Core | RRID:Addgene_100845 | |
| Genetic reagent (Adeno-associated virus) | AAV1-Ef1a-DIO-EYFP | UNC Vector Core | RRID:Addgene_27056 | |
| Genetic reagent (Adeno-associated virus) | AAV8-hSyn-hM4Di-mCherry | UNC Vector Core | RRID:Addgene_44362 | |
| Genetic reagent (Adeno-associated virus) | AAV8-nEF-fDIO-hM4Di-mCherry | This paper | N/A | |
| Antibody | Anti-mCherry (rat monoclonal) | Life Technologies | M11217 | IF (1:1000) |
| Antibody | Anti-dsRed (rabbit polyclonal) | Clontech | 632,496 | IF (1:1000) |
| Antibody | Anti-GFP (chicken polyclonal) | Life Technologies | A10262 | IF (1:1000) |
| Antibody | Anti-vasopressin (rabbit polyclonal) | Sigma-Aldrich | AB1565 | IF (1:1000) |
| Antibody | Anti-TH (rabbit polyclonal) | Millipore | AB152 | IF (1:1000) |
| Antibody | Anti-POMC precursor (rabbit polyclonal) | Phoenix Pharmaceuticals | H-029–30 | IF (1:1000) |
| Antibody | Anti-AgRP (goat polyclonal) | Neuromics | GT15023 | IF (1:1000) |
| Software, algorithm | SigmaPlot | Systat Software Inc | RRID:SCR_003210 | |
| Software, algorithm | MATLAB | MathWorks | RRID:SCR_001622 |
Additional files
Download links
A two-part list of links to download the article, or parts of the article, in various formats.
Downloads (link to download the article as PDF)
Open citations (links to open the citations from this article in various online reference manager services)
Cite this article (links to download the citations from this article in formats compatible with various reference manager tools)
Neural basis for regulation of vasopressin secretion by anticipated disturbances in osmolality
eLife 10:e66609.
https://doi.org/10.7554/eLife.66609


