Intact synapse structure and function after combined knockout of PTPδ, PTPσ, and LAR
- Department of Neurobiology, Harvard Medical School, United States
Figures
Figure 1 with 3 supplements
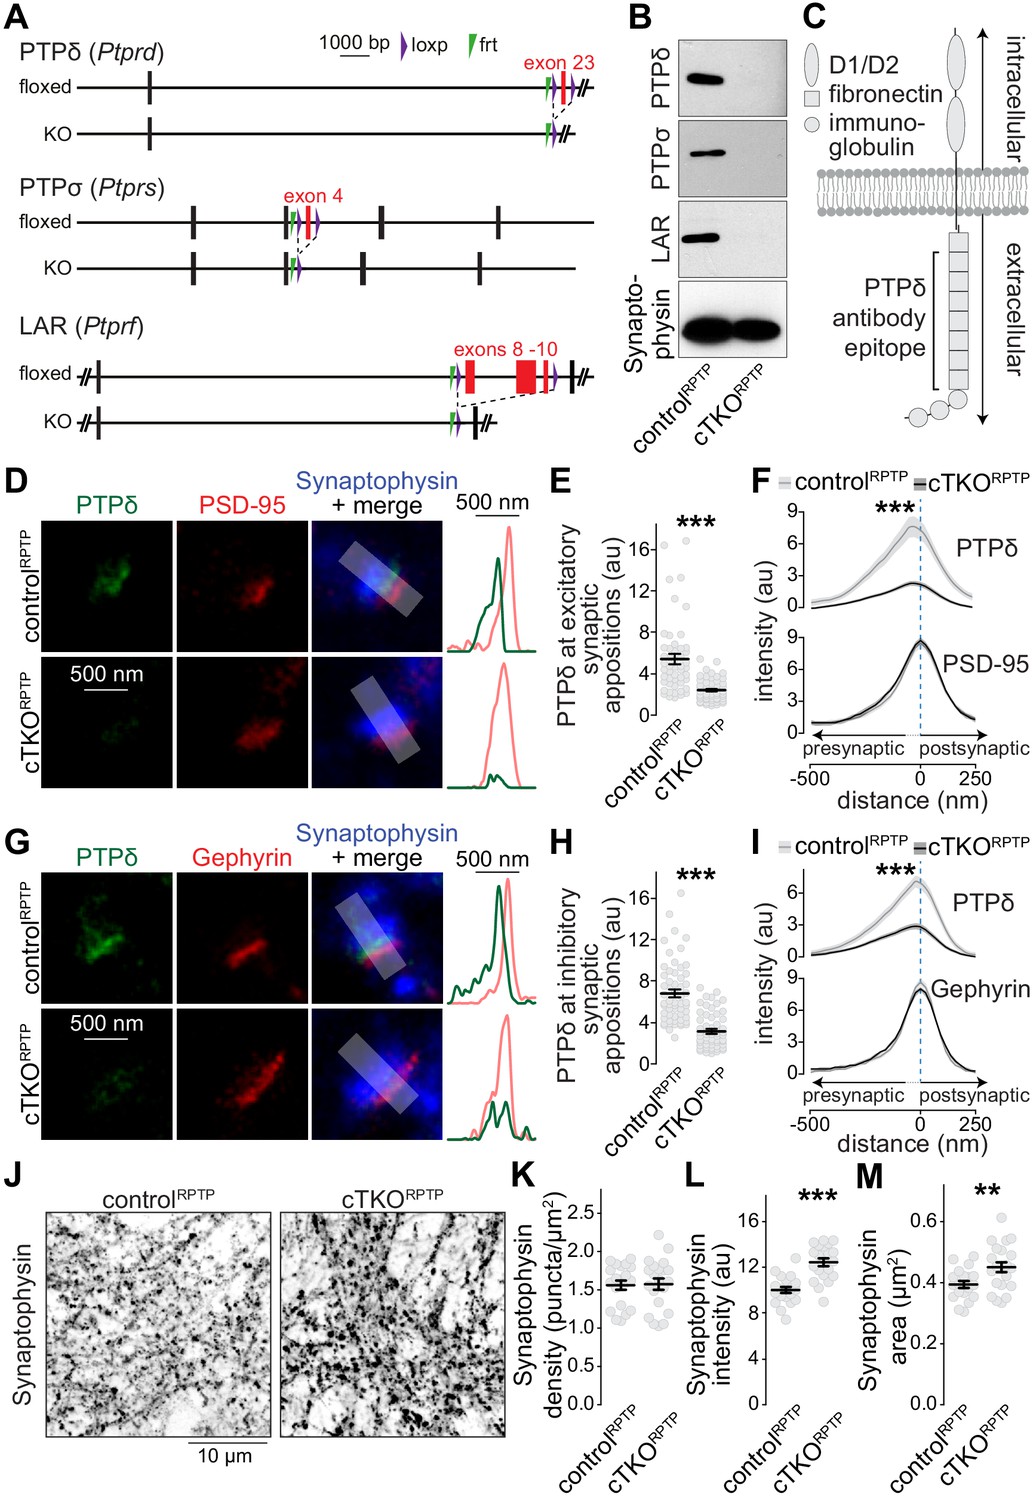
Nanoscale localization of PTPδ and assessment of synapse density in LAR-RPTP conditional triple-knockout neurons.
(A) Diagram for simultaneous conditional knockout of PTPδ, PTPσ and LAR. (B) Example western blot of cultured neurons from PTPδ, PTPσ, and LAR triple floxed mice expressing Cre recombinase (to generate cTKORPTP neurons) or truncated Cre (to generate controlRPTP neurons). The bands detected in the cultured neurons correspond to the lower bands detected in brain homogenate shown in Figure 1—figure supplement 1C. (C) Diagram showing the general structure of LAR-RPTPs and the antibody recognition site for PTPδ (antibodies were generated using a peptide containing fibronectin domains 2, 3 and 8 Shishikura et al., 2016). (D–F) STED images (D), quantification of the peak intensity of PTPδ (E, STED) and average intensity profiles for PTPδ (STED) and PSD-95 (F, STED) at excitatory synapses. Side-view synapses were identified by the presence of bar-like PSD-95 signals (STED) at the edge of the vesicle cloud marked by Synaptophysin (confocal). Intensity profiles of shaded areas in the overlap images were used to determine the peak intensity of the protein of interest, and are shown on the right of the corresponding image. N (controlRPTP) = 50 synapses/3 cultures, N (cTKORPTP) = 54/3. (G–I) Same as D-F, but for inhibitory synapses identified by Gephyrin. N (controlRPTP) = 58/3 cultures, N (cTKORPTP) = 59/3. (J–M) Confocal images of cultured neurons stained with anti-Synaptophysin antibodies (J) and quantification of Synaptophysin puncta density (K), intensity (L) and size (M) detected using automatic two-dimensional segmentation. N (controlRPTP) = 20 images/3 independent cultures; N (cTKORPTP) = 21/3. The Synaptophysin confocal data are from the experiments shown in D-I. Data are plotted as mean ± SEM and were analyzed using two-way ANOVA tests (F, I, genotype *** for PTPδ), t-tests (E, L, M) or Mann-Whitney rank sum tests (H, K). **p<0.01, ***p<0.001.
Figure 1—figure supplement 1
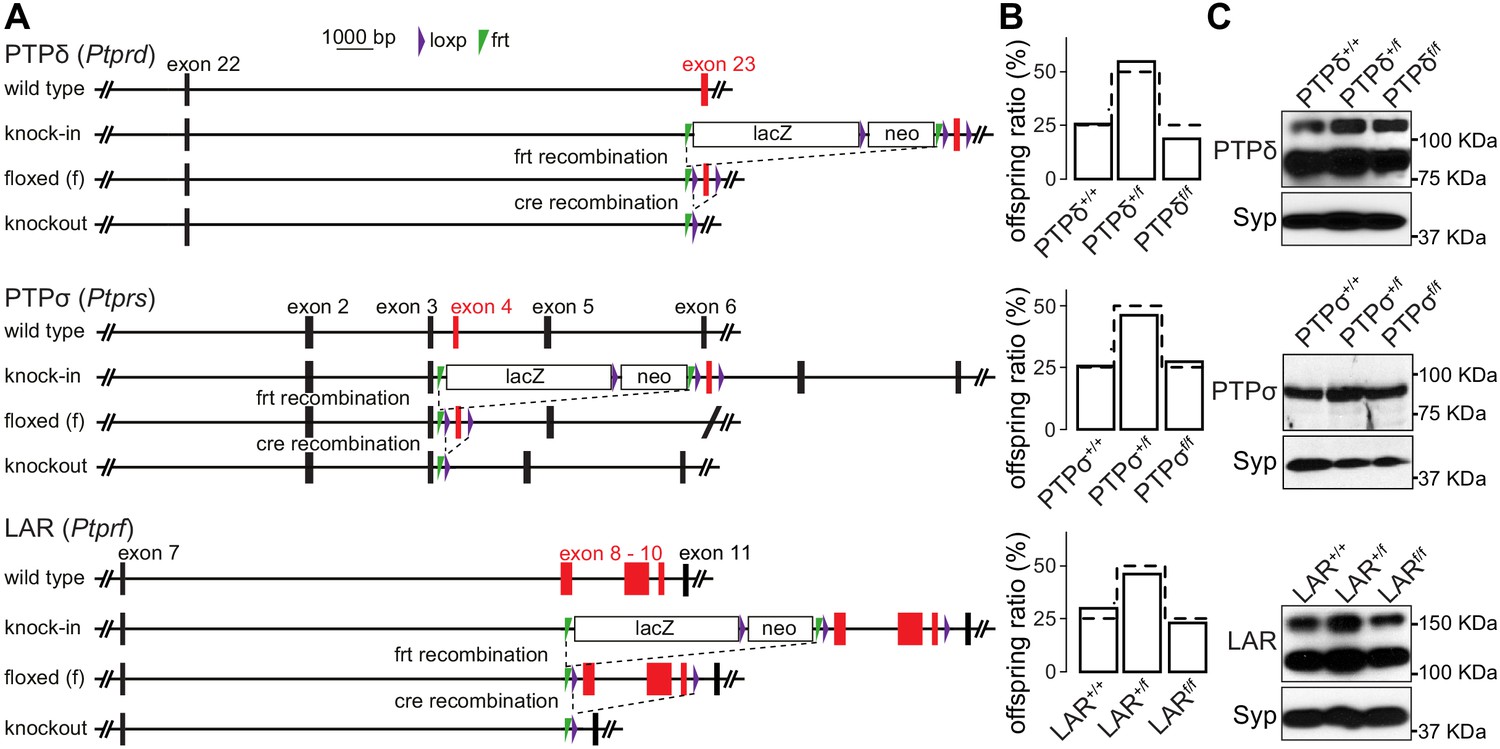
LAR-RPTP conditional knockout mice.
(A) Gene targeting strategies for LAR-RPTP conditional knockout mice. PTPδ and PTPσ alleles contain loxP sites flanking exons 23 and 4, respectively. They were imported for cryo-recovery at the ‘knock-in’ stage from the Welcome Trust Sanger Institute (Ptprdtm2a(KOMP)Wtsi) and the Canadian Mouse Mutant Repository at the Hospital for Sick Children (C57BL/6N-Ptprstm1a(KOMP)Mbp/Tcp) and are identical to the alleles described before (Bunin et al., 2015; Farhy-Tselnicker et al., 2017; Sclip and Südhof, 2020). The LAR allele contains loxp sites flanking exons 8, 9, and 10 and was obtained at the embryonic stem cell stage from the Helmholtz Zentrum München (Ptprftm1a(EUCOMM)Wtsi). Each of the three lines was crossed to flp-transgenic mice (Dymecki, 1996) to generate individual ‘floxed’ conditional knockout alleles. (B) Survival analyses were performed on the offspring of heterozygote matings for each individual floxed allele. Offspring ratios were assessed at >P14. Bars show the percentage of offspring for each genotype, and dotted lines represent the expected Mendelian ratio. N (PTPδ)=28 mice/4 litters; N (PTPσ)=31/4; N (LAR) = 22/3. Chi-square tests were used to compare expected Mendelian ratios with obtained offspring ratios, and no statistical difference was detected. (C) Western blots of whole brain homogenates of wild-type, heterozygous and homozygous littermate mice for the PTPδ, PTPσ, and LAR floxed alleles. For PTPδ, ~80 kDa and ~120 kDa bands were detected, matching the cleaved extracellular domains of the two main isoforms expressed in the brain containing three immunoglobulin and either four or eight fibronectin domains (Shishikura et al., 2016). For PTPσ, a single band at ~90 KDa was detected, matching the size of the catalytically cleaved extracellular domain of the short isoform containing four fibronectin domains and three immunoglobulin domains (Aicher et al., 1997). For LAR, ~110 kDA and ~150 KDa bands were detected as previously described in the hippocampus (Yang et al., 2003). The bigger band matches the cleaved extracellular domains of the longest isoform containing three immunoglobulin and eight fibronectin domains (Aicher et al., 1997), while the smaller band likely corresponds to a shorter isoform. In cultured hippocampal neurons, only the higher intensity bands at the lower molecular weight were detected, and these bands were effectively removed after cre-recombination of the floxed alleles (Figure 1B).
Figure 1—figure supplement 2
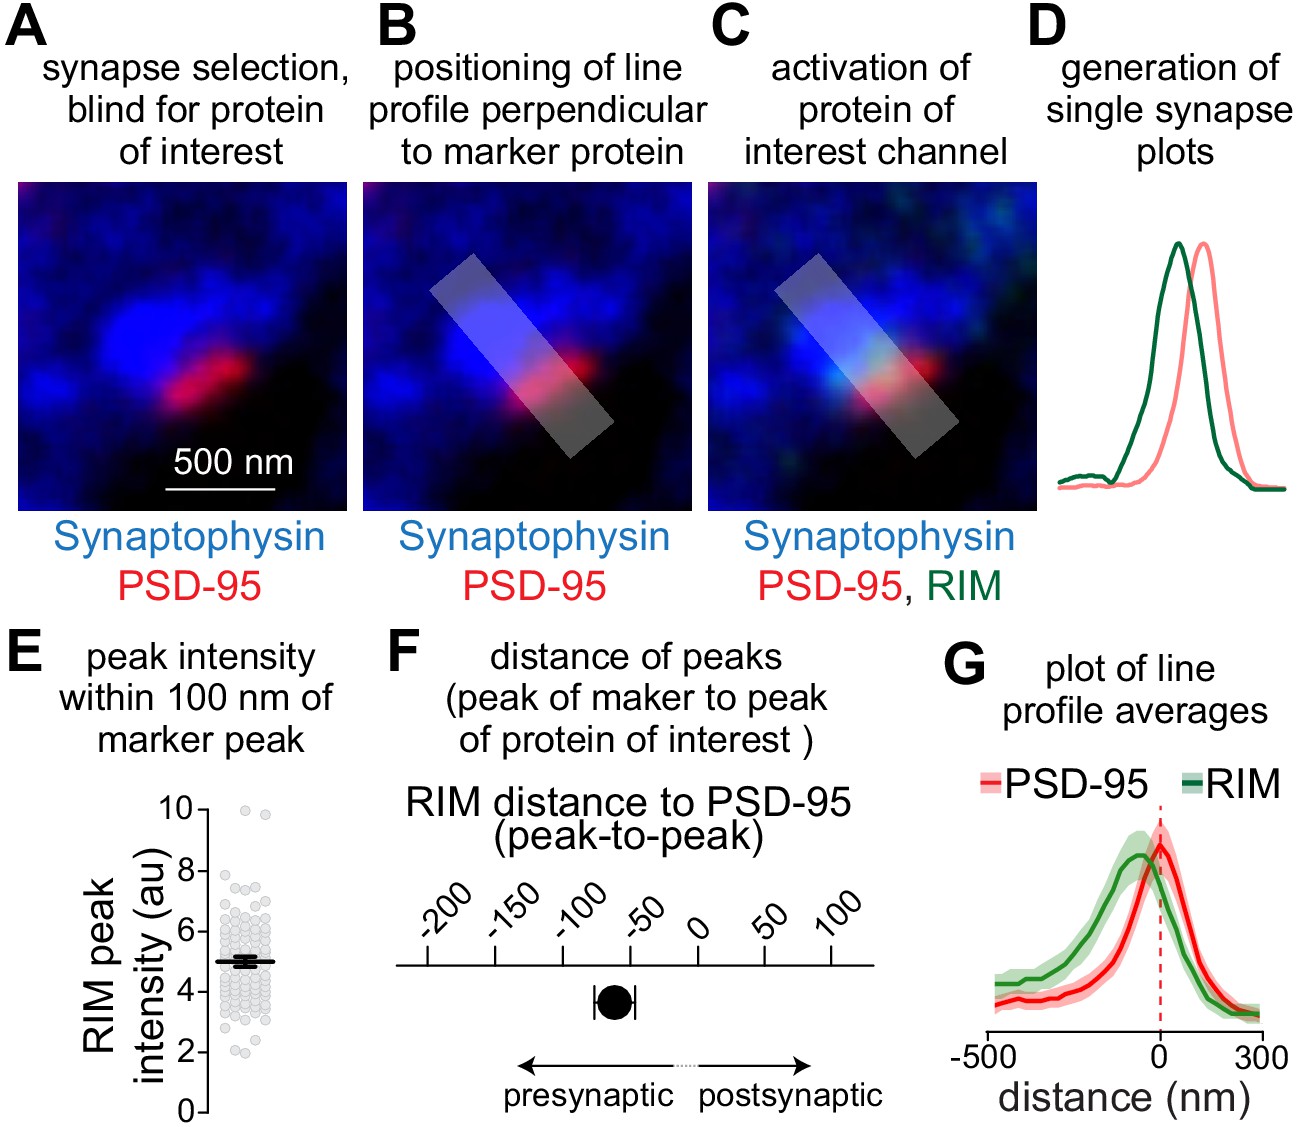
STED analysis workflow.
(A–D) Workflow for STED analyses, showing an example of a side-view synapse immunostained for PSD-95 and RIM (both in STED mode) and Synaptophysin (in confocal mode). Side-view synapses are included when a PSD-95 bar is present at the edge of a Synaptophysin-labeled vesicle cloud (A). The synapse selection process is conducted by an experimenter blind for the protein of interest (RIM in the example shown). Next, a line profile is generated perpendicular to PSD-95 (B). The area for generating the line profile is shaded. The protein of interest channel is then activated (C), and the line profiles are generated (D). (E–G) Outline of the quantitative analyses across synapses. The peak intensity of the protein of interest within 100 nm of PSD-95 towards the presynaptic side (Wong et al., 2018) is used to estimate protein levels in the synaptic cleft or at the active zone (E). The distance between RIM and PSD-95 peaks is used to estimate protein localization (F). The average of the line profiles of all synapses within an experiment is used to illustrate protein distribution (G). Data to illustrate STED workflow are from wild-type hippocampal cultures, N = 42 synapses/2 independent cultures. Data are plotted as mean ± SEM.
Figure 1—figure supplement 3
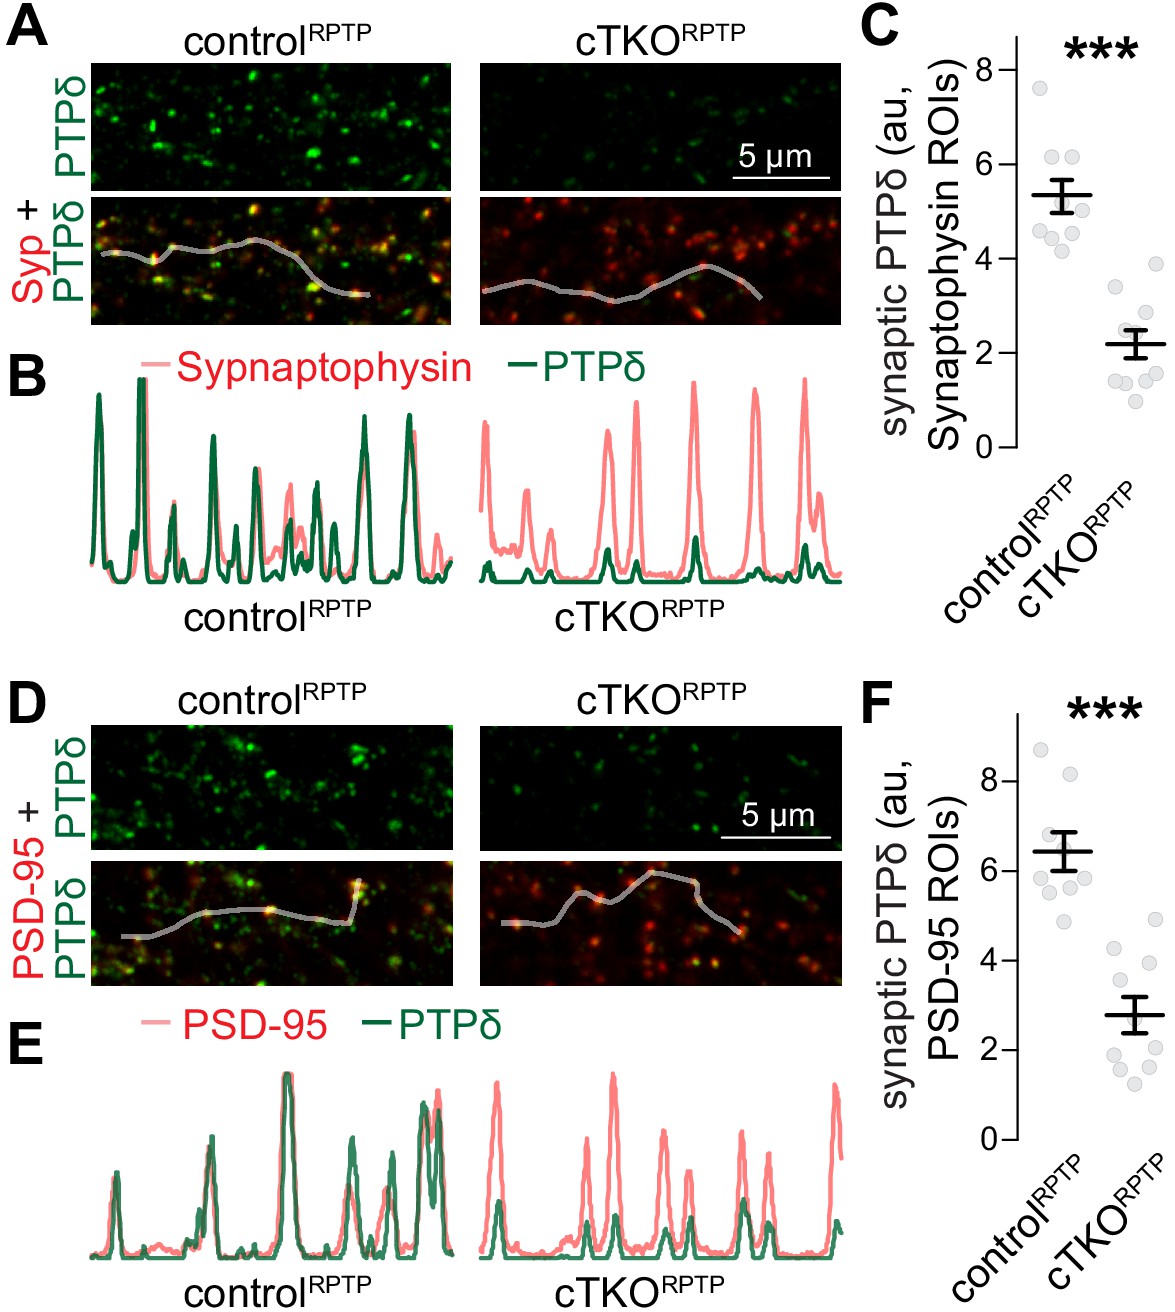
Confocal analyses of PTPδ.
(A–C) Sample confocal images (A), sample intensity profiles (B), and quantification (C) of PTPδ at synapses identified by Synaptophysin (Syp) staining. Intensity profiles of PTPδ and Synaptophysin (C) along the shaded lines highlighted in (A) show good correlation between the signals. In (C), PTPδ fluorescence intensities were quantified in Synaptophysin regions of interest (ROIs). The confocal images analyzed here were acquired in the same imaging session and for the same image frames as the STED analyses shown in Figure 1. Confocal images were always acquired prior to STED acquisition, N (controlRPTP) = 9 images/3 independent cultures; N (cTKORPTP) = 10/3. (D–F) Same as (A–C), but for PSD-95 ROIs. To avoid potential confounds of mildly increased Synaptophysin areas (Figure 1M), we repeated the confocal analyses generating PSD-95 instead of Synaptophysin ROIs. In diffraction-limited microscopy, the resolution is insufficient to distinguish pre- and postsynaptic markers, and either marker can be used to generate synapse ROIs. N as in (C). Data are plotted as mean ± SEM and analyzed using Mann–Whitney rank sum tests, ***p<0.001.
Figure 2 with 1 supplement
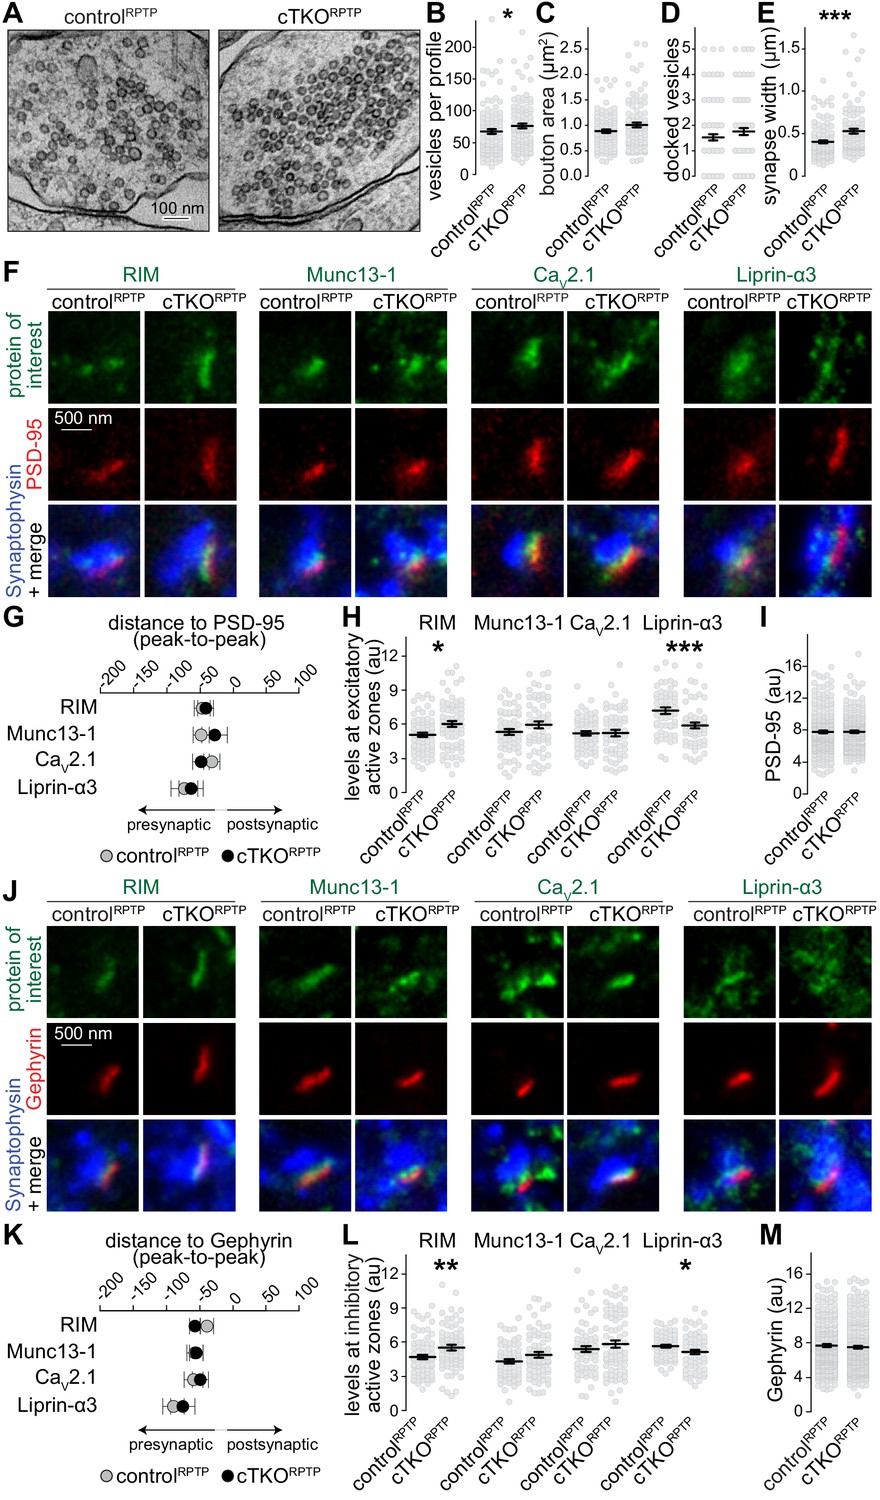
Synapse ultrastructure and active zone composition after LAR-RPTP triple knockout.
(A–E) Electron micrographs (A) and quantification of the total number of vesicles per profile (B), bouton area (C), number of docked vesicles (D), and synapse width (E) assessed in single sections of high-pressure frozen neurons. N (controlRPTP) = 106 synapses/2 independent cultures, N (cTKORPTP) = 101/2. (F–H) STED example images of excitatory side-view synapses (F) and quantification of the distance to PSD-95 (G) and of peak intensities (H) of RIM, Munc13-1, CaV2.1, and Liprin-α3. RIM: N (controlRPTP) = 68 synapses/3 independent cultures, N (cTKORPTP) = 68/3; Munc13-1: N (controlRPTP) = 57/3, N (cTKORPTP) = 60/3; CaV2.1: N (controlRPTP) = 64/3, N (cTKORPTP) = 58/3; Liprin-α3: N (controlRPTP) = 56/3, N (cTKORPTP) = 53/3. (I) Quantification of the peak intensity of PSD-95. N (controlRPTP) = 295/3; N (cTKORPTP) = 293/3. (J–L) Same as (F–H), but for Gephyrin-containing inhibitory synapses. RIM: N (controlRPTP) = 75/3 cultures, N (cTKORPTP) = 79/3; Munc13-1: N (controlRPTP) = 65/3, N (cTKORPTP) = 72/3; CaV2.1: N (controlRPTP) = 64/3, N (cTKORPTP) = 71/3; Liprin-α3: N (controlRPTP) = 65/3, N (cTKORPTP) = 61/3. (M) Quantification of the peak intensity of Gephyrin. N (controlRPTP) = 327/3; N (cTKORPTP) = 342/3. Data are plotted as mean ± SEM and were analyzed using Mann–Whitney rank sum tests. *p<0.05, **p<0.01, ***p<0.001.
Figure 2—figure supplement 1
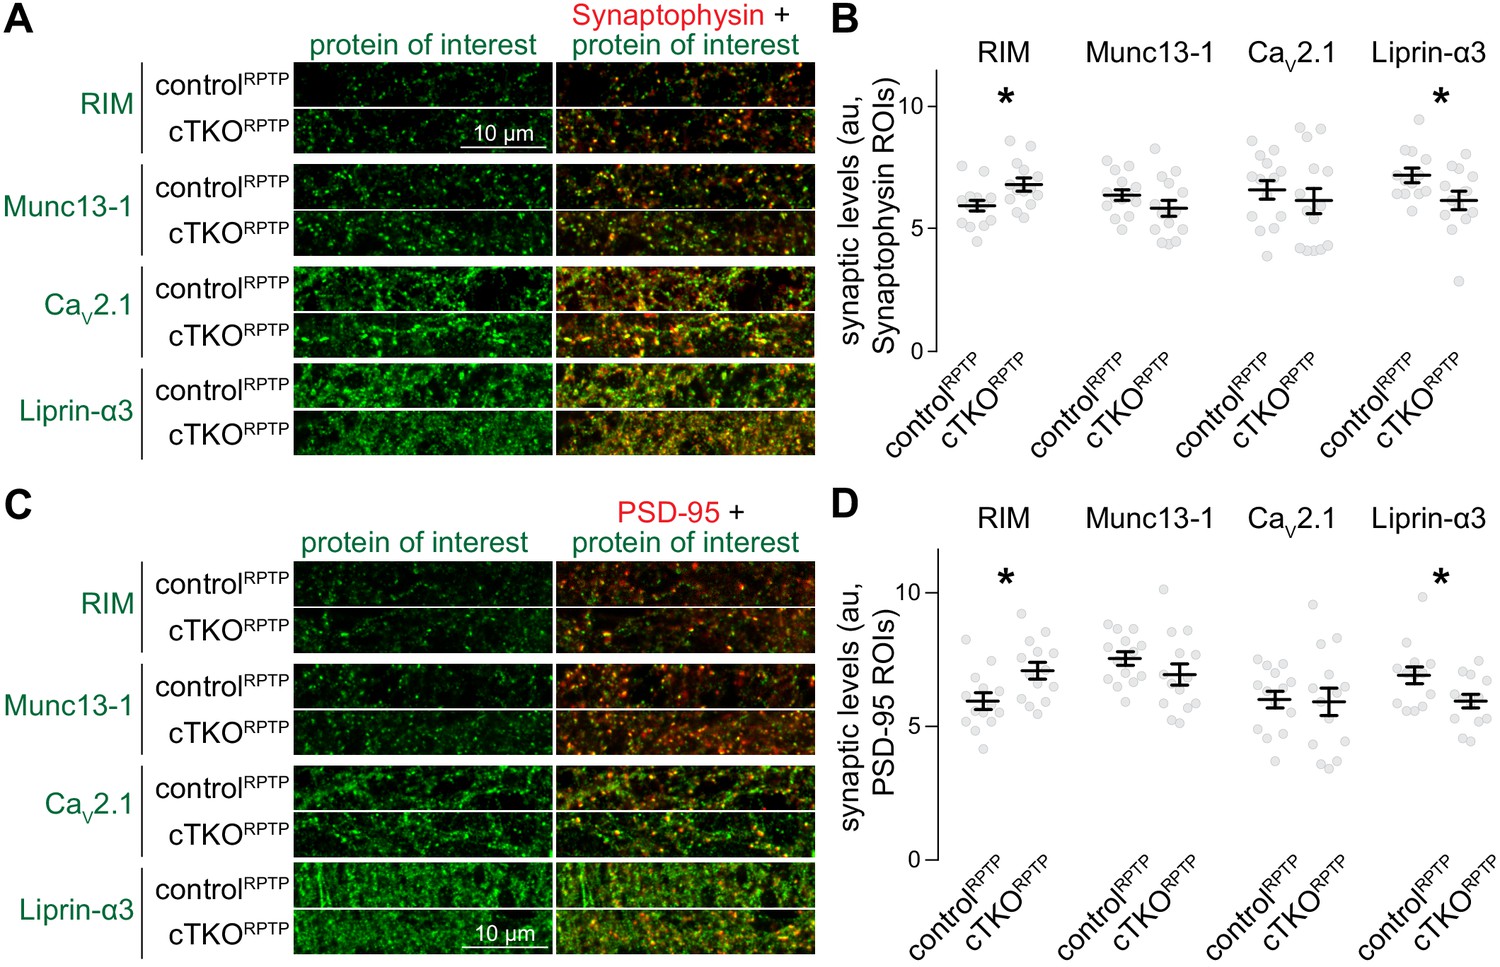
Confocal analyses of synaptic protein levels after ablation of LAR-RPTPs.
(A, B) Example confocal images (A) and quantification (B) of the intensities of RIM, Munc13-1, CaV2.1, and Liprin-α3 within Synaptophysin ROIs. The confocal images analyzed here were acquired in the same imaging session and for the same image frames as the STED analyses shown in Figure 2. Confocal images were always acquired prior to STED acquisition, RIM: N (controlRPTP) = 14 images/3 independent cultures, N (cTKORPTP) = 14/3; Munc13-1: N (controlRPTP) = 14/3, N (cTKORPTP) = 14/3; CaV2.1: N (controlRPTP) = 14/3, N (cTKORPTP) = 14/3; Liprin-α3: N (controlRPTP) = 13/3, N (cTKORPTP) = 13/3. (C, D) Same as (A) and (B), but for PSD-95 ROIs. To avoid potential confounds of mildly increased Synaptophysin areas (Figure 1M), we repeated the confocal analyses generating PSD-95 instead of Synaptophysin ROIs. In diffraction-limited microscopy, the resolution is insufficient to distinguish pre- and postsynaptic markers, and either marker can be used to generate synapse ROIs. N as in (B). Data are plotted as mean ± SEM and were analyzed using t-tests, except for CaV2.1 in (B) for which a Mann–Whitney rank sum test was used. *p<0.05.
Figure 3
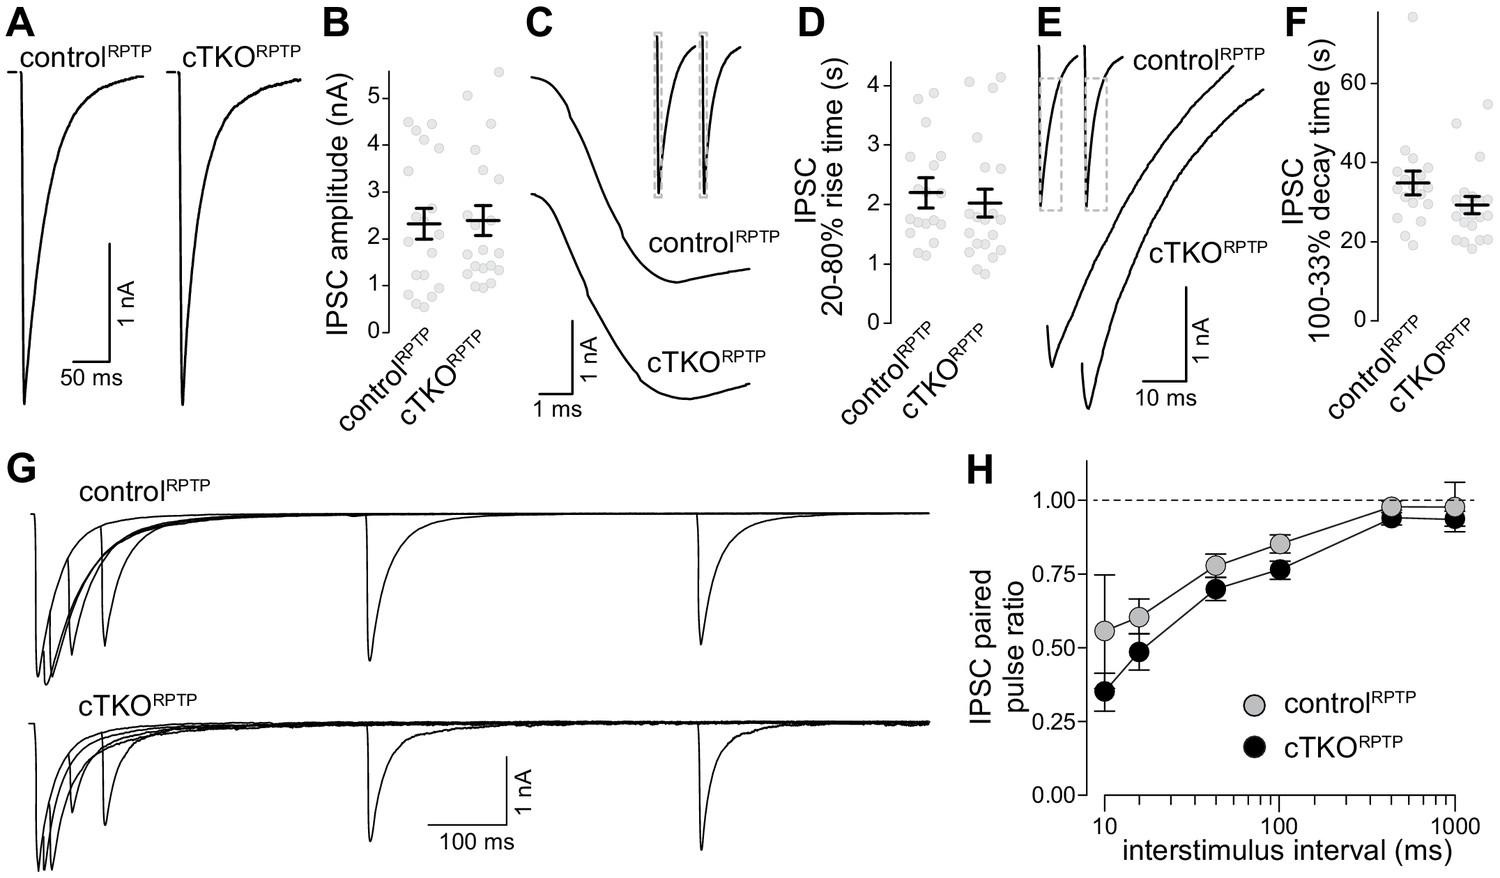
Inhibitory synaptic transmission in LAR-RPTP triple-knockout neurons.
(A, B) Example traces (A) and average amplitudes (B) of single action potential evoked IPSCs. N (controlRPTP) = 19 cells/3 independent cultures, N (cTKORPTP) = 20/3. (C, D) Example zoomed-in traces of the IPSC rise (C) and quantification of 20–80% rise times (D) of evoked IPSCs, N as in (A, B). (E, F) Example zoomed-in traces of the IPSC decay (E) and quantification of 100–33% decay times (F) of evoked IPSCs. N as in (A, B). (G, H) Example traces (G) and average IPSC paired pulse ratios (H) at various interstimulus intervals. N (controlRPTP) = 18/3, N (cTKORPTP) = 19/3. Data are plotted as mean ± SEM and were analyzed using Mann–Whitney rank sum tests (B, D, F) or a two-way ANOVA (H), no significant differences were detected.
Tables
Key resources table
| Reagent type (species) or resource | Designation | Source or reference | Identifiers | Additional information |
|---|---|---|---|---|
| Genetic reagent (mouse) | Ptprdtm2a(KOMP)Wtsi | Acquired as frozen embryos from the Welcome Trust Sanger Institute, same allele as in Farhy-Tselnicker et al., 2017; Sclip and Südhof, 2020 | Clone EPD0581_9_D04, MGI:4458607, RRID: IMSR_EM:11805 | |
| Genetic reagent (mouse) | C57BL/6N-Ptprstm1a(KOMP)Mbp/Tcp | Acquired as frozen sperm from the Canadian Mouse Mutant Repository at the Hospital for Sick Children, same allele as in Bunin et al., 2015; Sclip and Südhof, 2020 | Clone DEPD00535_1_D11; MGI:4840831, RRID:IMSR_CMMR:ABCA | |
| Genetic reagent (mouse) | Ptprftm1a(EUCOMM)Wtsi | Acquired as embryonic stem cells from the Helmholtz Zentrum München | Clone EPD0697_1_D03; MGI:4887720, JAX: 637737 | |
| Recombinant DNA reagent | pFSW-CRE-EGFP | Liu et al., 2014 | pHN131014 | |
| Recombinant DNA reagent | pFSW-deltaCRE-EGFP | Liu et al., 2014 | pHN131015 | |
| Antibody | Goat anti-PTPσ | Thermo Fisher Scientific | RRID: AB_2607944, A114 | WB (1:200) |
| Antibody | Rat anti-PTPδ | Gift of Dr. F. Nakamura Shishikura et al., 2016 | A229 | WB and ICC (1:500) |
| Antibody | Mouse anti-LAR | Clone E9B9S from Cell signaling | A156 | WB (1:500) |
| Antibody | Rabbit anti-Liprin-α3 | Emperador-Melero et al., 2020 | A232 | ICC (1:250) |
| Antibody | Rabbit anti-RIM | SySy | RRID: AB_887774, A58 | ICC (1:500) |
| Antibody | Mouse anti-PSD-95 | NeuroMab | RRID: AB_10698024, A149 | ICC (1:500) |
| Antibody | Mouse anti-Gephyrin | SySy | RRID:AB_2232546, A8 | ICC (1:500) |
| Antibody | Guinea pig anti-Synaptophysin | SySy | RRID: AB_1210382, A106 | ICC (1:500) |
| Antibody | Rabbit anti-CaV2.1 | SySy | RRID: AB_2619841, A46 | ICC (1:500) |
| Antibody | Rabbit anti-Munc13-1 | SySy | RRID: AB_887733, A72 | ICC (1:500) |
| Antibody | Goat anti-rabbit Alexa Fluor 488 | Thermo Fisher | RRID: AB_2576217, S5 | ICC (1:250) |
| Antibody | Goat anti-mouse IgG1 Alexa Fluor 555 | Thermo Fisher | RRID: AB_2535769, S19 | ICC (1:250) |
| Antibody | Goat anti-mouse IgG2a Alexa Fluor 633 | Thermo Fisher | RRID: AB_1500826, S30 | ICC (1:250) |
| Antibody | Goat anti-rat IgG Alexa Fluor 488 | Thermo Fisher | RRID: AB_2534074, S55 | ICC (1:250) |
| Antibody | Goat anti-guinea pig IgG Alexa Fluor 405 | Abcam | RRID: AB_2827755, S51 | ICC (1:250) |
| Software | MATLAB | MathWorks | RRID: SCR_001622; https://www.mathworks.com/products/matlab.html | |
| Algorithm | Custom MATLAB code | Liu et al., 2018 | https://github.com/hmslcl/3D_SIM_analysis_HMS_Kaeser-lab_CL and https://github.com/kaeserlab/3DSIM_Analysis_CL | |
| Software | Prism8 | GraphPad | RRID: SCR_002798, https://www.graphpad.com/scientific-software/prism | |
| Software | R | R Project | RRID: SCR_001905 | |
| Software | Fiji/ImageJ | NIH | RRID: SCR_002285 |
Additional files
Download links
A two-part list of links to download the article, or parts of the article, in various formats.
Downloads (link to download the article as PDF)
Open citations (links to open the citations from this article in various online reference manager services)
Cite this article (links to download the citations from this article in formats compatible with various reference manager tools)
Intact synapse structure and function after combined knockout of PTPδ, PTPσ, and LAR
eLife 10:e66638.
https://doi.org/10.7554/eLife.66638


