T cell stiffness is enhanced upon formation of immunological synapse
- Institute for Medical Microbiology and Hygiene, Saarland University, Germany
- Department of Biophysics, Center for Integrative Physiology and Molecular Medicine (CIPMM), School of Medicine, Saarland University, Germany
- Cell and Developmental Biology, School of Medicine, Center of Human and Molecular Biology (ZHMB), Saarland University, Germany
- Leibniz Institute for New Materials, Germany
Figures
Figure 1
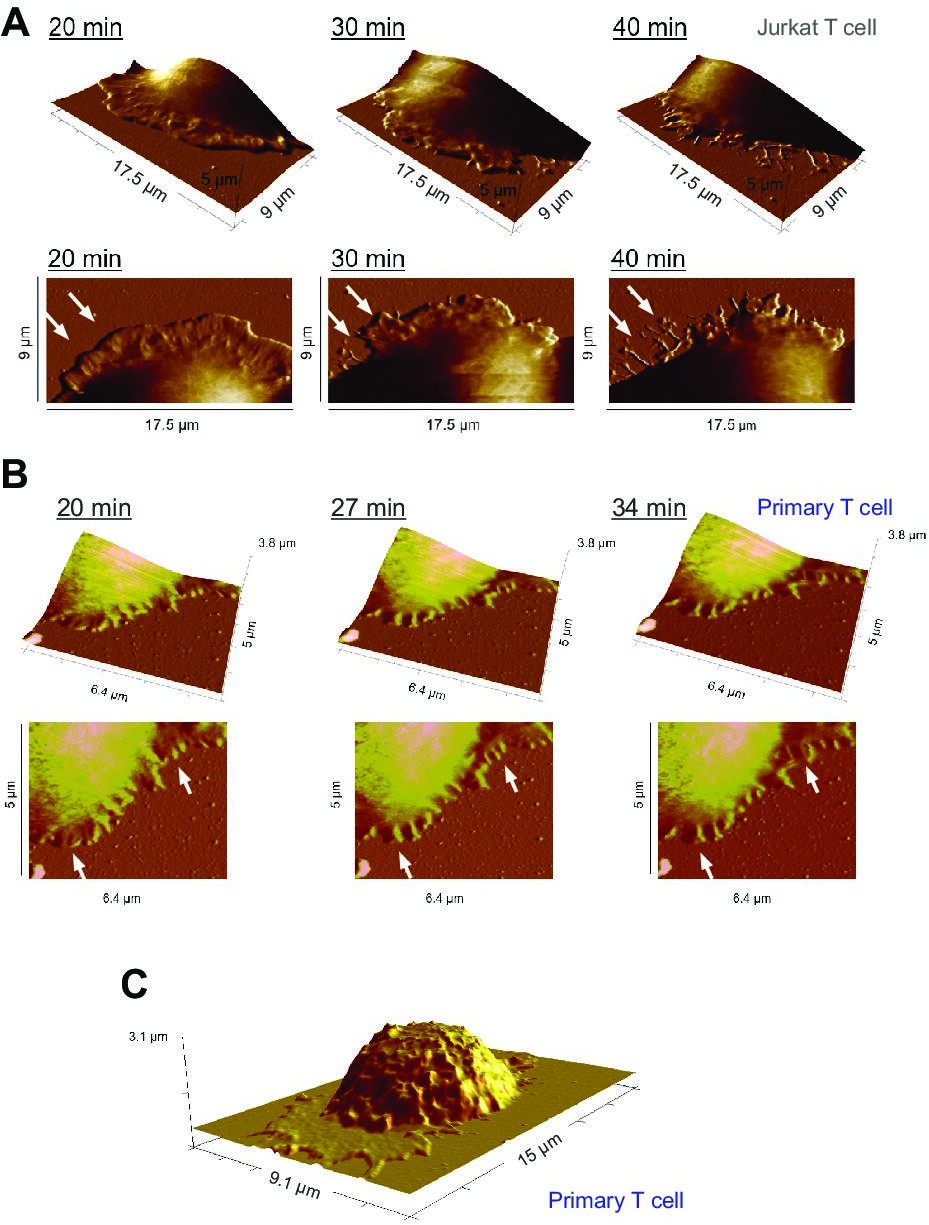
Representative time points of lamellipodial dynamics at the IS.
(A, B) Dynamic changes of the lamellipodium of a Jurkat T cell (A) or a human primary CD4+ T cell (B) during IS formation on a αLFA-1+αCD3+αCD28 antibody-coated coverslip. The height profile, examined by Peak Force QNM, is displayed (upper panel: 3D view, lower panel: top view). Exemplary dynamic parts are highlighted by arrowheads. (C) Height profile of a whole primary human CD4+ T cell during IS formation on a αLFA-1+αCD3+αCD28 antibody-coated coverslip. One representative cell from at least three independent experiments is shown.
Figure 2 with 7 supplements
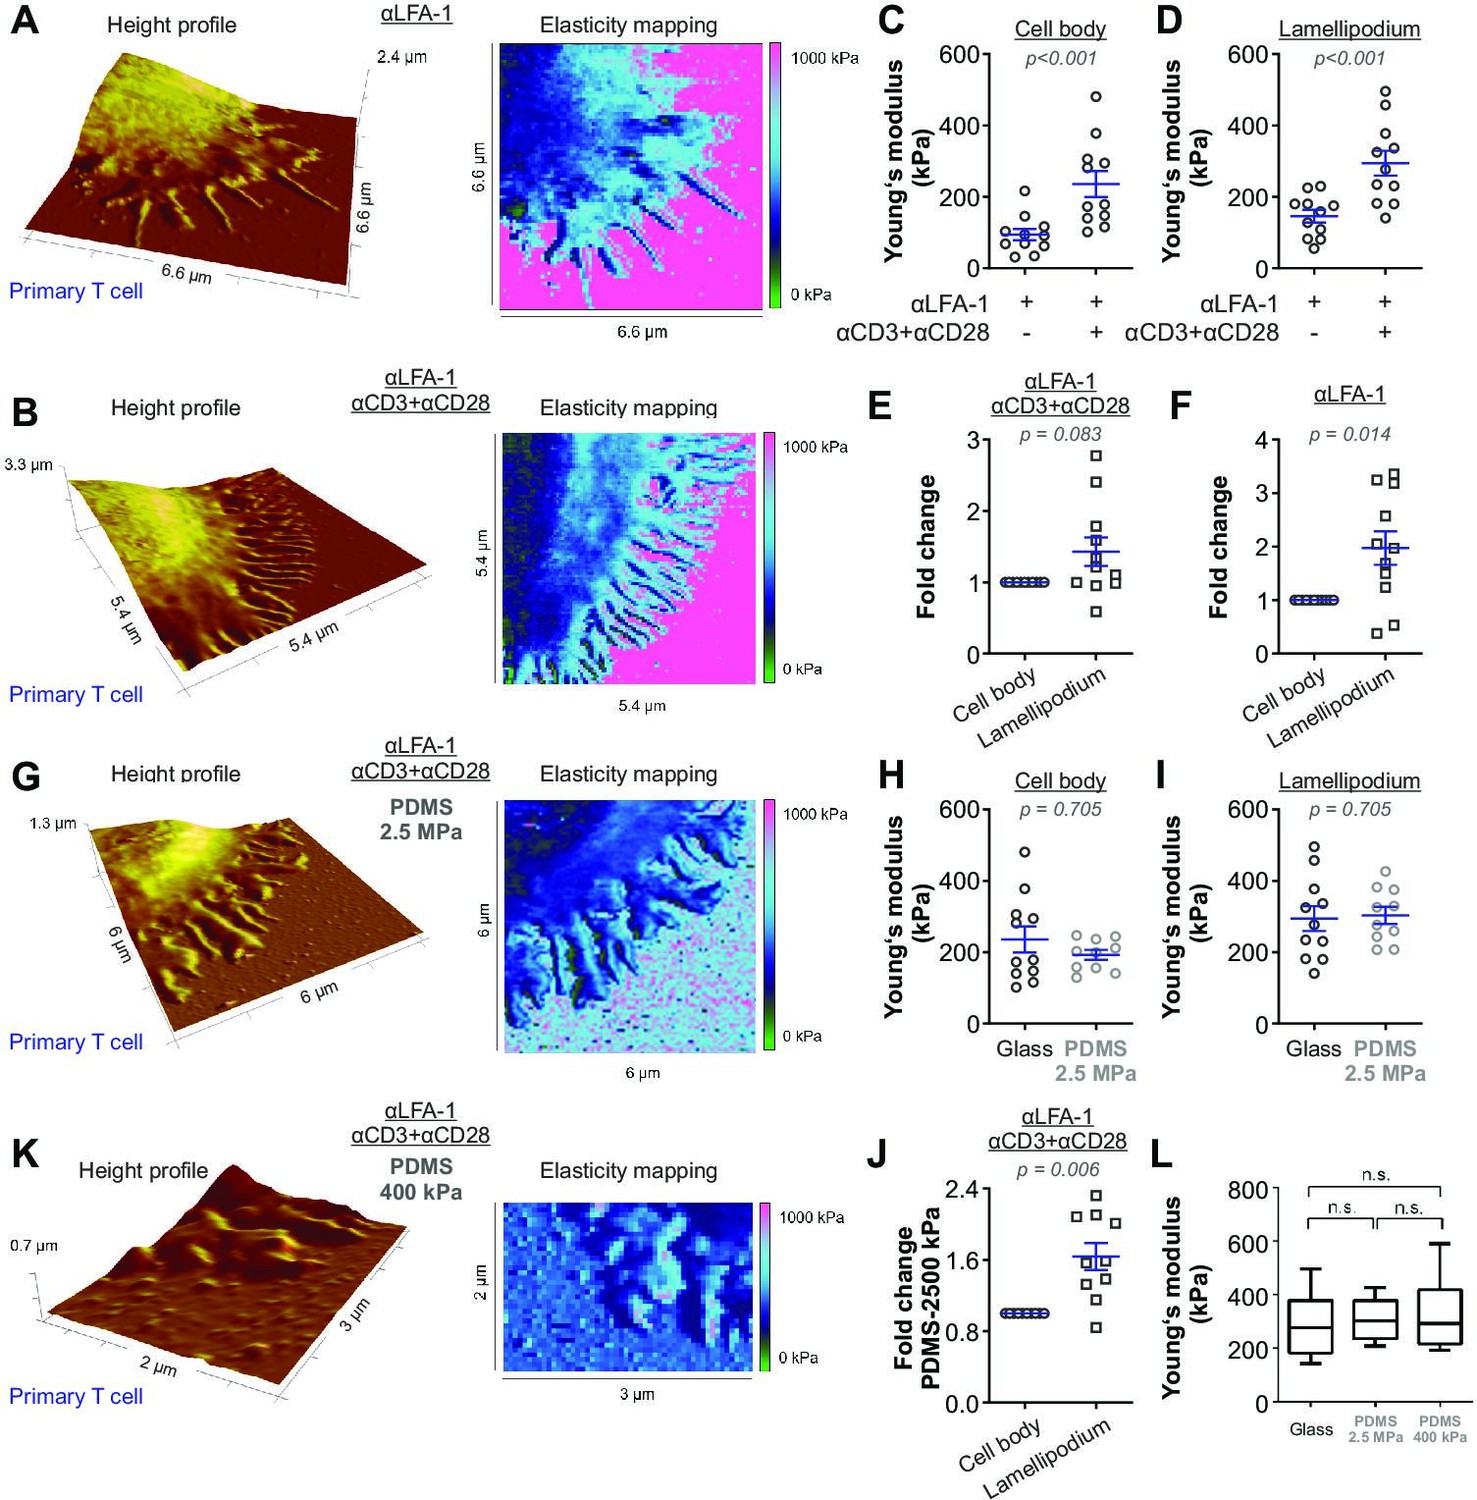
The stiffness of T cells increases upon activation.
Height profiles and corresponding elasticity maps, Young’s moduli, and the respective fold changes of human primary CD4+ T cells. Either glass coverslips (A–F) or PDMS (G–K) were applied as the functionalized surfaces. (H–J, L) Young’s modulus of primary T cells on full antibody (αLFA-1+αCD3+αCD28)-functionalized glass (n = 11, the same dataset as in (D) full antibody), PDMS (2.5 MPa, n = 10), or PDMS (400 kPa, n = 5) substrates. The Mann-Whitney test (C), (D), (H), and (I), the Wilcoxon matched-pairs signed rank test (E), (F), and (J) or Mann-Whitney-U-test (L) was used for analyzing statistical significance. The results were presented as mean ± SEM, from 7 to 12 cells per condition as shown in the plots (LFA-1 vs full anybody-set) from six independent experiments for (A–F) (six donors), from 10 cells (four independent experiments/four donors) for PDMS condition (2.5 MPa) in (G–J), or from 5 cells (two independent experiments/two donors) for PDMS condition (400 kPa). Source data please refer to Figure 2—source data 1. For height profiles and elasticity maps of each value and condition, refer to Figure 2—figure supplements 3–6. For representative Force-Distance Curves, refer to Figure 2—figure supplement 7.
-
Figure 2—source data 1
Original values of stiffness shown in Figure 2.
- https://cdn.elifesciences.org/articles/66643/elife-66643-fig2-data1-v2.xlsx
Figure 2—figure supplement 1
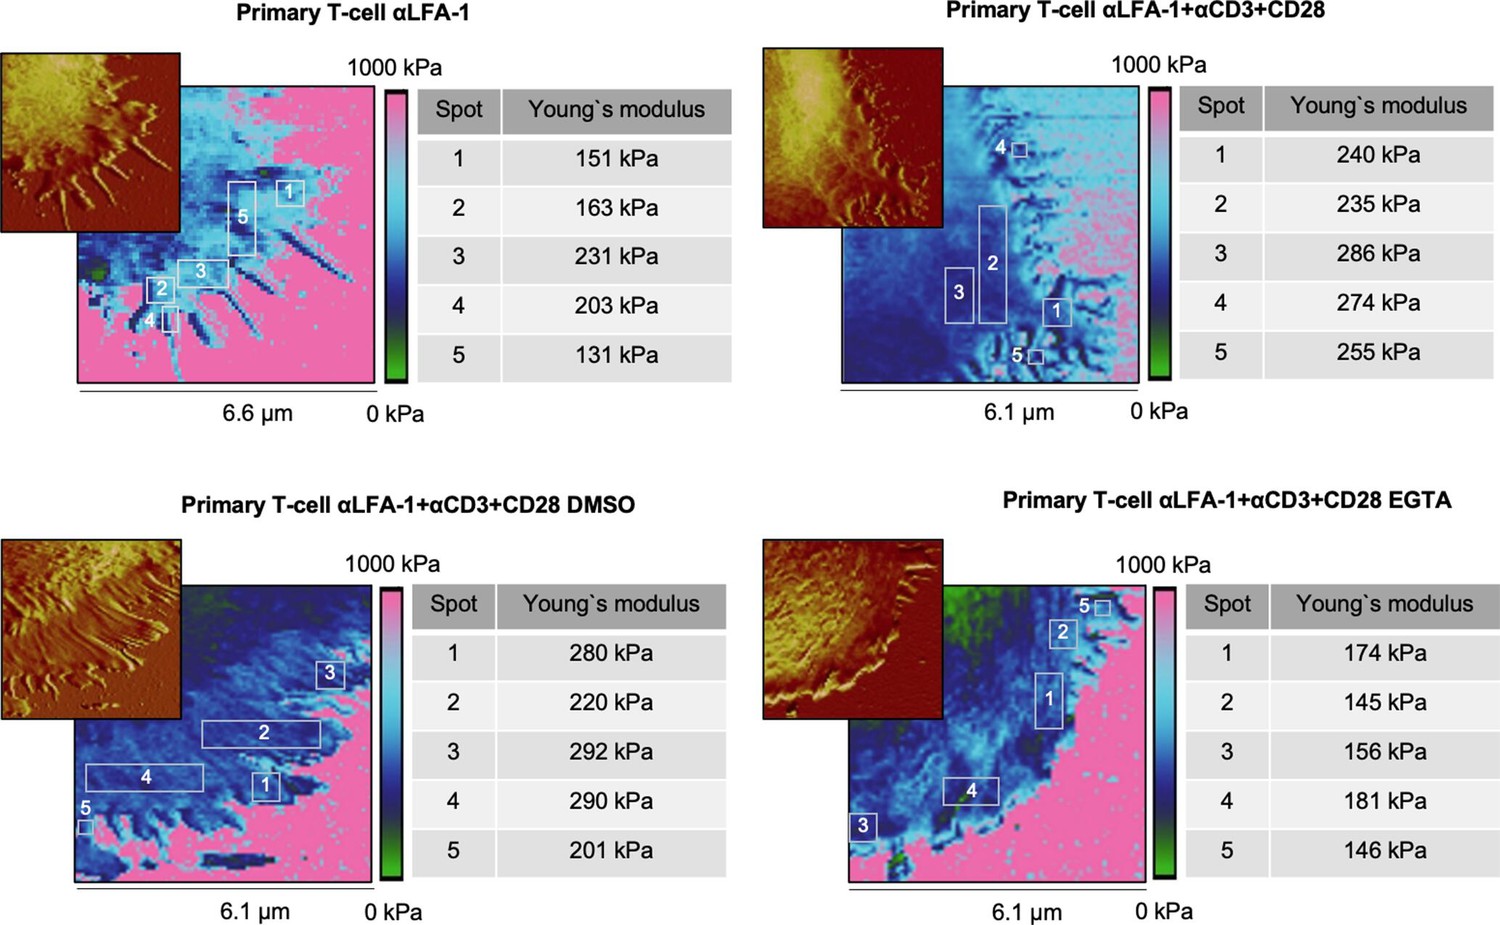
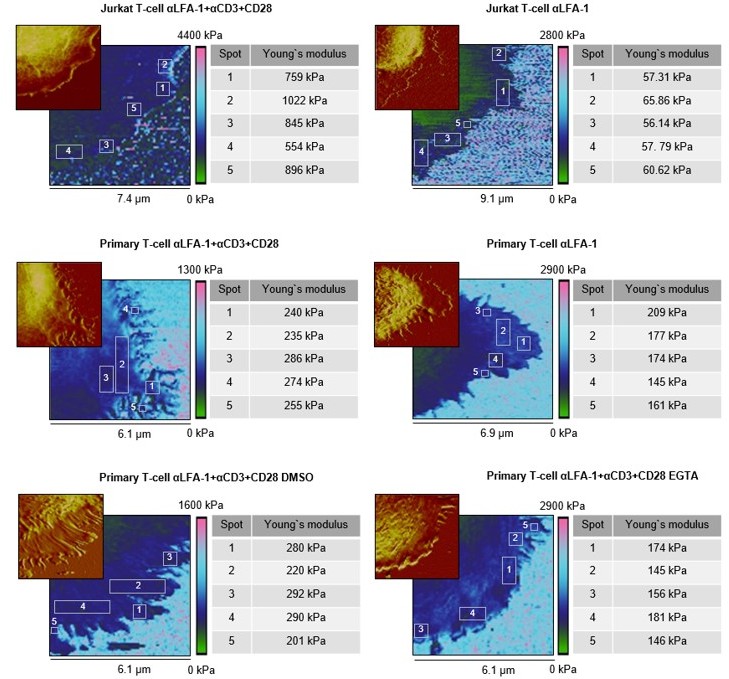
Local stiffness at lamellipodia is not influenced by positioning or topology.
Representative cells were taken from Figure 2. The Young’s moduli of five individual squares on the lamellipodium (at tips/edges, close to the cell body, and in between) of each cell was investigated. The observed areas are marked and numbered on the elasticity map. The corresponding height profiles are shown in the top left corner. Each individual Young’s modulus is given in the table on the right.
-
Figure 2—figure supplement 1—source data 1
Stiffness of T cells measured on funcationalized surfaces.
- https://cdn.elifesciences.org/articles/66643/elife-66643-fig2-figsupp1-data1-v2.xlsx
Figure 2—figure supplement 2
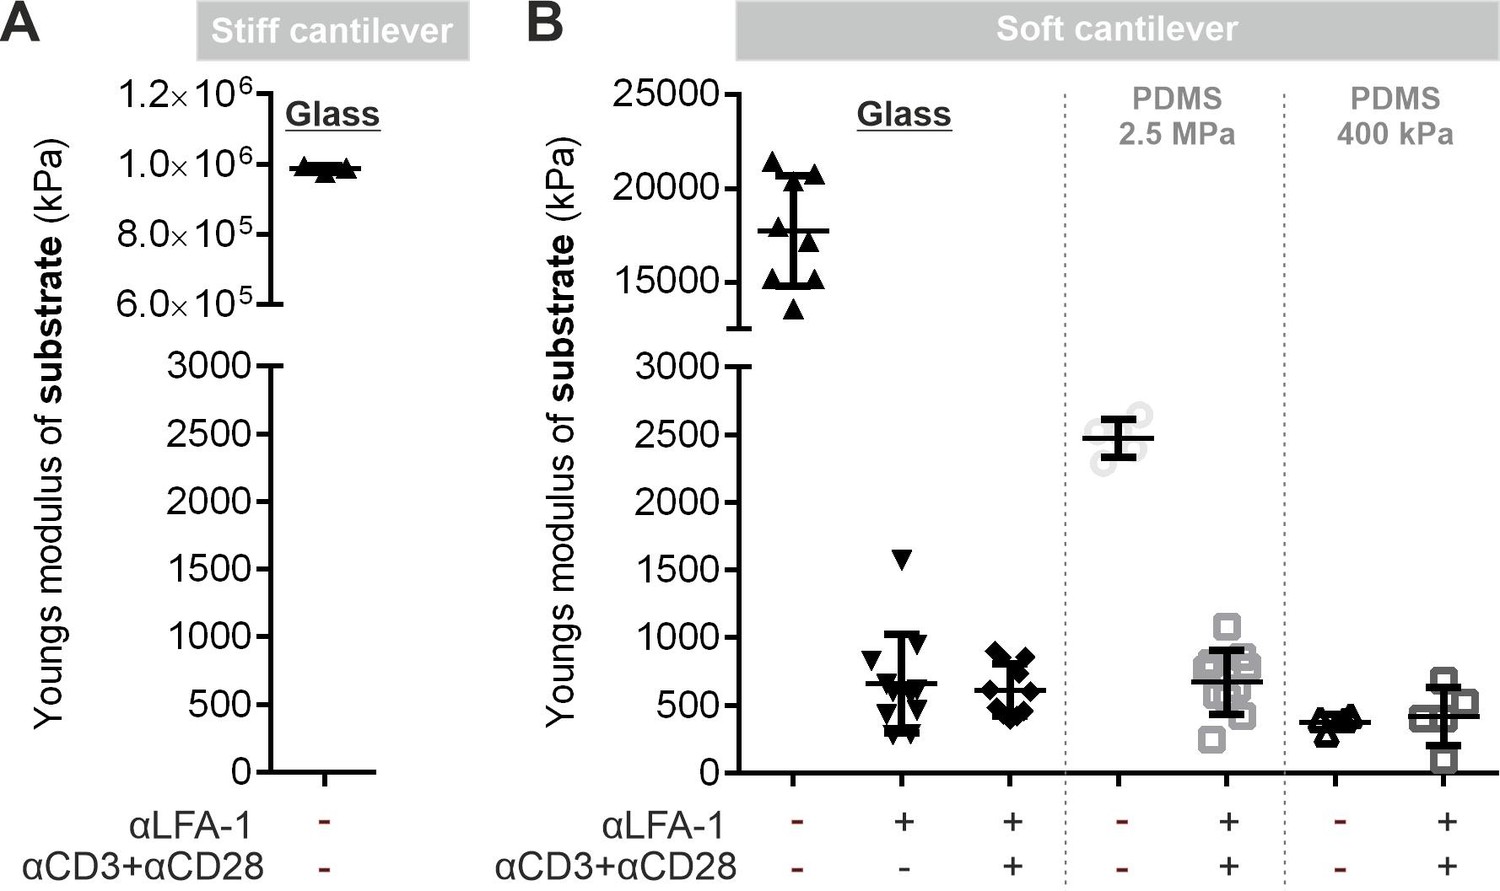
Stiffness of substrates.
(A) Stiffness of uncoated glass coverslips measured by Peak Force Tapping mode in air, utilizing ScanAsyst Air cantilevers (Bruker) with a spring constant of 0.8 N/m. (B) Stiffness of uncoated/functionalized substrates measured by the Peak Force Tapping mode in fluid, utilizing MLCT cantilever type B cantilever (Bruker) with a spring constant of 0.06–0.1 N/m. Further details please see Materials and methods. Source data please refer to Figure 2—figure supplement 2—source data 1.
-
Figure 2—figure supplement 2—source data 1
Source data of stiffness of uncoated and coated substrates.
- https://cdn.elifesciences.org/articles/66643/elife-66643-fig2-figsupp2-data1-v2.xlsx
Figure 2—figure supplement 3

Height profiles and elasticity maps (Young's modulus) of primary T-cells on αLAF-1-functionalized glass.
Figure 2—figure supplement 4
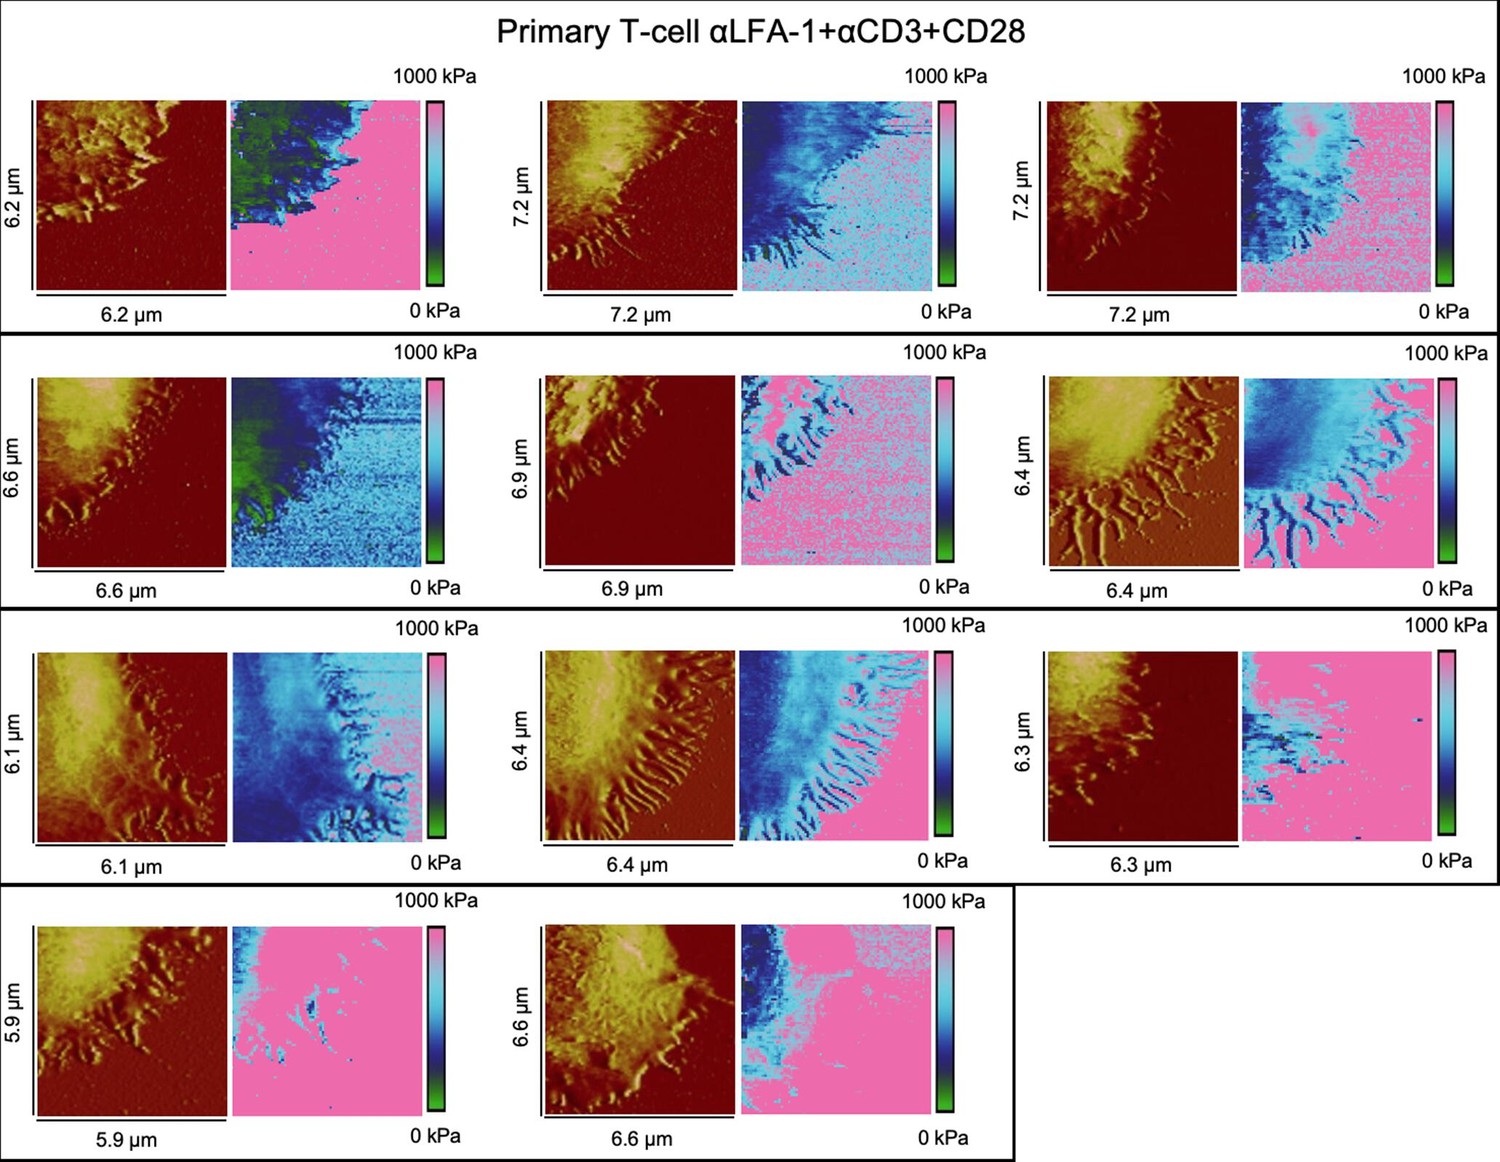
Height profiles and elasticity maps (Young`s modulus) of primary T-cells on full antibody (αLFA-1+αCD3+αCD28)-functionalized glass.
Figure 2—figure supplement 5

Height profiles and elasticity maps (Young`s modulus) of primary T-cells on full antibody (αLFA-1+αCD3+αCD28)-functionalized PDMS substrate with 2.5 MPa.
Figure 2—figure supplement 6
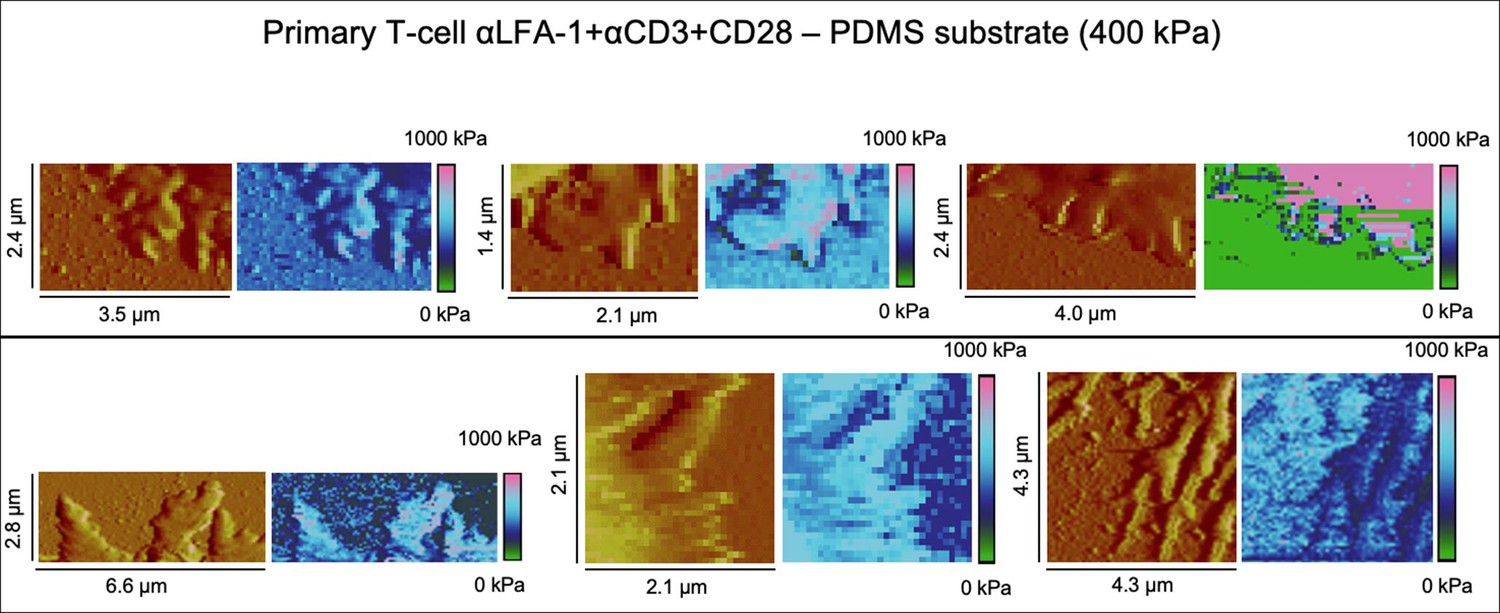
Height profiles and elasticity maps (Young`s modulus) of primary T-cells on full antibody (αLFA-1+αCD3+αCD28)-functionalized PDMS substrate with 400 kPa.
Figure 2—figure supplement 7
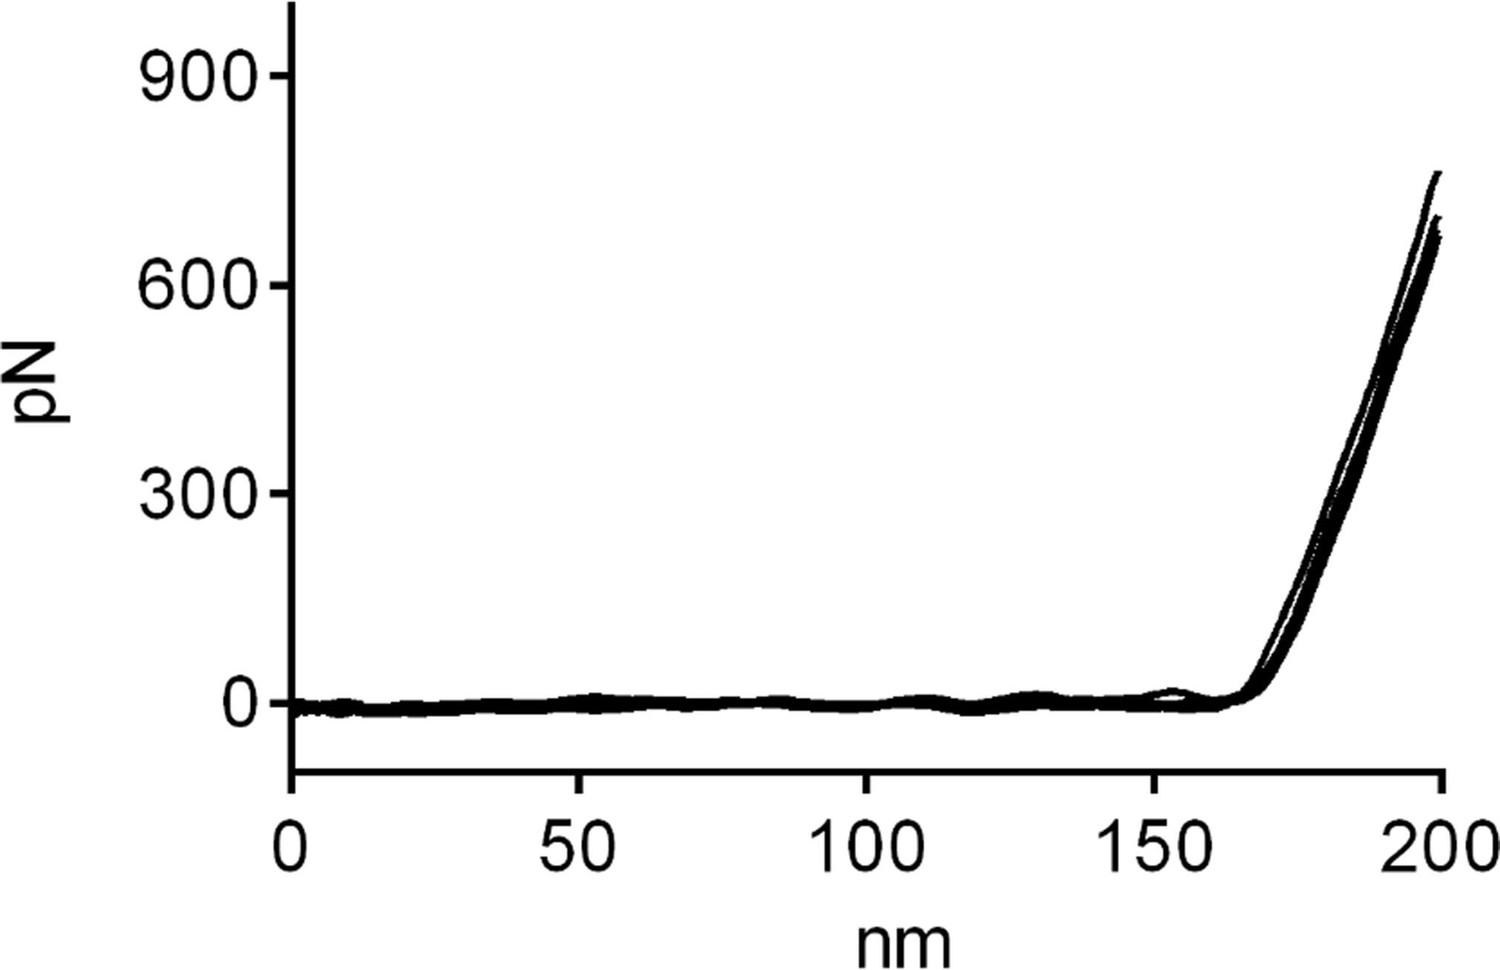
Exemplary Force-Distance Curves during Elasticity mapping of primary T cells on full antibody (αLFA-1+αCD3+αCD28)-functionalized glass.
Figure 3 with 2 supplements

Activation-induced T cell stiffening is regulated by intracellular calcium.
Primary human CD4+ T cells were treated with either EGTA-AM or DMSO at room temperature for 30 min. Height profiles and corresponding elasticity maps (A, B), Young’s moduli (C, D), and the respective fold changes (E, F) are shown. The Mann-Whitney test (C, D) or the Wilcoxon matched-pairs signed rank test (E, F) was used for statistical significance. Results were presented as mean ± SEM, from 11 cells for each condition (LFA-1 vs full anybody-set) from four independent experiments (four donors). Source data please refer to Figure 3—source data 1. For height profiles and elasticity maps of each value and condition, refer to Figure 3—figure supplements 1 and 2.
-
Figure 3—source data 1
Original values of stiffness shown in Figure 3.
- https://cdn.elifesciences.org/articles/66643/elife-66643-fig3-data1-v2.xlsx
Figure 3—figure supplement 1
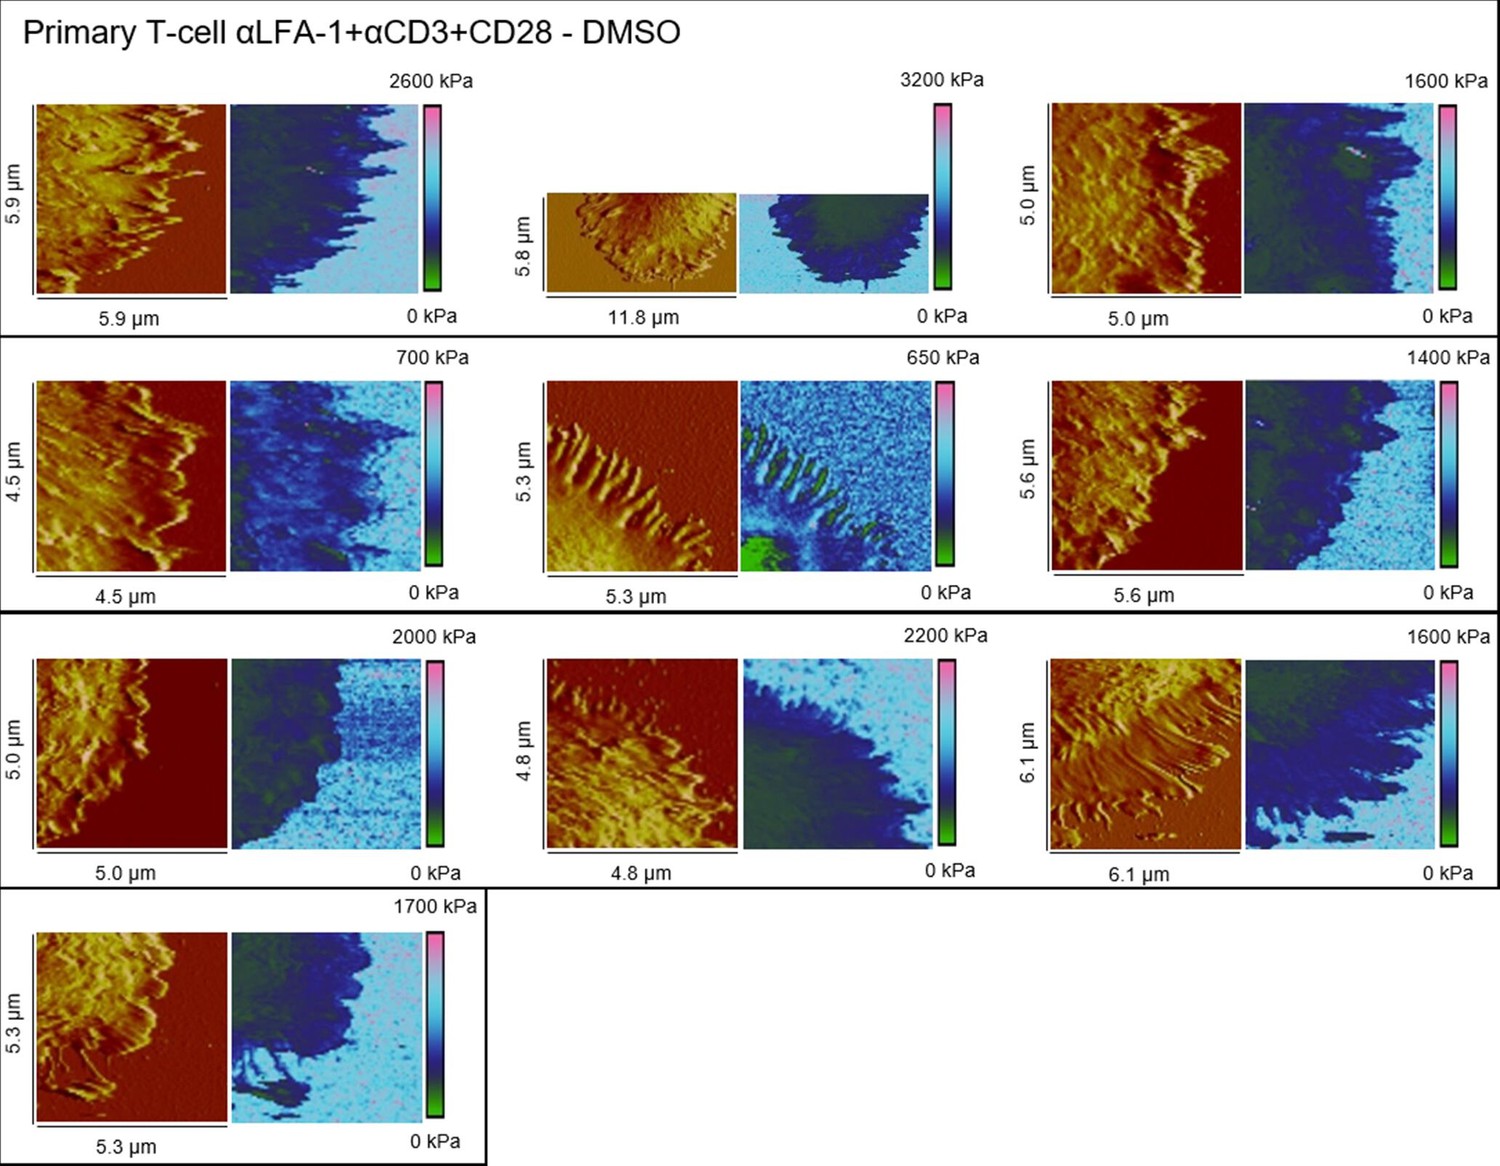
Height profiles and elasticity maps (Young`s modulus) of DMSO-treated primary T cells on full antibody (αLFA-1+αCD3+CD28)-functionalized glass.
Figure 3—figure supplement 2
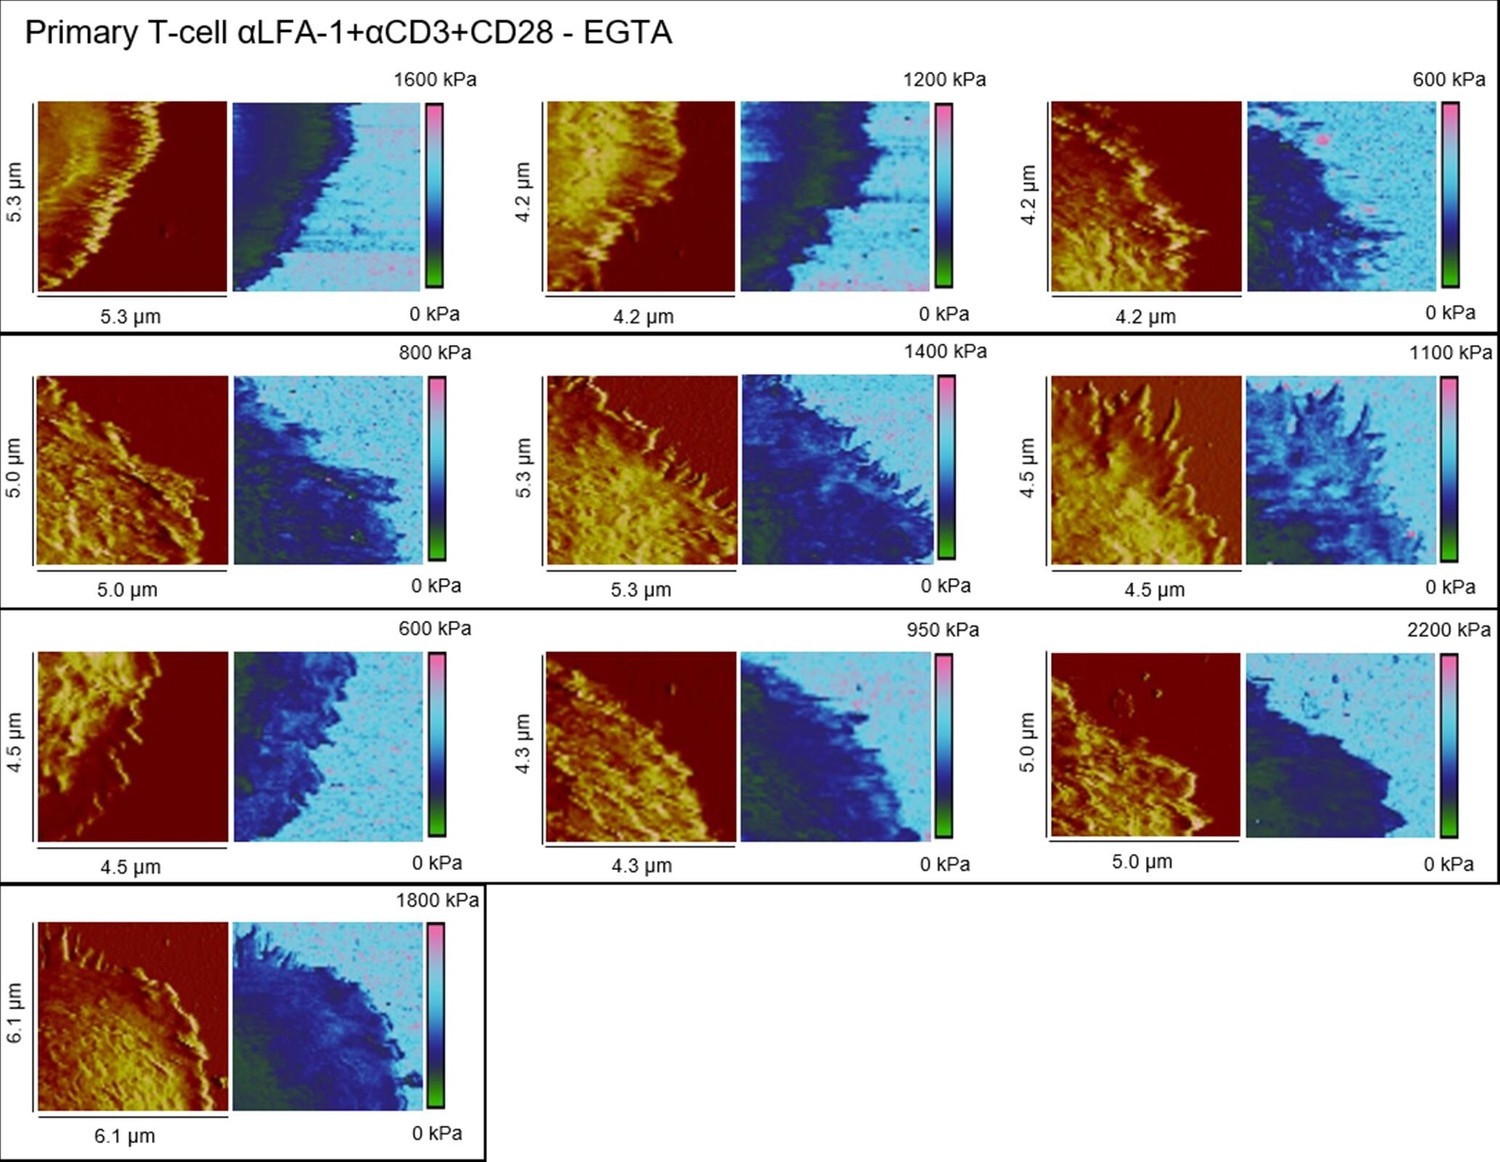
Height profiles and elasticity maps (Young`s modulus) of EGTA-treated primary T-cells on full antibody (αLFA-1+αCD3+CD28)-functionalized glass.
Author response image 1
Elasticity maps and height profiles of representative cells of each substrate condition.
Tables
Key resources table
| Reagent type (species) or resource | Designation | Source or reference | Identifiers | Additional information |
|---|---|---|---|---|
| Cell line (Homo sapiens) | Jurkat E6.1 cell line | ATCC | ATCC Cat# TIB-152, RRID:CVCL_0367 | |
| Biological sample (Homo sapiens) | Primary human CD4+ T cells | Human peripheral blood mononuclear cells (PBMCs) were obtained from healthy donors provided by Institute of Clinical Hemostaseology and Transfusion Medicine. Faculty of Medicine. University of Saarland.PMID:24599783 | Negatively isolated from PBMCs using CD4+ T Cell Isolation Kit human (Miltenyl). | |
| Commercial assay or kit | CD4+ T Cell Isolation Kit human | Miltenyi | Cat# 130-096-533 | |
| Commercial assay or kit | Sylgard 184 Silicone Elastomer Kit | Dow Europe GmbH | Material Number 1317318 | |
| Peptide, recombinant protein | Polyornithine | Sigma-Aldrich(Merck) | MDL number MFCD00286305 | |
| Chemical compound, drug | EGTA/AM | Calbiochem (Merck) | Cat# 324,628 | |
| Antibody | anti-LFA-1 (ITGAL) antibody(Mouse monoclonal) | Antibodies-online | Cat# ABIN135680, RRID:AB_10773722 | Diluted to 9 µg/ml in 20 μl PBS |
| Antibody | mouse anti-human CD28 antibody(Mouse monoclonal) | BD Pharmingen | Cat# 555725, RRID:AB_396068 | Diluted to 90 µg/ml in 20 μl PBS |
| Antibody | mouse anti-human CD3 antibody(Mouse monoclonal) | Diaclone | Cat# 854.010.000, RRID:AB_1155287 | Diluted to 30 µg/ml in 20 μl PBS |
| Software, algorithm | GraphPad Prism | GraphPad | RRID:SCR_002798 | |
| Software, algorithm | Research NanoScope 9.1 | Bruker Corp. | R3.119071 | |
| Software, algorithm | NanoScope Analysis 1.80 | Bruker Corp. | R2.132257 |
Additional files
Download links
A two-part list of links to download the article, or parts of the article, in various formats.
Downloads (link to download the article as PDF)
Open citations (links to open the citations from this article in various online reference manager services)
Cite this article (links to download the citations from this article in formats compatible with various reference manager tools)
T cell stiffness is enhanced upon formation of immunological synapse
eLife 10:e66643.
https://doi.org/10.7554/eLife.66643


