Loss of Mir146b with aging contributes to inflammation and mitochondrial dysfunction in thioglycollate-elicited peritoneal macrophages
- Department of Ophthalmology and Visual Sciences, Washington University in St. Louis School of Medicine, United States
- Department of Pathology and Immunology, Washington University in St. Louis School of Medicine, United States
- Department of Medicine, Washington University in St. Louis School of Medicine, United States
- Department of Developmental Biology, Washington University in St. Louis School of Medicine, United States
Figures
Figure 1 with 2 supplements
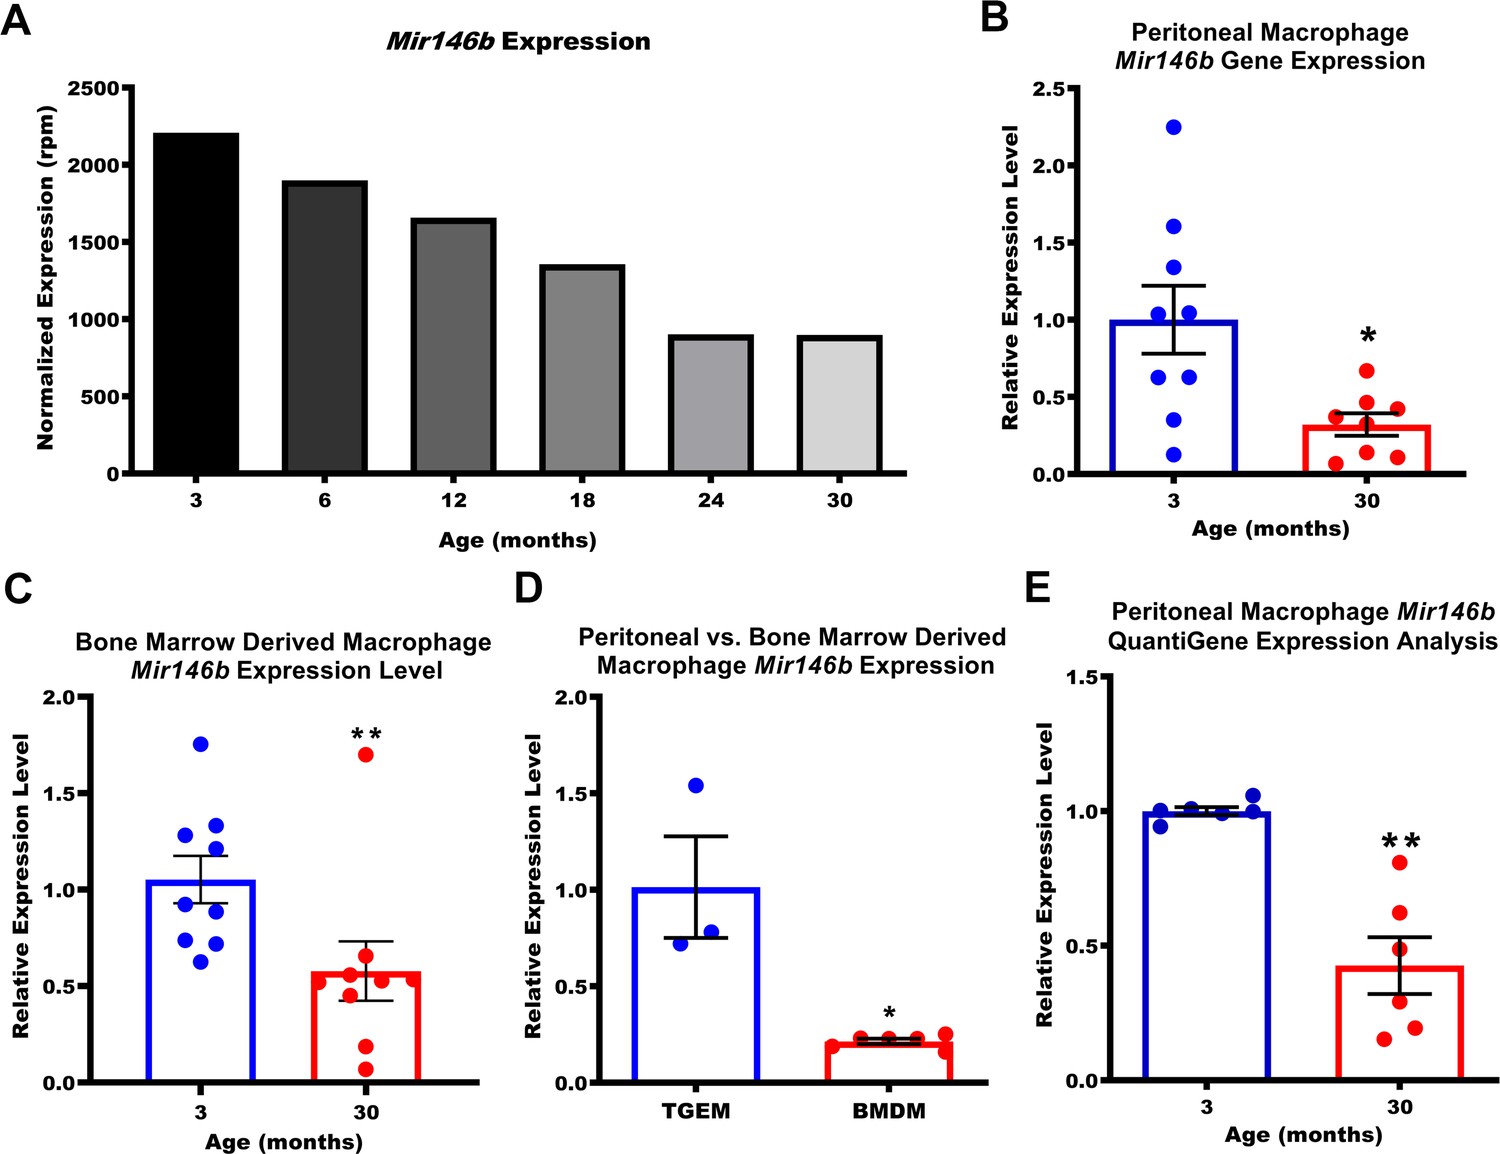
Expression of macrophage Mir146b declines with aging.
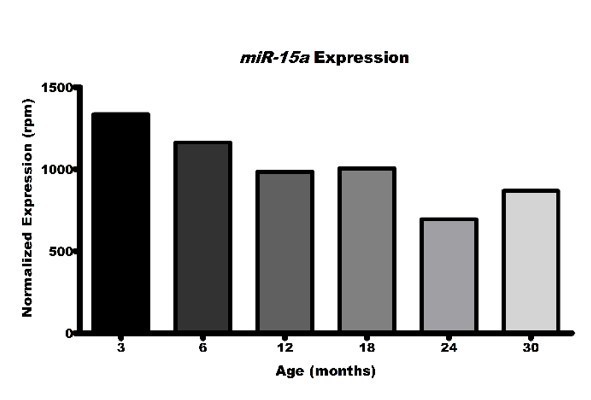
(A) Small RNA transcriptomic profiling of thioglycollate-elicited macrophages (TGEMs) across the mouse virtual lifespan identified Mir146b as a microRNA (miRNA) whose transcription levels progressively and unidirectionally decreased with host age (3- to 30-month-old C57Bl/6 females; TGEMs were pooled from n = 10 mice into a single sample per time point) (2207.22 reads per million [rpm] at 3 months vs 897.94 rpm at 30 months). (B) Representative quantitative polymerase chain reaction (qPCR) gene expression analysis of Mir146b from TGEMs from C57Bl/6 female mice (n = 9 vs n = 8 mice [biological replicates] from three independent experiments; *p = 0.0206) and (C) unstimulated bone marrow-derived macrophages (BMDMs) (n = 9 vs n = 9 mice [biological replicates] from three independent experiments; **p = 0.0040) from young (3 months) or old (30 months) C57Bl/6 female mice. (D) Relative qPCR expression levels of Mir146b in TGEMs compared to BMDMs (n = 3 vs n = 6 mice [biological replicates]; *p = 0.0238). (E) Relative Mir146b expression measured by Affymetrix QuantiGene 2.0 miRNA assay in TGEMs from 3-month- or 30-month-old female C57Bl/6 mice. Graph showing data from three independent experiments of n = 2 mice (biological replicates) per group (n = 6 vs n = 6; **p = 0.0022). Data for (B-E) are represented as mean ± SEM. Each point represents the mean value from two technical replicates per mouse. Mann-Whitney U-test was used for comparison between two groups.
-
Figure 1—source data 1
Flow cytometry density plots from TGEMs isolated from (n = 5) 3-month (bottom row)- and (n = 5) 20-month-old (top row) mice and stained with CD11b eFluor 450 and F4/80 Allophycocyanin (APC) along with numerical values for each mouse indicating the percentage of cells stained double-positive for both markers (CD11b+/F4/80+).
- https://cdn.elifesciences.org/articles/66703/elife-66703-fig1-data1-v4.xlsx
-
Figure 1—source data 2
miRNA expression values in reads per million from small RNA-seq of female TGEMs at 3, 6, 12, 18, 24, and 30 months of age (related to Figure 1A and Figure 1—figure supplement 2A and I).
- https://cdn.elifesciences.org/articles/66703/elife-66703-fig1-data2-v4.xls
-
Figure 1—source data 3
Relative miRNA expression values from qPCR of TGEMs from 3-month (n = 9 mice)-, 12-month (n = 8 mice)-, and 20-month (n = 9 mice)-old female mice.
Numerical values are displayed in graphs for (B) Mir146b, (C) Mir22, (D) Mir15a, (E) Mir29a, (F) Mir423, (G) Mir146a, and (H) Mir18a.
- https://cdn.elifesciences.org/articles/66703/elife-66703-fig1-data3-v4.xlsx
-
Figure 1—source data 4
Relative Mir146b miRNA expression values used for the graph from qPCR of TGEMs from n = 9 young (3 months) or n = 8 old (30 months) female mice (related to Figure 1B).
- https://cdn.elifesciences.org/articles/66703/elife-66703-fig1-data4-v4.xlsx
-
Figure 1—source data 5
Relative Mir146b miRNA expression values used for the graph from qPCR of BMDMs from n = 9 young (3 months) or n = 9 old (30 months) female mice (related to Figure 1C ).
- https://cdn.elifesciences.org/articles/66703/elife-66703-fig1-data5-v4.xlsx
-
Figure 1—source data 6
Relative Mir146b miRNA expression values used for graphs from qPCR of young female TGEMs (n = 3 mice) vs BMDMs (n = 6 mice) (related to Figure 1D).
- https://cdn.elifesciences.org/articles/66703/elife-66703-fig1-data6-v4.xlsx
-
Figure 1—source data 7
Relative Mir146b miRNA expression values used for graphs from Quantigene 2.0 assay of TGEMs from n = 6 young (3 months) or n = 6 old (30 months) female mice (related to Figure 1E).
- https://cdn.elifesciences.org/articles/66703/elife-66703-fig1-data7-v4.xlsx
Figure 1—figure supplement 1
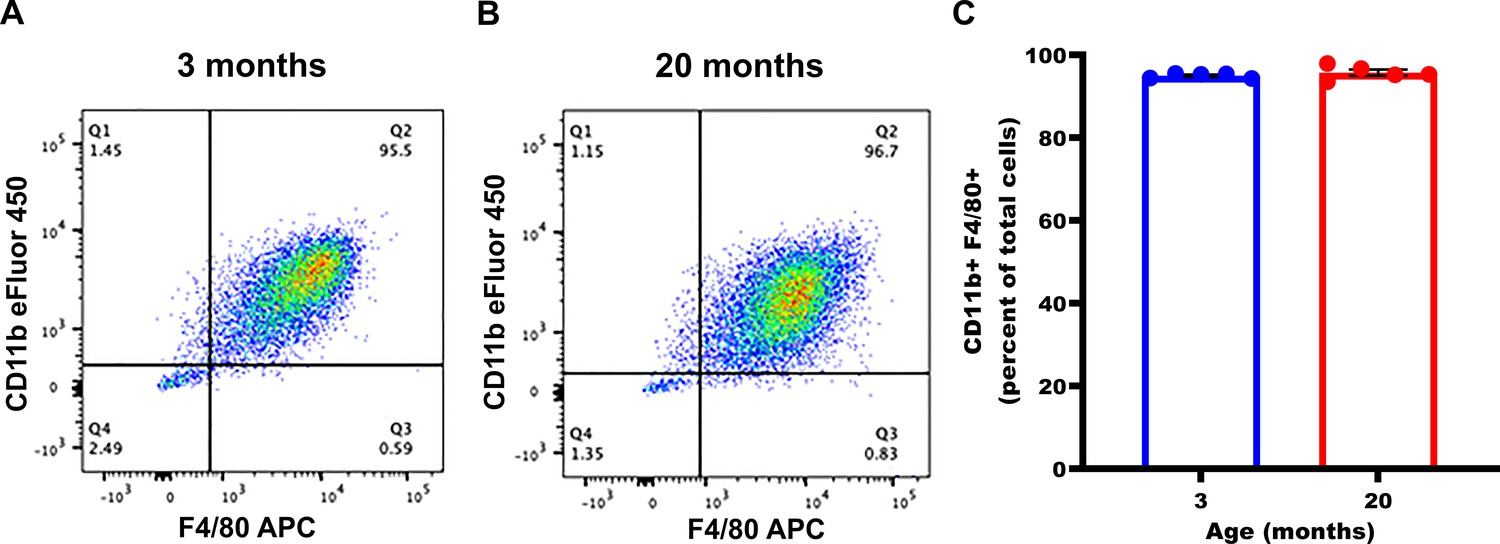
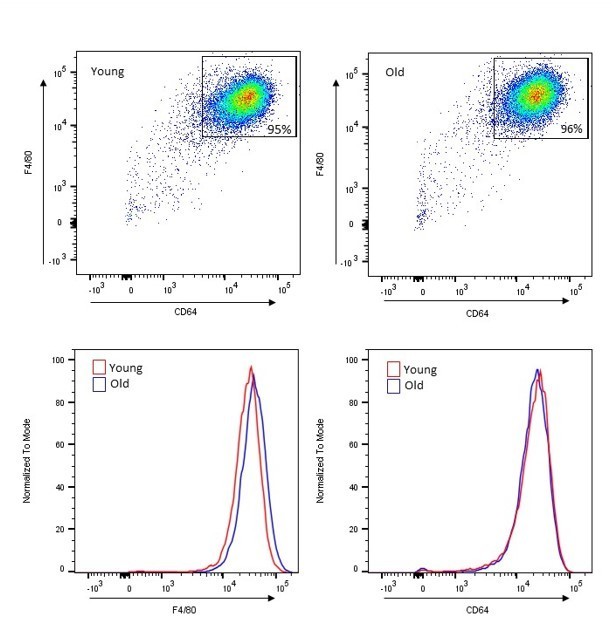
Thioglycollate-elicited macrophage purity is consistent between young and old mice.
Peritoneal exudate cells were harvested from young (3 months) or old (20 months) female C57Bl/6 mice 4 days post-thioglycollate induction. Cells from each individual mouse were treated as separate biological replicate samples. After plating overnight to allow macrophage/monocyte cell adherence, non-adhered cells were removed by washing with Dulbecco's phosphate-buffered saline (DPBS). The remaining adherent cells were collected for analysis. Expression of CD11b and F4/80 was analyzed by flow cytometry in 30,000 cells per sample. (A) Representative flow cytometry plots from one young and (B) one old mouse demonstrating >95% double-positive (CD11b+ F4/80+) cells. (C) Mean percentage of double-positive (CD11b+ F4/80+) cells per mouse (94.98% at 3 months; n = 5 young mice vs 95.72% at 20 months; n = 5 old mice; p = not significant). Data represent mean ± SEM. For (C), Mann-Whitney U-test was used for comparison between groups.
Figure 1—figure supplement 2
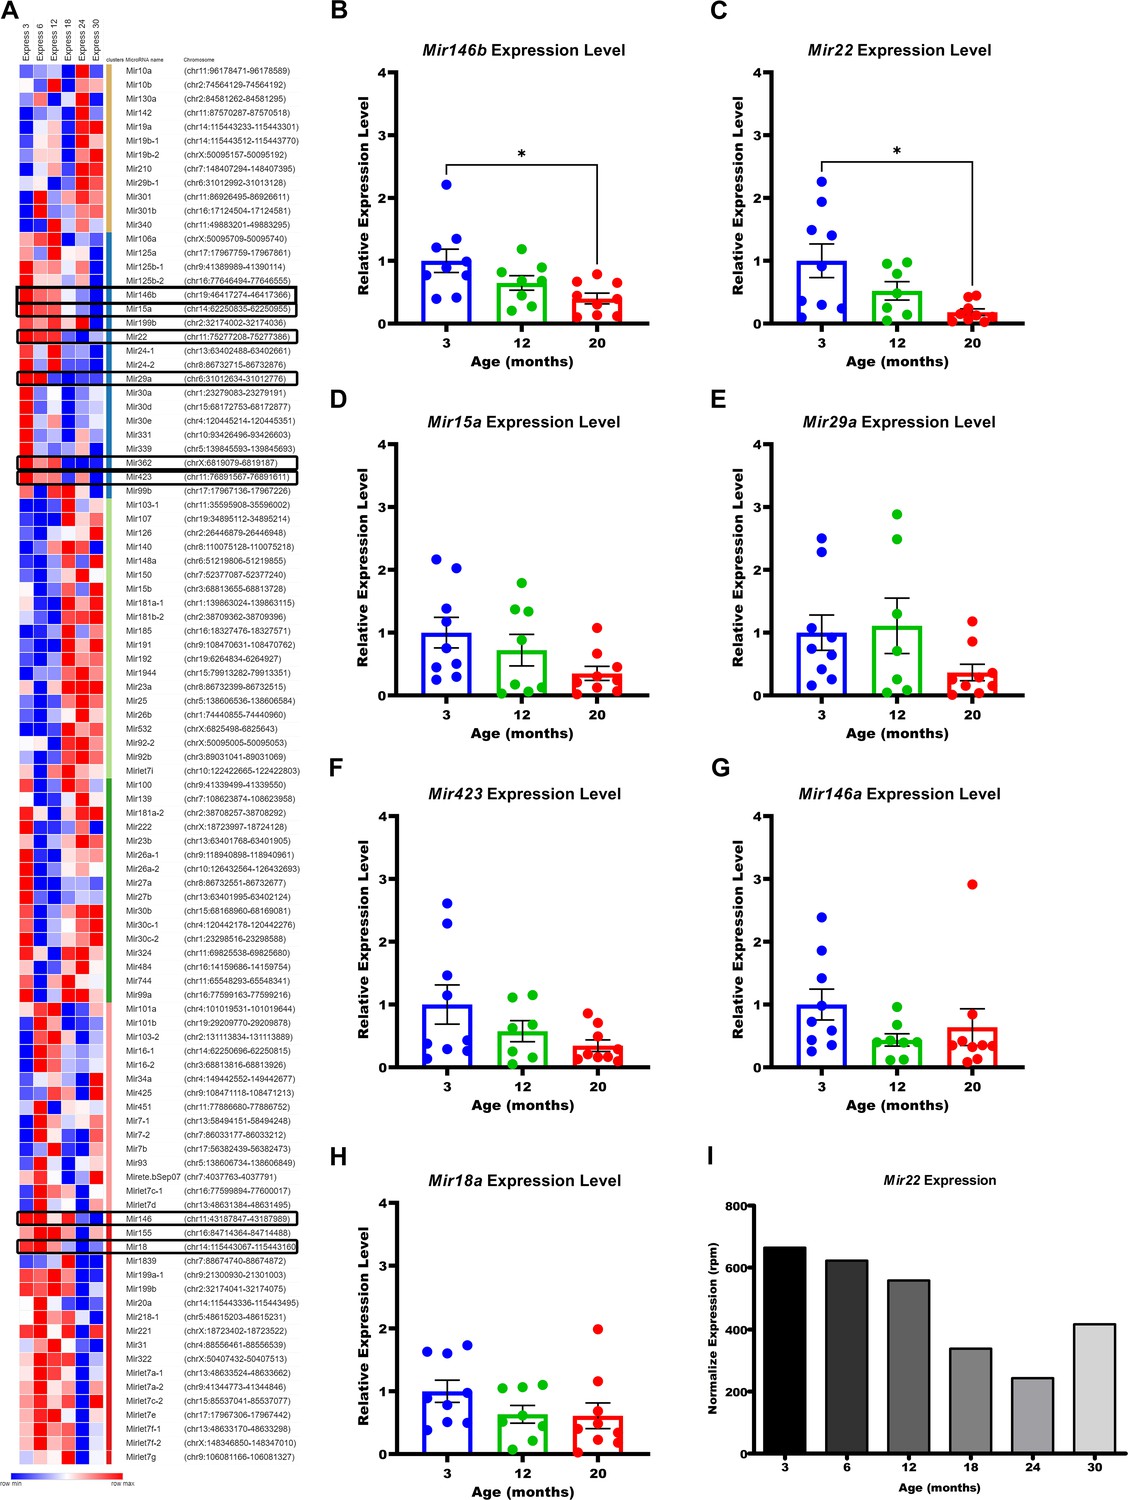
Mir146b and Mir22 are downregulated with age in murine TGEMs.
(A) Heatmap of row z-score distributions of the top 100 expressed microRNAs (miRNAs) from female murine macrophages 3–30 months of age, spanning the mouse virtual lifespan. MicroRNAs highlighted in black boxes were further evaluated by quantitative polymerase chain reaction (qPCR) in (B–H). Only Mir146b (B) and Mir22 (C) demonstrated statistically significant decreases from ages 3 to 20 months in thioglycollate-elicited macrophages (TGEMs) from female mice. Each dot represents the normalized (to U6) microRNA expression for one sample (mouse) relative to young 3-month-old mice. Two technical replicates were assayed per sample per target, and the average Ct value was used for computing expression values. Ct values above 36 were not considered for analysis, as occurred with one 12-month sample each for Mir22, Mir423, and Mir29a. Mir362 was also assayed but failed to amplify in more than half of our samples at each age and was therefore excluded from analysis (data not shown). One-way analysis of variance (ANOVA) with Bonferroni’s multiple comparison test was used to compare samples. Mir146b (*p = 0.0155; n = 9 mice at 3 months vs n = 8 mice at 12 months vs n = 9 mice at 20 months; Bonferroni’s multiple comparison test, 3 months vs 20 months; *p = 0.0133). Mir22 (*p = 0.0130; n = 9 mice at 3 months vs n = 7 mice at 12 months vs n = 9 mice at 20 months; Bonferroni’s multiple comparison test, 3 months vs 20 months; *p = 0.0110). One-way ANOVA was not significant for Mir15a (D), Mir29a (E), Mir423 (F), Mir146a (G), or Mir18a (H). (I) Normalized expression values for Mir22 in reads per million (rpm) from small RNA sequencing of female TGEMs from mice 3–30 months of age.
Figure 2 with 1 supplement
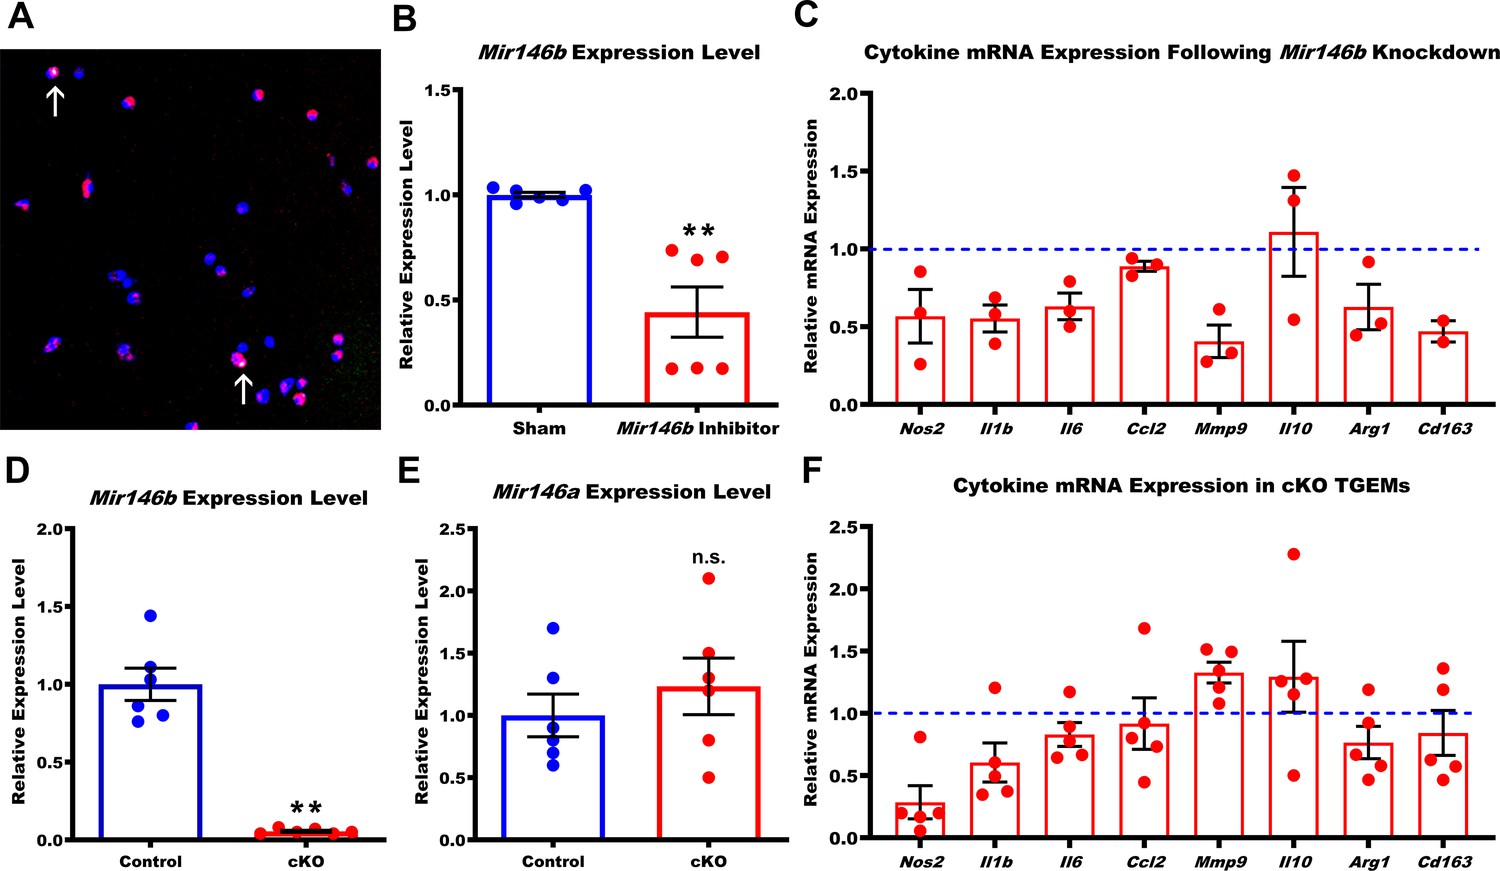
Loss of Mir146b in TGEMs alters inflammatory cytokine profile.
(A) Fast-forward transfection of thioglycollate-elicited macrophages (TGEMs) from 3-month-old C57Bl/6 female mice with small (~22 nucleotides) RNAs (magenta) for microRNA knockdown causes little apoptosis as determined by terminal deoxynucleotidyl transferase dUTP nick end labeling (TUNEL) staining (green/arrows) while (B) producing efficient knockdown of Mir146b vs scramble transfection control as determined by quantitative polymerase chain reaction (qPCR) expression analysis (n = 6 vs n = 6 from two separate experiments of n = 3 independent wells each; **p<0.0022). (C) Cytokine gene expression assessed by qPCR following Mir146b knockdown relative to sham control (blue dash line) in TGEMs. To obtain sufficient cell numbers for each experiment, TGEMs from n = 2–3 3-month-old female mice were pooled into a single sample. Each sample was run in two to three technical replicates, and the average Ct values were used for analysis. Each dot represents the normalized expression for one independently pooled sample relative to pooled littermate Control samples. (D) TGEMs from young female conditional knockout (cKO) mice have significantly reduced Mir146b gene expression levels (n = 6 vs n = 6 mice [biological replicates]; **p = 0.0049) (E) but no change in Mir146a compared to TGEMs from female littermate Controls (n = 6 vs n = 6 mice [biological replicates]; p = 0.5738 [not significant]). (F) TGEM cytokine gene expression from young female cKO mice vs littermate Controls (represented by the blue dashed line). Each dot represents the relative gene expression in cKO TGEMs pooled from two to three female mice per sample (as in C above) compared to that of pooled TGEMs from female littermate Controls for each independent experiment (n = 5 independent experiments). Graphical data are represented as mean ± SEM. Mann-Whitney U-test was used to compare between groups for (B), (D), and (E).
-
Figure 2—source data 1
Relative Mir146b miRNA expression values used for graphs from qPCR of sham-transfected (n = 6) or Mir146b inhibitor-transfected (n = 6) female TGEMs.
- https://cdn.elifesciences.org/articles/66703/elife-66703-fig2-data1-v4.xlsx
-
Figure 2—source data 2
Relative mRNA expression values of Nos2, Il1b, Il6, Ccl2, Mmp9, Il10, Arg1, and Cd163 used for graphs from qPCR of sham-transfected (n = 3 independent biological samples) vs Mir146b inhibitor-transfected (n = 3 independent biological samples) pooled female TGEMs.
- https://cdn.elifesciences.org/articles/66703/elife-66703-fig2-data2-v4.xlsx
-
Figure 2—source data 3
Relative Mir146b miRNA expression values used for graphs from qPCR of Control (n = 6 mice) vs cKO (n = 6 mice) TGEMs.
- https://cdn.elifesciences.org/articles/66703/elife-66703-fig2-data3-v4.xlsx
-
Figure 2—source data 4
Relative Mir146a miRNA expression values used for graphs from qPCR of TGEMs from female Control (n = 6) vs cKO (n = 6) mice.
- https://cdn.elifesciences.org/articles/66703/elife-66703-fig2-data4-v4.xlsx
-
Figure 2—source data 5
Relative mRNA expression values of Nos2, Il1b, Il6, Ccl2, Mmp9, Il10, Arg1, and Cd163 used for graphs from qPCR of pooled TGEMs from female Control (n = 8 independent biological samples) vs cKO (n = 7 independent biological samples) mice.
- https://cdn.elifesciences.org/articles/66703/elife-66703-fig2-data5-v4.xlsx
Figure 2—figure supplement 1
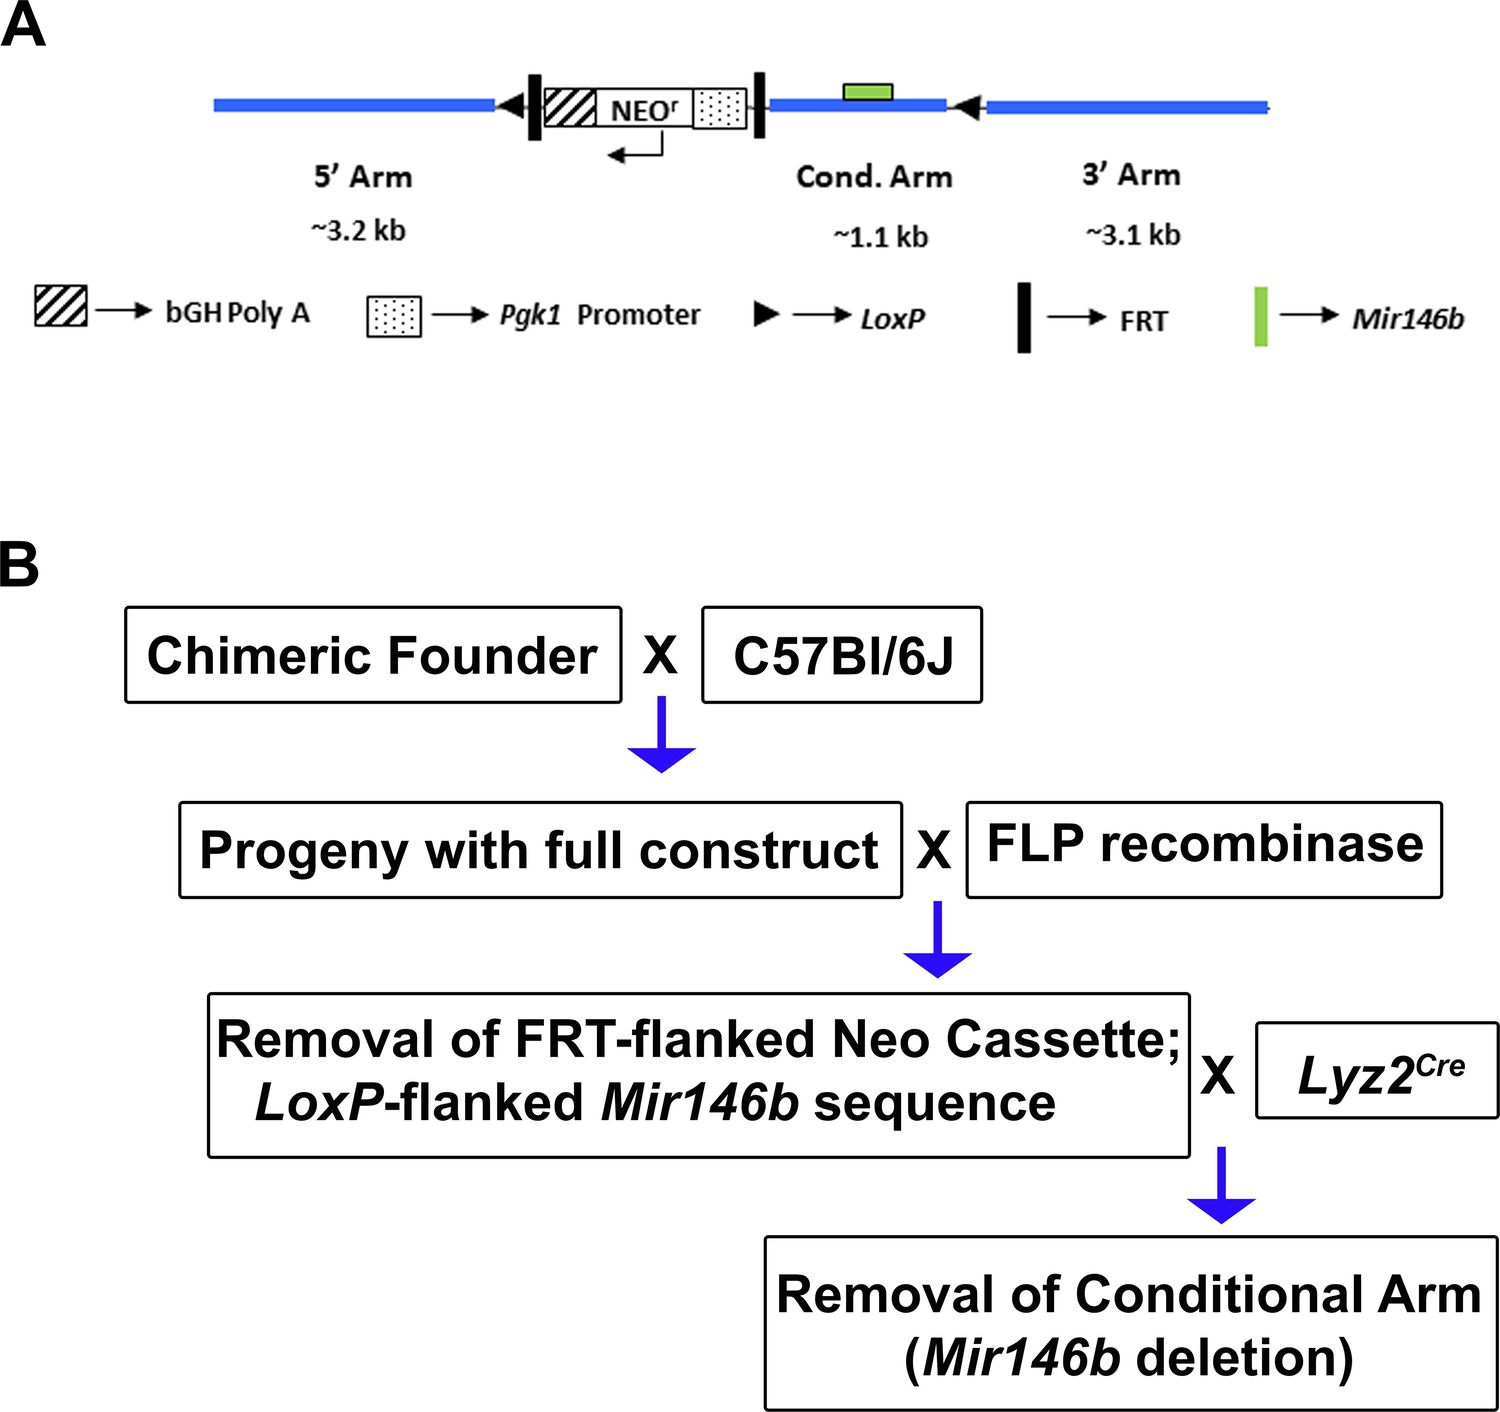
Generation of mice with conditional deletion of Mir146b in macrophages.
(A) Diagram of the construct utilized to generate Mir146b conditional knockout (cKO) mice and (B) the breeding scheme used to generate Lyz2Cre Mir146bflox/fox cKO mouse line.
Figure 3
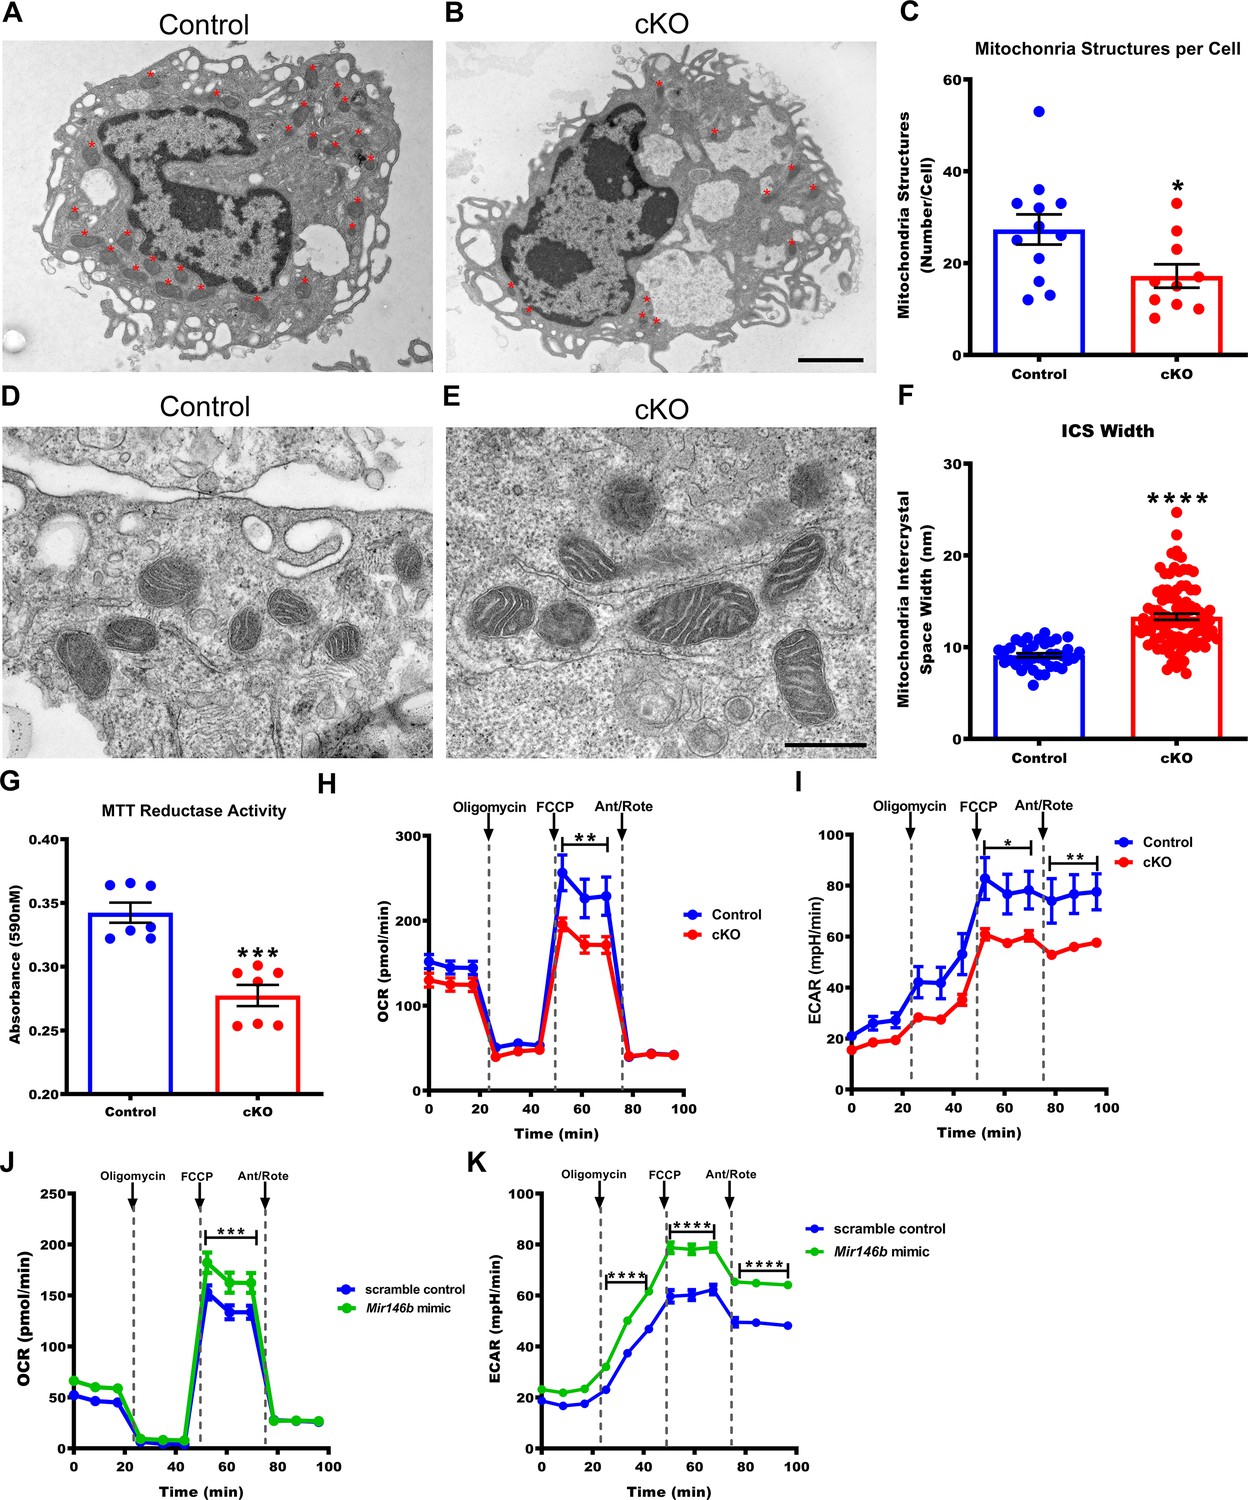
Macrophages deficient in Mir146b have abnormal mitochondria with decreased functional capacity.
(A) Representative electron micrographs from Control and (B) conditional knockout (cKO) thioglycollate-elicited macrophages (TGEMs) from young female mice. Red asterisks indicate mitochondrial organelles. Scale bar = 2 μm. (C) Quantification of the average mitochondrial number per TGEM (n = 12 vs n = 10; *p = 0.0318). (D) Representative high-magnification electron micrograph images of mitochondria from young female Control and (E) cKO TGEMs. Scale bar = 500 nm. (F) Quantification of the average macrophage mitochondria intermembrane space width from young female cKO vs Control (n = 37 vs n = 100; ****p<0.0001) TGEMs. (G) MTT (3-[4,5-dimethylthiazol-2-yl]−2,5 diphenyl tetrazolium bromide) reduction by TGEMs from young (6–12 weeks old) female cKO vs Control (n = 7 vs n = 7 mice; ***p = 0.0006) TGEMs. (H) Oxygen consumption rates over time for young female cKO and Control TGEMs from representative Seahorse XF MitoStress assay (one-way analysis of variance [ANOVA], n = 3 vs n = 4 mice [biological replicates]; ****p<0.0001; Bonferroni’s multiple comparison test carbonyl cyanide 4-(trifluoromethoxy) phenylhydrazone (FCCP), **p<0.01). (I) Extracellular acidification rates over time for young female cKO and Control TGEMs (one-way ANOVA, ****p<0.0001; n = 3 vs n = 4 mice [biological replicates]; Bonferroni’s multiple comparison test FCCP, *p<0.05; antimycin A/rotenone (Ant/Rote), **p<0.01). (J) Oxygen consumption rates over time for young female C57Bl/6J TGEMs overexpressing Mir146b vs scramble control (one-way ANOVA, ****p<0.0001; n = 6 vs n = 8 biological replicates; Bonferroni’s multiple comparison test FCCP, ***p<0.001). (K) Extracellular acidification rates over time for young female C57Bl/6J TGEMs overexpressing Mir146b vs scramble control (one-way ANOVA, ****p<0.0001; n = 6 vs n = 8 biological replicates; Bonferroni’s multiple comparison test oligomycin, ****p<0.0001; FCCP, ****p<0.0001; Ant/Rote, ****p<0.0001). Data represent mean ± SEM. For (C), (F), and (G), Mann-Whitney U-test was used for comparison between groups.
-
Figure 3—source data 1
Representative x5000 transmission electron microscopy (TEM) images of Control (WT) TGEMs.
- https://cdn.elifesciences.org/articles/66703/elife-66703-fig3-data1-v4.zip
-
Figure 3—source data 2
Representative x5000 TEM images of cKO TGEMs.
- https://cdn.elifesciences.org/articles/66703/elife-66703-fig3-data2-v4.zip
-
Figure 3—source data 3
Numerical values used in graphs from the number of mitochondrial structures per cell in Control (Cntl) (n = 12) vs cKO (n = 9) female TGEMs.
- https://cdn.elifesciences.org/articles/66703/elife-66703-fig3-data3-v4.xlsx
-
Figure 3—source data 4
Representative x25,000 TEM images of Control (WT) TGEMs.
- https://cdn.elifesciences.org/articles/66703/elife-66703-fig3-data4-v4.zip
-
Figure 3—source data 5
Representative x25,000 TEM images of cKO TGEMs.
- https://cdn.elifesciences.org/articles/66703/elife-66703-fig3-data5-v4.zip
-
Figure 3—source data 6
Numerical values used for graphs from measurements of intracrystal space width (nm) in TGEMs from female Control (WT) vs cKO TGEMs.
- https://cdn.elifesciences.org/articles/66703/elife-66703-fig3-data6-v4.xlsx
-
Figure 3—source data 7
Numerical values of absorbance at 590 nM used for graphs from the MTT assay of female Control (Cntl) (n = 7 mice) vs cKO (n = 7 mice) TGEMs.
- https://cdn.elifesciences.org/articles/66703/elife-66703-fig3-data7-v4.xlsx
-
Figure 3—source data 8
Numerical values used for graphs of the oxygen consumption rate (pmol/min) from Seahorse Mitostress Assay of TGEMs from female Control (n = 3 mice) vs cKO (n = 4 mice) TGEMs.
- https://cdn.elifesciences.org/articles/66703/elife-66703-fig3-data8-v4.xlsx
-
Figure 3—source data 9
Numerical values used for graphs of the extracellular acidification rate (mpH/min) from Seahorse Mitostress Assay of TGEMs from female Control (n = 3 mice) vs cKO (n = 4 mice) TGEMs.
- https://cdn.elifesciences.org/articles/66703/elife-66703-fig3-data9-v4.xlsx
-
Figure 3—source data 10
Numerical values used for graph of the oxygen consumption rate (pmol/min) from Seahorse Mitostress Assay of TGEMs from female Control transfected (n = 6) vs Mir146b overexpression (n = 8).
- https://cdn.elifesciences.org/articles/66703/elife-66703-fig3-data10-v4.xlsx
-
Figure 3—source data 11
Numerical values used for graphs of the extracellular acidification rate (mpH/min) from Seahorse Mitostress Assay of TGEMs from Control transfected (n = 6) vs Mir146b overexpression (n = 8).
- https://cdn.elifesciences.org/articles/66703/elife-66703-fig3-data11-v4.xlsx
Figure 4 with 2 supplements
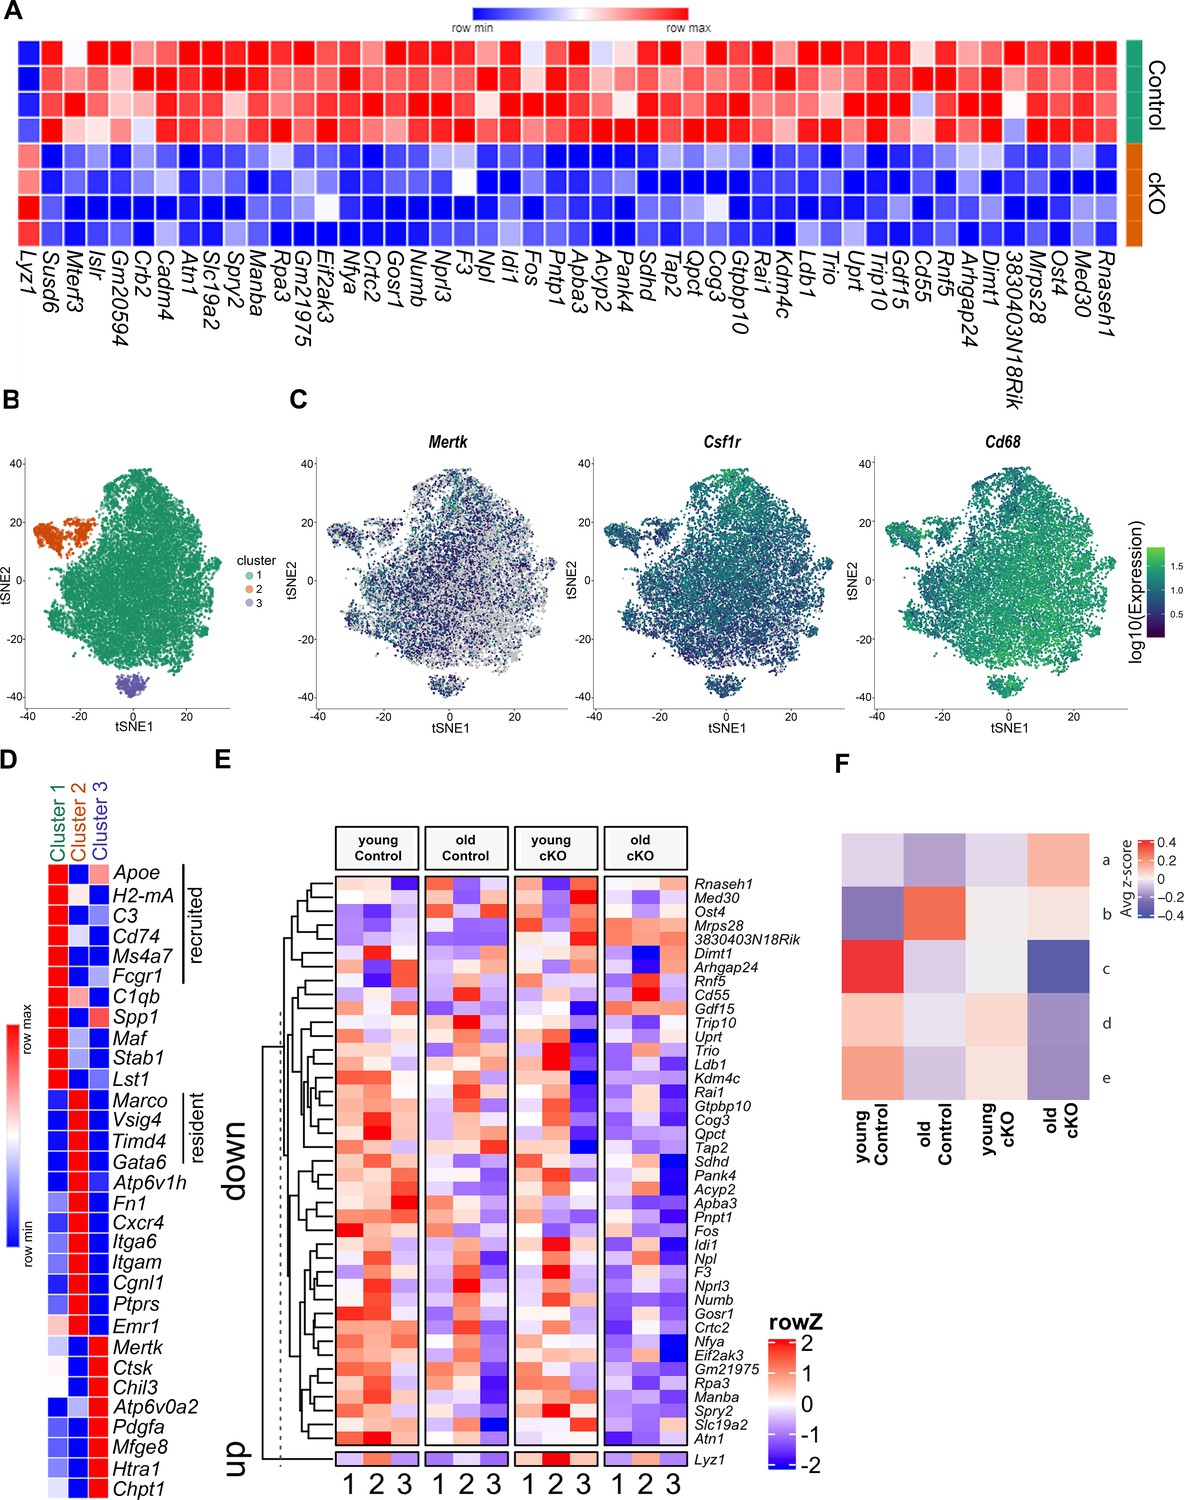
Differential gene expression in cKO TGEMs by RNA-seq and single-cell RNA-seq.
(A) Transcriptome heatmap representation of differentially expressed genes from bulk RNA sequencing (RNA-seq) analysis of thioglycollate-elicited macrophages (TGEMs) from 3-month-old female conditional knockout (cKO) or littermate Controls (cKO n = 4 vs Control n = 4 mice [biological replicates]). (B) Transcription reads from single-cell RNA-seq of TGEMs from 3-month (young)- and 17-month (old)-old female cKO mice and age-matched littermate Control mice overlaid on a t-distributed Stochastic Neighbor Embedding (tSNE) plot separate into three distinct clusters. (C) Expression of macrophage markers Mertk, Csfr1, and Cd68 overlaid on tSNE plots. (D) Heatmap comparison of resident, recruited, and activation markers across the three clusters. (E) Heat map distribution of reads from single-cell RNA-seq of genes found to be differentially expressed by bulk RNA-seq. (F) Mean row z-score across the four samples (young Control, old Control, young cKO, and old cKO) for each hierarchically defined pattern (a–e) of genes differentially expressed by cells within the main cluster, Cluster 1. Individual genes within each pattern are shown in the Figure 4—figure supplement 2 heatmap and are listed in table form in Supplementary file 1.
-
Figure 4—source data 1
DESeq2 result file used for creating heatmaps from bulk RNA-seq of TGEMs from female Control vs cKO mice.
- https://cdn.elifesciences.org/articles/66703/elife-66703-fig4-data1-v4.xlsx
-
Figure 4—source data 2
Normalized average expression of each expressed gene within the three clusters defined by scRNA-seq analysis of young Control, young cKO, old Control, and old cKO TGEMs from female mice.
- https://cdn.elifesciences.org/articles/66703/elife-66703-fig4-data2-v4.txt
-
Figure 4—source data 3
Genes from clustering results used for creating heatmaps from scRNA-seq of young Control, young cKO, old Control, and old cKO TGEMs from female mice.
- https://cdn.elifesciences.org/articles/66703/elife-66703-fig4-data3-v4.xlsx
Figure 4—figure supplement 1
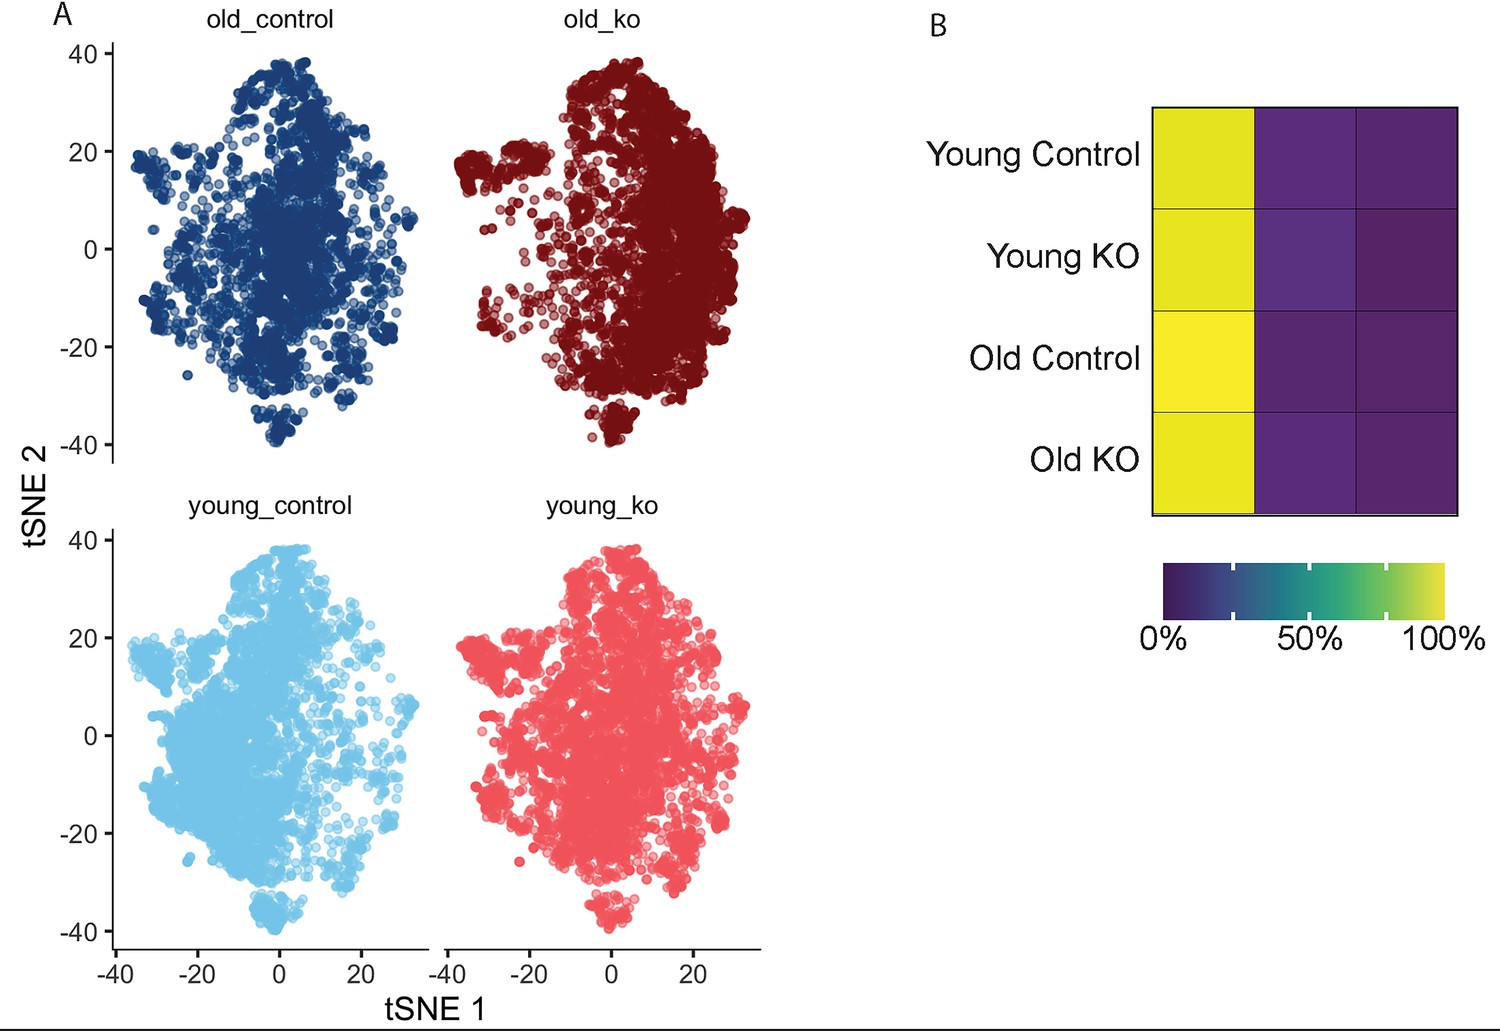
Single-cell RNA-seq analysis reveals a shift with physiologic age and/or deletion of Mir146b in murine macrophages.
(A) tSNE distribution of single-cell RNA reads by age (young [3 months] or old [17 months]) and genotype (control or KO). (B) Heatmap representation of expression by cluster shows that the majority of cells from all genotypes are from Cluster 1 (Figure 4b, green cluster).
Figure 4—figure supplement 2

Analysis of single-cell RNA-seq Cluster 1 reveals five transcriptionally distinct hierarchical subclusters.
Expression profile of genes differentially expressed across five subclusters (patterns a–e) between each of the four samples (young Control, old Control, young conditional knockout (cKO), and old cKO).
Author response image 1
Author response image 2
Author response image 3

Tables
Key resources table
| Reagent type (species) or resource | Designation | Source or reference | Identifiers | Additional information |
|---|---|---|---|---|
| Gene (Mus musculus) | Mir146b | Ensembl | ENSMUSG00000070127 | |
| Strain, strain background (M. musculus) | Mir146bflox/flox | This paper (see'Materials and methods' and Figure 2—figure supplement 1) | ENSMUSG00000070127 | Mouse line |
| Strain, strain background (M. musculus, female) | C57Bl/6 | NIA Aged Rodent Colony | C57BL/6 RRID:SCR_007317 | |
| Strain, strain background (M. musculus, female) | C57Bl/6 | The Jackson Laboratory | 000664 RRID:IMSR_JAX:000664 | |
| Strain, strain background (M. musculus, female) | Lyz2Cre | The Jackson Laboratory | 004781 RRID:IMSR_JAX:004781 | Mouse line |
| Cell line (M. musculus) | Primary thioglycollate-elicited macrophages | This paper (see 'Materials and methods') | C57Bl/6, 3–30 months; Control or cKO, 3–17 months | Freshly isolated |
| Cell line (M. musculus) | Primary Bone Marrow-Derived Macrophages | This paper (see 'Materials and methods') | C57Bl/6, 3–30 months; Control or cKO, 3 months | Freshly isolated |
| Transfected construct (M. musculus) | mirVana Mir146b inhibitor | Life Technologies | 4464084 | |
| Transfected construct (M. musculus) | mirVana negative control | Life Technologies | 4464076 | |
| Transfected construct (M. musculus) | miRCURY LNA Mir146b mimic | Qiagen | Cat # 3391173 GeneGlobe ID: YM00472354-ABD | 5’-UGAGAACUGAAUUCCAUAGGCU-3’ |
| Transfected construct (M. musculus) | miRCURY LNA negative control A | Qiagen | Cat# 300611-04 | 5’-/F6-FAM/AACACGTCTATACGC-3’ |
| Sequence-based reagent | hsa-Mir146b-5p | Qiagen | Cat# 339306 GeneGlobe ID: YP00204553 | miRNA expression |
| Sequence-based reagent | hsa-Mir146a-5p | Qiagen | Cat# 339306 GeneGlobe ID: YP00204688 | miRNA expression |
| Sequence-based reagent | U6 snRNA | Qiagen | Cat# 339306 GeneGlobe ID: YP00203907 | miRNA expression |
| Sequence-based reagent | hsa-Mir-15a-5p | Qiagen | Cat# 339306 GeneGlobe ID: YP00204066 | miRNA expression |
| Sequence-based reagent | hsa-Mir-18a-5p | Qiagen | Cat# 339306 GeneGlobe ID: YP00204207 | miRNA expression |
| Sequence-based reagent | hsa-Mir-22-5p | Qiagen | Cat# 339306 GeneGlobe ID: YP00204255 | miRNA expression |
| Sequence-based reagent | hsa-Mir-29a-5p | Qiagen | Cat# 339306 GeneGlobe ID: YP00204430 | miRNA expression |
| Sequence-based reagent | mmu-Mir-362-5p | Qiagen | Cat# 339306 GeneGlobe ID: YP00205073 | miRNA expression |
| Sequence-based reagent | hsa-Mir-423-5p | Qiagen | Cat# 339306 GeneGlobe ID: YP00205624 | miRNA expression |
| Sequence-based reagent | QuantiGene Mir146b-5p | Affymetrix | Cat# SM-10013-01 | miRNA expression |
| Sequence-based reagent | QuantiGene U6 | Affymetrix | Cat# SR-19005-01 | miRNA expression |
| Sequence-based reagent | Universal Neo F | This paper (see Supplementary file 2) | Genotyping forward primer | TGC TCC TCG CGA GAA AGT ATC CAT CAT GGC |
| Sequence-based reagent | Universal Neo R | This paper (see Supplementary file 2) | Genotyping reverse primer | CGC CAA GCT CTT CAG CAA TAT CAC GGG TAG |
| Sequence-based reagent | Mir146b Neo F | This paper (see Supplementary file 2) | Genotyping forward primer | ATA TCT GGC CCA CCA GGA ACA CAT |
| Sequence-based reagent | Mir146b Neo R | This paper (see Supplementary file 2) | Genotyping reverse primer | AGC CTC TGT GTG TGC TTG TGA CAT |
| Sequence-based reagent | LoxP F | This paper (see Supplementary file 2) | Genotyping forward primer | TAA CGG CAT TAG CCA CCA CCT TCA |
| Sequence-based reagent | LoxP R | This paper (see Supplementary file 2) | Genotyping reverse primer | TGG GTT ATG TAG GGA TCC TGG GTT |
| Sequence-based reagent | Flp/o FWD | This paper (see Supplementary file 2) | Genotyping forward primer | ATA GCA GCT TTG CTC CTT CG |
| Sequence-based reagent | Flp/o REV | This paper (see Supplementary file 2) | Genotyping reverse primer | TGG CTC ATC ACC TTC CTC TT |
| Sequence-based reagent | Flp/o Internal FWD | This paper (see Supplementary file 2) | Genotyping forward primer | CTA GGC CAC AGA ATT GAA AGA TCT |
| Sequence-based reagent | Flp/o Internal Rev | This paper (see Supplementary file 2) | Genotyping reverse primer | GTA GGT GGA AAT TCT AGC ATC ATC C |
| Sequence-based reagent | Lyz2Cre F | This paper (see Supplementary file 2) | Genotyping forward primer | GTA GGT GGA AAT TCT AGC ATC ATC C |
| Sequence-based reagent | Lyz2Cre R | This paper (see Supplementary file 2) | Genotyping reverse primer | TGG GTT ATG TAG GGA TCC TGG GTT |
| Sequence-based reagent | Actinb gene expression assay | Life Technologies | Cat# 4352933E Assay ID: Mm00607939_s1 | mRNA expression |
| Sequence-based reagent | Gapdh gene expression assay | Life Technologies | Cat# 4331182 Assay ID: Mm99999915_g1 | mRNA expression |
| Sequence-based reagent | Nos2 gene expression assay | Life Technologies | Cat# 4331182 Assay ID: Mm00440502_m1 | mRNA expression |
| Sequence-based reagent | Mmp9 gene expression assay | Life Technologies | Cat# 4331182 Assay ID: Mm00442991_m1 | mRNA expression |
| Sequence-based reagent | Il6 gene expression assay | Life Technologies | Cat# 4331182 Assay ID: Mm00446191_m1 | mRNA expression |
| Sequence-based reagent | Il1b gene expression assay | Life Technologies | Cat# 4331182 Assay ID: Mm01336189_m1 | mRNA expression |
| Sequence-based reagent | Ccl2 gene expression assay | Life Technologies | Cat# 4331182 Assay ID: Mm00478593_m1 | mRNA expression |
| Sequence-based reagent | Cd163 gene expression assay | Life Technologies | Cat# 4331182 Assay ID: Mm00474091_m1 | mRNA expression |
| Sequence-based reagent | Arg1 gene expression assay | Life Technologies | Cat# 4331182 Assay ID: Mm00475988_m1 | mRNA expression |
| Sequence-based reagent | Il10 gene expression assay | Life Technologies | Cat# 4331182 Assay ID: Mm00439614_m1 | mRNA expression |
| Chemical compound, drug | 3-[4,5-dimethylthiazol-2-yl]-2,5 diphenyl tetrazolium bromide | Millipore-Sigma | Cat# M5655 | MTT |
| Chemical compound, drug | Thioglycollate | Millipore-Sigma | Cat# T9032 | |
| Antibody | CD11b (Rat Monoclonal; (M1/70), eFluor 450) | ThermoFisher | 48-0112-82 RRID:AB_1582236 | Flow (1:100) |
| Antibody | F4/80 (Rat Monoclonal; (BM8), APC) | ThermoFisher | 17-4801-82 RRID:AB_2784648 | Flow (1:100) |
| Commercial assay or kit | RNeasy Mini Kit | Qiagen | Cat# 74104 | RNA extraction |
| Commercial assay or kit | mirVANA RNA Isolation kit | Life Technologies | Cat# AM1560 | RNA extraction |
| Commercial assay or kit | QuantiGene 2.0 miRNA Assay | Affymetrix | Cat# QS0008 | |
| Commercial assay or kit | miRCURY LNA RT kit | Qiagen | Cat# 339340 | |
| Commercial assay or kit | High Capacity cDNA Reverse Transcription Kit | Life Technologies | Cat# 4368813 | |
| Commercial assay or kit | ApopTag Fluorescein In Situ TUNEL labeling Kit | Millipore-Sigma | Cat# S7110 | |
| Commercial assay or kit | Seahorse XF Cell Mito Stress test kit | Agilent Technologies | Cat# 103708-100 | |
| Software, algorithm | ATM Image Capture Engine V602 software | Advanced Microscopy Techniques | ||
| Software, algorithm | Cofactor EXP software package | CoFactor Genomics | ||
| Software, algorithm | STAR aligner | GitHub | RRID:SCR_004463 | |
| Software, algorithm | Quant3p | GitHub | RRID:SCR_021236 | |
| Software, algorithm | Phantasus | Bioconductor | RRID:SCR_006442 | |
| Software, algorithm | Cellranger | 10x Genomics | RRID:SCR_017344 | |
| Software, algorithm | Monocle3 | GitHub | RRID:SCR_018685 | |
| Software, algorithm | Graphpad Prism | Graphpad | RRID:SCR_002789 | |
| Other | TopCount NTX counter | Perkin Elmer | ||
| Other | Spark multi-mode plate reader | Tecan | ||
| Other | Seahorse XF96 Extracellular Flux Analyzer | Agilent Technologies | RRID:SCR_013575 | |
| Other | StepOne Plus Real-Time PCR System | Life Technologies | RRID:SCR_015805 | |
| Other | Viia 7 Real-Time PCR System | Life Technologies | RRID:SCR_019582 | |
| Other | Illumina GAII sequencing platform | CoFactor Genomics | ||
| Other | Illumina HiSeq2500 sequencing platform | Centre for Applied Genomics; SickKids | RRID:SCR_001840 | |
| Other | NovaSeq S4 sequencing platform | GTAC; Washington University | RRID:SCR_001030 | |
| Other | BD FACSCanto Flow Cytometry System | BD Biosciences | RRID:SCR_018055 |
Additional files
-
Supplementary file 1
Genes associated with each subcluster pattern from scRNA-seq analysis, graphically represented in Figure 4—figure supplement 2.
- https://cdn.elifesciences.org/articles/66703/elife-66703-supp1-v4.docx
-
Supplementary file 2
Primers used for genotyping.
- https://cdn.elifesciences.org/articles/66703/elife-66703-supp2-v4.docx
-
Transparent reporting form
- https://cdn.elifesciences.org/articles/66703/elife-66703-transrepform-v4.docx
Download links
A two-part list of links to download the article, or parts of the article, in various formats.
Downloads (link to download the article as PDF)
Open citations (links to open the citations from this article in various online reference manager services)
Cite this article (links to download the citations from this article in formats compatible with various reference manager tools)
Loss of Mir146b with aging contributes to inflammation and mitochondrial dysfunction in thioglycollate-elicited peritoneal macrophages
eLife 10:e66703.
https://doi.org/10.7554/eLife.66703


