TRPM7 is critical for short-term synaptic depression by regulating synaptic vesicle endocytosis
- Department of Biological Sciences, University of Illinois at Chicago, United States
- School of Life Science, Jiangxi Science & Technology Normal University, China
- Department of Chemistry, University of Illinois at Chicago, United States
- Department of Biological Sciences, University of North Texas at Dallas, United States
- Department of Anatomy and Cell Biology, University of Illinois at Chicago, United States
Figures
Figure 1 with 4 supplements
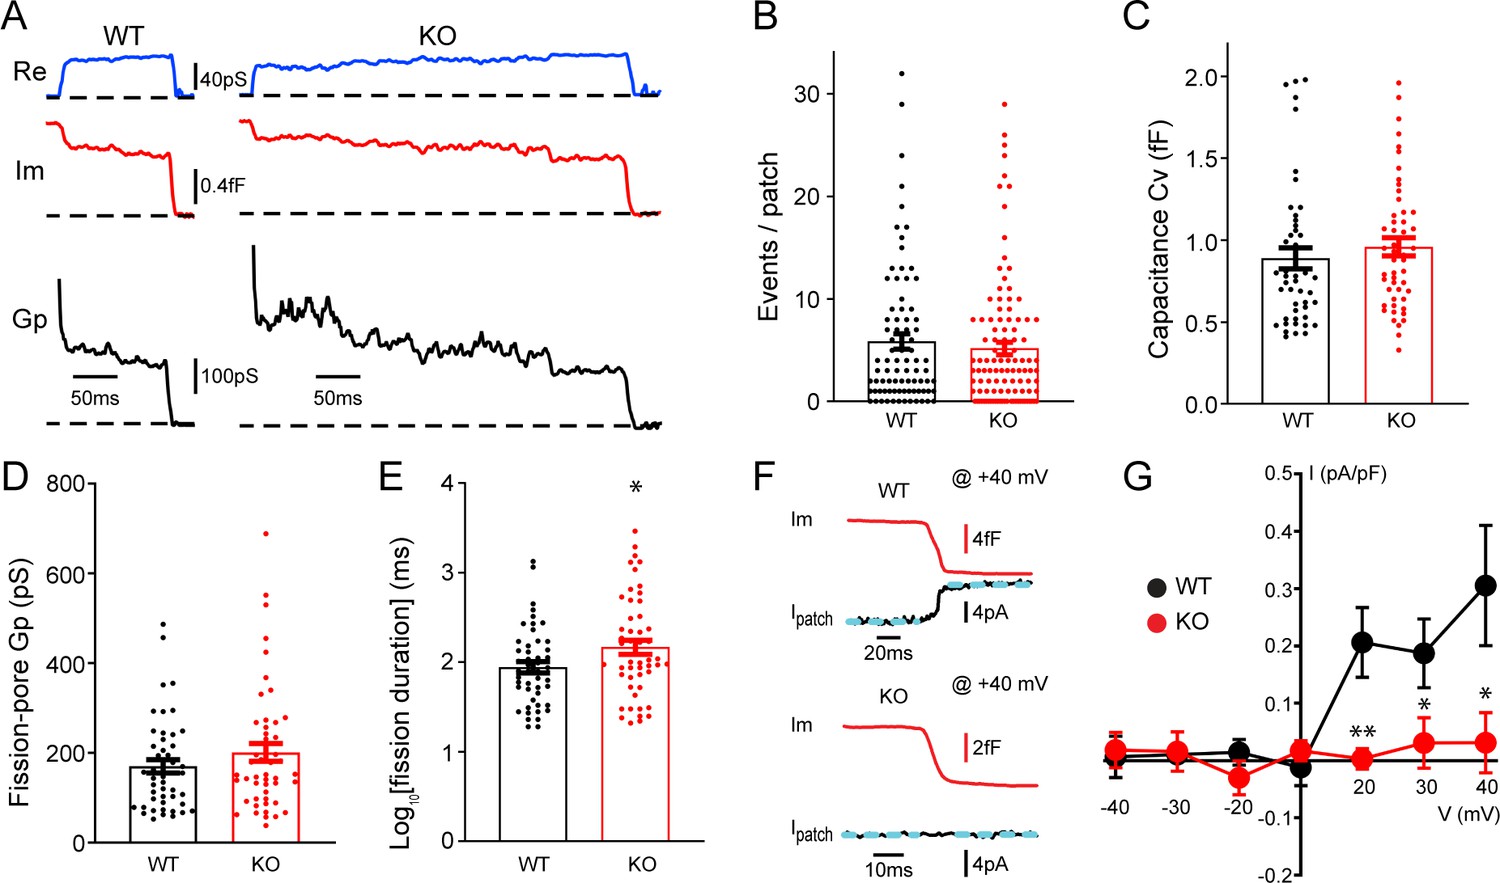
Transient receptor potential melastatin 7 (TRPM7) is important for endocytic fission during endocytosis in chromaffin cells.
(A) Representative endocytic events, as membrane conductance (Re), membrane capacitance (Im), and the fission-pore conductance (Gp), in wild-type (WT) and TRPM7 knockoout (KO) cells. (B–E) The number of endocytic events (WT: n = 83 cells; KO: n = 110 cells) (B), the capacitance Cv of endocytic vesicles (C), and the fission-pore Gp (D) were statistically comparable between WT and KO cells; the log-transformed fission-pore duration (E) was significantly increased in KO cells (WT: n = 48 events; KO: n = 50 events). (F) Representative membrane capacitance (Im) and patch membrane current (Ipatch) traces at +40 mV in WT and KO cells. Dashed lines in cyan represent linear fitting lines before or after capacitance drop induced by endocytosis. (G) The current-voltage relationship indicating that the endocytosis-associated current drift is reduced at positive membrane potentials in TRPM7 KO cells. The x-axis represents voltages across the patch membrane. n is 12, 9, 13, 12, 13, 8, and 11 for membrane voltages at –40, –30, –20, 0, +20, +30, and +40 mV in WT cells, and 12, 7, 8, 10, 11, 13, and 11 for membrane voltages at –40, –30, –20, 0, +20, +30, and +40 mV in KO cells, respectively. *p < 0.05 and **p < 0.01, unpaired two-tailed Student’s t-test.
-
Figure 1—source data 1
TRPM7 and single vesicle endocytosis in chromaffin cells.
- https://cdn.elifesciences.org/articles/66709/elife-66709-fig1-data1-v2.xlsx
Figure 1—figure supplement 1
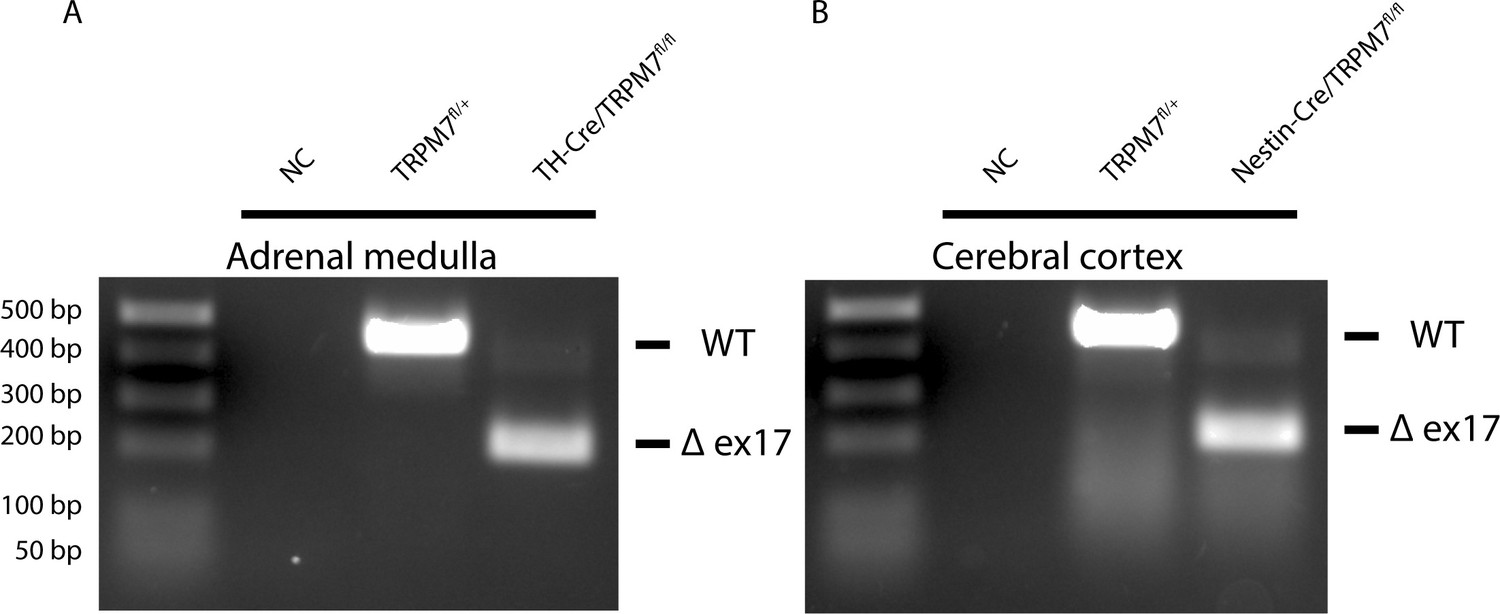
Transient receptor potential melastatin 7 (TRPM7) depletion in adrenal medulla and cerebral cortex of the brain and adrenal medulla.
(A–B) RT-PCR of total RNA from adrenal medulla (A) and cerebral cortex (B) showing presence or absence of exon 17 of trpm7 in the differentially sized amplicons.
Figure 1—figure supplement 2
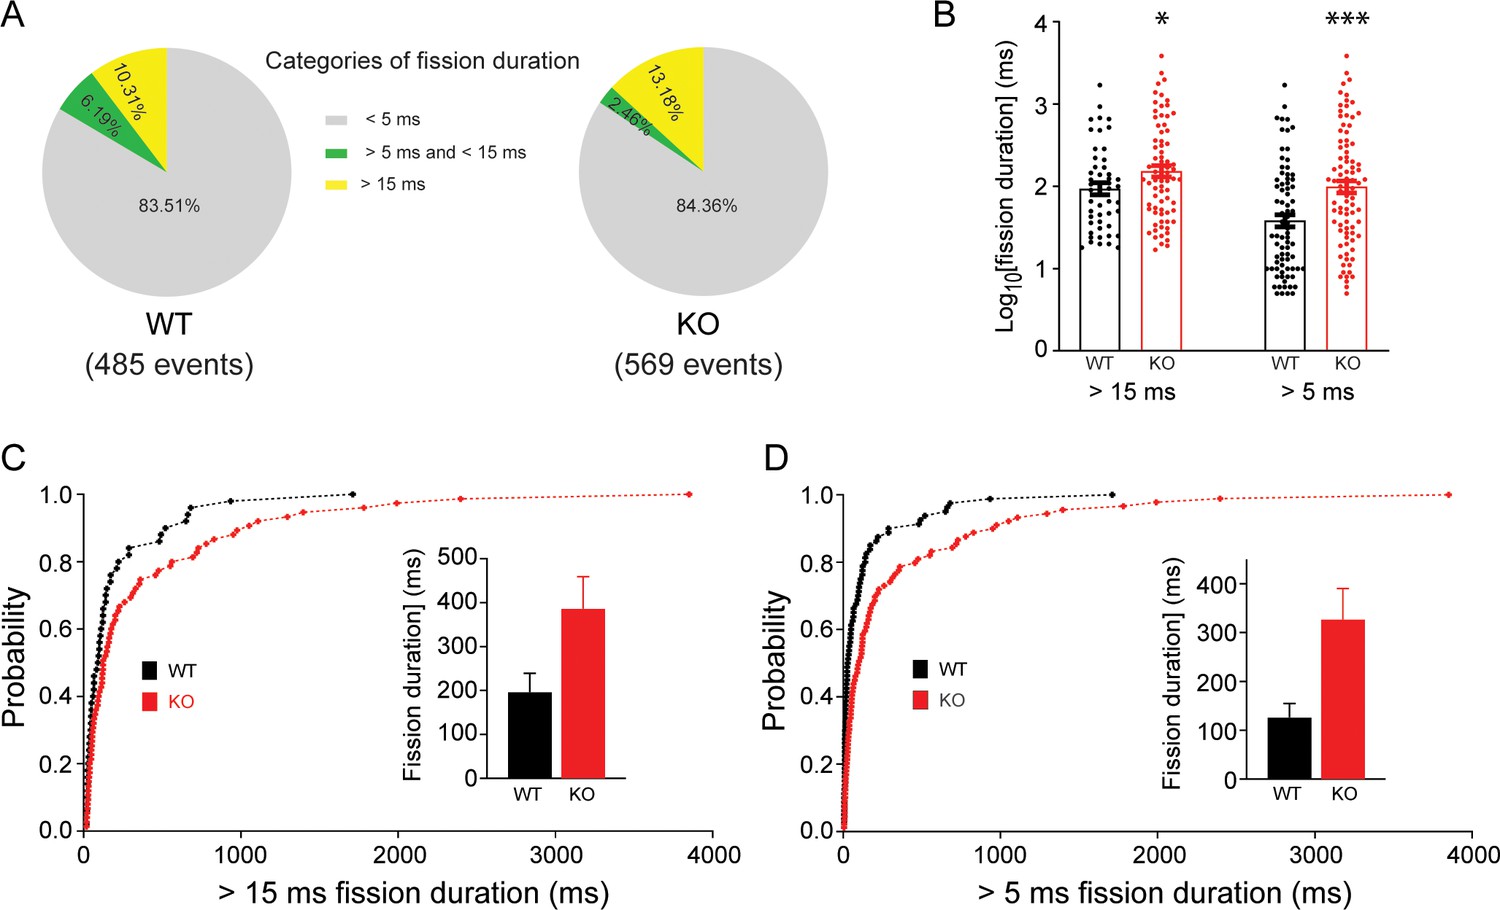
Transient receptor potential melastatin 7 (TRPM7) is important for endocytic kinetics in chromaffin cells.
(A) Pie chart showing percentages of endocytic events with their fission-pore durations in three different ranges (<5 ms; >5 ms, and <15 ms; >15 ms) from wild-type (WT) (left) and knockout (KO) chromaffin cells (right). (B) The log-transformed fission-pore durations were significantly increased in KO cells, with the inclusion of endocytic events with the fission-pore duration >5 ms (left) or 15 ms (right). (C–D) Cumulative distributions of fission-pore durations > 5 ms (C) or 15 ms from WT and KO cells (D). Means with standard error of endocytic events with duration >15 ms or 5 ms are shown in inserts in (C) and (D), respectively. *p < 0.05 and ***p < 0.001, unpaired two-tailed Student’s t-test.
-
Figure 1—figure supplement 2—source data 1
Increases in the fission-pore duration in KO cells.
- https://cdn.elifesciences.org/articles/66709/elife-66709-fig1-figsupp2-data1-v2.xlsx
Figure 1—figure supplement 3
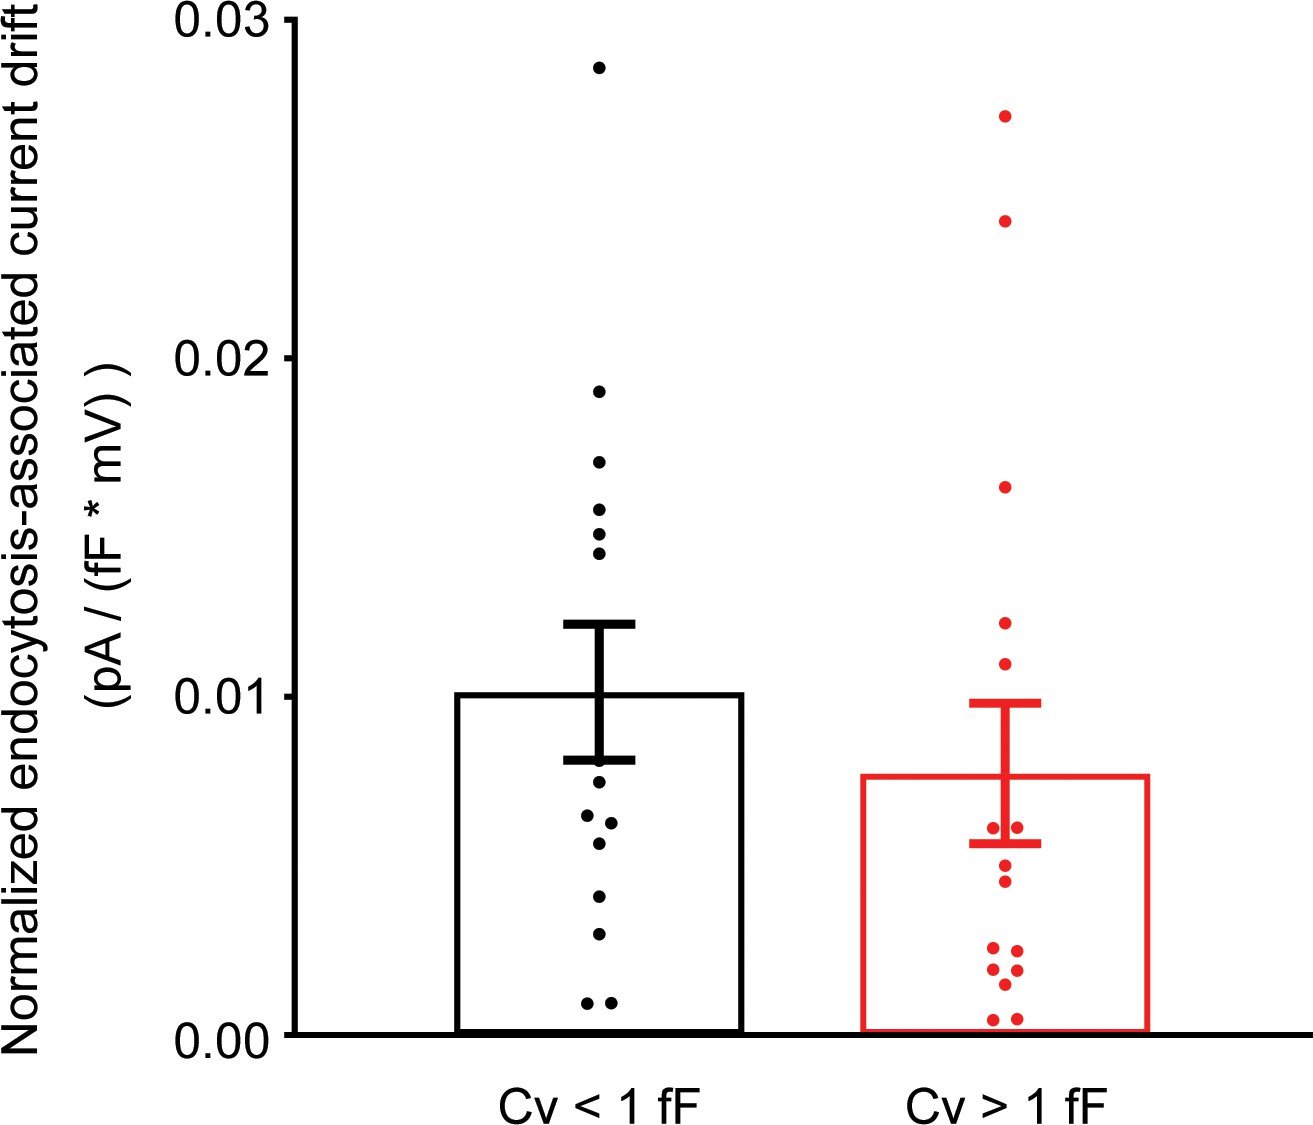
Endocytosis-associated current drift is independent of the capacitance size of endocytic events.
Endocytosis-associated current drifts recorded at all positive membrane potentials from Figure 1G were pooled and categorized into two groups based on their capacitance size ( >1 fF vs. <1 fF). Endocytosis-associated current drifts as shown in Figure 1G were normalized to membrane potentials. Unpaired two-tailed Student’s t-test.
-
Figure 1—figure supplement 3—source data 1
Endocytic vesicle size and endocytosis-associated current drift.
- https://cdn.elifesciences.org/articles/66709/elife-66709-fig1-figsupp3-data1-v2.xlsx
Figure 1—figure supplement 4
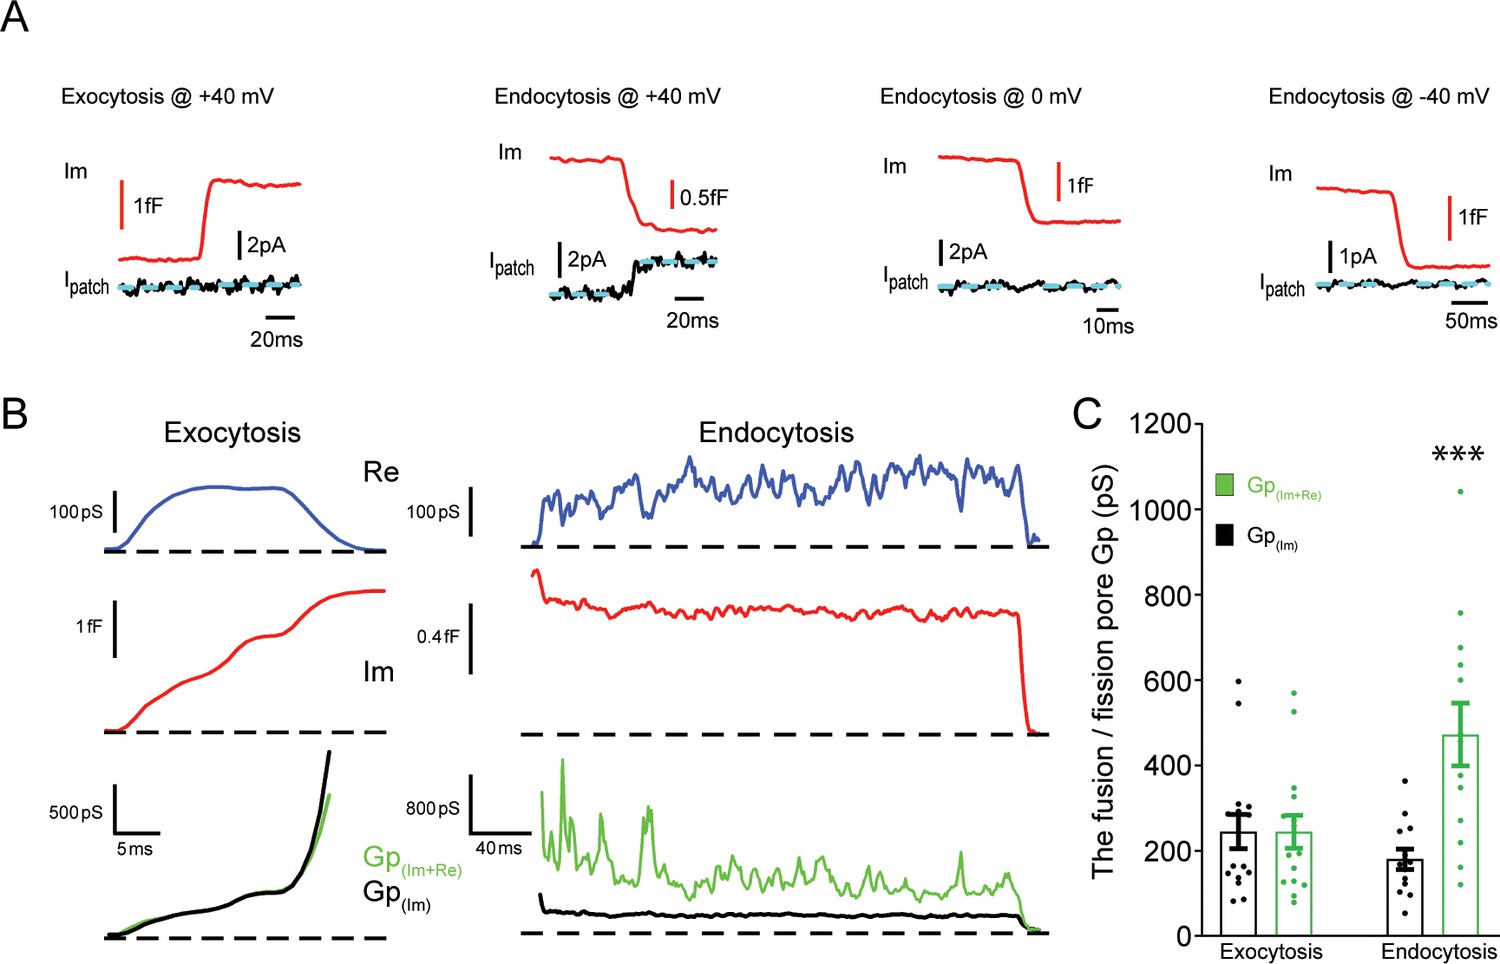
An ionic current is specifically associated with single vesicle endocytosis.
(A) Representative membrane capacitance (Im) and patch membrane current (Ipatch) traces for exocytosis or endocytosis at the indicated membrane potentials. Dashed lines in cyan represent fitting line before or after capacitance increase for exocytosis or decrease for endocytosis. (B) Representative exocytic (left) and endocytic (right) events shown as (from top down) membrane conductance (Re), capacitance (Im), and pore conductance (Gp). Gp(Im+Re) (green) is calculated from both membrane conductance and capacitance traces and Gp(Im) (black) is calculated from the capacitance trace, as indicated in Materials and methods. Dashed lines represent the baselines. (C) The statistical analysis of Gp(Im+Re) and Gp(Im) for exocytosis and endocytosis indicates the presence of an extra conductance and thus an ionic current associated with endocytosis but not exocytosis (Exo: p = 0.99, n = 15; Endo: p < 0.001, n = 13). Paired two-tailed Student’s t-test.
-
Figure 1—figure supplement 4—source data 1
Ionic current drifts associated with endocytosis but not exocytosis.
- https://cdn.elifesciences.org/articles/66709/elife-66709-fig1-figsupp4-data1-v2.xlsx
Figure 2 with 1 supplement
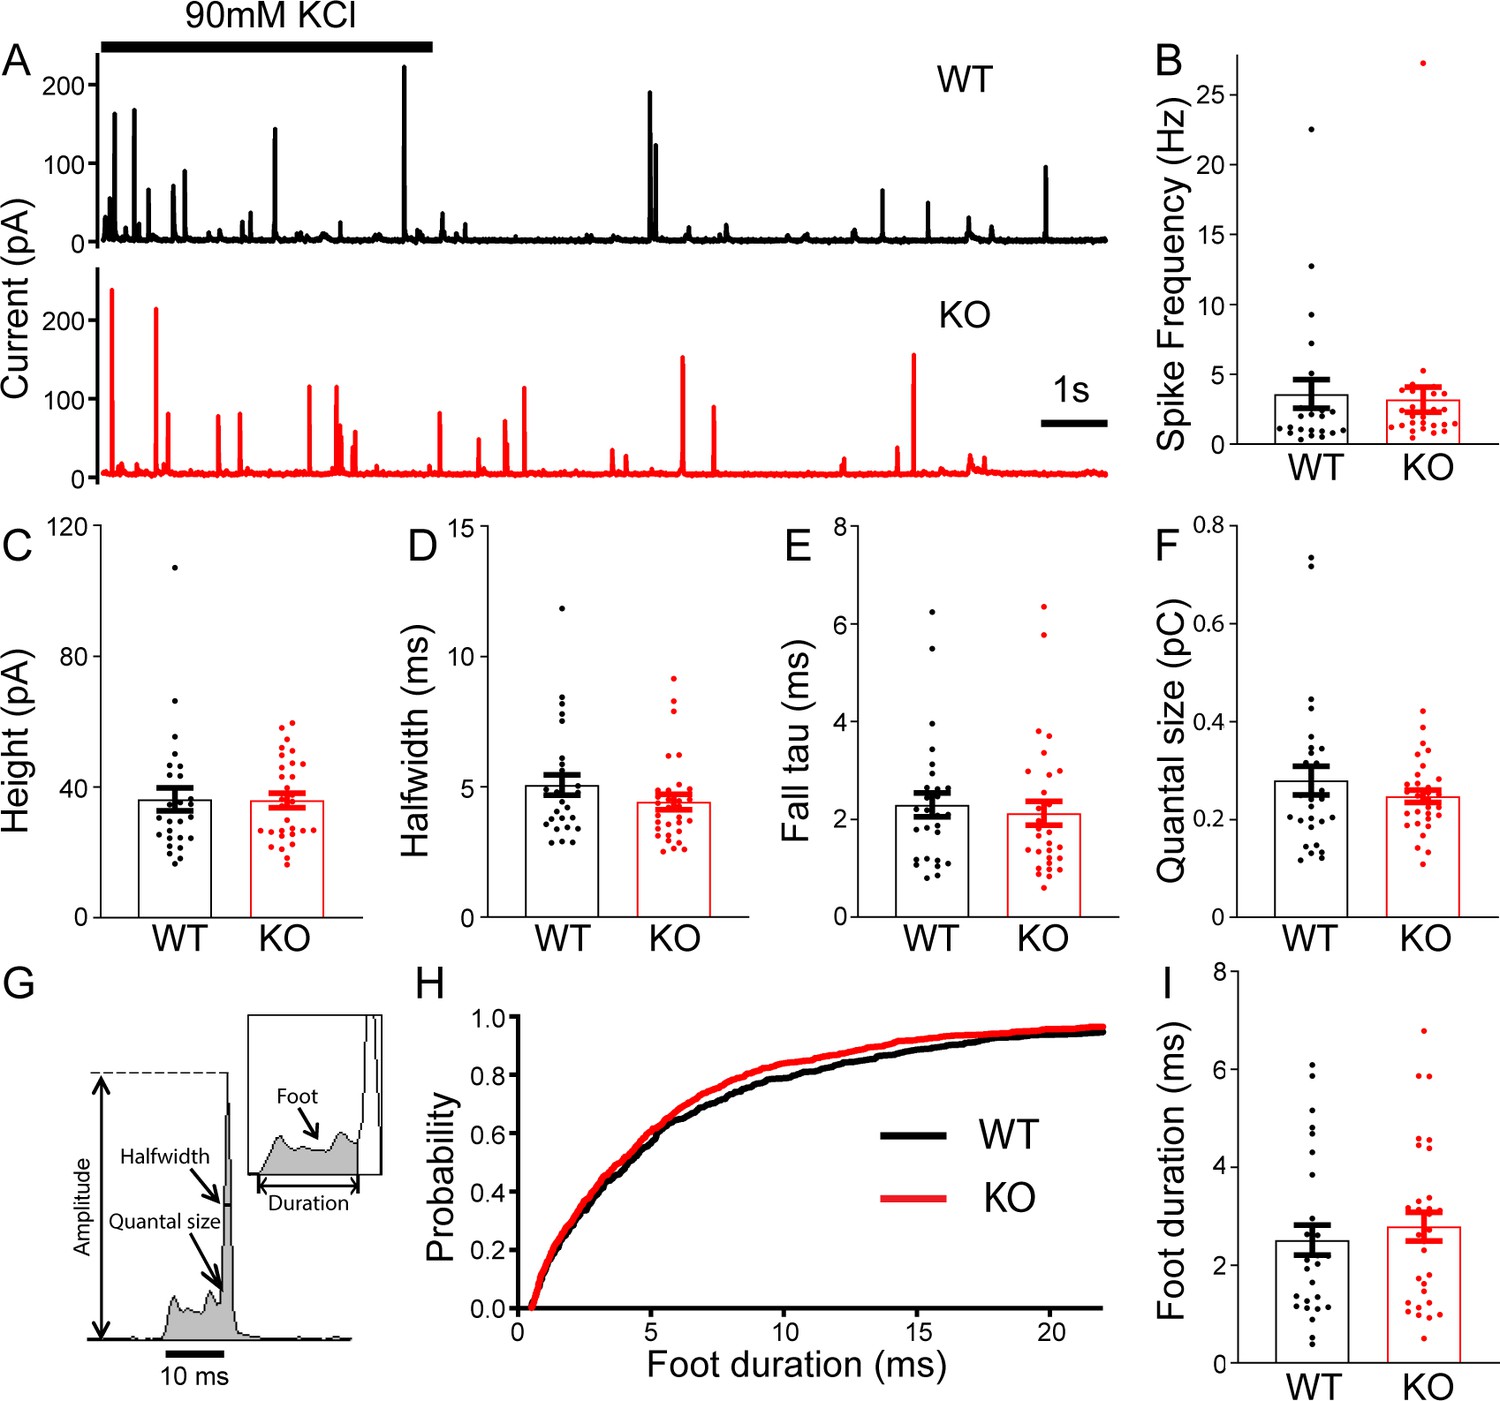
No change in large dense-core vesicles (LDCVs) exocytosis in transient receptor potential melastatin 7 (TRPM7) knockout (KO) chromaffin cells detected by carbon fiber amperometry.
(A) Amperometrical detection of catecholamine release from wild-type (WT) (upper) and KO (lower) chromaffin cells stimulated with 90 mM KCl for 5 s. Each amperometrical spike represents release from an individual LDCV. (B–F) No differences between WT (n = 28) and TRPM7 KO (n = 31) cells in a variety of amperometric parameters, such as spike frequency (B), height (C), halfwidth (D), the exponential time constant of falling phase (E), and quantal size (F). (G) Diagram of the parameters analyzed in amperometric spikes. (H–I) Analysis of foot duration. Normalized cumulative distributions of all events in all cells (WT: n = 482; KO: n = 642) (H) and average of median values obtained from individual WT (n = 28) and KO (n = 31) cells (I). Unpaired two-tailed Student’s t-test.
-
Figure 2—source data 1
No change in exocytosis in KO chromaffin cells.
- https://cdn.elifesciences.org/articles/66709/elife-66709-fig2-data1-v2.xlsx
Figure 2—figure supplement 1
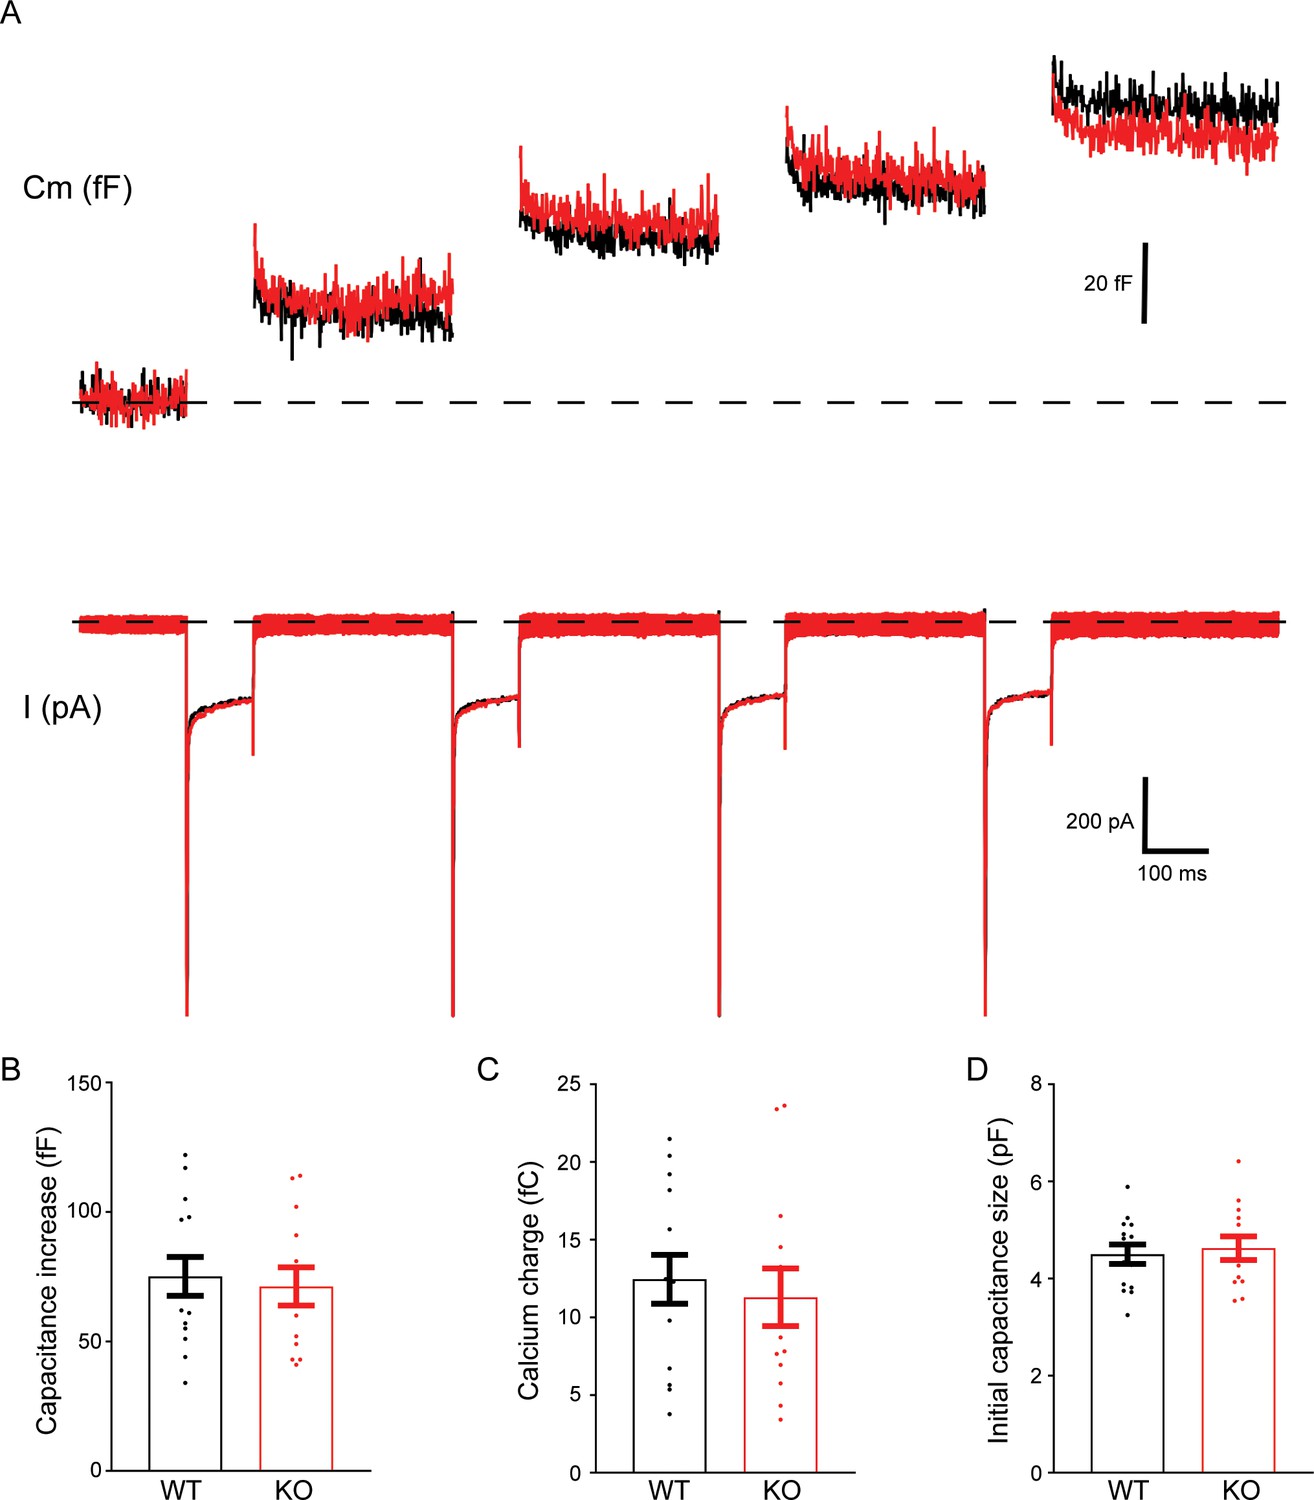
No change in exocytosis in transient receptor potential melastatin 7 (TRPM7) knockout (KO) chromaffin cells measured by whole-cell capacitance recordings.
(A) Changes in capacitance (Cm, upper trace) and Ca2+ current (I, lower trace) from representative wild-type (WT) (black) and TRPM7 KO (red) chromaffin cells were simultaneously recorded in response to four 100 ms depolarizations to 0 mV. The dashed lines indicate baselines. (B–D) There was no difference in capacitance increase induced by membrane depolarizations (B), Ca2+ influx (C), and the initial capacitance size of cells prior to membrane depolarizations (D) between WT and TRPM7 KO cells.
-
Figure 2—figure supplement 1—source data 1
Whole cell capactiance recordings in WT and KO cells.
- https://cdn.elifesciences.org/articles/66709/elife-66709-fig2-figsupp1-data1-v2.xlsx
Figure 3 with 6 supplements
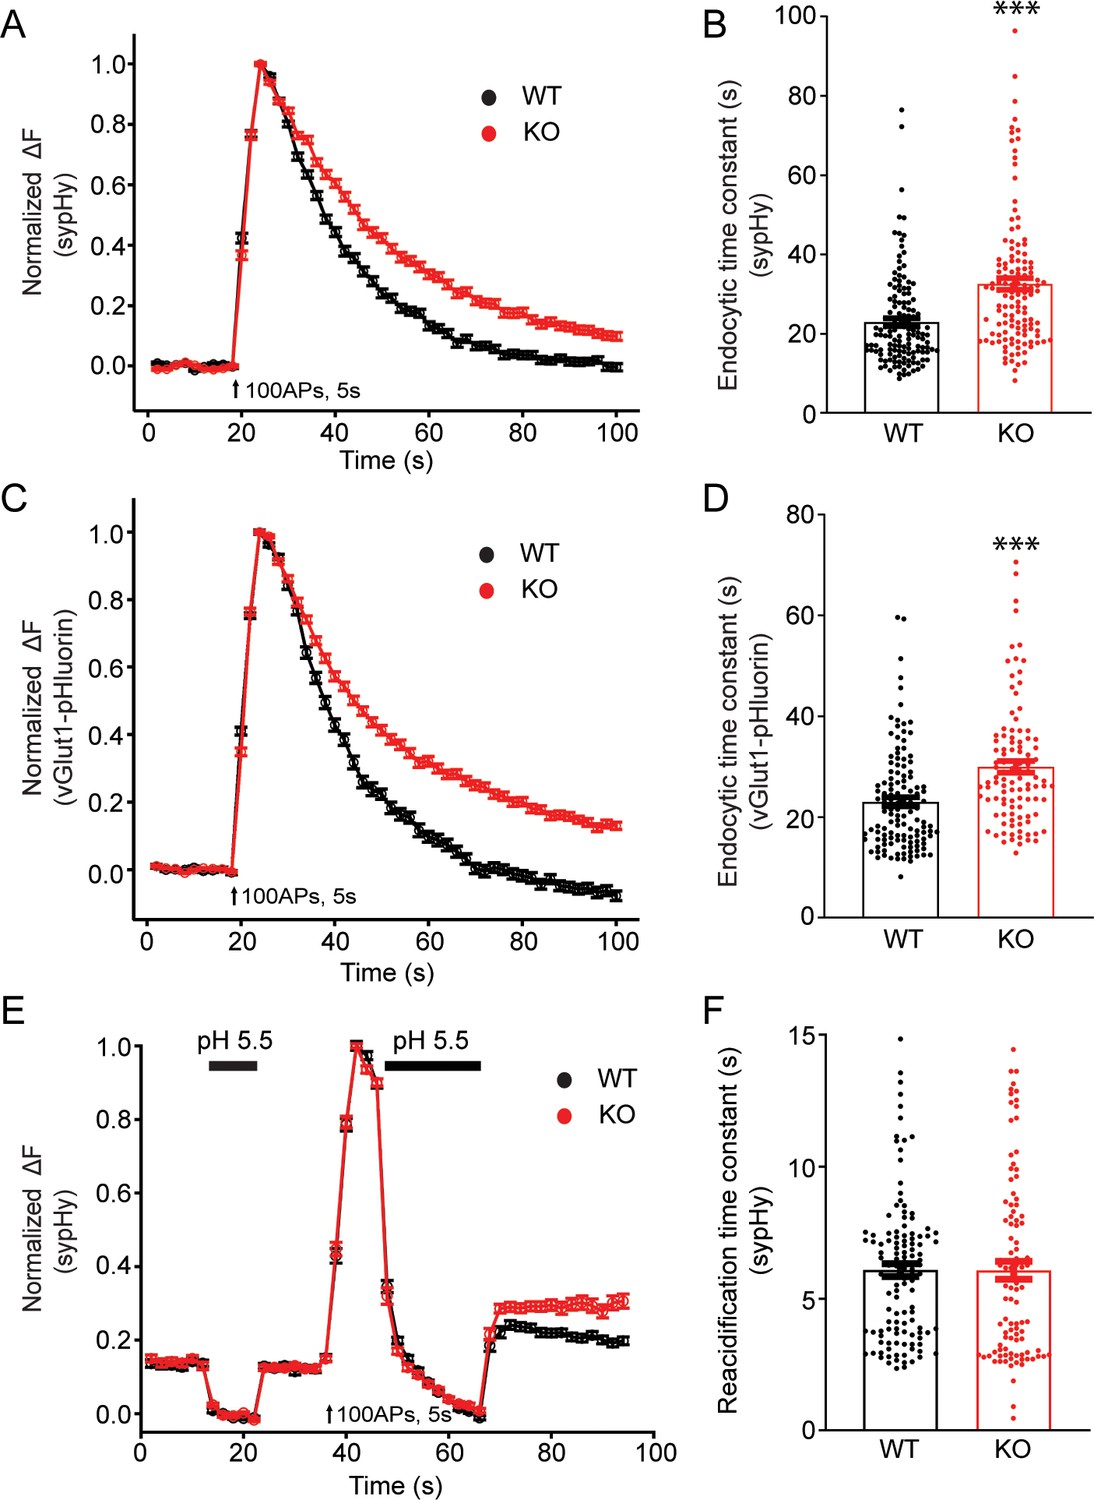
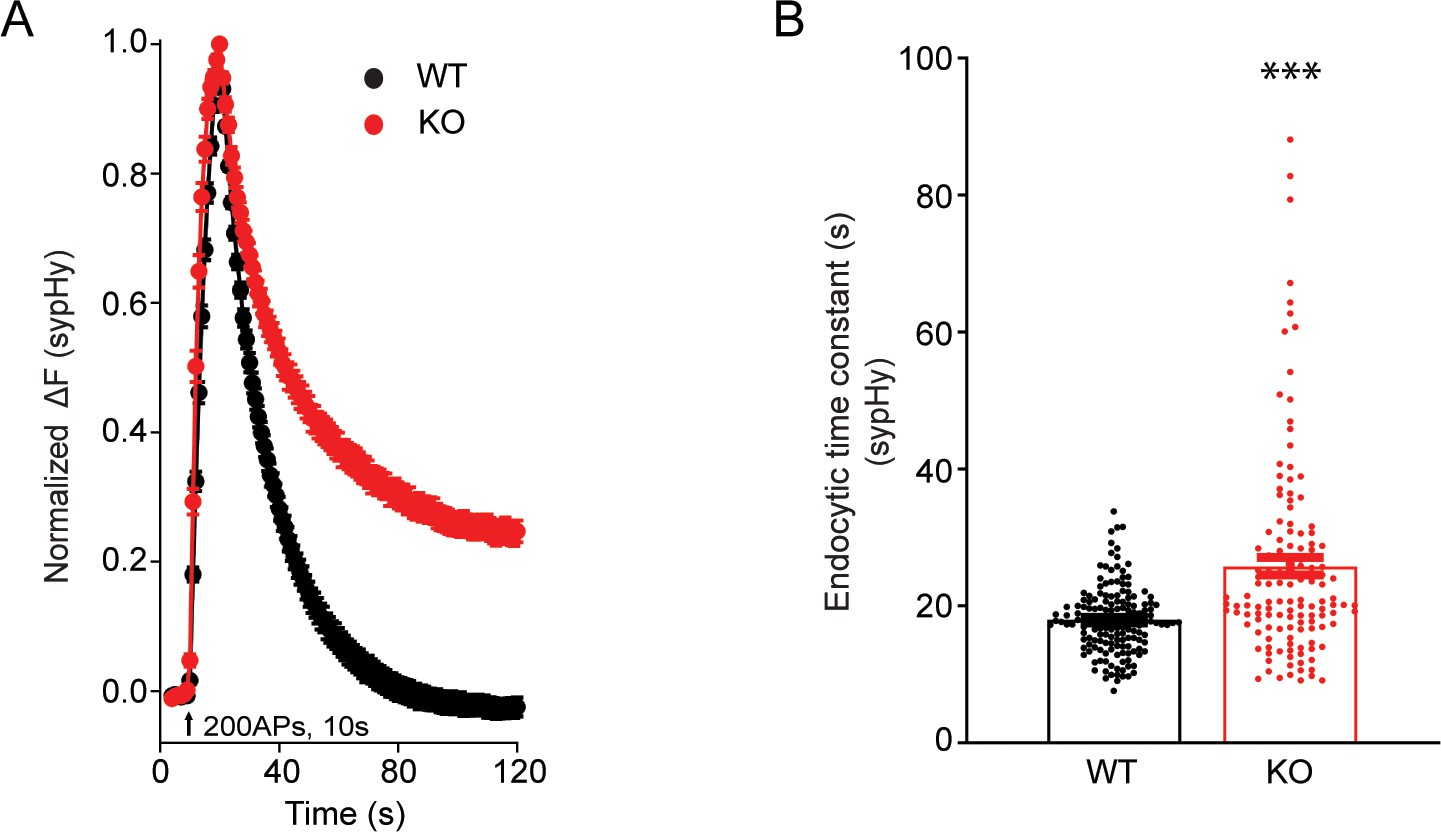
Synaptic vesicle endocytosis is impaired in transient receptor potential melastatin 7 (TRPM7) knockout (KO) neurons using pHluorin-based optical imaging assays.
(A) Normalized fluorescence changes of synaptophysin-pHluorin (sypHy) signals in wild-type (WT) (n = 139) and KO (n = 127) neurons at 2 mM [Ca2+]e. (B) Bar graph comparing the endocytic time constant from sypHy experiments in A. (C) Normalized fluorescence changes of vGlut1-pHluorin signals in WT (n = 127) and KO (n = 105) neurons at 2 mM [Ca2+]e. (D) Bar graph comparing the endocytic time constant from vGlut1-pHluorin experiments in C. (E) Normalized sypHy fluorescence traces (WT: n = 121; KO: n = 101) with two periods of perfusion with pH 5.5 MES buffer as indicated in the figure (black bar). Newly endocytosed vesicles ‘trapped’ during acidic buffer perfusion starting 5 s after 100 action potentials (APs) at 20 Hz. (F) Bar graph for the reacidification rate of endocytic vesicles, which was obtained by exponential fittings of fluorescence decay, indicates no change in reacidification in KO neurons. n is the total number of boutons pooled from three animals. ***p < 0.001, unpaired two-tailed Student’s t-test.
-
Figure 3—source data 1
Defects in synaptic vesicle endocytosis in KO neurons.
- https://cdn.elifesciences.org/articles/66709/elife-66709-fig3-data1-v2.xlsx
Figure 3—figure supplement 1
Endocytic defects of synaptic vesicles in transient receptor potential melastatin 7 (TRPM7) knockout (KO) neurons at physiological temperature of 34°C.
(A) Normalized fluorescence changes of synaptophysin-pHluorin (sypHy) signals in response to 200 action potentials (APs) at 20 Hz stimulations in wild-type (WT) (n = 161) and KO (n = 134) neurons at 2 mM [Ca2+]e. The temperature of the bath solution was maintained at 34°C through a T°C-324°C temperature control system (Harvard Bioscience, Holliston, MA). (B) Bar graph comparing the endocytic time constant from sypHy experiments as presented in (A). ***p < 0.001, unpaired two-tailed Student’s t-test.
-
Figure 3—figure supplement 1—source data 1
No change in synaptic vesicle endocytosis in KO neurons at physiological temperature.
- https://cdn.elifesciences.org/articles/66709/elife-66709-fig3-figsupp1-data1-v2.xlsx
Figure 3—figure supplement 2
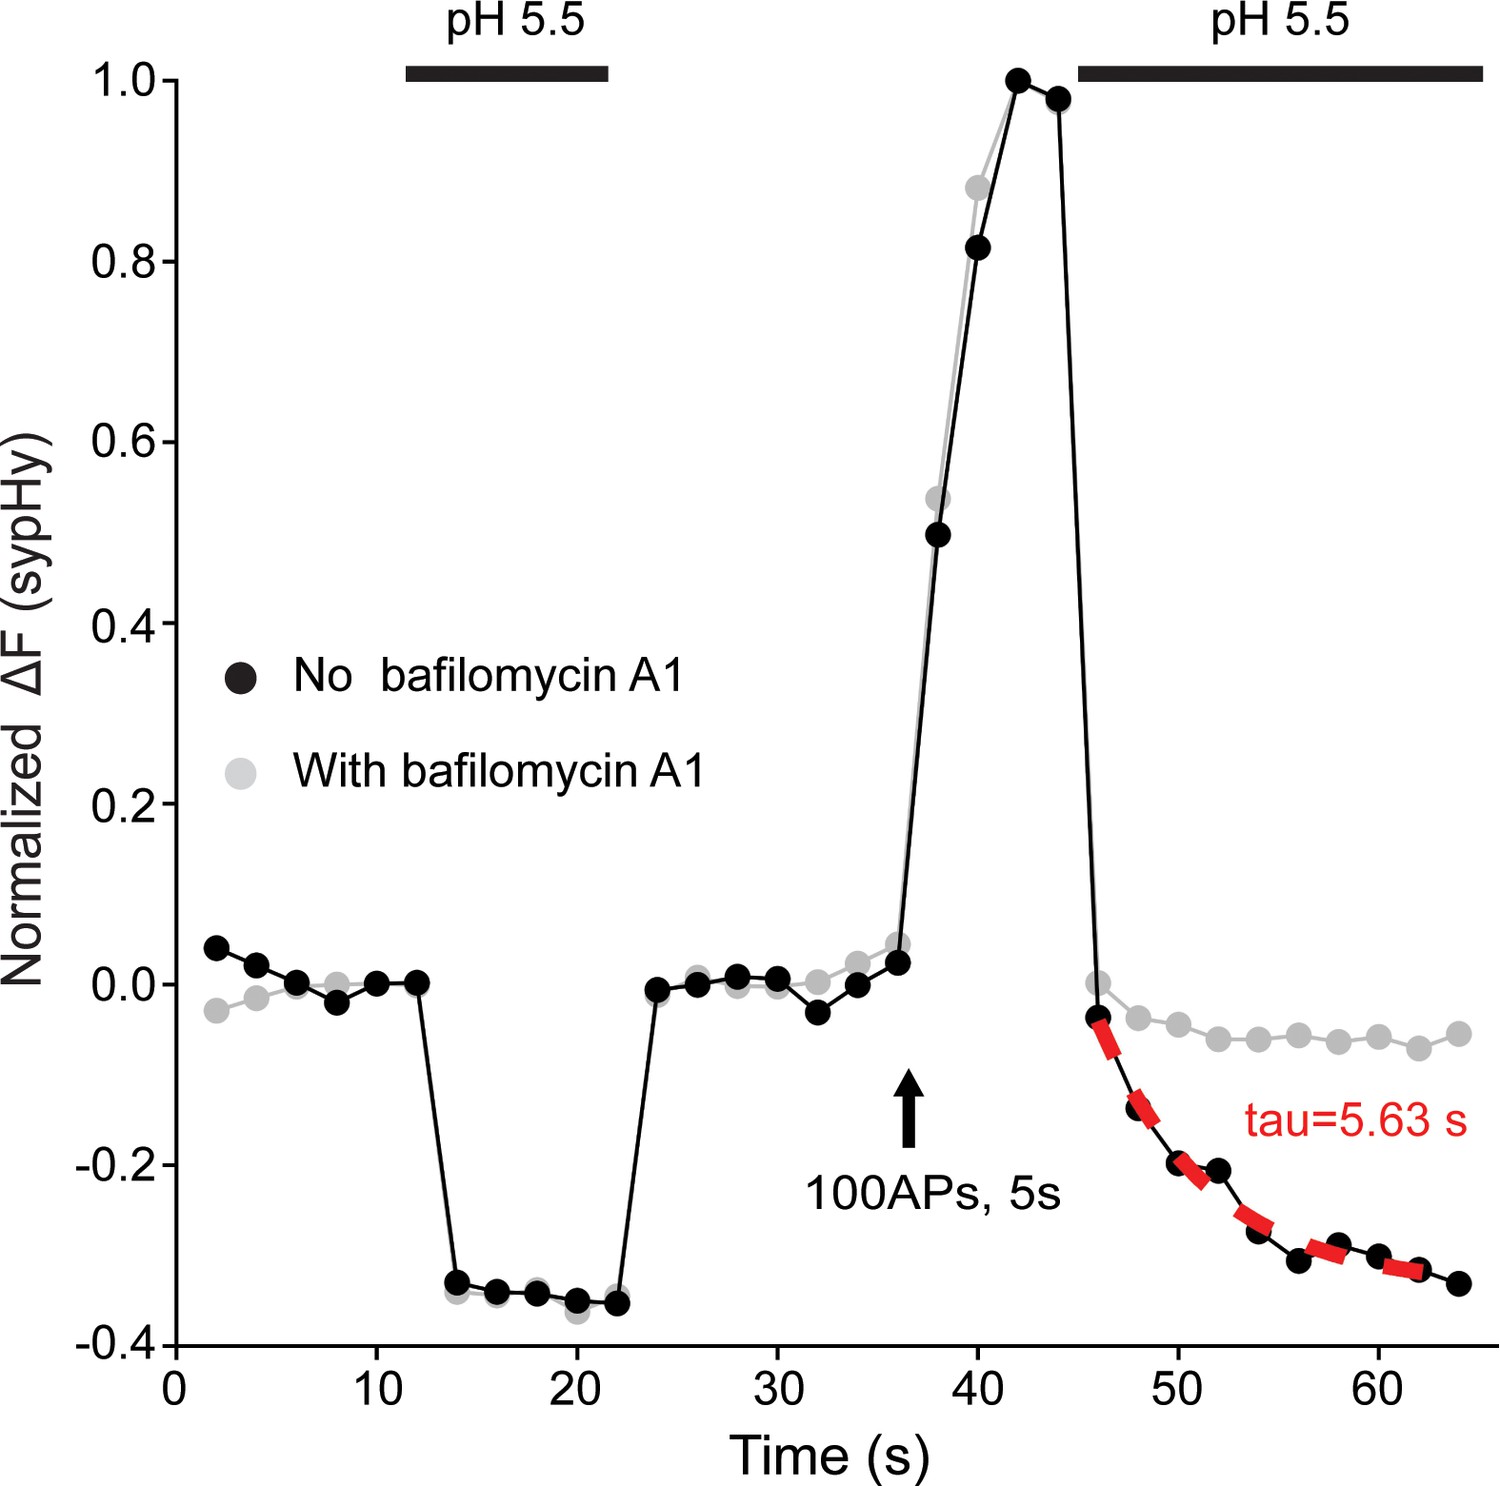
Measurements of reacidification rate of newly endocytosed vesicles from single synaptic terminals.
Representative time courses of pHluorin signals of individual synaptic terminals in the absence (black) or presence (gray) of bafilomycin A1, a vacuolar H+-ATPase inhibitor. To measure reacidification rate of newly formed endocytic vesicles using synaptophysin-pHluorin (sypHy) as described by Atluri and Ryan, 2006, neurons infected with lentivirus encoding sypHy were rapidly perfused with a valve controlled pressurized local perfusion system (ALA Scientific, Farmingdale, NY). Surface fluorescence of pHluorin is quenched by the first application of acidic buffer (pH 5.5 buffer with the HEPES substituted with equi-molar MES) for 10 s to establish the baseline, and the quenched fluorescence is recovered by washing off the acidic solution. To isolate pHluorin signal from newly endocytosed synaptic vesicles, acidic buffer, indicated by the second bar in the trace, is applied for a 20 s duration 5 s right after the cessation of stimulation train. Newly endocytosed alkaline pool of pHluorin is detached from the plasma membrane and thus resistant to quenching by the applied acidic buffer, and the decay of this portion of fluorescence to the baseline represents acidification of newly endocytosed vesicles. The decay of fluorescent signals, which can be blocked by bafilomycin A1, thus likely reflects reacidification kinetics of newly endocytic vesicles. Reacidification rate of newly endocytosed vesicles is estimated by an exponential fit, as indicated by the red dashed line, of this fluorescent signal decay from the first to the last point during this 20 s duration of acidic buffer application.
Figure 3—figure supplement 3
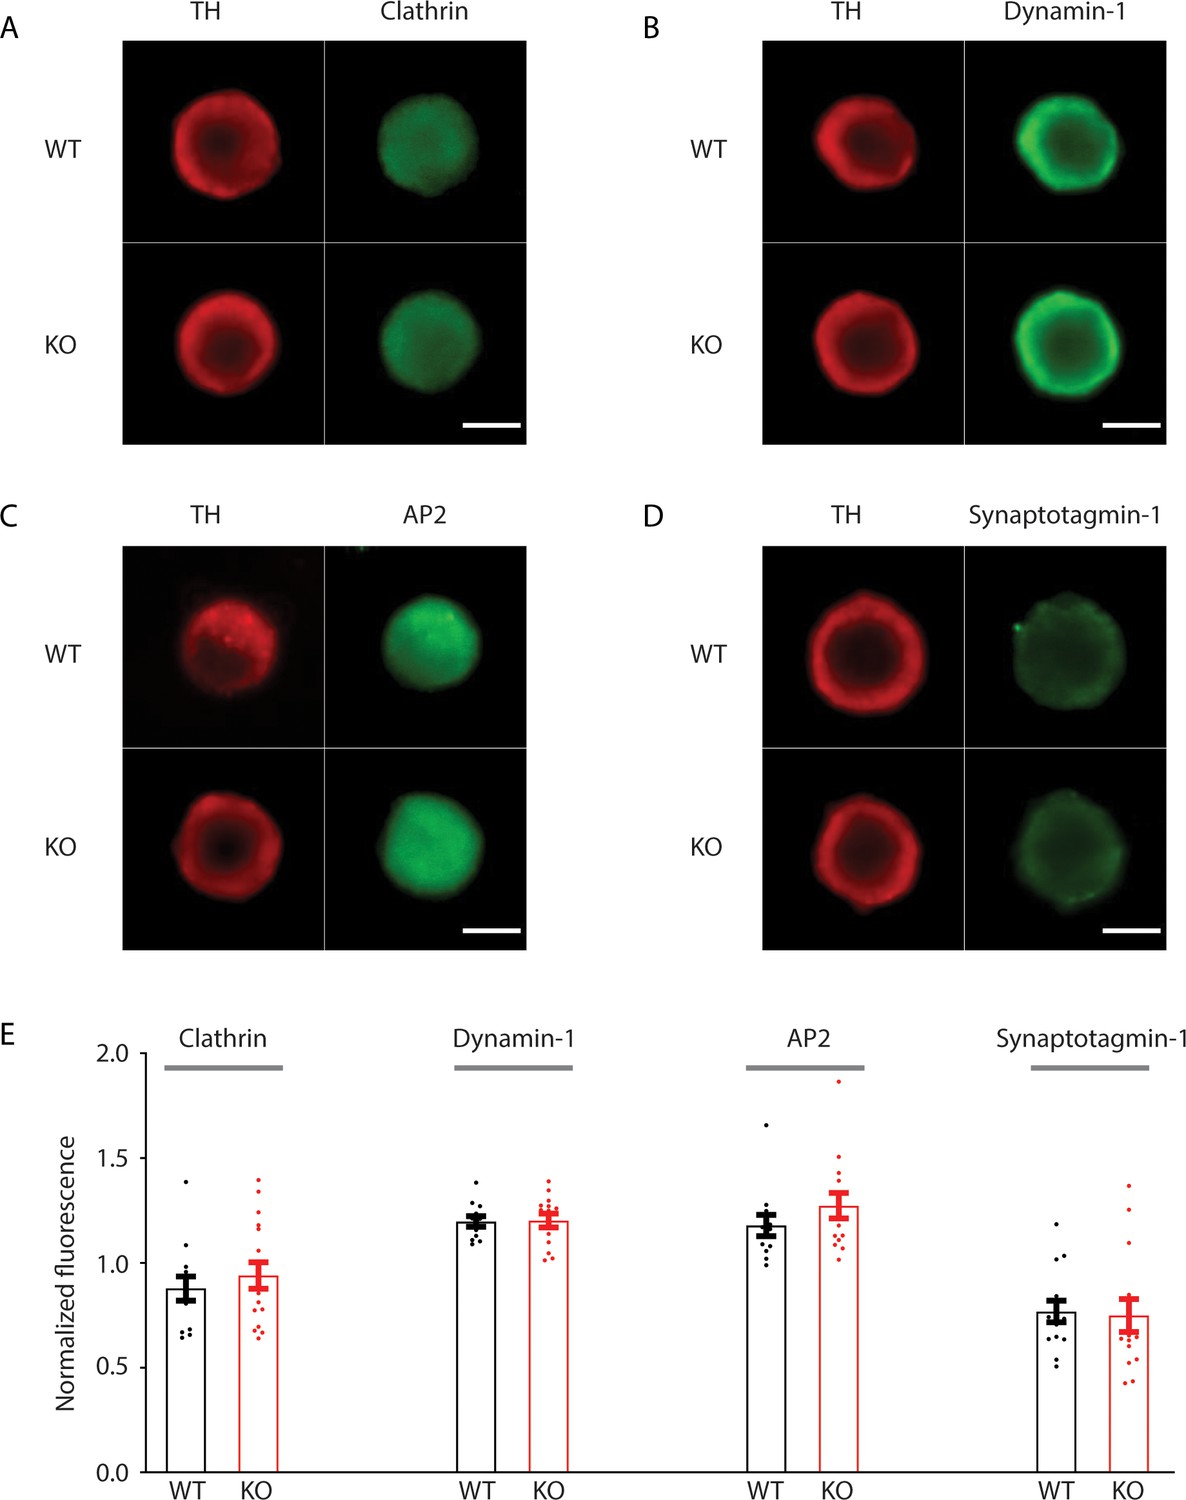
No difference in expression levels of endocytic proteins between wild-type (WT) and transient receptor potential melastatin 7 (TRPM7) knockout (KO) chromaffin cells.
(A–D) Representative confocal images of WT and TRPM7 KO chromaffin cells immunostained with tyrosine hydroxylase (TH) and endocytic proteins, such as clathrin (A), dynamin 1 (B), AP2 (C), or synaptotagmin 1 (D). (E) Bar graph of fluorescence of each endocytic protein presented in (A–D), normalized to the TH signals, shows no difference in expression levels of these four endocytic proteins between WT and TRPM7 KO chromaffin cells. The scale bar is 5 μm. Unpaired two-tailed Student’s t-test.
-
Figure 3—figure supplement 3—source data 1
No change in endocytic proteins expressions in TRPM7 KO chromaffin cells.
- https://cdn.elifesciences.org/articles/66709/elife-66709-fig3-figsupp3-data1-v2.xlsx
Figure 3—figure supplement 4
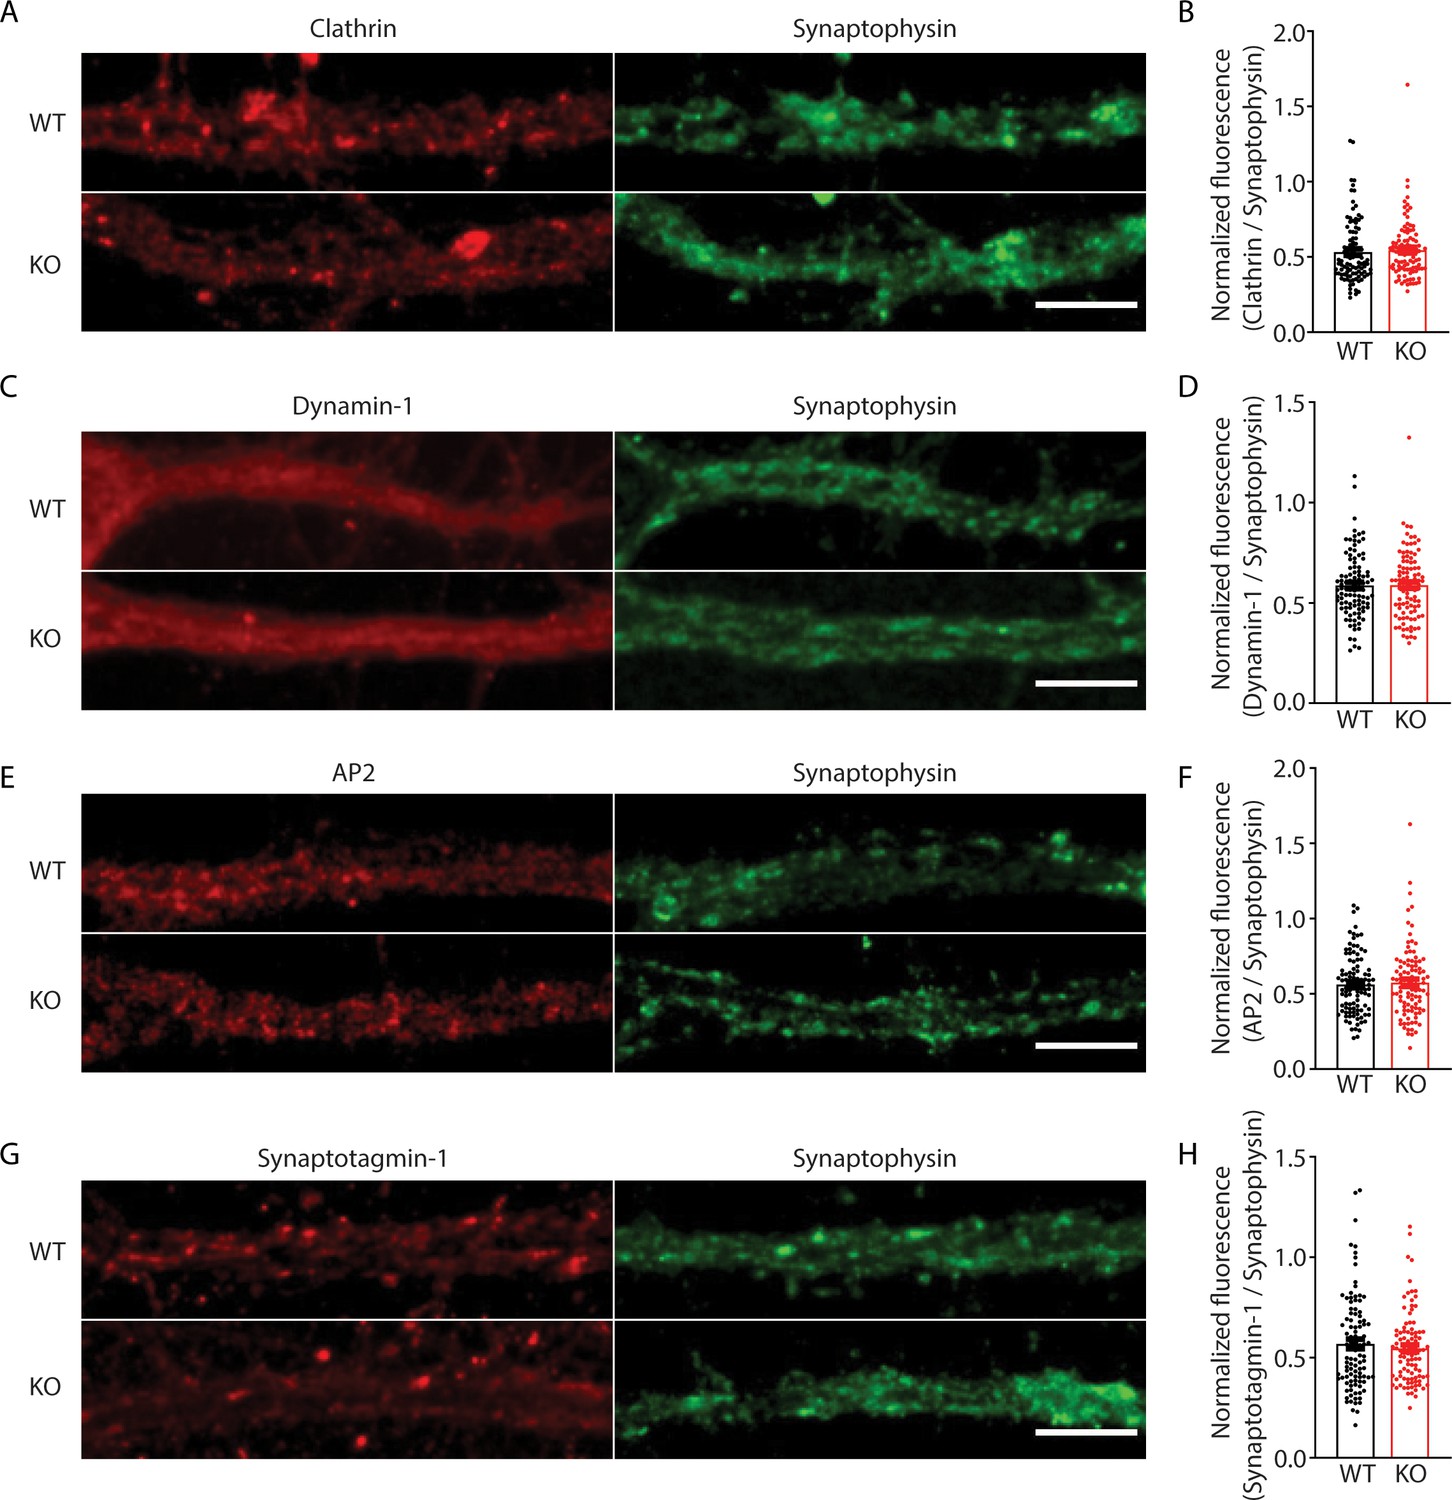
No change in expression levels of endocytic proteins in presynaptic terminals of transient receptor potential melastatin 7 (TRPM7) knockout (KO) neurons.
(A, C, E, and G) Representative confocal images of presynaptic terminals from wild-type (WT) and TRPM7 KO neurons immunostained with endocytic proteins, such as clathrin (A), dynamin 1 (C), AP2 (E), or synaptotagmin 1 (G). Presynaptic terminals are identified with immunostained with synaptophysin. The scale bar is 10 μm. (B, D, F, and H) Bar graph of fluorescence of these endocytic proteins, such as clathrin (B), dynamin 1 (D), AP2 (F), and synaptotagmin 1 (H), normalized to the synaptophysin signals, shows no difference in expression levels of these four endocytic proteins between WT and TRPM7 KO terminals. Unpaired two-tailed Student’s t-test.
-
Figure 3—figure supplement 4—source data 1
No change in endocytic proteins expressions in presynaptic terminals of KO neurons.
- https://cdn.elifesciences.org/articles/66709/elife-66709-fig3-figsupp4-data1-v2.xlsx
Figure 3—figure supplement 5
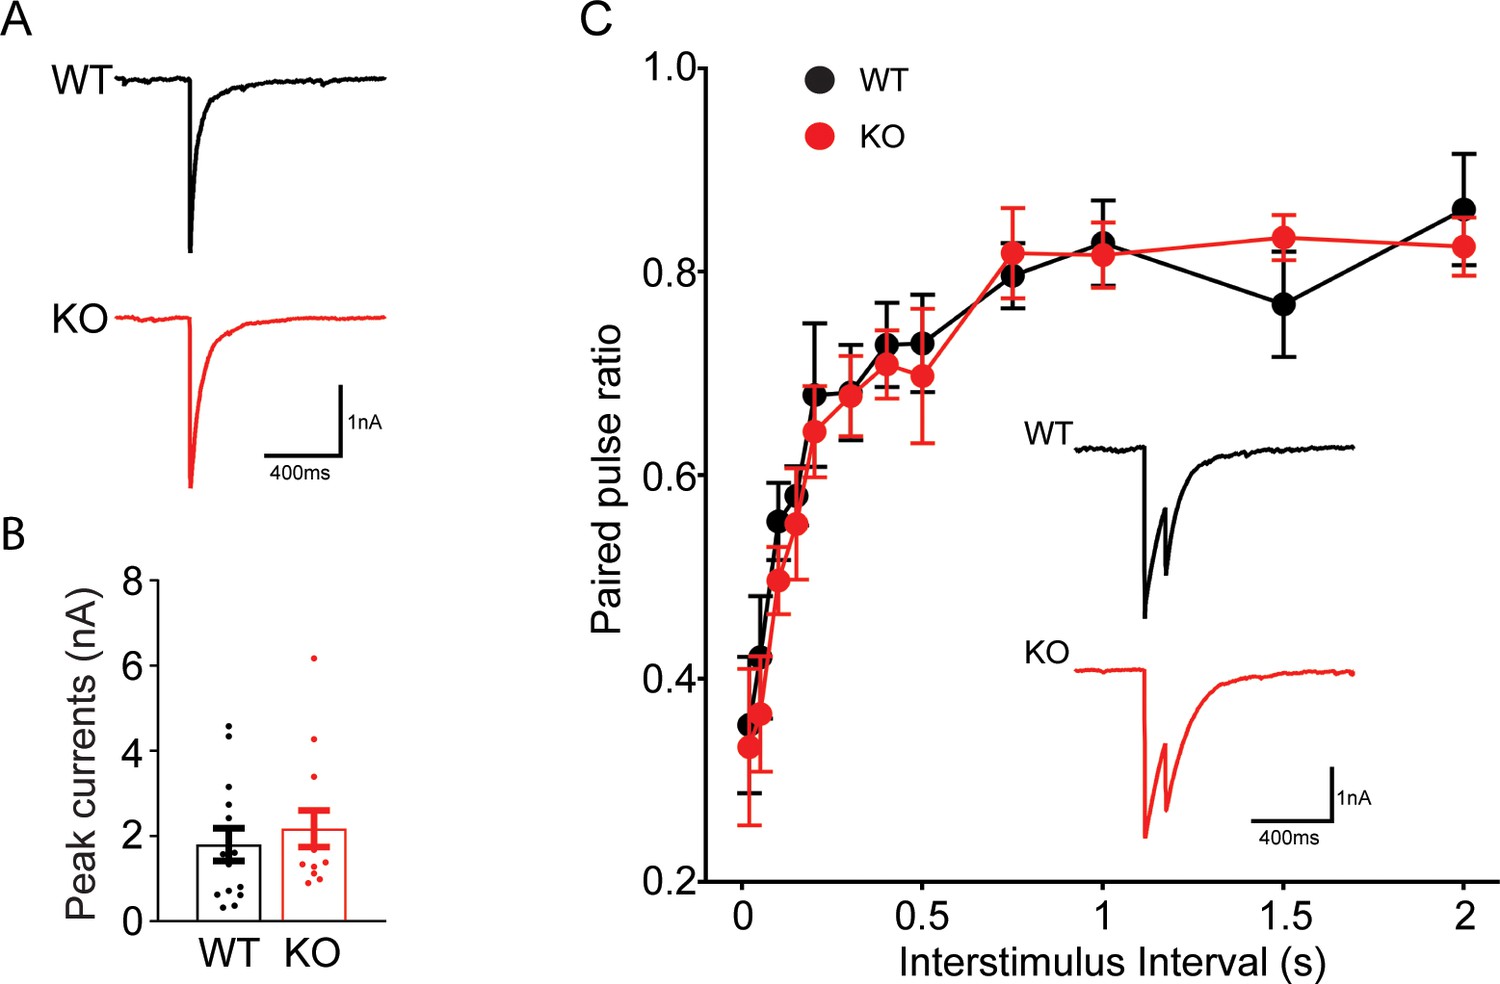
Transient receptor potential melastatin 7 (TRPM7) may not be involved in synaptic vesicle exocytosis in inhibitory neurons.
(A–B) Representative (A) and quantification (B) of inhibitory postsynaptic currents (IPSCs) evoked by a single stimulation in wild-type (WT) and TRPM7 knockout (KO) neurons (WT: n = 14; KO: n = 13). (C) Quantification of the paired pulse ratio with variable intervals between WT and KO neurons (WT: n = 15; KO: n = 12), and insert is representative IPSCs evoked by paired stimuli at 100 ms intervals. Unpaired two-tailed Student’s t-test.
-
Figure 3—figure supplement 5—source data 1
No change in evoked IPSCs in TRPM7 neurons.
- https://cdn.elifesciences.org/articles/66709/elife-66709-fig3-figsupp5-data1-v2.xlsx
Figure 3—figure supplement 6
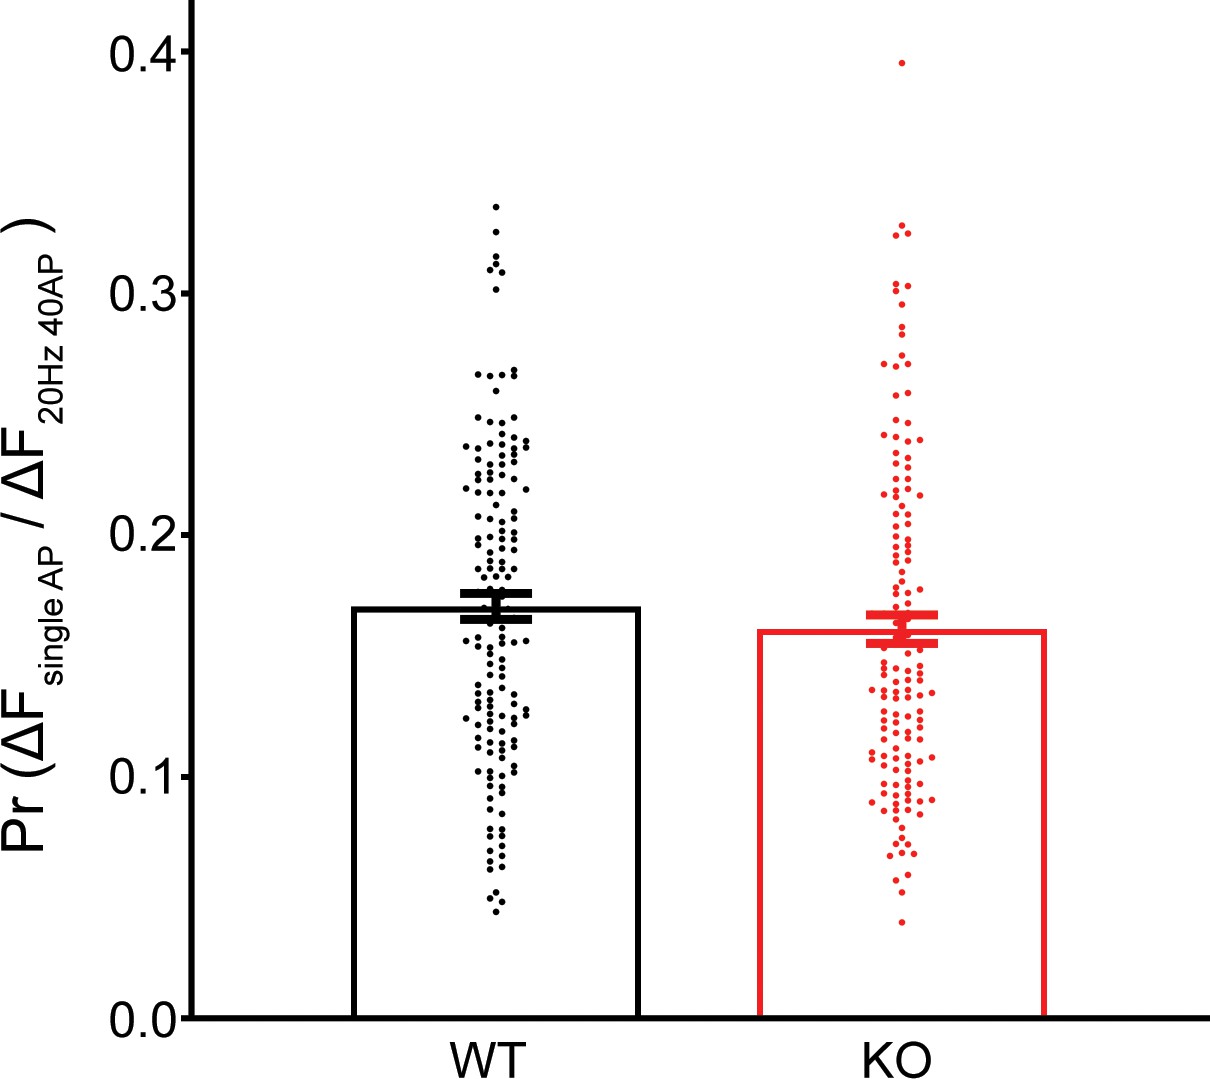
No difference in release probability of RRP vesicles between wild-type (WT) and transient receptor potential melastatin 7 (TRPM7) knockout (KO) neurons as measured from vGlut1-pHluorin experiments.
Release probability from individual terminals is calculated as the ratio of an averaged response induced by three single action potentials (APs) with 20 s intervals to RRP response induced by 40 APs at 20 Hz, which is delivered 60 s after the last single AP. To increase the liability of responses induced by single AP, experiments are carried out at 5 mM extracellular Ca2+ at room temperature. Unpaired two-tailed Student’s t-test.
-
Figure 3—figure supplement 6—source data 1
No difference in release probability between WT and KO neurons.
- https://cdn.elifesciences.org/articles/66709/elife-66709-fig3-figsupp6-data1-v2.xlsx
Figure 4 with 2 supplements
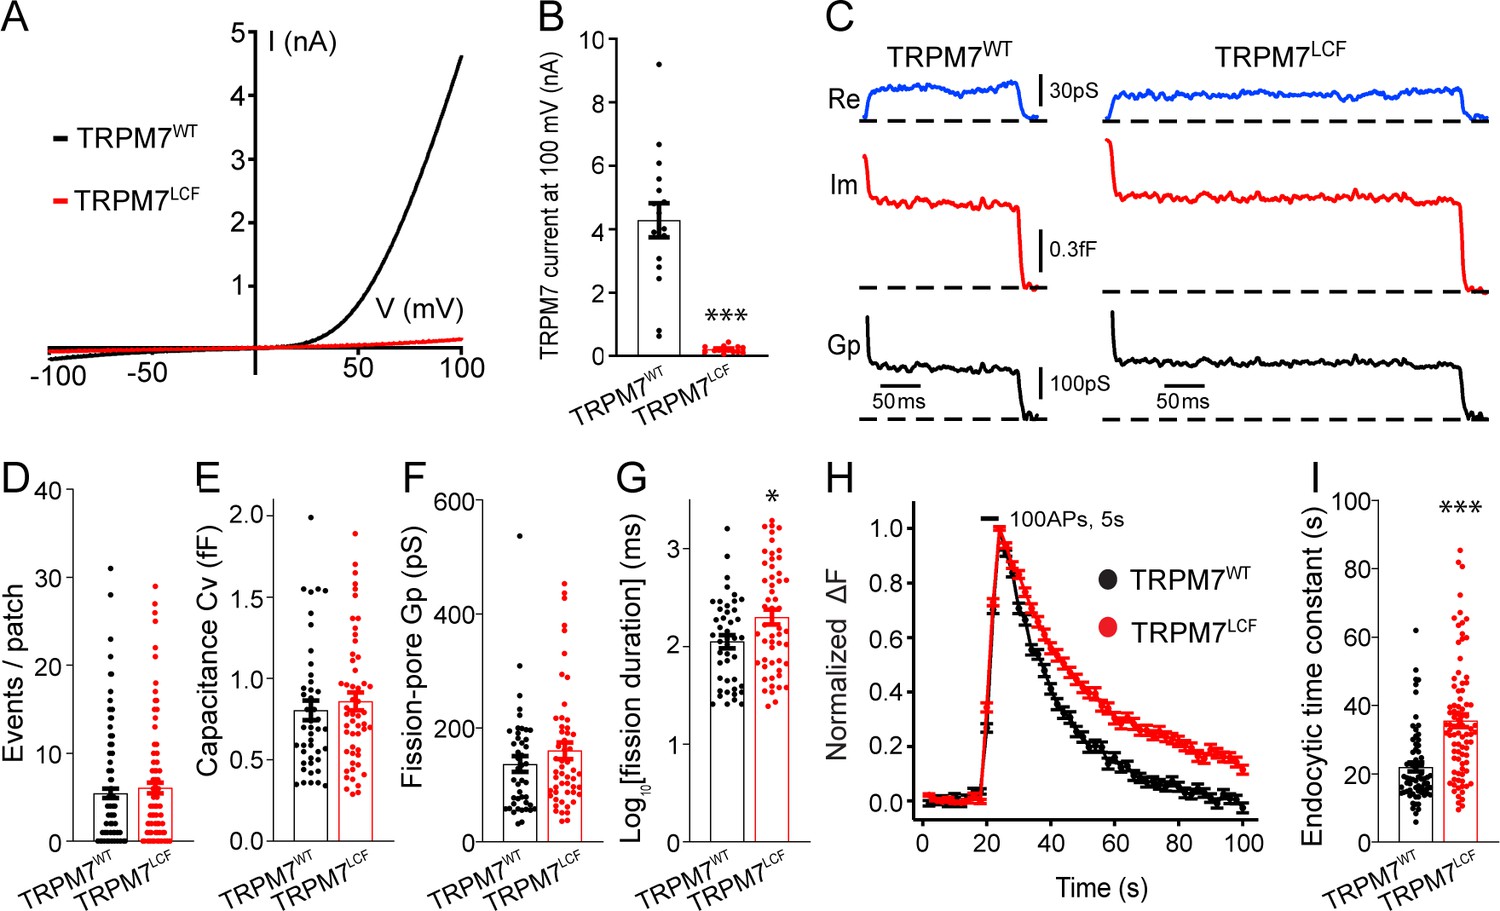
Transient receptor potential melastatin 7 (TRPM7) as an ion channel is critical for endocytosis in both chromaffin cells and neurons.
(A) Averaged whole-cell TRPM7 currents, recorded from HEK 293 cells transduced with lentivirus encoding TRPM7WT or TRPM7LCF, in response to voltage ramps from –100 to +100 mV. (B) Quantifications showing TRPM7LCF currents (n = 16 cells) at +100 mV were almost completely blocked as compared to TRPM7WT currents (n = 13 cells). (C) Representative endocytic events, as membrane conductance (Re), capacitance (Im), and the fission-pore Gp traces in KO cells expressing either TRPM7WT (left) or TRPM7LCF (right). (D–G) The number of endocytic events (TRPM7WT: n = 141 cells; TRPM7LCF: n = 128 cells) (D), the capacitance Cv of endocytic vesicles (E), and the fission-pore Gp (F) were indistinguishable between these two groups; the log-transformed fission-pore duration (G) was significantly increased in TRPM7LCF-expressing KO cells (TRPM7WT: n = 44 events; TRPM7LCF: n = 53 events). (H–I) Normalized fluorescence changes of synaptophysin-pHluorin (sypHy) signals (H) and bar graph (I), comparing the endocytic time constant from sypHy experiments in KO neurons expressing TRPM7WT (n = 69) or TRPM7LCF (n = 87) neurons, indicate that endocytic kinetics is slower in TRPM7LCF-expressing KO neurons. n is the total number of boutons pooled from six animals. *p < 0.05 and ***p < 0.001, unpaired two-tailed Student’s t-test.
-
Figure 4—source data 1
Lentivirus-mediated TRPM7 versions in HEK 293 cells.
- https://cdn.elifesciences.org/articles/66709/elife-66709-fig4-data1-v2.xlsx
Figure 4—figure supplement 1
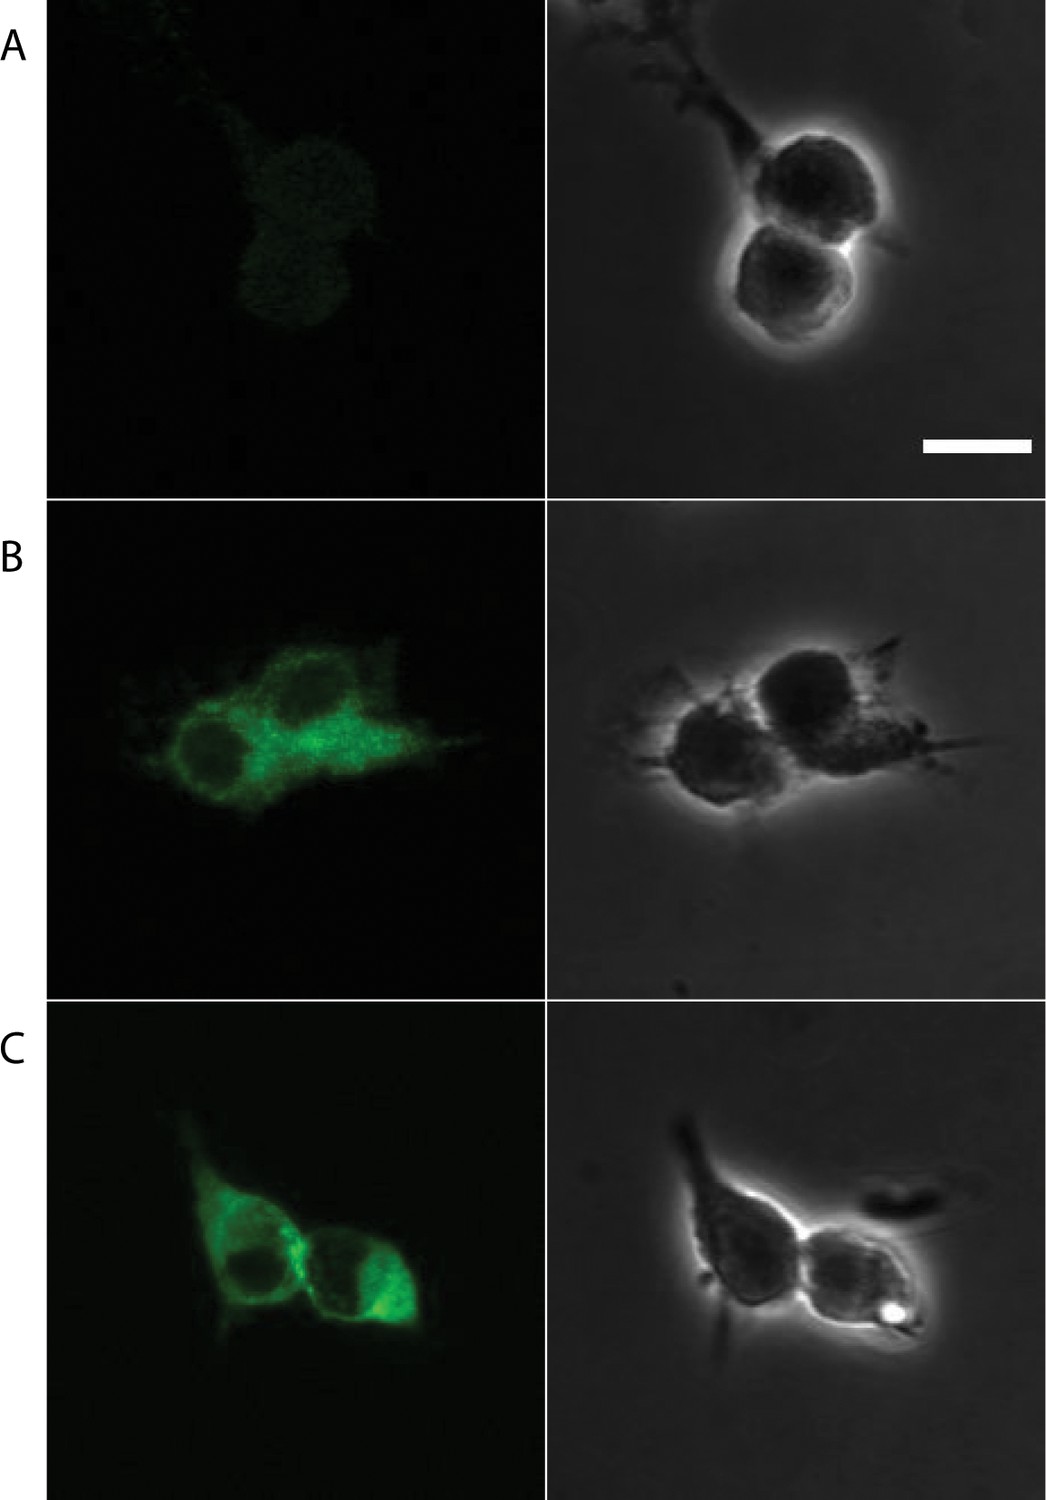
Confocal images for HEK 293 cells infected with lentivirus encoding with either empty vector, TRPM7WT or TRPM7LCF.
(A–C) Representative confocal images of HEK 293 cells infected with lentivirus encoding empty vector (A), TRPM7WT (B) or TRPM7LCF, (C) are on the left, phase contrast images of the same regions of interest (ROIs) are on the right. The scale bar is 10 μm.
Figure 4—figure supplement 2
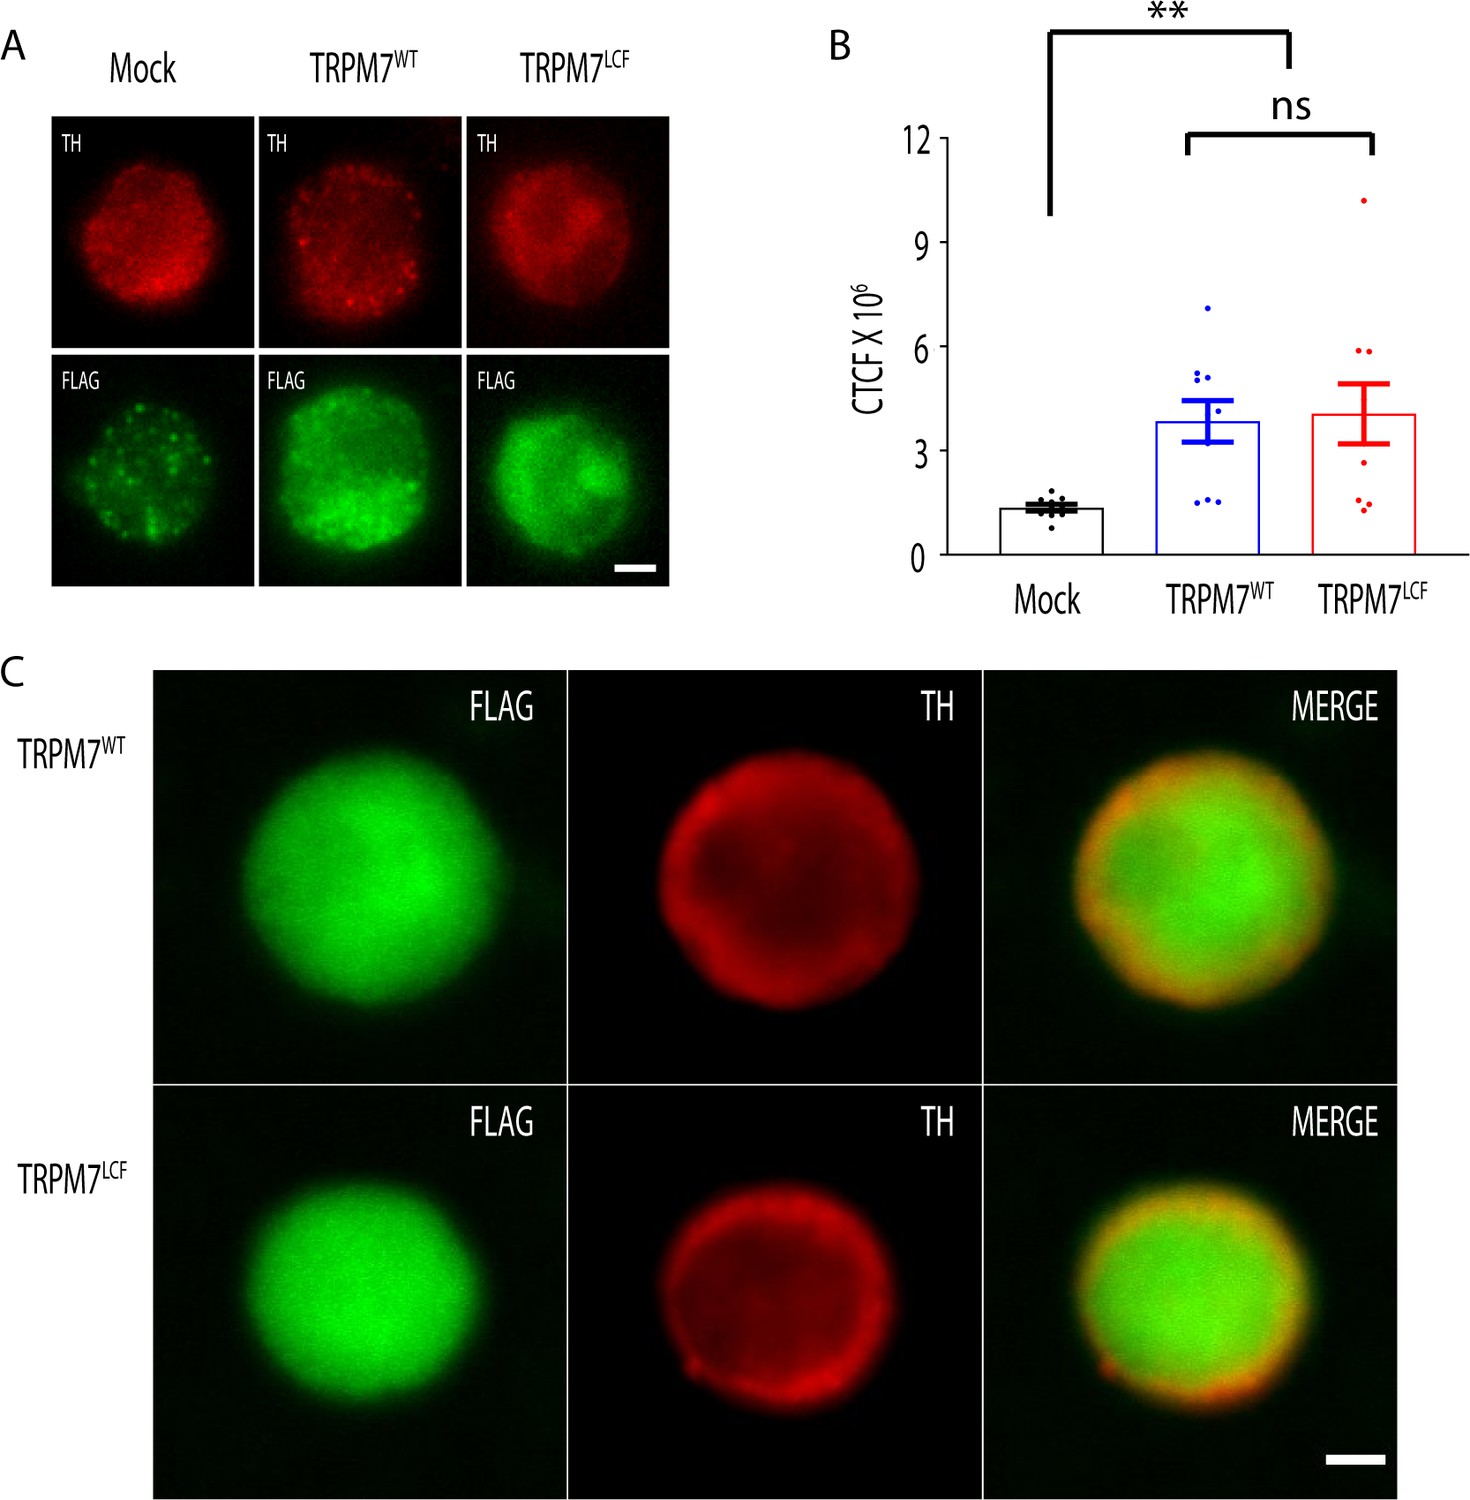
Similar expression levels of TRPM7WT and TRPM7LCF in knockout (KO) chromaffin cells.
(A) Representative images of transient receptor potential melastatin 7 (TRPM7) KO cells, which were infected with lentivirus encoding empty vector (left), pCDH-EF1-flag-TRPM7WT (middle), or pCDH-EF1-flag-TRPM7LCF (right), immunostained for tyrosine hydroxylase (TH) (top) and FLAG (bottom). (B) Quantification of whole-cell anti-FLAG immunofluorescence in these three groups indicates similar expression levels of TRPM7WT and TRPM7LCF in KO cells. Fluorescence intensity was analyzed as CTCF (the corrected total cell fluorescence), which was calculated using the formula: CTCF = integrated density − (area of selected cell × mean fluorescence of background readings). n = 10 cells for each group, and a.u. stands for arbitrary units. **p < 0.01 and NS, non-significant, Newman of one-way ANOVA. (C) Representative confocal images of KO chromaffin cells expressing either TRPM7WT or TRPM7LCF showing their similar distributions in TRPM7 KO chromaffin cells. The scale bar is 2.5 μm in both (A) and (C).
-
Figure 4—figure supplement 2—source data 1
Lentivirus-mediated TRPM7 versions in chromaffin cells.
- https://cdn.elifesciences.org/articles/66709/elife-66709-fig4-figsupp2-data1-v2.xlsx
Figure 5 with 3 supplements
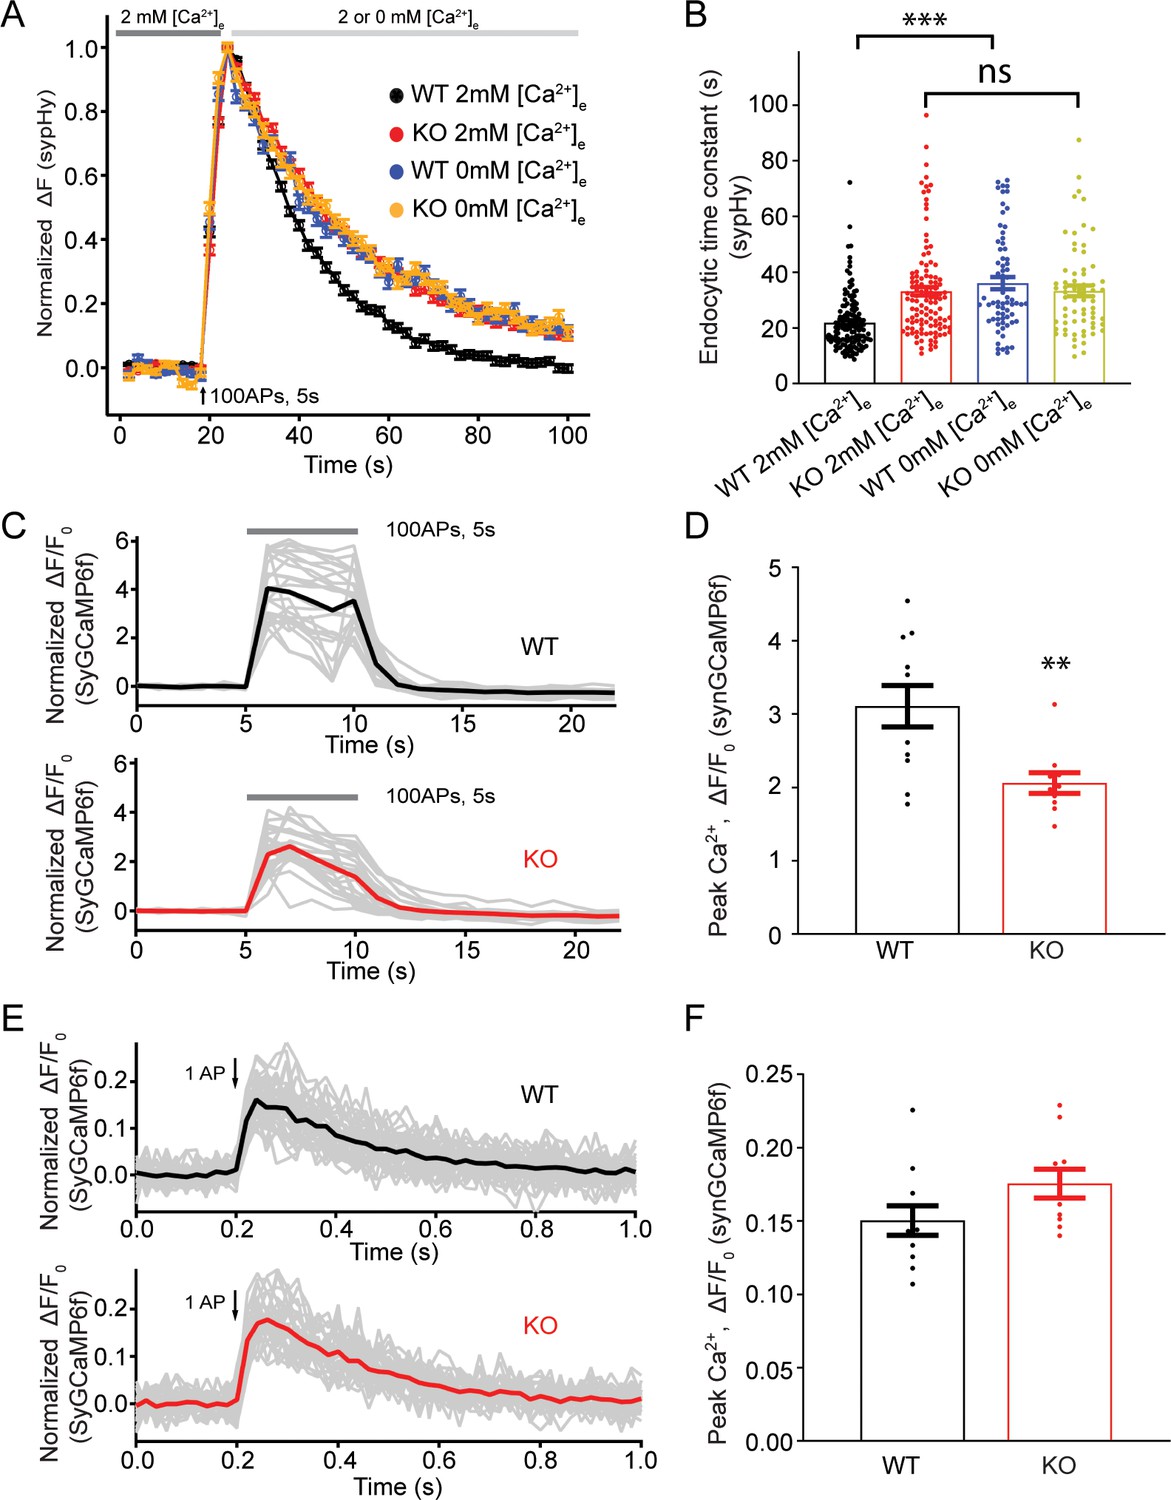
Transient receptor potential melastatin 7 (TRPM7) is important for presynaptic Ca2+ increase upon a train of stimulations.
(A) Normalized fluorescence changes of synaptophysin-pHluorin (sypHy) signal in wild-type (WT) (2 mM: n = 131 buttons; 0 mM: n = 68 buttons) and TRPM7 knockout (KO) (2 mM: n = 116 buttons; 0 mM: n = 67 buttons) neurons at 2 and 0 mM [Ca2+]e after the cessation of stimuli. (B) Bar graph comparing the endocytic time constant from sypHy experiments in A. (C) Sample traces showing normalized changes in SyGCaMP6f fluorescence stimulated with 100 action potentials (APs) at 20 Hz from an individual coverslip of WT (top) (25 regions of interest [ROIs]) or TRPM7 KO (bottom) (25 ROIs) neurons at 2 mM [Ca2+]e. Gray lines are changes for individual ROIs with the black or red line as the averaged response. (D) Bar graph comparing peak values of Ca2+ transients from SyGCaMP6f experiments in (C) displays a significant decrease of Ca2+ signals in TRPM7 KO neurons (WT: n = 11 coverslips; KO: n = 10 coverslips). (E) Sample traces showing normalized changes in SyGCaMP6f fluorescence induced by single AP from an individual coverslip of WT (top) (36 ROIs) or TRPM7 KO (36 ROIs) neurons at 2 mM [Ca2+]e. Gray lines are changes of individual ROIs with black or red line as the averaged response. (F) Bar graph comparing peak values of Ca2+ transients as shown in (E) revealed no change in Ca2+ signals induced by a single AP (WT: n = 11 coverslips; KO: n = 10 coverslips). **p < 0.01, unpaired two-tailed student’s t-test; ***p < 0.001, Newman of one-way ANOVA in (B).
-
Figure 5—source data 1
Decreased presynaptic Ca2+ signals during stimulation train.
- https://cdn.elifesciences.org/articles/66709/elife-66709-fig5-data1-v2.xlsx
Figure 5—figure supplement 1
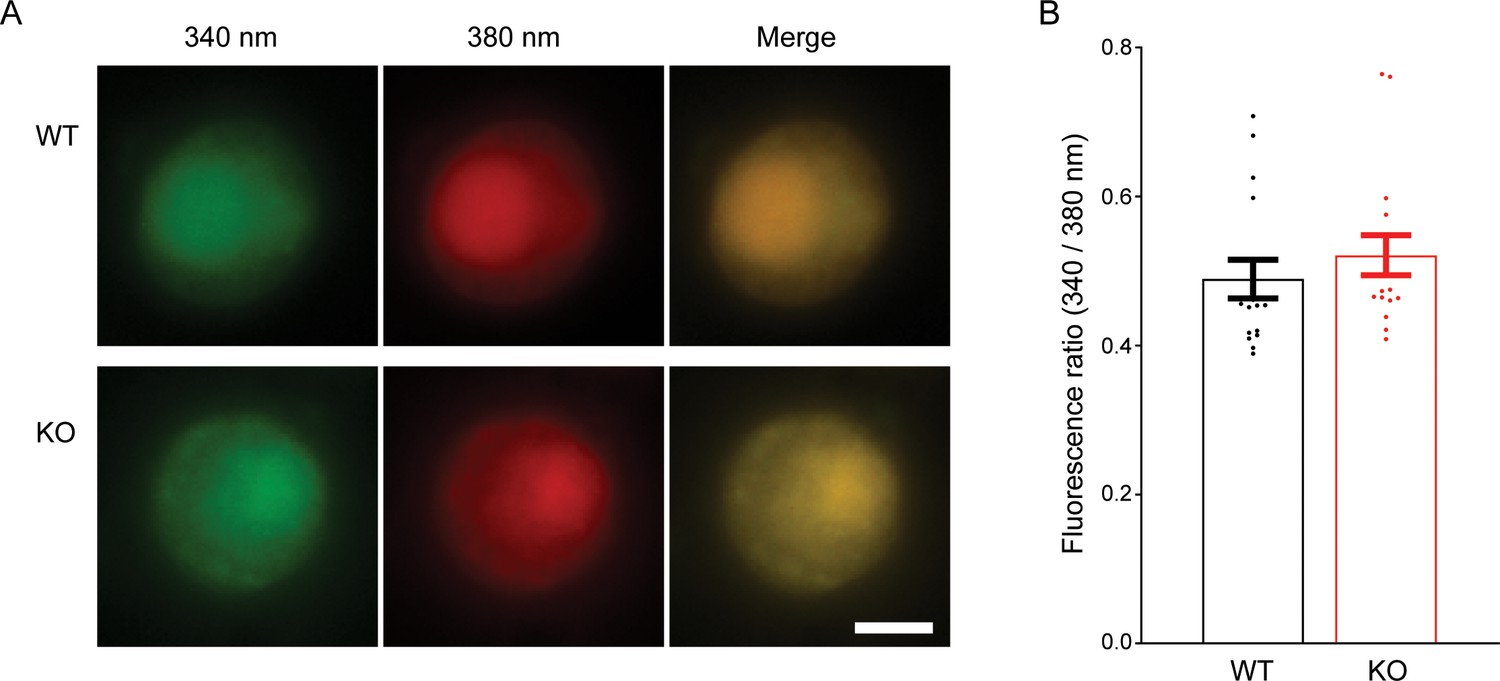
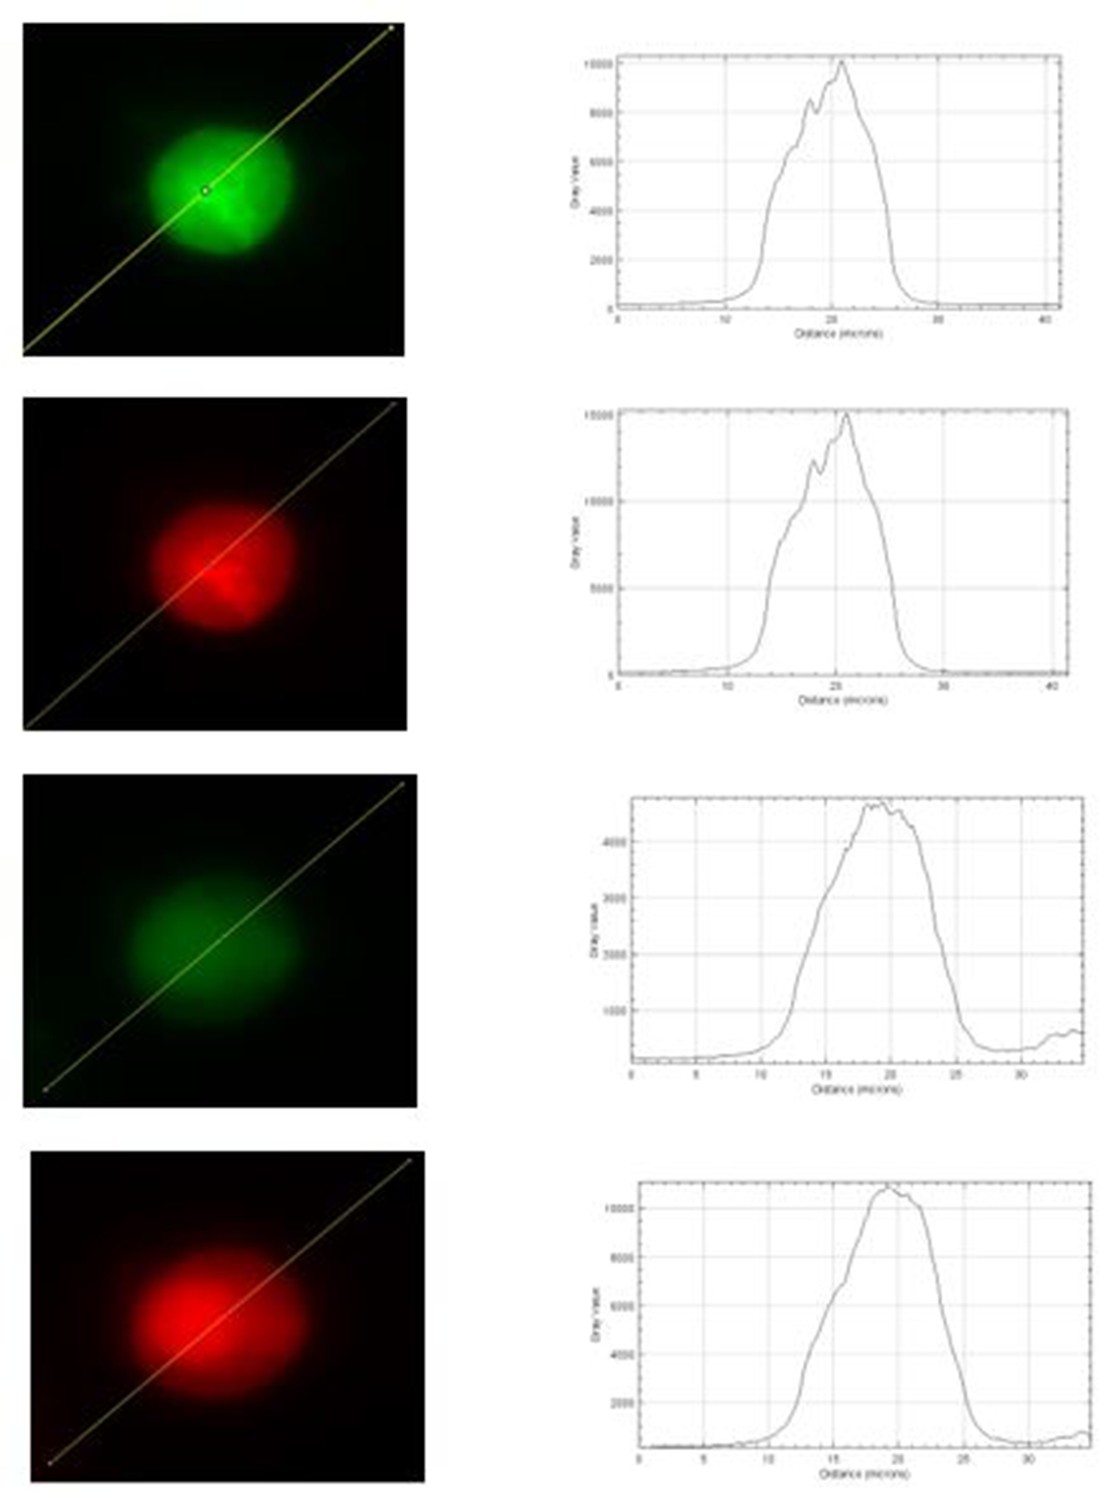
No difference in the resting Ca2+ concentration between wild-type (WT) and transient receptor potential melastatin 7 (TRPM7) knockout (KO) chromaffin cells.
(A) Fluorescence images of representative chromaffin cells loaded with Fura-2 AM from WT (top) and KO chromaffin cells (bottom). (B) Quantification of the ratio of fluorescence intensity excited at 340–380 nm shows no difference in the resting intracellular Ca2+ between WT and TRPM7 KO chromaffin cells. Unpaired two-tailed Student’s t-test. The scale bar is 5 μm.
-
Figure 5—figure supplement 1—source data 1
No difference in the resting Ca2+ concentration between WT and KO chromaffin cells.
- https://cdn.elifesciences.org/articles/66709/elife-66709-fig5-figsupp1-data1-v2.xlsx
Figure 5—figure supplement 2
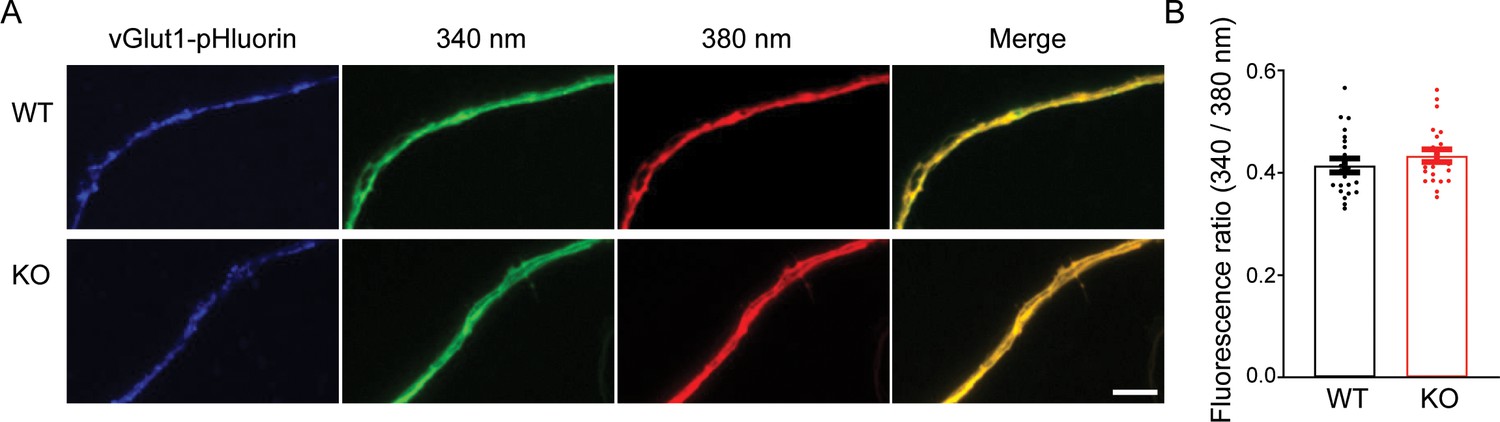
No change in the basal Ca2+ concentration in presynaptic terminals of transient receptor potential melastatin 7 (TRPM7) knockout (KO) neurons.
(A) Fluorescence images of representative presynaptic terminals, identified with lentivirus-mediated vGlut1-pHluorin expression, from wild-type (WT) (top) and KO neurons (bottom) loaded with Fura-2 AM. (B) Quantification of the ratio of fluorescence intensity excited at 340–380 nm shows no difference in the resting Ca2+ concentration in the presynaptic terminals between WT and TRPM7 KO neurons. Unpaired two-tailed Student’s t-test. The scale bar is 10 μm.
-
Figure 5—figure supplement 2—source data 1
No difference in the resting Ca2+ concentration of synaptic terminals between WT and KO neurons.
- https://cdn.elifesciences.org/articles/66709/elife-66709-fig5-figsupp2-data1-v2.xlsx
Figure 5—figure supplement 3
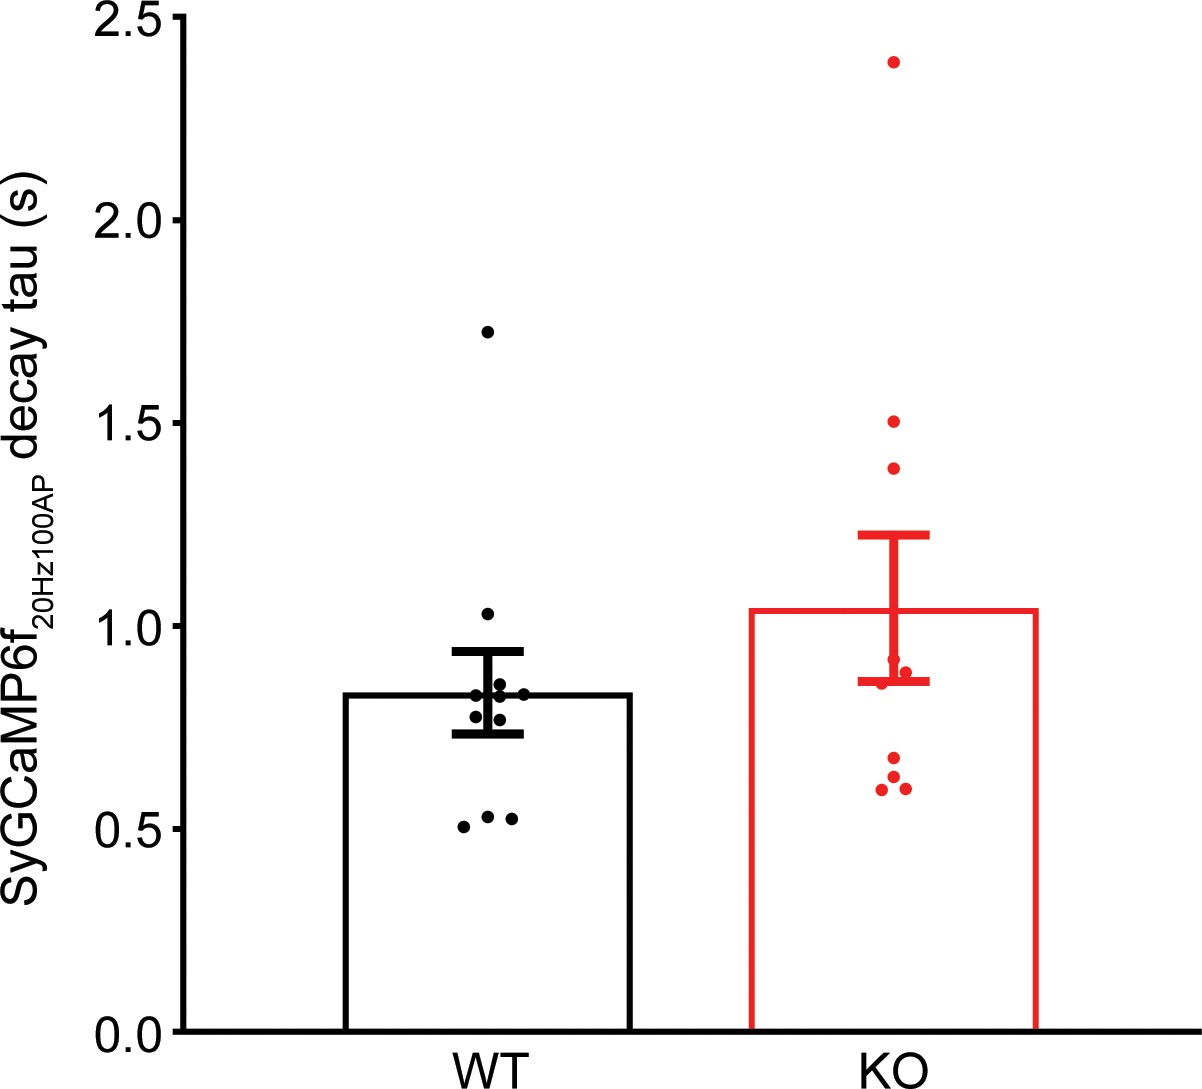
The decay of Ca2+ signals after the cessation of the train stimulation is comparable between wild-type (WT) and transient receptor potential melastatin 7 (TRPM7) knockout (KO).
Decay of averaged SyGCaMP6f signals, elicited by a 100 action potential (AP) train at 20 Hz from each coverslip as shown in Figure 5C, was estimated by a single exponential fit from the first points upon the cessation of stimulation to the 15 s after the cessation of stimulation. Quantifications of the time constant of Ca2+ decay were plotted as bar graph representing means with standard error. Unpaired two-tailed Student’s t-test.
-
Figure 5—figure supplement 3—source data 1
Similar decay time constant of SyGCaMP6f siganls after stimulation train in WT and KO neurons.
- https://cdn.elifesciences.org/articles/66709/elife-66709-fig5-figsupp3-data1-v2.xlsx
Figure 6
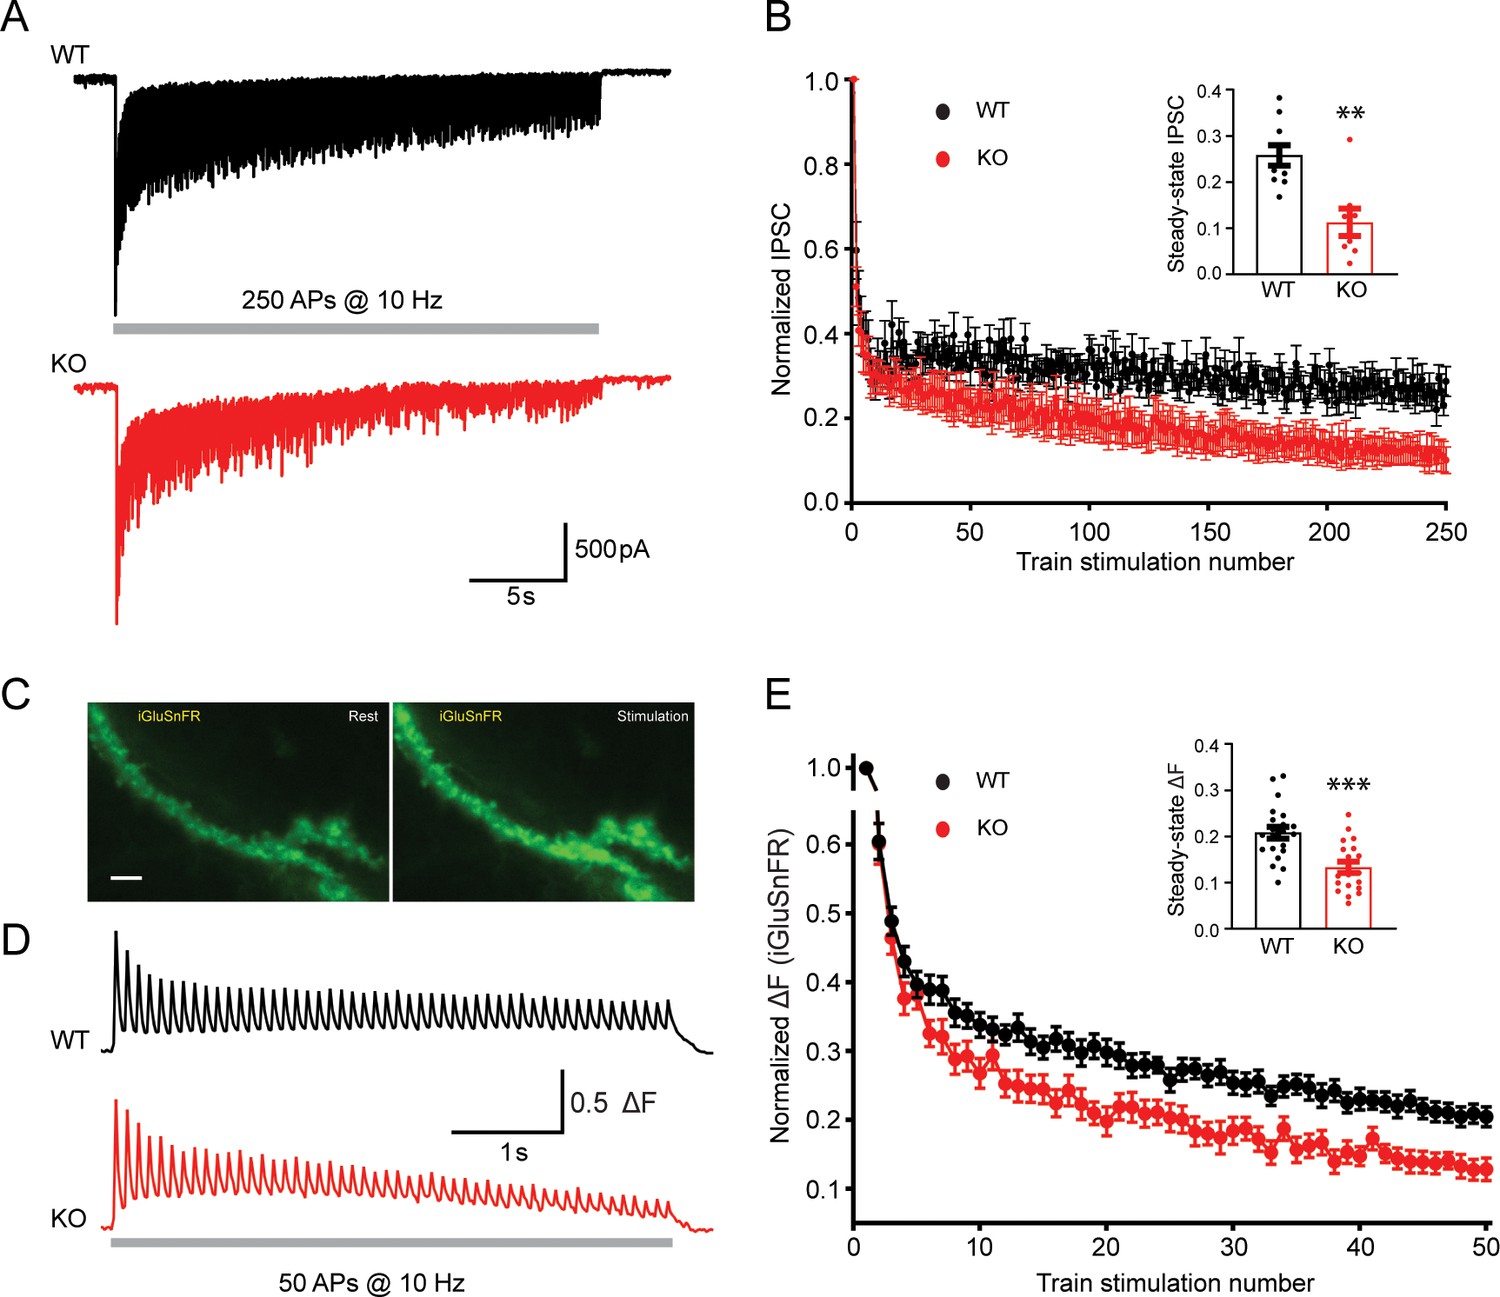
Transient receptor potential melastatin 7 (TRPM7) is critical for presynaptic short-term depression in both inhibitory and excitatory synaptic transmissions.
(A–B) Representative traces of inhibitory postsynaptic currents (IPSCs) evoked by 250 stimulations at 10 Hz in wild-type (WT) (top in A) and TRPM7 knockout (KO) (bottom in A) neurons (A) and graph of averaged normalized IPSCs changes (B). Bar graph of the steady-state IPSCs calculated as the average of last 10 evoked responses in WT and TRPM7 KO neurons are shown in insert in B. Number of recordings is 10 for WT and 8 for KO. (C) Representative images showing fluorescence levels of the same dendritic arbor expression iGluSnFR at rest (left) or upon stimulations (right). Scale bar, 5 µm. (D–E) Representative traces, from WT (top in D) and TRPM7 KO (bottom in D) neurons (D), and normalized graphs (E) of changes in iGluSnFR fluorescence (ΔF/ΔFmax) evoked by 50 stimulations at 10 Hz. Bar graph of the steady state of iGluSnFR ΔF/ΔFmax calculated as the average of last five evoked responses in WT and TRPM7 KO neurons are shown in insert in (E). Number of coverslips is 21 for WT and 20 for KO. **p < 0.01 and ***p < 0.001, unpaired two-tailed Student’s t-test.
-
Figure 6—source data 1
Enhanced short-term depression in KO neurons.
- https://cdn.elifesciences.org/articles/66709/elife-66709-fig6-data1-v2.xlsx
Author response image 1
Tables
Key resources table
| Reagent type (species) or resource | Designation | Source or reference | Identifiers | Additional information |
|---|---|---|---|---|
| Strain, strain background (Mus musculus) | TRPM7fl/fl | Jackson LaboratoryStock No: 018784 | RRID:IMSR_JAX:018784 | |
| Strain, strain background (Mus musculus) | Nestin-Cre | Jackson LaboratoryStock No: 003771 | RRID:IMSR_JAX:003771 | |
| Strain, strain background (Mus musculus) | TH-Cre | Jackson LaboratoryStock No: 008601 | RRID:IMSR_JAX:008601 | |
| Cell line (human) | HEK 293FT | Thermo Fisher Scientific | Catalog number: R70007 | |
| Chemical compound, drug | CNQX | Tocris Bioscience | Cat# 0190 | |
| Chemical compound, drug | AP5 | Tocris Bioscience | Cat# 0106 | |
| Chemical compound, drug | TTX | Tocris Bioscience | Cat# 1078 | |
| Chemical compound, drug | Fura-2 AM | Thermo Fisher Scientific | Cat# F1221 | |
| Antibody | Anti-FLAG(Mouse monoclone M2) | Sigma-Aldrich | Cat# F1804RRID:AB_262044 | ICC (1:1000) |
| Antibody | Anti-TH(Rabbit polyclonal) | Abcam | Cat# ab6211RRID:AB_2240393 | ICC (1:2000) |
| Antibody | Anti-synaptophysin (Rabbit polyclonal) | Aviva Systems Biology | Cat# ARP45435_P050 RRID: AB_2048301 | ICC (1:1000) |
| Antibody | Anti-synaptophysin (Mouse monoclonal) | Sysy | Cat# 101011RRID: AB_887824 | ICC(1:1000) |
| Antibody | Anti-AP2(Mouse monoclonal) | abcam | Cat# ab2730RRID: AB_303255 | ICC(1:200) |
| Antibody | Aanti-Syt1(Mouse monoclonal) | Sysy | Cat# 105011RRID: AB_887832 | ICC(1:1000) |
| Antibody | Anti-clathrin(Mouse monoclonal) | Pierce | Cat# MA1-065RRID: AB_2083179 | ICC(1:500) |
| Antibody | Anti-dynamin(Rabbit polyclonal) | Abcam | Cat# ab3456RRID: AB_303818 | ICC (1:1000) |
| Antibody | Anti-mouse 555(Donkey polyclonal) | Thermo Fisher Scientific | Cat# A-31570RRID:AB_2536180 | ICC(1:1000) |
| Antibody | Anti-rabbit 488(Donkey polyclonal) | Thermo Fisher Scientific | Cat# A-21206 RRID:AB_2535792 | ICC(1:1000) |
| Antibody | Anti-mouse 647(Donkey polyclonal) | Thermo Fisher Scientific | Cat# A32787 RRID:AB_2762830 | ICC(1:1000) |
| Antibody | Anti-rabbit 555(Goat polyclonal) | Thermo Fisher Scientific | Cat# A32732 RRID:AB_2633281 | ICC(1:1000) |
| Antibody | Anti-mouse 488(Goat polyclonal) | Thermo Fisher Scientific | Cat# A32723 RRID:AB_2633275 | ICC(1:1000) |
| Antibody | Anti-rabbit 647(Goat polyclonal) | Thermo Fisher Scientific | Cat# A32733TR RRID:AB_2866492 | ICC(1:1000) |
| Recombinant DNA reagent | pCDH-EF1-MCS-T2A-copGFP | System Biosciences | Cat# CD526A-1 | A lentiviral vector |
| Recombinant DNA reagent | CMV::SypHy 4 A | Dr Leon LagnadoPubMed 16982422 | Cat# 24478RRID:Addgene_24478 | SypHy was subcloned into a pCDH lentiviral vector containing a synapsin 1 promoter in lab |
| Recombinant DNA reagent | pCDH-SYN1-sypHy | This paper | N/A | Plasmid was packaged into lentivirus, which was used to transduce primary neurons |
| Recombinant DNA reagent | pCDH-EF1-sypHy-T2A-TRPM7WT | This paper | N/A | Plasmid was used to transfect TRPM7 KO neurons |
| Recombinant DNA reagent | pCDH-EF1-sypHy-T2A-TRPM7LCF | This paper | N/A | Plasmid was used to transfect TRPM7 KO neurons |
| Recombinant DNA reagent | pCDH-EF1- TRPM7WT (Flag tag on N-term) | This paper | N/A | Plasmid was packaged into lentivirus, which was then used to infect TRPM7 KO chromaffin cells |
| Recombinant DNA reagent | pCDH-EF1-TRPM7LCF (Flag tag on N-term) | This paper | N/A | Plasmid was packaged into lentivirus, which was then used to infect TRPM7 KO chromaffin cells |
| Recombinant DNA reagent | TRPM7 (Flag tag on N-term) | Dr AM ScharenbergPubMed11385574 | Cat# 45482, AddgeneRRID:Addgene_45482 | DNA was subcloned into a pCDH lentiviral vector containing a EF1 promoter in lab |
| Recombinant DNA reagent | vGlut1-pHluorin | Dr V HauckePMID:21808019 | N/A | DNA was subcloned into a pCDH lentiviral vector containing a synapsin one promoter in lab |
| Recombinant DNA reagent | CaMKIIα-iGluSnFR | Dr ER ChapmanPMID:32515733 | N/A | S72A variant was used in this paper; DNA was subcloned into a pCDH lentiviral vector containing a synapsin 1 promoter in lab |
| Recombinant DNA reagent | Syn-GCaMP6f | Dr TA Ryan lab PMID:28162809 | N/A | DNA was subcloned into a pCDH lentiviral vector containing a synapsin 1 promoter in lab |
| Software, algorithm | Igor Pro 8 | WaveMetrics | RRID:SCR_000325 | |
| Software, algorithm | Excel | Microsoft | RRID:SCR_016137 | |
| Software, algorithm | Micro-Manager | ImageJ | RRID:SCR_000415 | |
| software, algorithm | FIJI | Fiji.sc | RRID:SCR_002285 | |
| Software, algorithm | Adobe Illustrator CS2 | Adobe | RRID:SCR_010279 | |
| Software, algorithm | Prism | GraphPad | RRID:SCR_002798 | |
| Software, algorithm | NIS-Elements | Nikon | RRID:SCR_014329 |
Additional files
Download links
A two-part list of links to download the article, or parts of the article, in various formats.
Downloads (link to download the article as PDF)
Open citations (links to open the citations from this article in various online reference manager services)
Cite this article (links to download the citations from this article in formats compatible with various reference manager tools)
TRPM7 is critical for short-term synaptic depression by regulating synaptic vesicle endocytosis
eLife 10:e66709.
https://doi.org/10.7554/eLife.66709


