Evolution of irreversible somatic differentiation
- Max Planck Institute for Evolutionary Biology, Germany
- Asia Pacific Center for Theoretical Physics, Republic of Korea
- Department of Physics, POSTECH, Republic of Korea
Figures
Figure 1
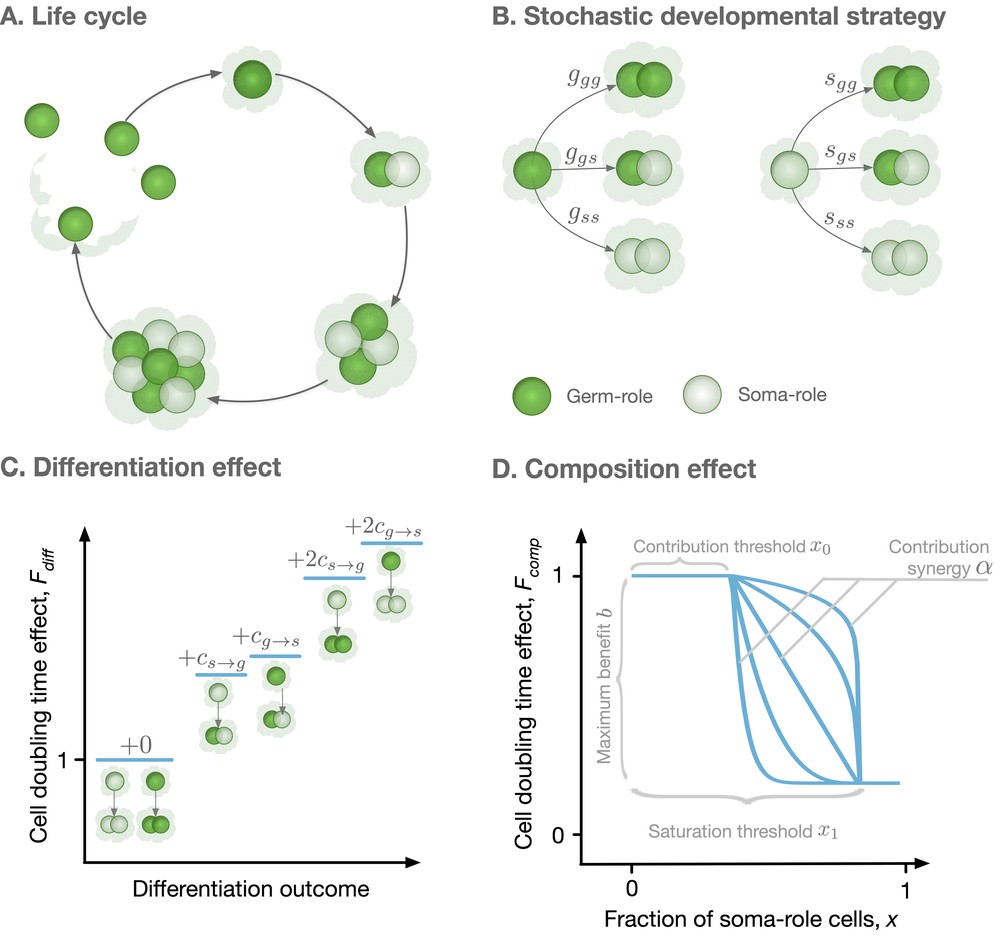
Model overview.
(A) The life cycle of an organism starts with a single germ-role cell. In each round, all cells divide and daughter cells can differentiate into a role different from the maternal cell’s role. When the organism reaches maturity, it reproduces: each germ-role cell becomes a newborn organism and each soma-role cell dies. (B) Change of cell roles is controlled by a stochastic developmental strategy defined by probabilities of each possible outcomes of a cell division. (C) Differentiation of cells requires an investment of resources and, thus, slows down the organism growth. Each cell differentiation event incurs a cost ( or ). (D) The growth contribution of somatic cells is controlled by a function that decreases the doubling time with the fraction of somatic cells. The form of this function is controlled by four parameters, x0, x1, , and .
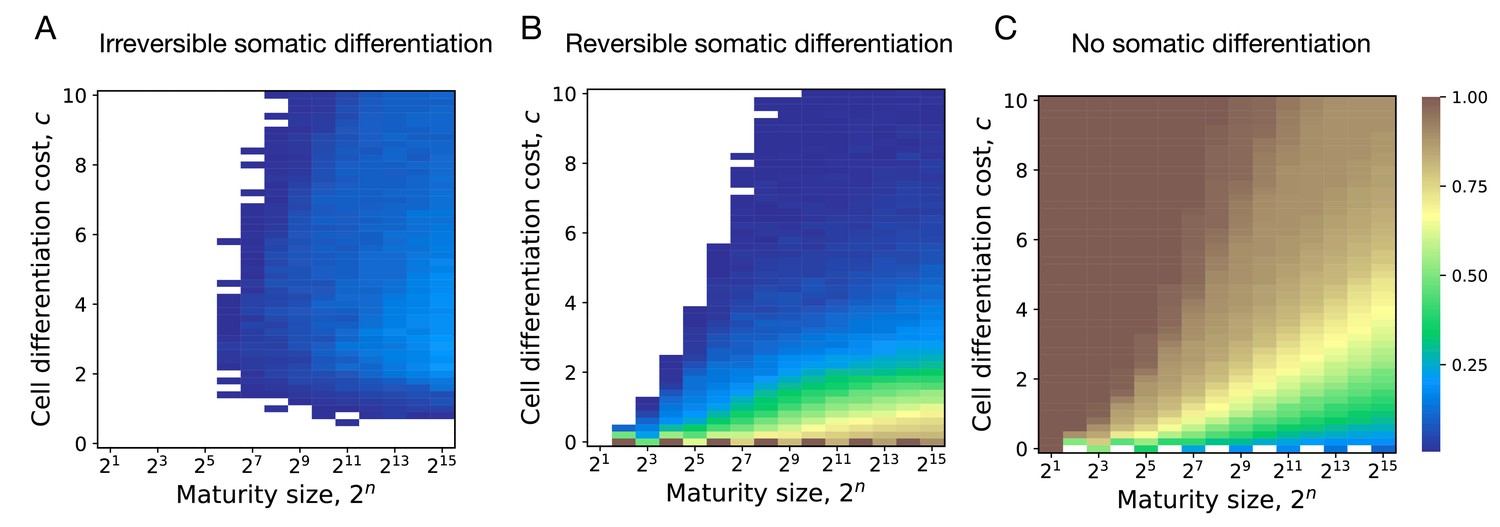
Figure 2
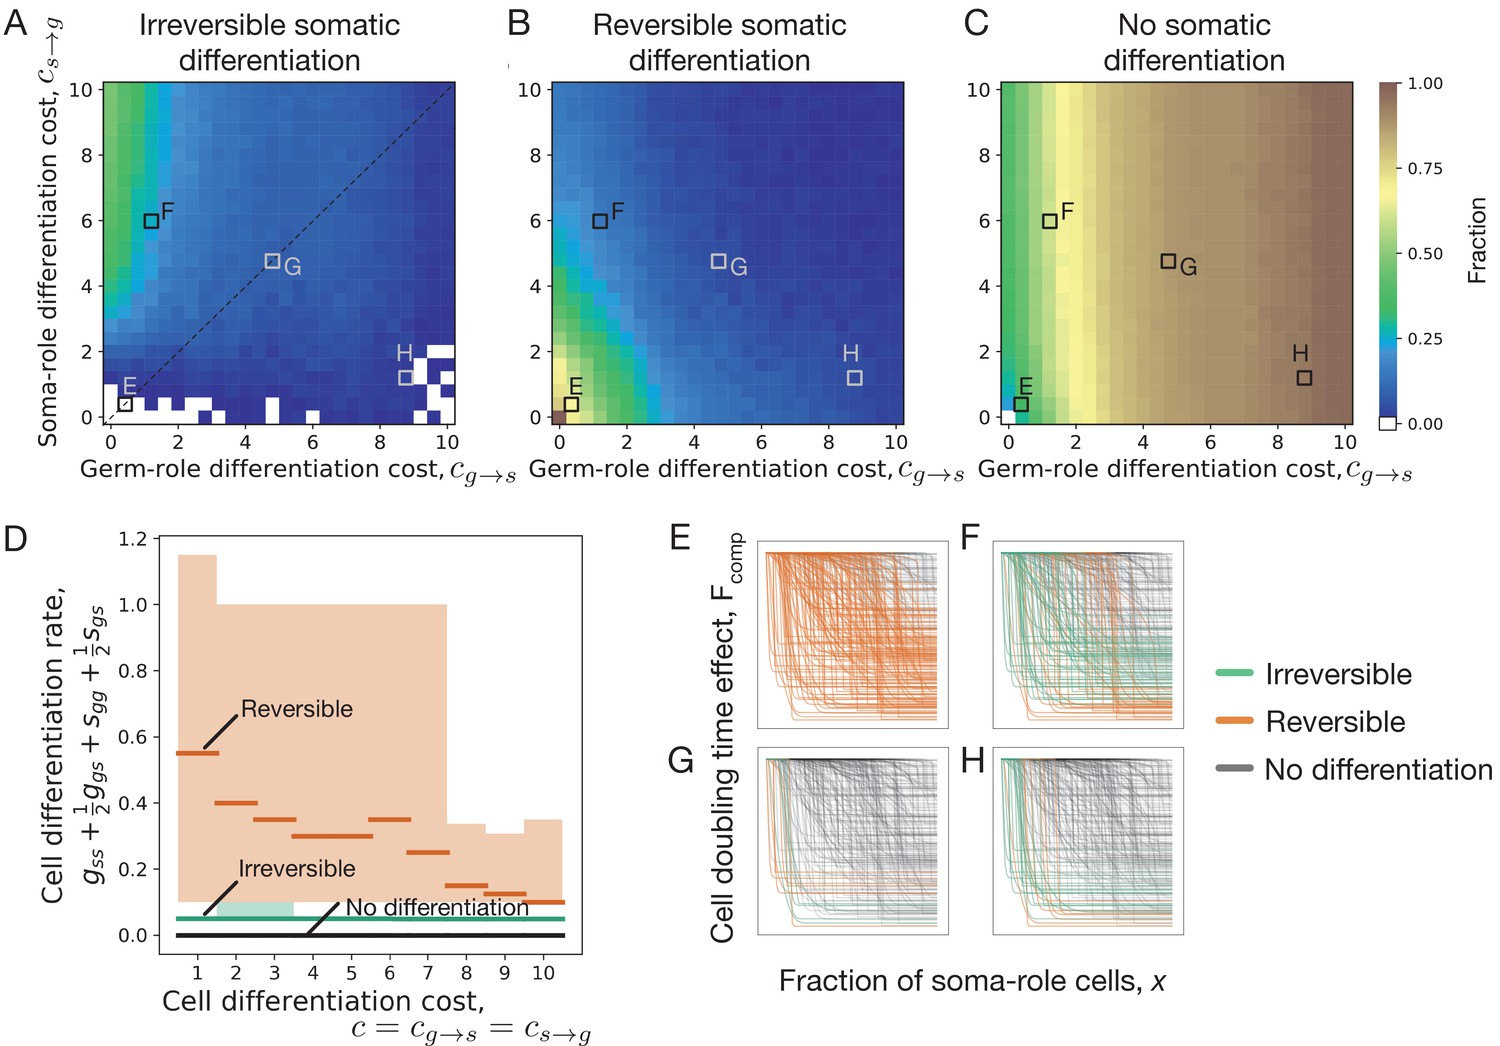
Impact of cell differentiation costs on the evolution of development strategies.
The fractions of 200 random composition effect profiles promoting irreversible (A), reversible (B), and no differentiation (C) strategies at various cell differentiation costs (, ). In the absence of costs (), only reversible strategies were observed. Reversible strategies are prevalent at smaller cell differentiation costs. No differentiation strategies are the most abundant at large costs for germ-role cells (). Irreversible strategies are the most abundant at large costs for soma-role cells (). (D) Cumulative cell differentiation rate in developmental strategies evolutionarily optimal at various differentiation costs (), separated by class (irreversible somatic differentiation, reversible somatic differentiation, or no somatic differentiation). Thick lines represent median values within each class, shaded areas show 90% confidence intervals. For each cost value, 3000 random profiles are used in this panel. Evolutionary optimal reversible strategies (orange) have much higher rates of cell differentiation than irreversible strategies (green). Consequently, reversible strategies are penalized more under costly differentiation. (E–H) Shapes of composition effect profiles (compare Figure 1D) promoting irreversible (green lines), reversible (orange lines), and no differentiation (black lines) strategies at four parameter sets indicated in panel A. The maturity size used in the calculation is 210 cells.
Figure 3

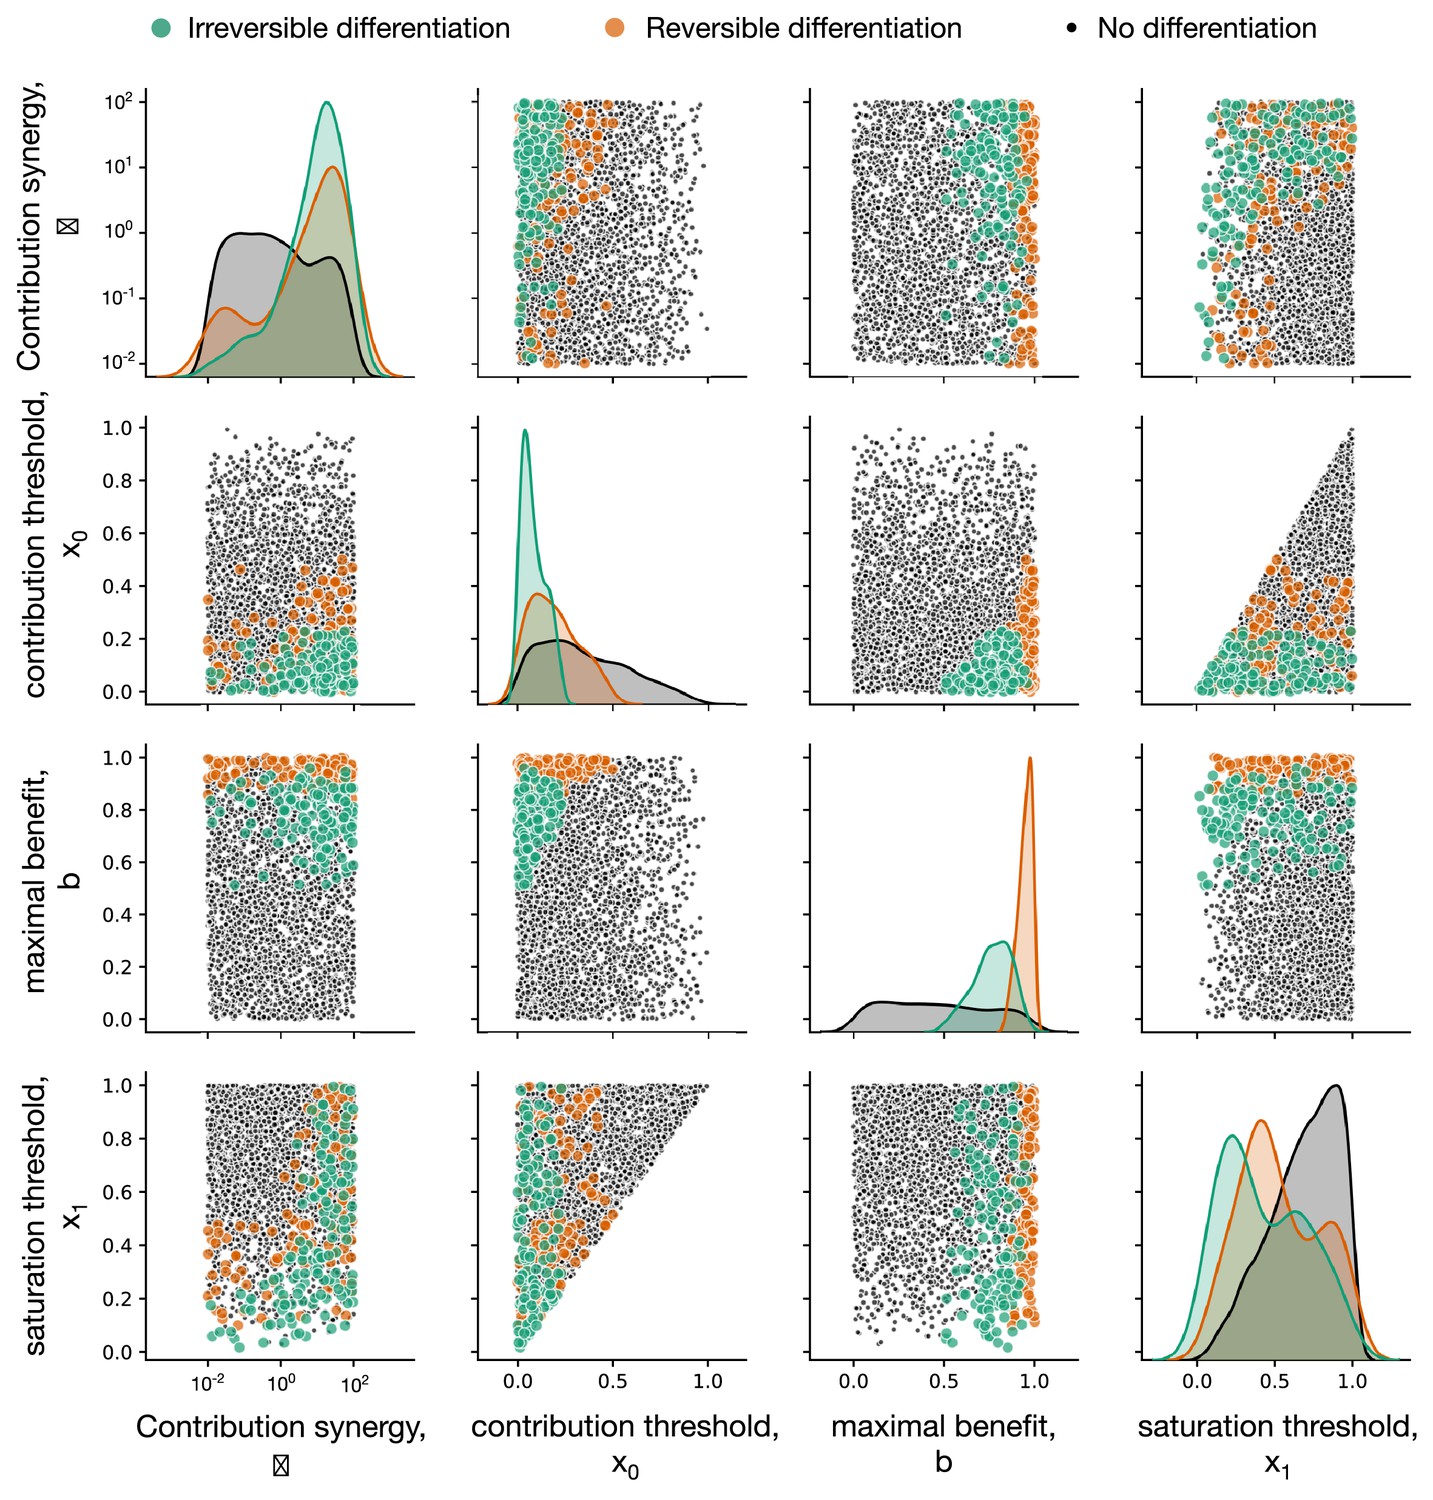
Irreversible soma evolves when substantial benefits arise at small concentrations of soma-role cells.
In all panels, the data representing the entire set of composition effect profiles is presented in grey, while the subset promoting irreversible strategies is coloured. (A, B) Median and 90% confidence intervals of composition effect profiles at different differentiation costs (A, number of cell division ) and maturity sizes (B, differentiation costs ). (C, D) The set of composition effect profiles in the parameter space. Each point represents a single profile ( and ). (C) The co-distribution of the saturation threshold (x1) and the contribution synergy () reveals that either x1 must be small or must be large. (D) Co-distribution of the contribution threshold (x0) and the maximal benefit () shows that x0 must be small, while must be intermediate to promote irreversible differentiation. A total of 3000 profiles are used for panels A, C, D and 1000 profiles for panel B.
Figure 4
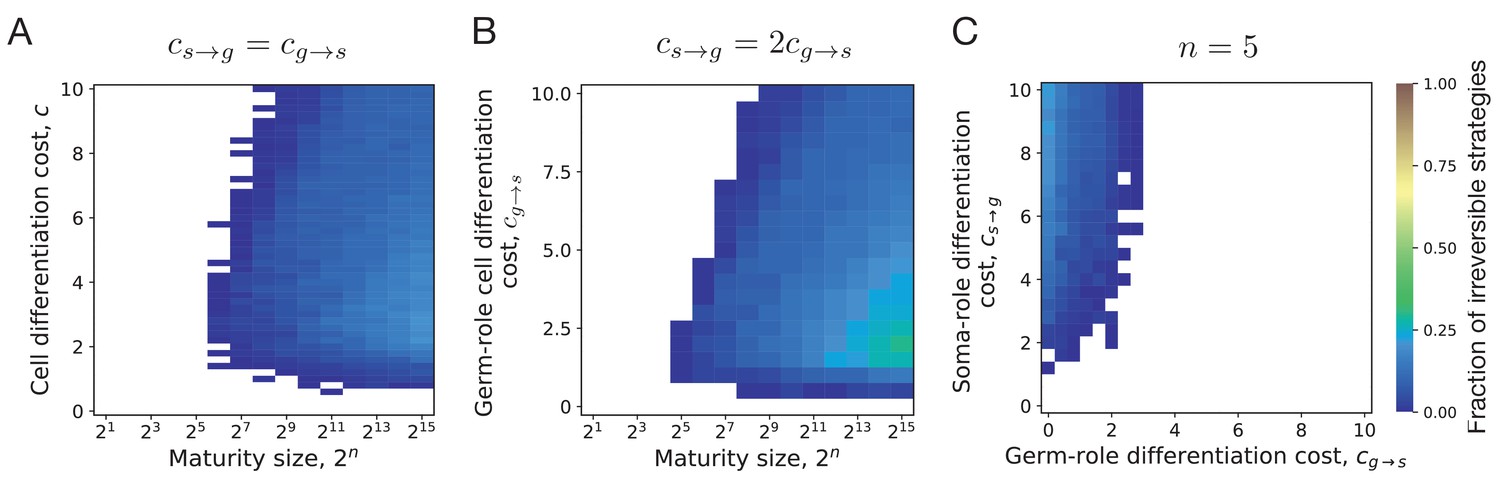
Irreversible differentiation can evolve if organism grows to a large enough size in the course of its life cycle.
(A) The fraction of composition effect profiles promoting irreversible strategies at various cell differentiation costs () and maturity sizes (). Irreversible strategies were only found for maturity size 26 = 64 cells and larger. (B) The fraction of composition effect profiles promoting irreversible strategies at unequal differentiation costs . A rare occurrences of irreversible strategies (∼1%) was detected at the maturity size cells in a narrow range of cell differentiation costs but not at the smaller sizes. (C) The range of cell differentiation costs allowing evolution of irreversible strategies at at the maturity size () cells. For irreversible strategies to evolve at such a small size, the differentiation from soma-role to germ-role must be much more costly than the opposite transition ().
Figure 5
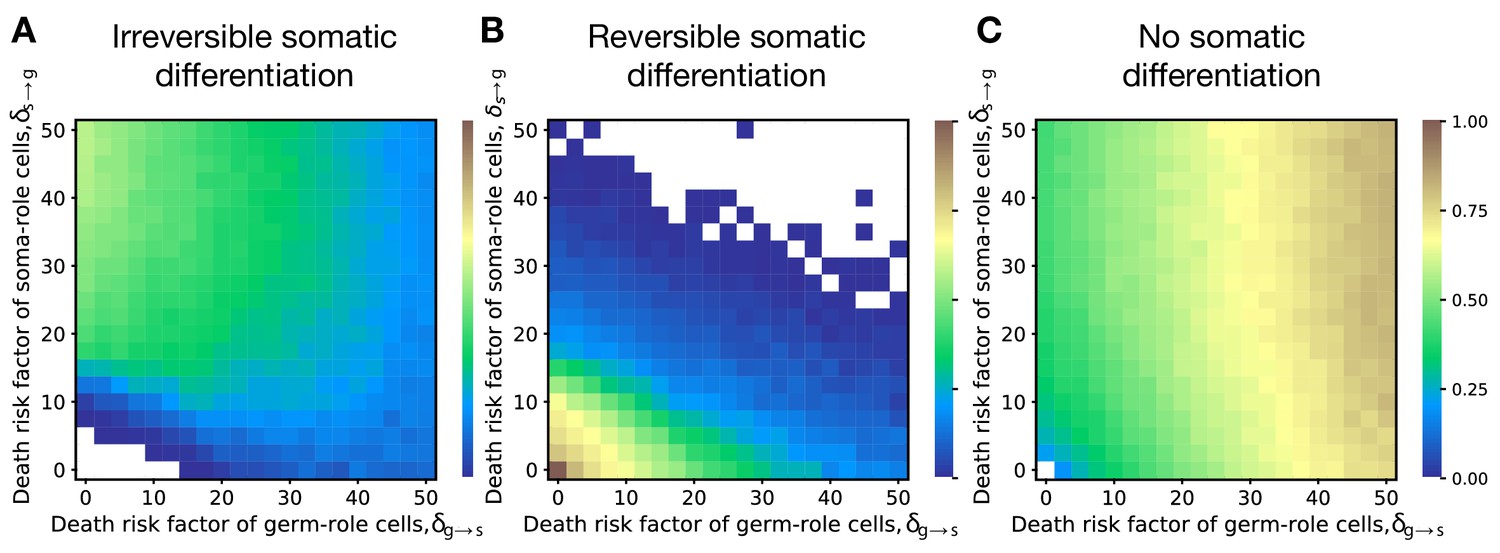
Irreversible differentiation can evolve if cell differentiation incurs a risk of organism death instead of division delay.
The fractions of 200 random composition effect profiles promoting irreversible (A), reversible (B), and no differentiation (C) strategies at various risks of cell differentiation (, ). The qualitative pattern is very similar to the results obtained with the model of cell differentiation causing delay, see Figure 2A–C. In the absence of risk (), only reversible strategies were observed. Reversible strategies are prevalent at smaller risk values. No differentiation strategies are the most abundant at large risk of germ-to-soma transition (). Irreversible strategies are the most abundant at large risks of soma-to-germ transition (). The maturity size used in the calculation is 210 cells. The legend is the same as that in Figure 2A–C.
Appendix 2—figure 1
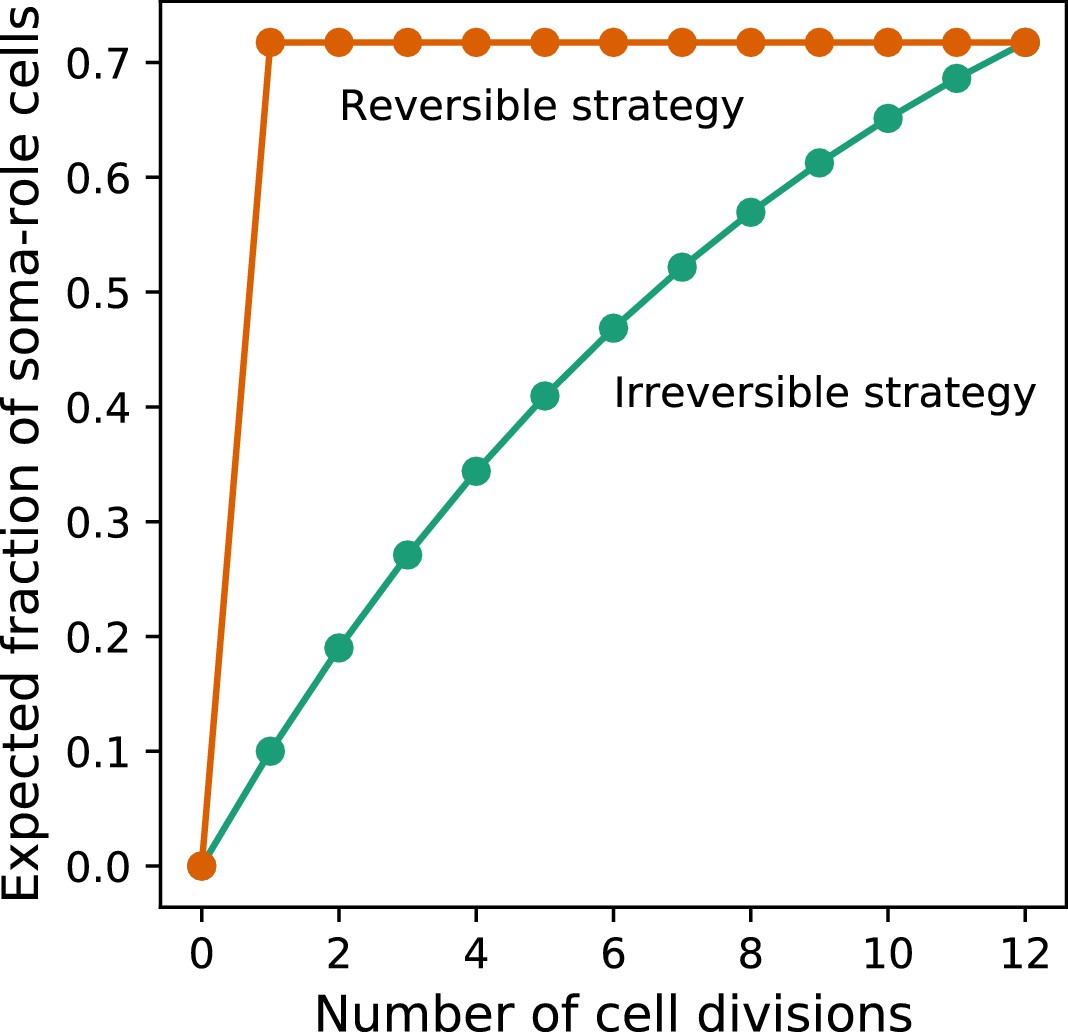
Under costless differentiation, for any irreversible somatic differentiation strategy, exists a reversible somatic differentiation strategy dominating it.
The green curve shows the dynamics of the expected fraction of soma-role cells in an organism using an irreversible strategy (, , ). The orange curve shows the dynamics of the expected fraction of soma-role cells in an organism using the specific reversible strategy , . In this strategy, the number of offspring produced at the end of the life cycle is the same as in the considered irreversible strategy. At the same time, the fraction of soma-role cells during the life cycle is larger. Therefore, under costless differentiation, the presented reversible strategy is more effective than the considered irreversible strategy.
Appendix 3—figure 1
Impact of maturity size on the evolution of development strategies.
The fractions of 200 random composition effect profiles promoting irreversible (A), reversible (B), and no differentiation (C) strategies at various cell differentiation costs () and maturity size . Irreversible strategies are most abundant at large maturity sizes and intermediary cell differentiation costs. Reversible strategies are most abundant at small cell differentiation costs. No differentiation strategies are most abundant at small maturity sizes and cell differentiation costs. The legend is the same as that in Figure 2A–C.
Appendix 4—figure 1
Impact of composition effect parameters on the evolution of development strategies.
Each diagonal panel represents individual distribution of each of four parameters among composition effect profiles promoting irreversible (green), reversible (orange), and no differentiation (black) strategies. Each non-diagonal panel represents a pairwise co-distribution of these parameters. Irreversible (green) strategies are promoted at small contribution thresholds and intermediary maximal benefit . Also, either the contribution synergy must be large, or the saturation threshold should be small – see main text for detailed discussion. Reversible (orange) strategies require large – there the benefits of having a large number of soma-role cells outweighs costs paid by frequent differentiation. Due to the fast accumulation of soma-role cells, reversible strategies tolerate larger than irreversible. Reversible exhibit the same restrictions with respect to as irreversible and are insensitive to . For this figure, 3000 composition effect profiles were investigated with costs and .
Appendix 5—figure 1
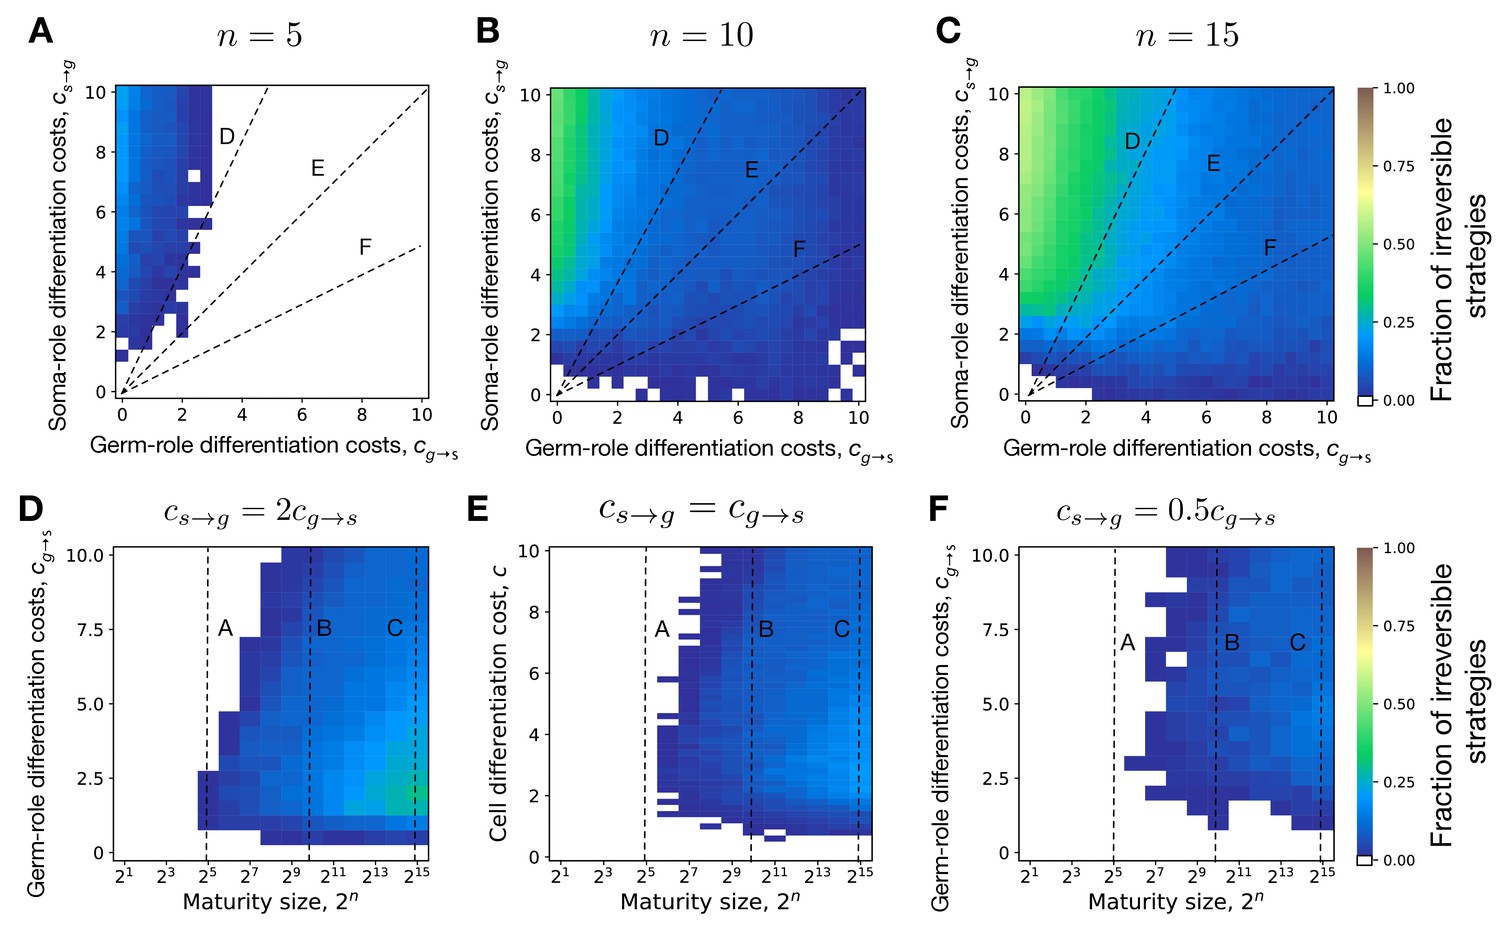
Evolution of irreversible somatic differentiation at unequal cell differentiation costs.
(A-C) The fraction of 200 random composition effect profiles promoting irreversible strategy at various cell differentiation costs (, ) at fixed maturity size (panel A), 10 (B), and 15 (C). Larger maturity sizes promote the evolution of irreversible differentiation across all cell differentiation costs. (D-F) The fraction of composition effect profiles promoting irreversible strategy at unequal cell differentiation costs (panel D), (E), and (F). Even with unequal differentiation costs, the minimal maturity size allowing the evolution of irreversible differentiation stays roughly the same — cells. Dashed lines indicate overlap between panels. The legend is the same as that in Figure 2A–C.
Appendix 6—figure 1
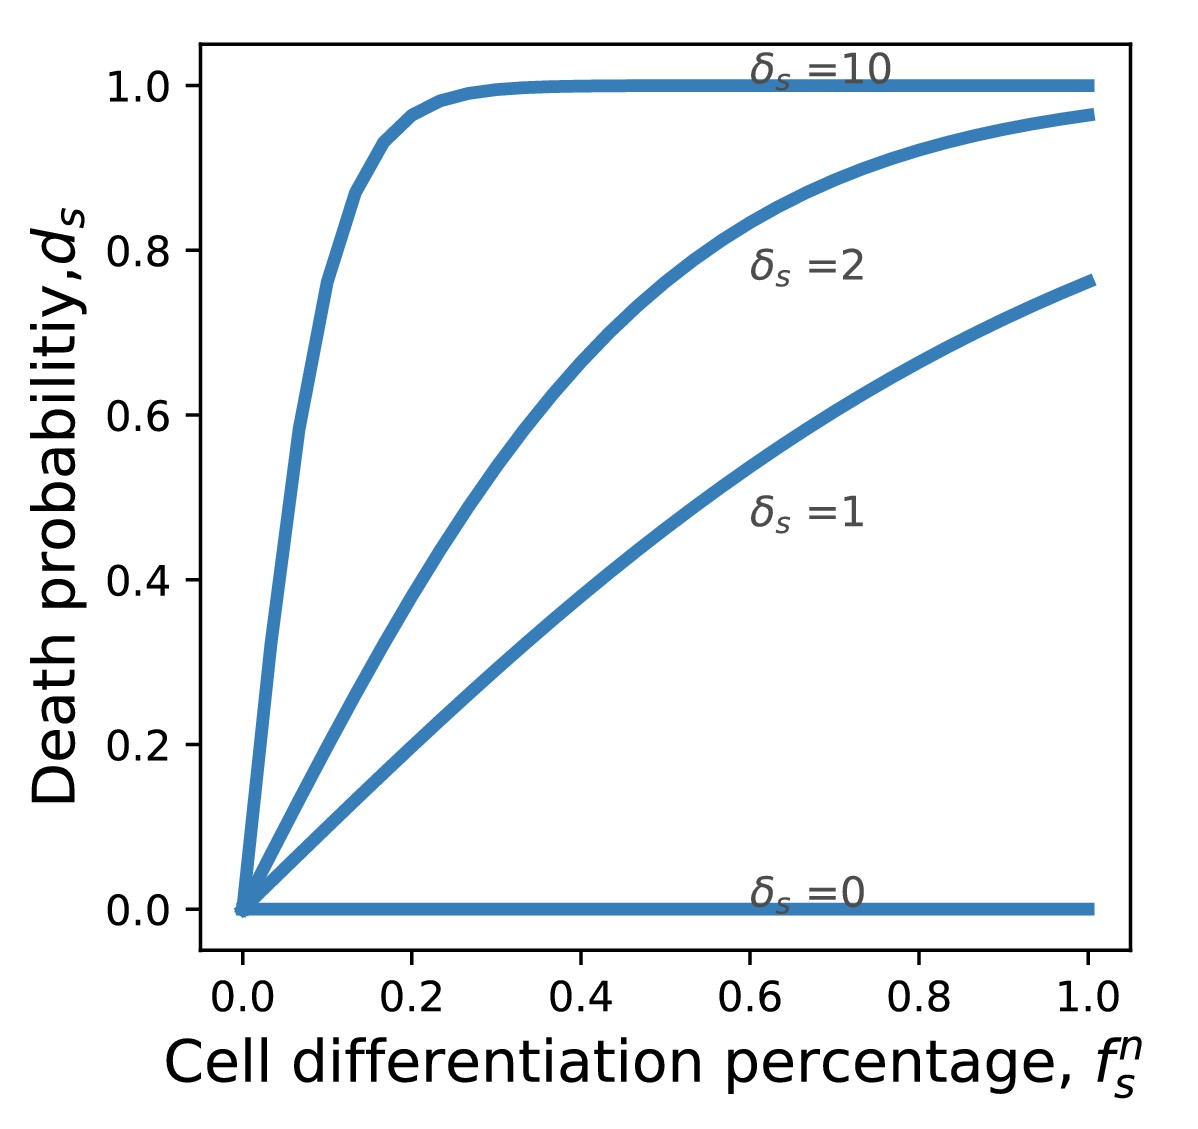
Probability of death from cancer as a function of the differentiation frequency.
If the frequency of differentiation is small, the death probability grows linearly. If the frequency of differentiation is large, the death probability saturates at 1.
Appendix 7—figure 1
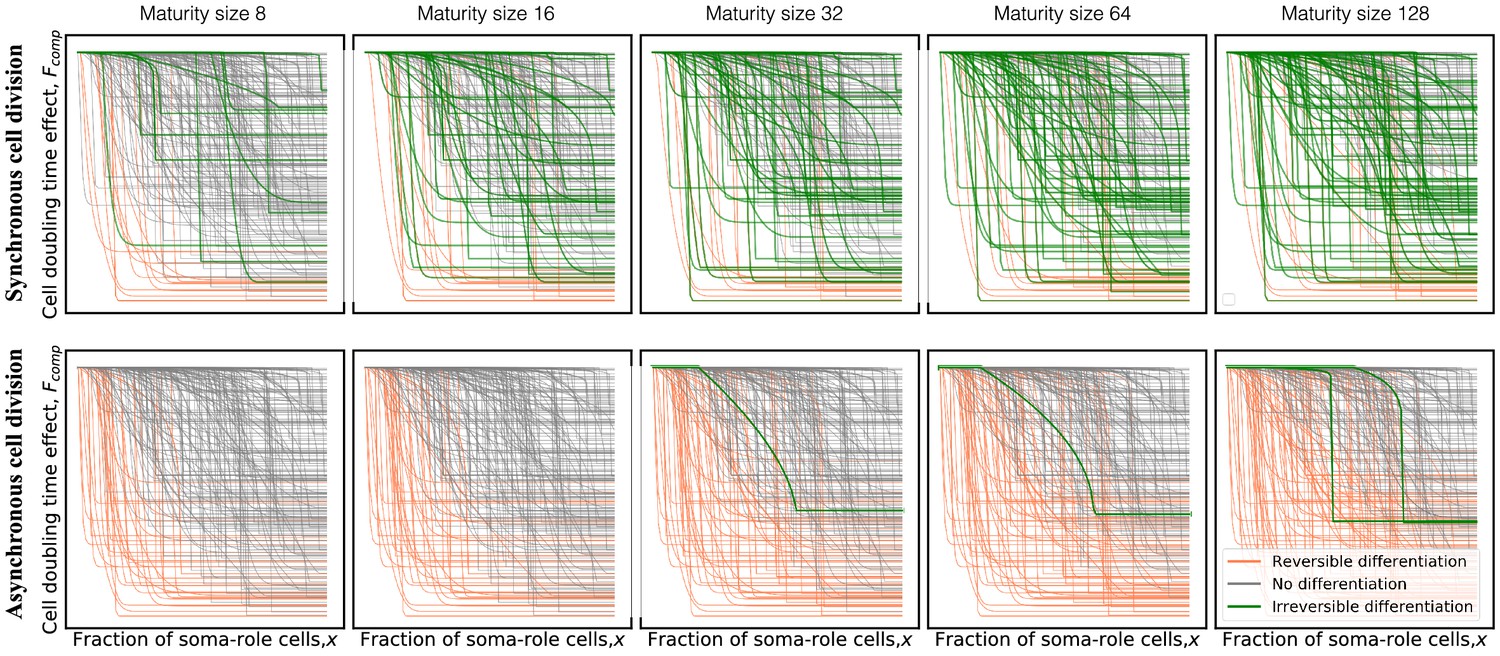
The model with asynchronous cell division suppresses evolution of irreversible somatic differentiation even at the most favourable conditions (, ).
Panels show composition profiles coloured according to the class of differentiation strategy: irreversible (green), reversible (orange), and no differentiation (black). In the synchronous model (top row), due to very asymmetric costs, irreversible differentiation is capable of evolving at small maturity sizes (eight cells). In the asynchronous model (bottom row), irreversible differentiation is not observed below 32 cells. Even at large sizes, the fraction of profiles promoting irreversible differentiation remains small.
Tables
Table 1
Classification of developmental strategies.
| Class | ||
|---|---|---|
| Irreversible somatic differentiation | <1 | = 1 |
| Reversible somatic differentiation | <1 | <1 |
| No somatic differentiation | = 1 | irrelevant |
Additional files
Download links
A two-part list of links to download the article, or parts of the article, in various formats.
Downloads (link to download the article as PDF)
Open citations (links to open the citations from this article in various online reference manager services)
Cite this article (links to download the citations from this article in formats compatible with various reference manager tools)
Evolution of irreversible somatic differentiation
eLife 10:e66711.
https://doi.org/10.7554/eLife.66711


