Subventricular zone/white matter microglia reconstitute the empty adult microglial niche in a dynamic wave
- Department of Neurobiology and Behavior, United States
- Institute for Memory Impairments and Neurological Disorders, United States
- Sue and Bill Gross Stem Cell Research Center, United States
- Department of Molecular Biology and Biochemistry, United States
- Department of Developmental and Cell Biology, United States
- Department of Anatomy and Neurobiology, United States
- Department of Physical Medicine & Rehabilitation, University of California, Irvine, United States
Figures
Figure 1
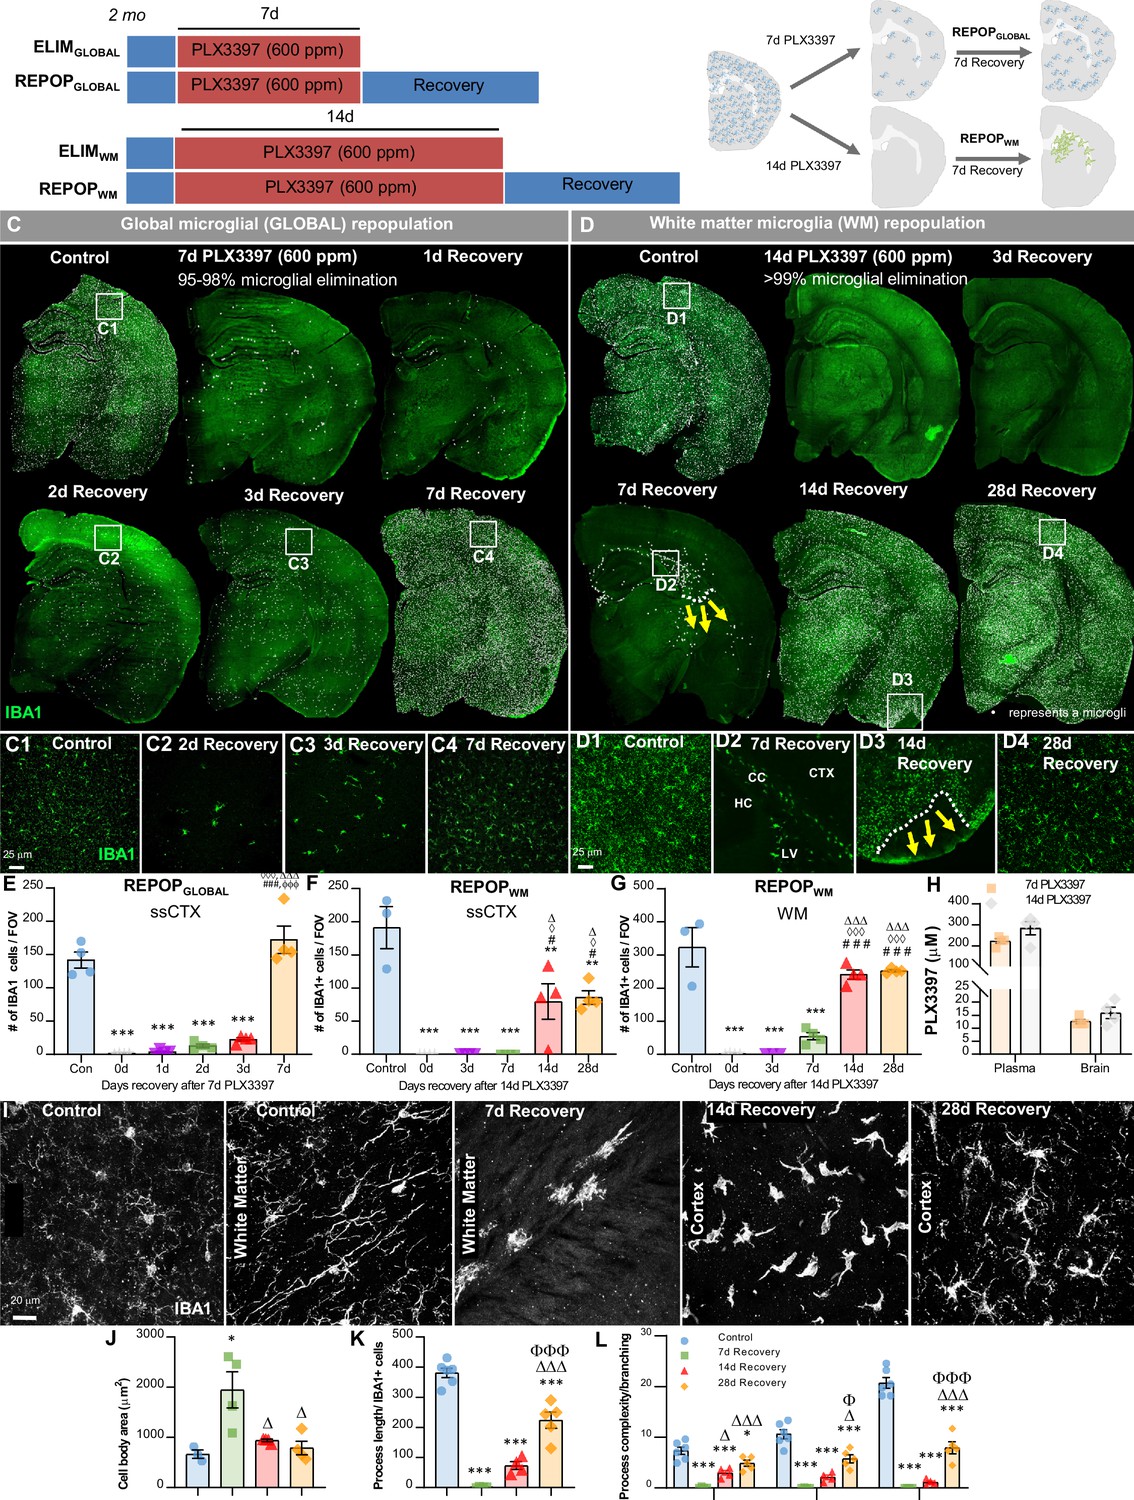
Sustained high dose of CSF1R inhibitor unmasks a distinct form of myeloid cell CNS repopulation.
(A–B) Experimental paradigm and schematic depicting dose and duration of PLX3397 (600 ppm) treatment and subsequent inhibitor withdrawal allowing for global microglial (GLOBAL) and white matter microglia (WM) repopulation. For GLOBAL repopulation: 2-month-old wild-type (WT) mice were treated with 600 ppm of PLX3397 for 7 days, achieving ~90–98% brain-wide microglial depletion, with remaining microglia visibility dispersed throughout the brain parenchyma, and then placed on control diet for 7 days (7d recovery) allowing for microglial repopulation. At 7 day recovery, repopulating microglia reconstitute the brain from areas in which previously remaining microglia were deposited. For WM repopulation: 2-month-old WT mice were treated with 600 ppm of PLX3397 for 14 days, achieving 99.98% brain-wide microglial depletion, and then placed on control diet for 7 days allowing for microglial repopulation. At 7 day recovery, repopulating myeloid cells reconstitute the brain in specific neuroanatomical niches (e.g. ventricle, subventricular zone, white matter tracts, caudoputamen). (C–D) Representative immunofluorescence whole brain images of myeloid cells (IBA1, green) at each time point of treatment and recovery during GLOBAL (C) and WM (D) repopulation, with white dots superimposed over microglia. Due to the differential kinetics of these two forms of repopulation, repopulation (i.e. recovery) was evaluated at different timepoints, including initial stages with few cells, mid-repopulation, and full brain reconstitution. For GLOBAL repopulation: 2-month-old WT mice treated with control, 7 days of PLX3397 (7d PLX3397), 7 days of PLX3397 followed by 1 day on control diet (1d Recovery), 7 day of PLX3397 followed by 2 days on control diet (2d Recovery), 7 days of PLX3397 followed by 3 days on control diet (3d Recovery), and 7 days of PLX3397 followed by 7 days on control diet (7d Recovery). For WM repopulation: 2-month-old WT mice treated with control, 14 days of PLX3397 (14d PLX3397), 14 days of PLX3397 followed by 3 days on control diet (3d Recovery), 14 days of PLX3397 followed by 7 days on control diet (7d Recovery), 14 days of PLX3397 followed by 14 days on control diet (14d Recovery), and 14 days of PLX3397 followed by 28 days on control diet (28d Recovery). (C1–C4, D1–D4) Inserts of higher resolution confocal images of IBA1+ cells during repopulation. White dotted lines and yellow arrows highlight ‘wave’ edge and direction. (E–G) Quantification of IBA1+ cells per field of view (FOV) at each time point in cortical and white matter regions, respectively during GLOBAL (E) and WM (F–G) repopulation. (H) Pharmacokinetics analysis of PLX3397 levels in plasma and brain of mice treated with 7 day and 14 day PLX3397 (600 ppm). (I) Representative 63x immunofluorescence images of myeloid cells (IBA1, white) display morphological alterations. (J–L) Quantification of IBA1+ cell morphology: cell body area in the white matter tract (J), average process/filament length (K), and process complexity/branching (L) in the piriform cortex. Level 1–3+ indicates level of branching from the cell body. Data are represented as mean ± SEM (n=3–4). *p < 0.05, ** p < 0.01, *** p < 0.001; significance symbols represent comparisons between groups: (E) control *, 0d #, 1d ⋄, 2d Δ, 3d Φ; (F–G) control *, 0d #, 3d ⋄, 7d Δ. CC, corpus callosum; CTX, cortex; HC, hippocampus; LV, lateral ventricle.
-
Figure 1—source data 1
Sustained high dose of CSF1R inhibitor unmasks a distinct form of myeloid cell CNS repopulation.
- https://cdn.elifesciences.org/articles/66738/elife-66738-fig1-data1-v2.xlsx
Figure 2 with 1 supplement
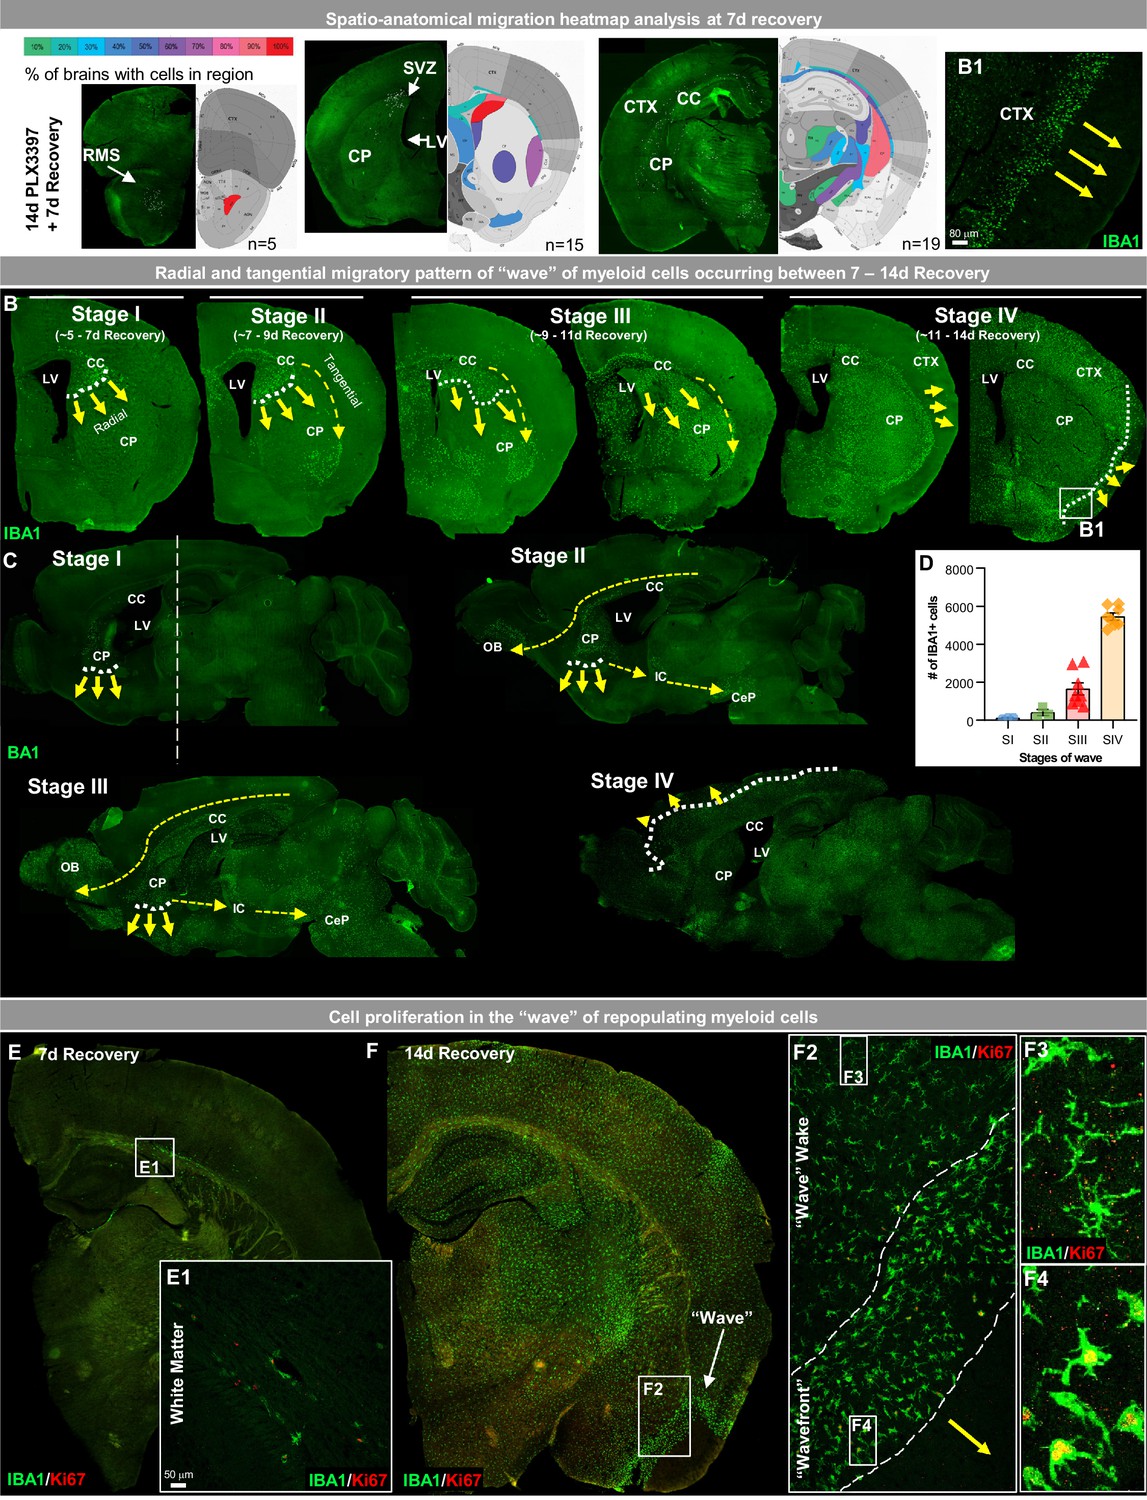
White matter microglia (WM) repopulation elicits a dynamic wave of repopulating proliferative myeloid cells.
(A) Spatial heat map of WM repopulation at 7 day recovery in three brain positions (Bregma 2.58 mm, 1.10 mm, −2.06 mm) depicting % of brains with cells present in specific brain regions (n=5–19). (B–C) Immunofluorescence whole brain coronal (B) and sagittal (C) section images of IBA1+ cells (green) show a sequential time course of the ‘wave’ (see higher resolution image of wavefront in B1 insert) of myeloid cells filling the brain between 7 and 14 day recovery during WM repopulation. White dotted lines and yellow arrows indicate the edge and direction of the ‘wave’, highlighting the radial migratory patterns of WM repopulating cells. Yellow dashed arrows indicate the direction of the tangential migratory pattern of WM repopulating cells, mostly utilizing WM tracts. The straight white dashed line in C shows the Bregma position at which coronal sections were taken for B. (E–F) Representative immunofluorescence whole brain images of myeloid cells (IBA1, green) and proliferating cells (Ki67, red) at 7 (A) and 14 (B) day recovery. Insets show higher resolution of IBA1 and Ki67 colocalization in initially repopulating cells (A1) and in cells outside and inside the wavefront (B2-4). Data are represented as mean ± SEM (n=3–8).
-
Figure 2—source data 1
White matter microglia (WM) repopulation elicits a dynamic wave of repopulating proliferative myeloid cells.
- https://cdn.elifesciences.org/articles/66738/elife-66738-fig2-data1-v2.xlsx
Figure 2—figure supplement 1
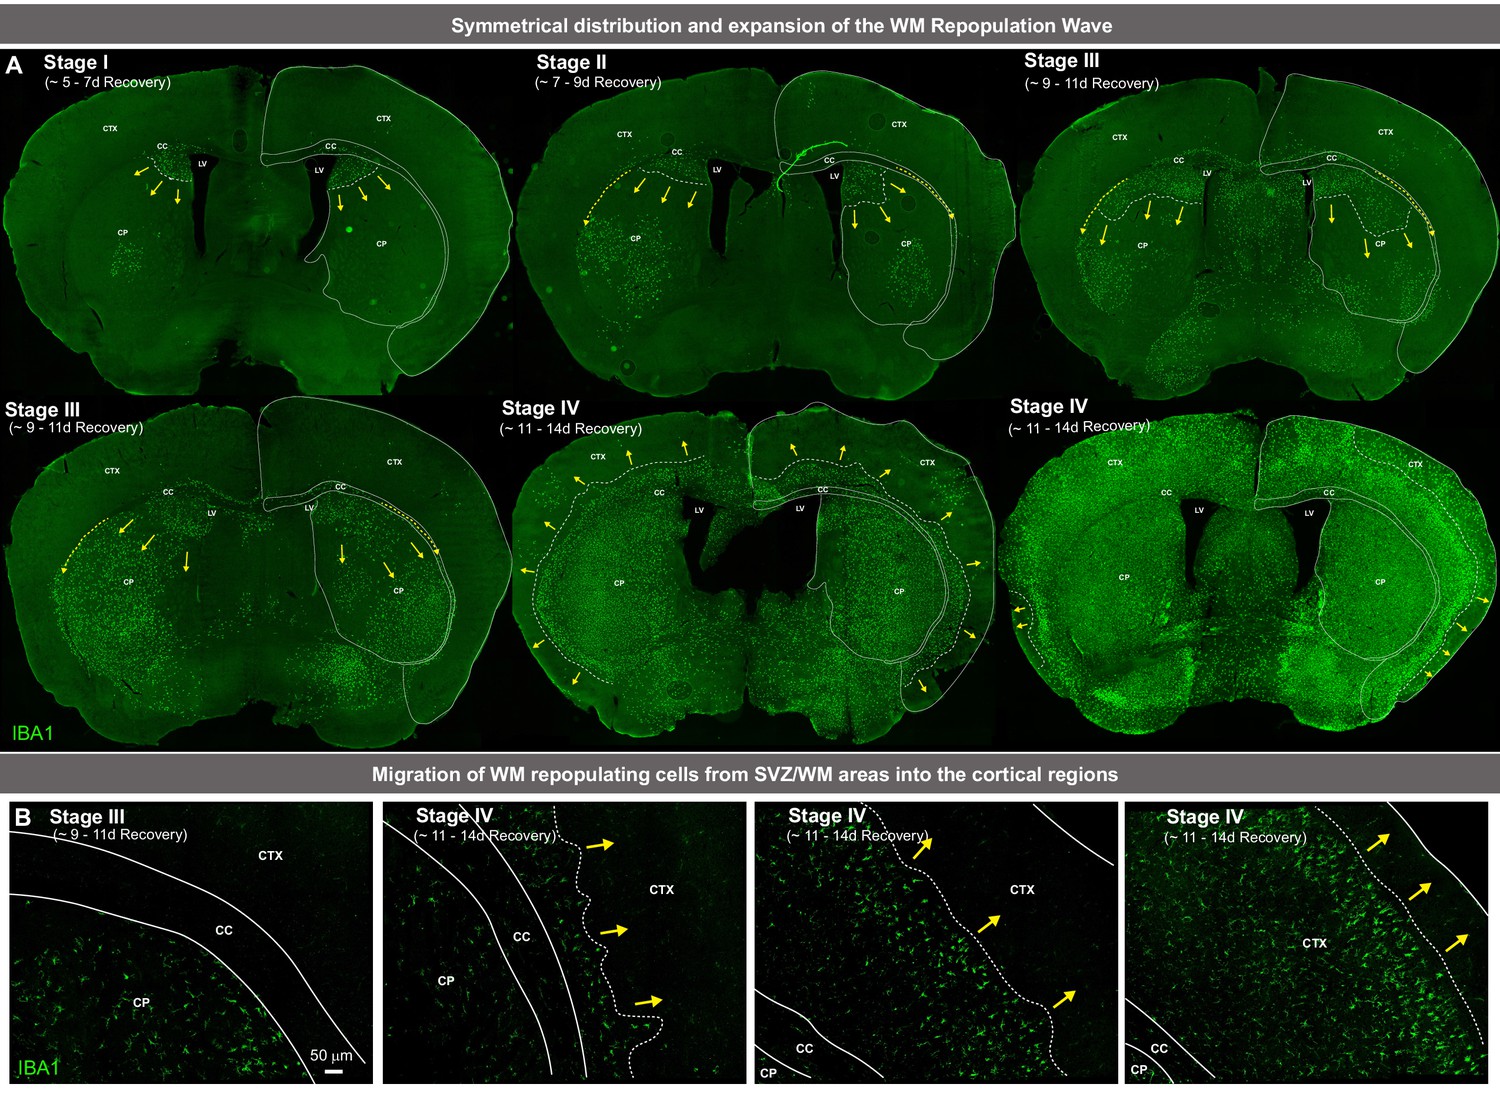
White matter microglia (WM) repopulation elicits a dynamic wave of repopulating proliferative myeloid cells.
(A) Immunofluorescence whole brain coronal section images of IBA1+ cells (green) show the Stages (i.e. sequential time course), including the symmetrical distribution and expansion, of the ‘wave’ of repopulating myeloid cells that fill the brain during WM repopulation. White lines separate different brain regions: corpus callosum (CC), cortex (CTX), caudoputamen (CP), and lateral ventricle (LV). White dotted lines and yellow arrows indicate the edge and direction of the ‘wave’, highlighting the radial migratory patterns of WM repopulating cells. Yellow dashed arrows indicate the direction of the tangential migratory pattern of WM repopulating cells, mostly utilizing WM tracts. (B) Representative tile scan confocal images of the migration of WM repopulating IBA1+ cells (green) out of the WM tracts and into cortical regions. White dotted lines indicate WM boundaries.
Figure 3 with 1 supplement
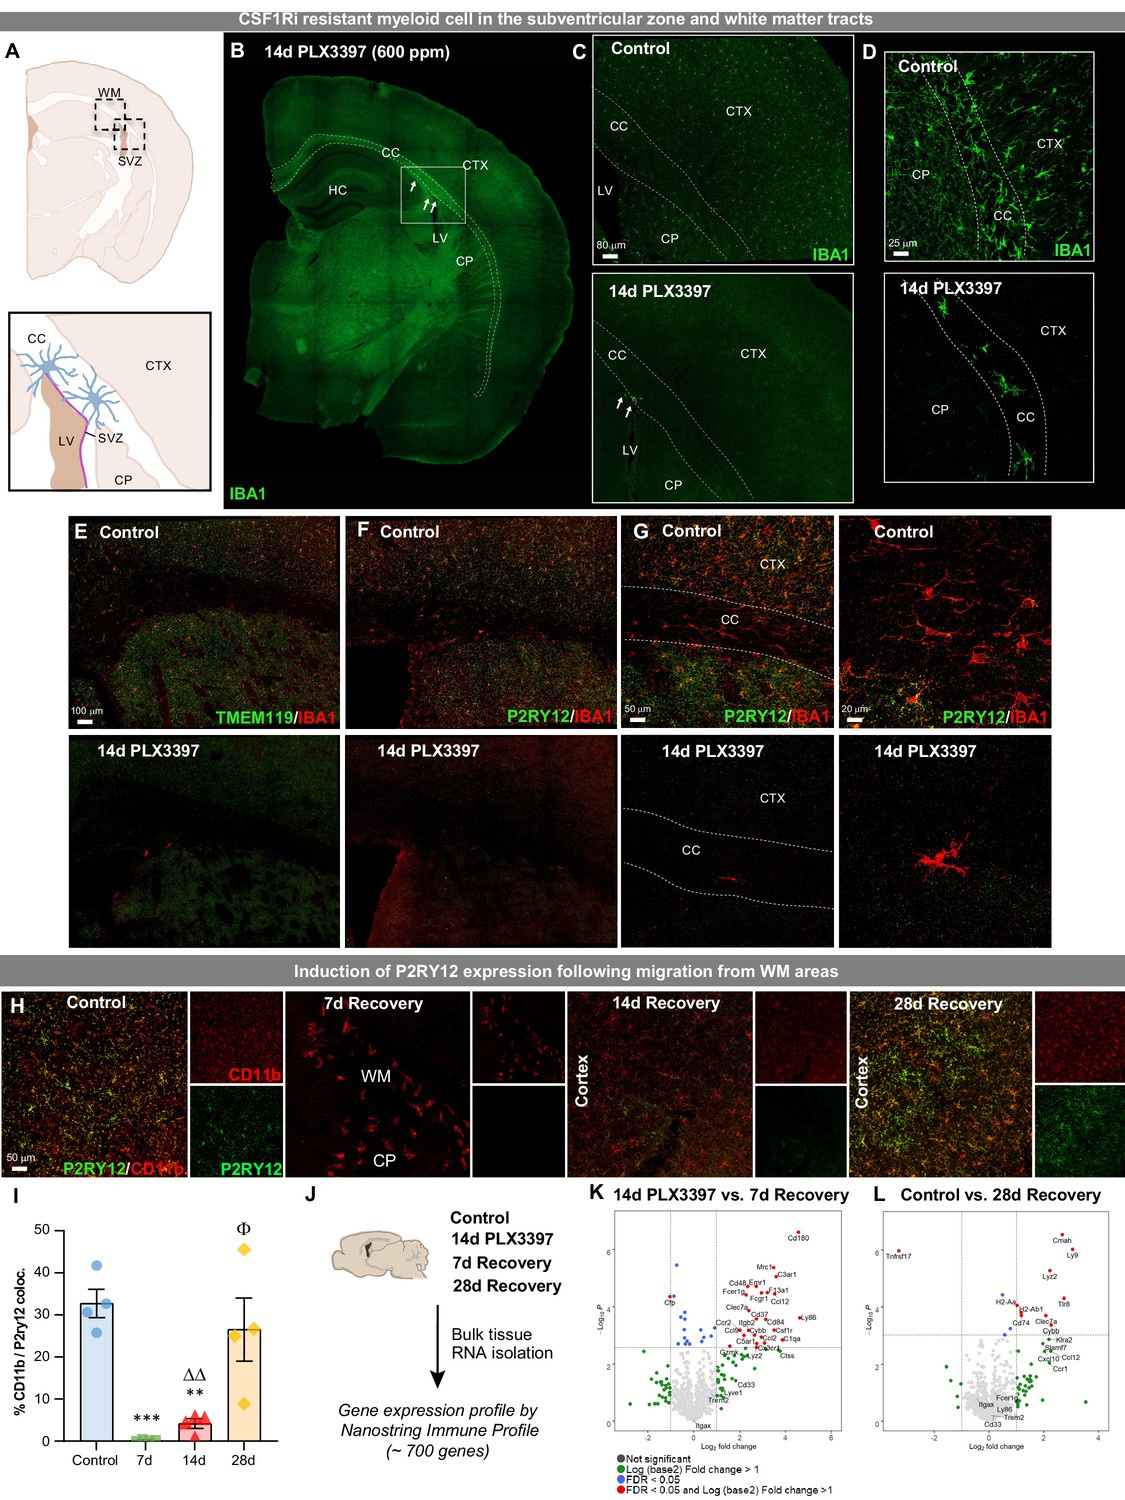
Extensive CSF1R inhibition unveils the presence of CSF1Ri-resistant myeloid cells in the subventricular zone and white matter tracts.
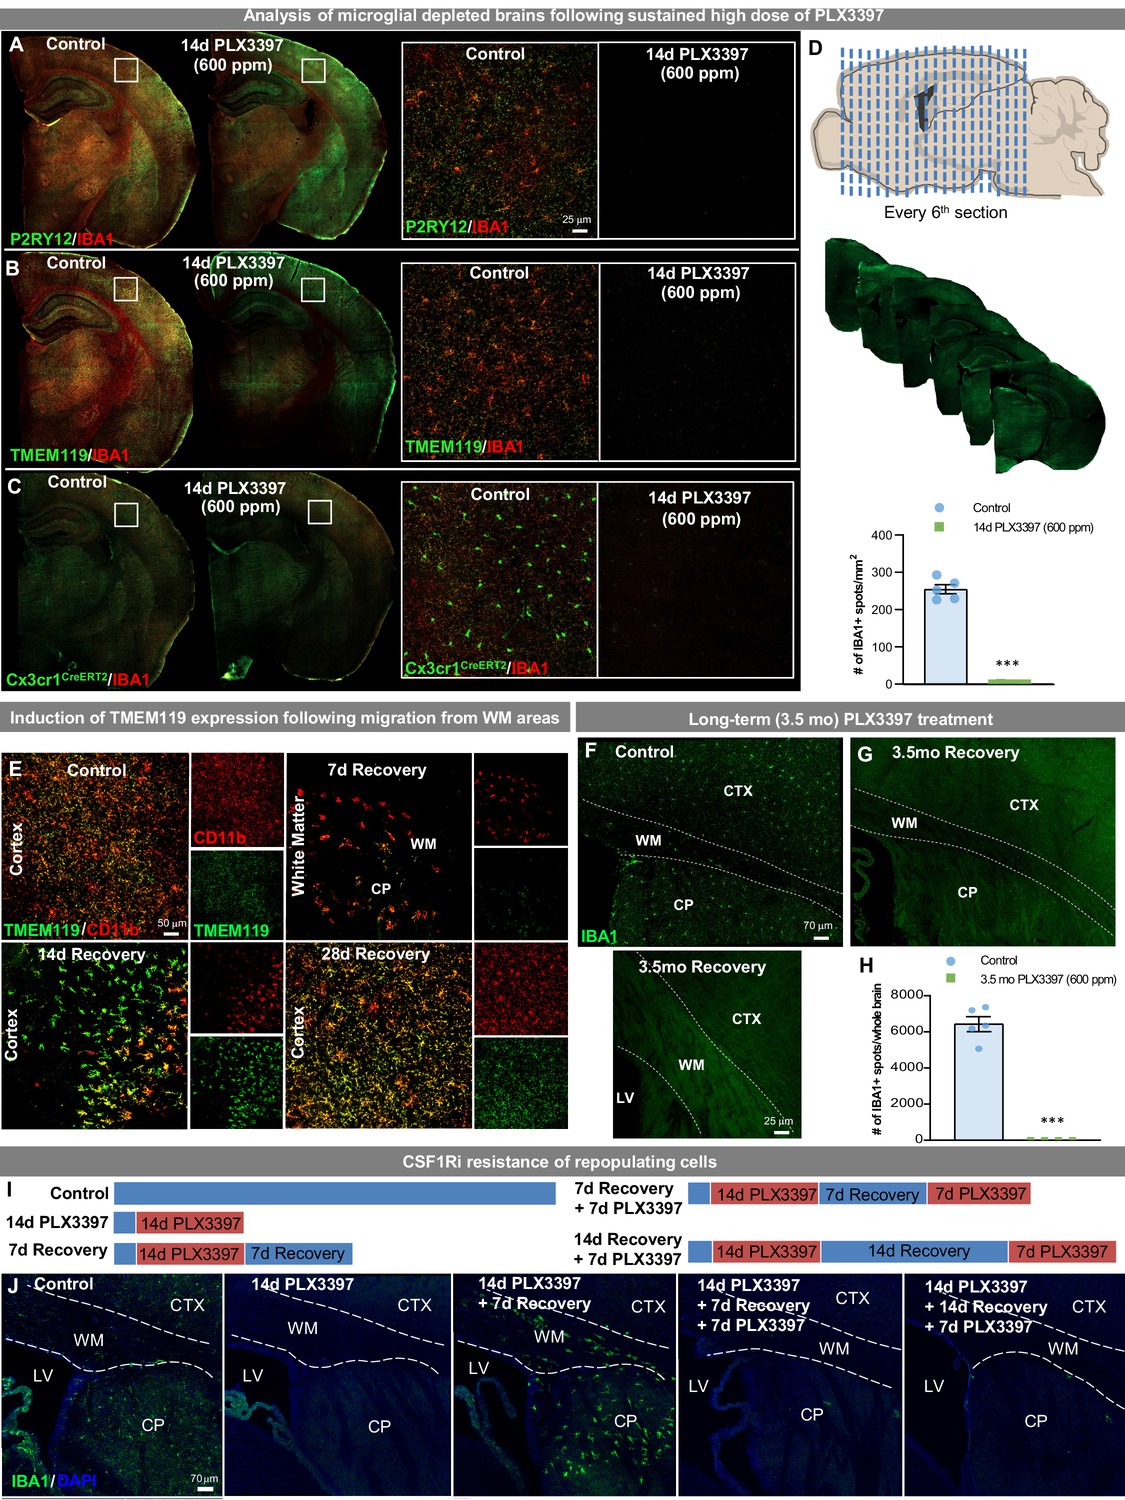
Two-month-old WT mice treated with vehicle or PLX3397 (600 ppm in chow) for 14 days to evaluate extent of microglial depletion. (A) Brain section schematic of SVZ and WM areas where CSF1Ri-resistant myeloid cells are present following 14 day PLX3397 (600ppm in chow) treatment. (B) Representative whole brain slice image of CSF1Ri-resistant IBA1+ cells (white arrows) near the SVZ/WM areas (white box) surrounding the lateral ventricle. (C–D) Representative tile scan (C) and high-resolution confocal (D) images of control and 14 day PLX3397 mice showing the deposition of surviving SVZ/WM IBA1+ (green) cells in WM areas (white dotted lines). (E–G) Representative tile scan (E–F) and confocal immunofluorescence image of IBA1+ cells co-stained with microglial-specific markers TMEM119 (E) and P2RY12 (F–G) in control and 14 day PLX3397 mice, showing that CSF1Ri-resistant cells are TMEM119- and P2RY12-. Higher resolution images illustrate atypical morphological profile of CSF1Ri-resistant cells. (H) Representative 20x images of myeloid cells (Cd11b, red) and P2RY12 (green). (I) Quantification of % colocalization of CD11b+ and P2RY12+ cells as seen in (H). (J) Control, 14 day PLX3397, 7 day recovery, and 28 day recovery mouse hemispheres were collected and analyzed for bulk-tissue gene expression changes using Nanostring Immune Profile. (K–L) Volcano plots displaying the fold change of genes (log2 scale) and their significance (y axis, -log10 scale) between 14 day PLX3397 depleted vs. 7 day recovery mice (K) and control vs 28 day recovery (L). Data are represented as mean ± SEM (n=3–5). *p < 0.05, ** p < 0.01, *** p < 0.001; significance symbols represent comparisons between groups: control *, 0d #, 3d ⋄, 7d Δ, 14d Φ. CC, corpus callosum; CP, caudoputamen; CTX, cortex; HC, hippocampus; LV, lateral ventricle; SVZ, subventricular zone; WM, white matter.
-
Figure 3—source data 1
Extensive CSF1R inhibition unveils the presence of CSF1Ri-resistant myeloid cells in the subventricular zone and white matter tracts.
- https://cdn.elifesciences.org/articles/66738/elife-66738-fig3-data1-v2.xlsx
Figure 3—figure supplement 1
Extensive CSF1R inhibition unveils the presence of CSF1Ri-resistant myeloid cell in the subventricular zone/white matter areas.
Two-month-old WT or Cx3cr1CreERT2 mice were treated with vehicle or PLX3397 (600 ppm in chow) for 14 days to evaluate extent of microglial depletion. (A–C) Representative whole brain slice images of IBA1+ cells co-stained with microglial-specific markers P2RY12 (A) and TMEM119 (B), or YFP, to detect microglia or cells of Cx3cr1 lineage (C), and ultimately microglial depletion efficiency. For Cx3cr1 lineage tracing studies, Cx3cr1CreERT2 mice were crossed with YFP reporter mice, treated with tamoxifen and then allowed to recover for 21 days prior to PLX3397 treatment. Inserts show 20x high-resolution images of brain regions highlighted by white boxes. (D) Total IBA1+ cells were quantified throughout the entire brain taking every 6th section (i.e. stereology-style) along the rostral-caudal axis of 2-month-old mice treated for 14 days with PLX3397 (600 ppm in chow). (E) Representative 20x images of myeloid cells (Cd11b, red) and a microglial-specific marker (TMEM119, green). (F–H) Two-month-old WT mice were treated with vehicle or PLX3397 (600 ppm in chow) for 3.5 months. (F–G) Representative tile scan confocal images of IBA1+ (green) cells in control and 3.5 month PLX3397 mice. G1 is a higher resolution image showing the absence of SVZ/WM myeloid cells following prolonged CSF1Ri treatment. (H) Quantification of the number of IBA1+ cells in the whole brains of control and 3.5 month PLX3397-treated mice. (I) Experimental schematic depicting dose and duration of CSF1Ri resistance study. Two-month-old WT mice were placed on PLX3397 (600 ppm) for 14 days, allowed to recover for 7 or 14 days on control diet (allowing for WM repopulation), and then placed back on CSF1Ri diet (PLX3397 600 ppm) for 7 days. Controls, 14 day PLX3397, and 7 day Recovery were also included for comparison. (J) Representative immunofluorescent images of IBA1+ cell (green) and DAPI staining (blue, used to distinguish structures), showing the susceptibility of WM repopulating cells once migrated from SVZ/WM areas. White dotted lines illustrate WM areas. Data are represented as mean ± SEM (n=4–5). *** p < 0.001. CP, caudoputamen; CTX, cortex; LV, lateral ventricle; WM, white matter.
Figure 4
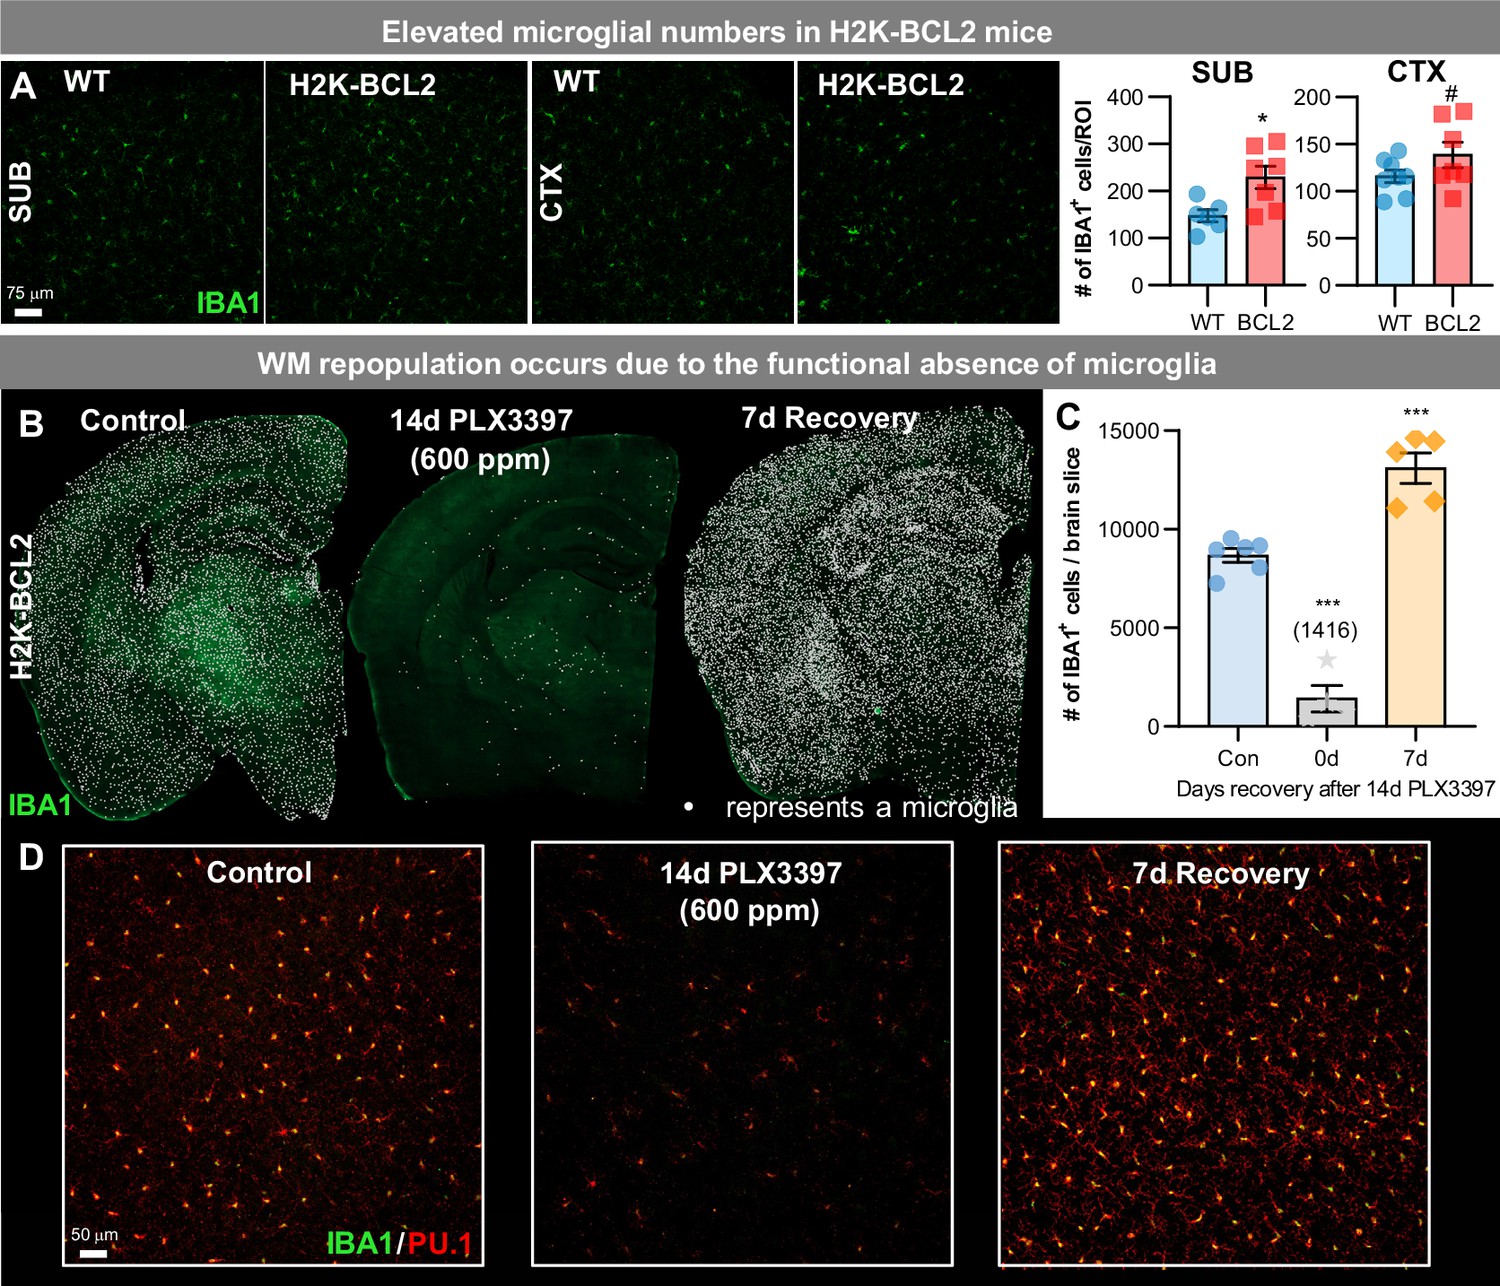
WM repopulation occurs due to an unprecedented level of microglial depletion.
(A) Representative 20x immunofluorescence images of IBA1+ (green) cells in WT and H2K-BCL2 mice. Quantification of IBA1+ cells per region of interest (ROI) in subiculum (SUB) and cortex (CTX). (B–D) H2K-BCL2 mice were treated with PLX3397 for 14 days (600 ppm in chow), the drug was withdrawn, and then mice were provided with 7 days to recover, allowing for repopulation. (B) Representative whole brain images of IBA1+ (green) cells in control, 14 day PLX3397, and 7 day recovery mice, with white dots superimposed over microglia, showing incomplete microglial depletion leads to GLOBAL repopulation. (C) Quantification of IBA1+ cells per whole brain slice, as seen in (B). (D) Higher resolution images of IBA1+ (green) and PU.1+ (red), a myeloid cell marker, cells. Data are represented as mean ± SEM (n=4–6). # p < 0.1, *p < 0.05, *** p < 0.001.
-
Figure 4—source data 1
WM repopulation occurs due to an unprecedented level of microglial depletion.
- https://cdn.elifesciences.org/articles/66738/elife-66738-fig4-data1-v2.xlsx
Figure 5 with 2 supplements
WM repopulating myeloid cells derive from an existing Cx3cr1+ cell source originating from the SVZ/WM area.
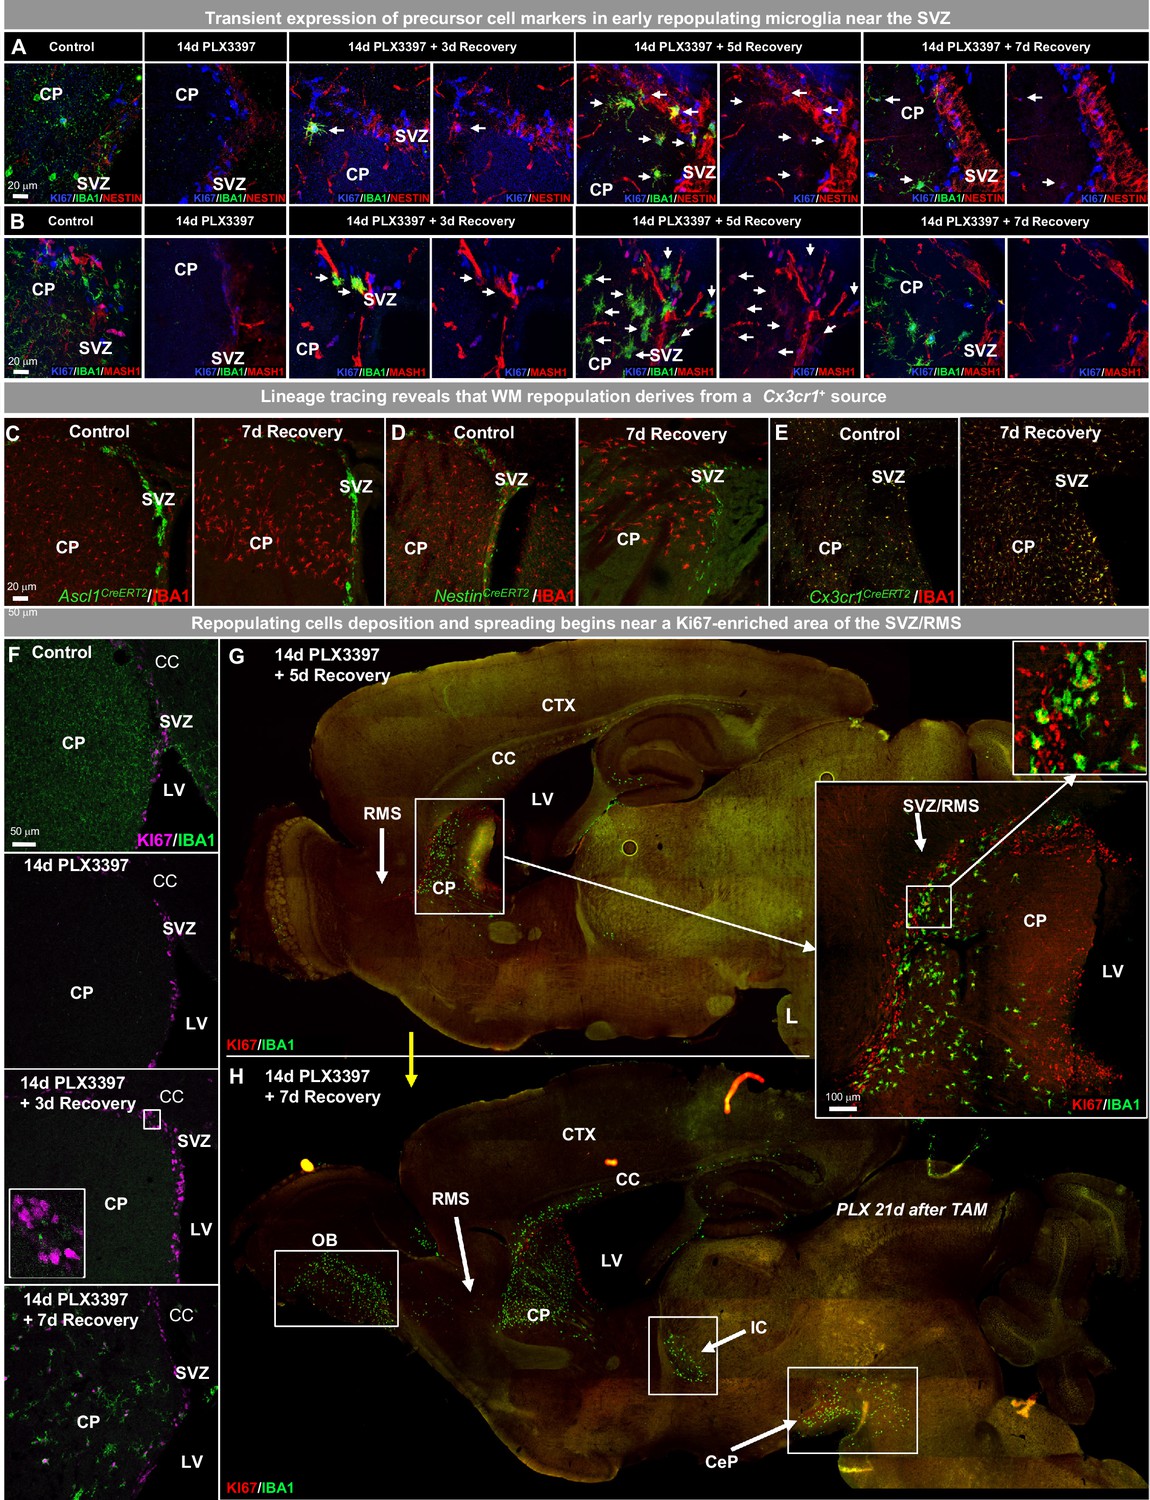
(A–H) Two-month-old WT mice were treated with PLX3397 (600 ppm) for 14 days, then allowed to recover without PLX3397 for 3, 5, and 7 days. (A–B) Representative 63x immunofluorescence images of proliferating (Ki67+, blue) myeloid cells (IBA1+, green) staining for positive for common cell lineage/precursor cell markers: NESTIN (red, A) and MASH1 (red, B) in the SVZ of control, 14 day PLX3397, 3 day recovery, 5 day recovery, and 7 day recovery mice. (C–E) CreER-directed lineage-specific labeling. In these mouse lines, tamoxifen-inducible Cre-recombinase is expressed under control of the promoter of interest. When activated by tamoxifen, the CreER fusion protein translocates to the nucleus allowing transient recombination to occur and, when crossed to a YFP reporter, visualization of induced expression via eYFP. (C–D) Representative 20x images of IBA1+ (red) and associated promoter-driven lineage-derived (YFP, green) cells in control and 7 day recovery Ascl1CreERT2/YFP (B) and NestinCreERT2/YFP (C) mice. (E) Representative 20x images of IBA1+ (red) and Cx3cr1+ lineage derived (YFP, green) cells in control and 7 day recovery mice. (F–H) Representative coronal (F) and sagittal (G–H) brain images of IBA1+ (green) and Ki67+ (red, B–C) cells near SVZ/RMS regions between 5 and 14 days recovery. Inserts provide higher resolution images of cells near the SVZ/RMS proliferative site of repopulation, illustrating the spread of repopulating cells via WM/axonal tracts (i.e. RMS) between the CP and OB and between other WM regions (IC and CeP). CP, caudoputamen; CC, corpus callosum; CTX, cortex; LV, lateral ventricle; RMS, rostral migratory stream; SVZ, subventricular zone; OB, olfactory bulb; IC, internal capsule; CeP, cerebral peduncle.
-
Figure 5—source data 1
WM repopulating myeloid cells derive from an existing Cx3cr1+ cell source originating from the SVZ/WM area.
- https://cdn.elifesciences.org/articles/66738/elife-66738-fig5-data1-v2.xlsx
Figure 5—figure supplement 1
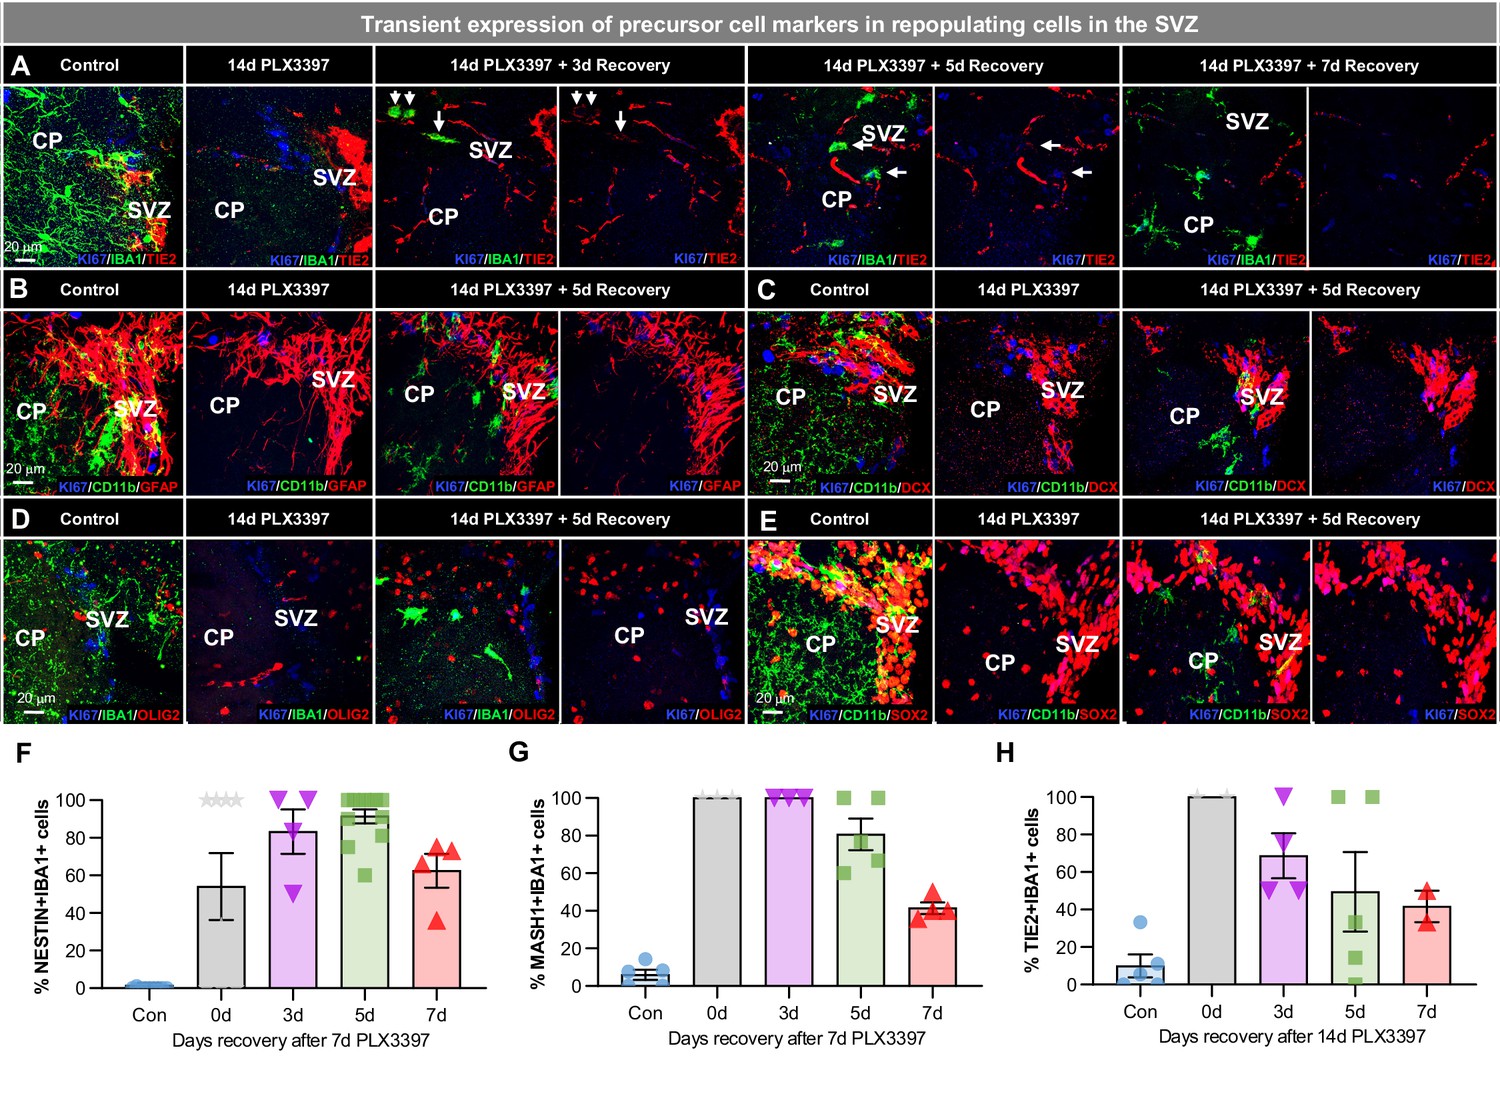
Early WM repopulating myeloid cells transiently express some precursor cell markers.
(A–E) Representative 63x immunofluorescence images of proliferating (Ki67+, blue) myeloid cells (CD11b+ or IBA1+, green) staining for positive for common cell lineage/precursor cell markers: TIE2 (red, A), and negative for: GFAP (red, B), doublecortin (DCX, red, C), OLIG2 (red, D), and SOX2 (red, E) in the SVZ of control, 14 day PLX3397, 3 day recovery, 5 day recovery, and 7 day recovery mice. (F–H) Quantification of IBA1+ cells that co-stain with the precursor cell markers: NESTIN (F), MASH1 (G), and TIE2 (H). Data are represented as mean ± SEM (n=4–5). CP, caudoputamen; SVZ, subventricular zone.
Figure 5—figure supplement 2
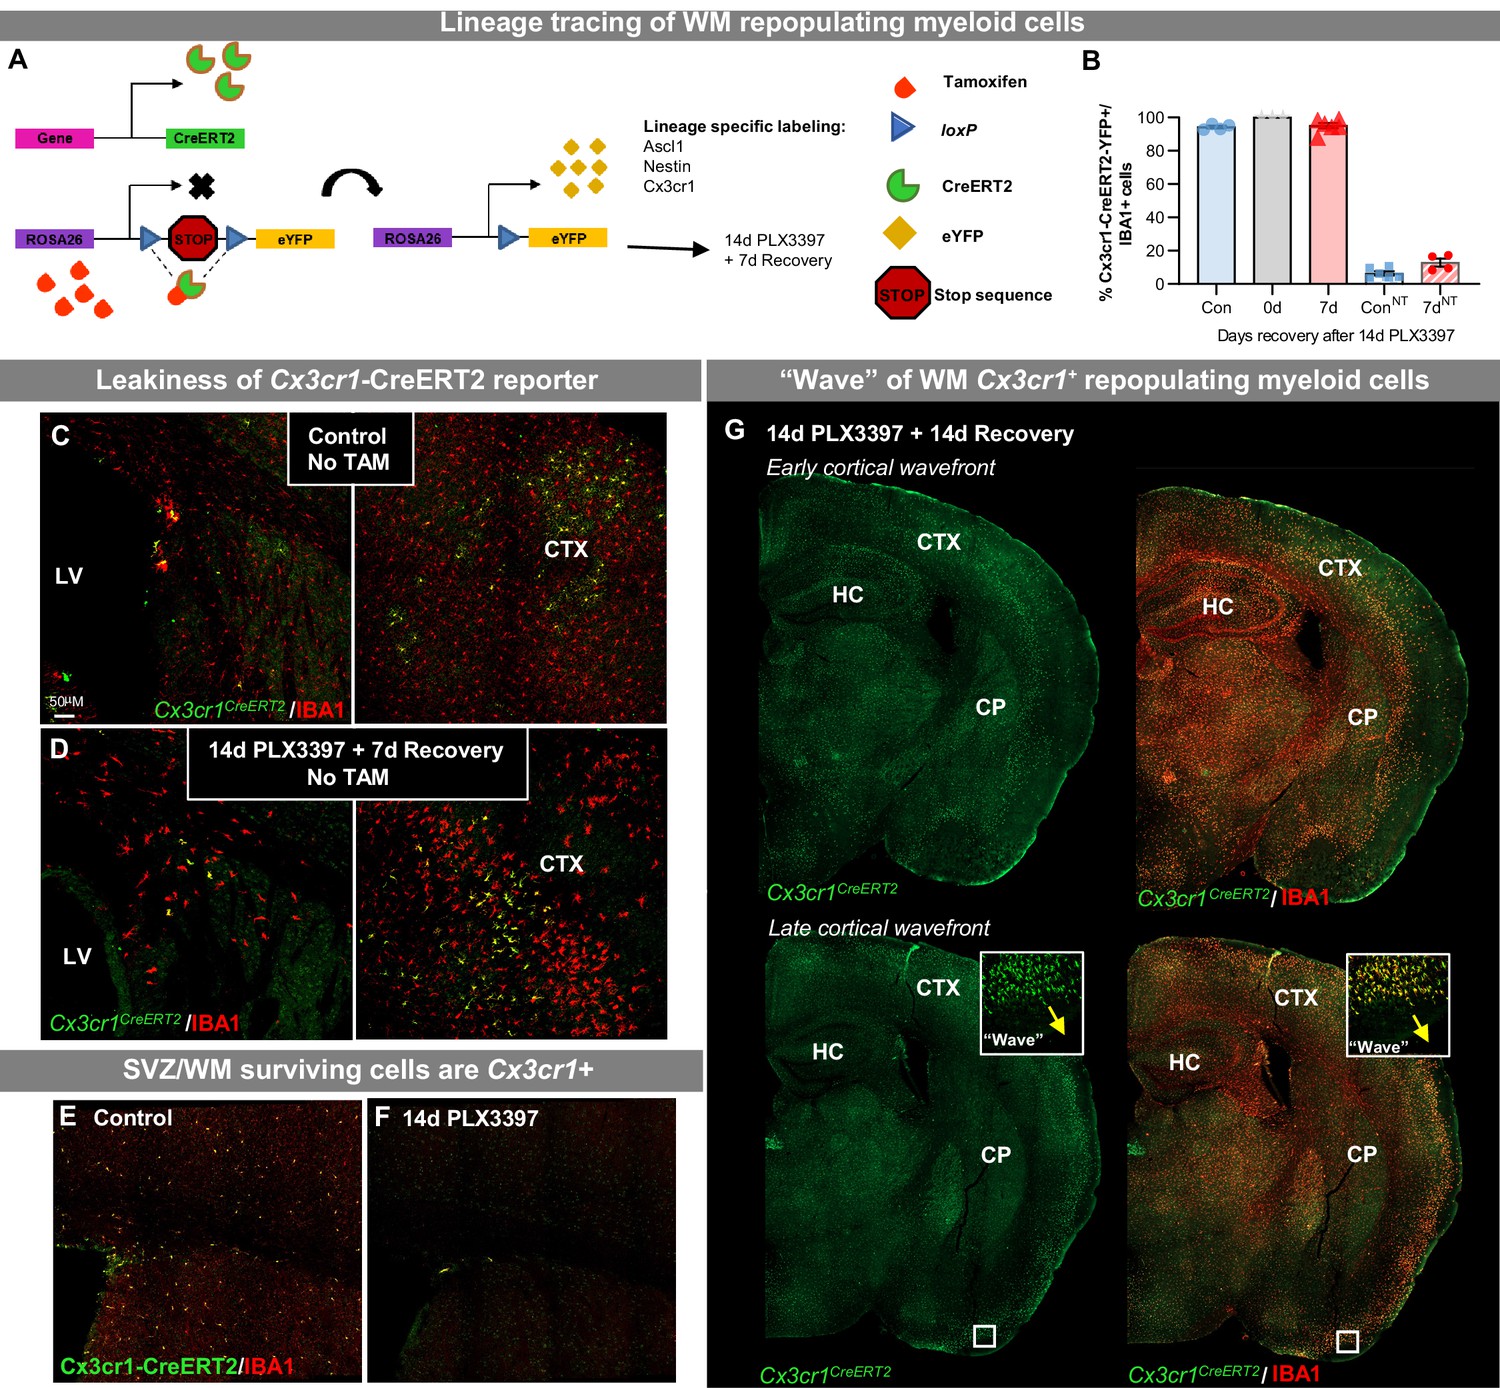
WM repopulating myeloid cells derive from an existing Cx3cr1+ cell source originating from the SVZ/WM area.
(A–G) CreER-directed lineage-specific labeling. (A) In these mouse lines, tamoxifen-inducible Cre-recombinase is expressed under control of the promoter of interest. When activated by tamoxifen, the CreER fusion protein translocates to the nucleus allowing transient recombination to occur and, when crossed to a YFP reporter, visualization of induced expression via eYFP. In this study, mice received 14 days of PLX3397 treatment 21 days following last tamoxifen injection. (B) Quantification of Cx3cr1CreERT2-YFP+IBA1+ cells in control, 14 day PLX3397, and 7 day recovery mice, in the presence and absence of tamoxifen treatment. (C–D) Representative images of Cx3cr1CreERT2-YFP+ (green) and IBA1+ (red) cells in control (C) and 7 day recovery (D) mice treated without tamoxifen. (E) Representative tile scan confocal images of Cx3cr1CreERT2-YFP+ (green) and IBA1+ (red) cells in control and 14 day PLX3397 mice. (I) Representative whole brain images of Cx3cr1CreERT2-YFP+ (green) and IBA1+ (red) cells in 14 day recovery mice, highlighting the ‘wave.’ CTX, cortex; CP, caudoputamen; HC, hippocampus; LV, lateral ventricle; SVZ, subventricular zone.
Figure 6

The role of the SVZ/WM area in myeloid cell proliferation and migration signaling during early WM repopulation.
(A–D) Transcriptional analysis of SVZ tissue during early WM repopulation. (A) Bulk tissue RNA-seq analysis was performed on micro-dissected SVZ tissue from control, 14 day PLX3397, and 5 day recovery brains (n=5). (B) Heatmap of DEGs between 14 day PLX3397 (Elim) and 5 day recovery SVZ tissue. Gene expression data can be explored at http://rnaseq.mind.uci.edu/green/alt_repop_svz/gene_search.php. (C) Gene ontology chord plot of DEGs between control and 5 day SVZ tissue. (D) Plot highlighting expression (% of control) changes in myeloid-associated genes in depleted (14d PLX3397) and repopulated (5d recovery) SVZ tissue. (E–H) Neutralization of CCL12 during WM repopulation. (E) Experiment schematic of CCL12 neutralization study: 2-month-old WT mice were treated for 14 days with PLX3397 (600 ppm) and then placed on control diet for 7 days allowing for WM repopulation. Four i.p. injections were administered of anti-CCL12 antibody or goat IgG (Isotype control) at 1 day recovery, 3 day recovery, 5 day recovery, and 6 day recovery. (F) Representative whole brain images of IBA1+ cell (green) deposition following treatment. (G–H) Quantification of number of total IBA1+ cells and total distance traveled by IBA1+ wavefront in (F). Total distance was calculated by measuring the length from the ventricular edge of SVZ to the leading edge of the IBA1+ cell wavefront.
-
Figure 6—source data 1
The role of the SVZ/WM area in myeloid cell proliferation and migration signaling during early WM repopulation.
- https://cdn.elifesciences.org/articles/66738/elife-66738-fig6-data1-v2.xlsx
Figure 7 with 1 supplement
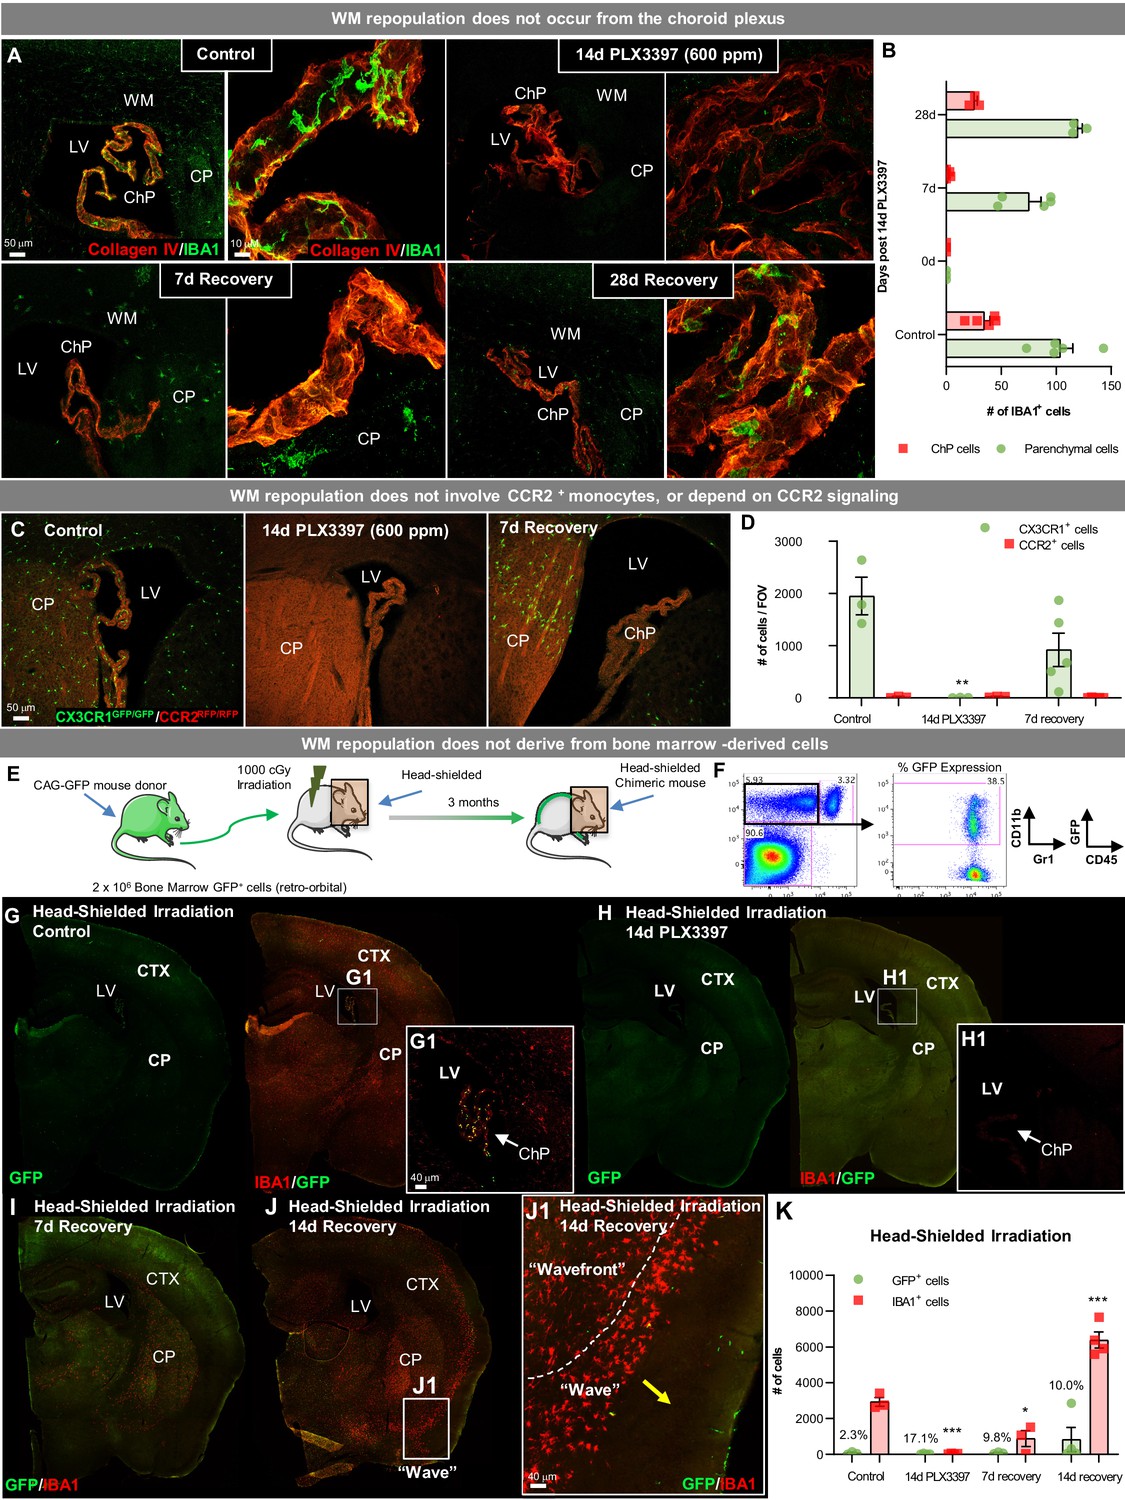
WM repopulating cells do not derive from the periphery.
(A) Representative immunofluorescence 10x (A) and 63x (B) images of IBA1+ cell deposition within the choroid plexus (labeled with Collagen IV) in control, 14 day PLX3397, 7 day recovery, and 28 day recovery mice. (B) Quantification of IBA1+ cell deposition in the choroid plexus and parenchymal space. (C, D) Sustained microglial depletion and WM repopulation in Cx3cr1GFP/GFP/Ccr2RFP/RFP (i.e., Cx3cr1 and Ccr2 KO). Representative immunofluorescence images (C) and quantification of the number (D) of CX3CR1-GFP+ (green) and CCR2-RFP+ (red) cells in control, 14 day PLX3397, and 7 day recovery mice (n=3–5). (E) Experimental paradigm: Schematic depicting generation of BM GFP+ chimeras, achieved by head-shielded (HS) irradiation and transplantation of donor GFP+ BM cells. After 3 months, mice were treated for 14 days with PLX3397 and then allowed to recover for 7 or 14 days on control diet. (F) FACS gating strategy to determine % chimerism in BM GFP+ chimeras achieved by head-shielded irradiation. (G–J) Representative whole brain images of GFP+ (green) and IBA1+ (red) cell deposition in HS irradiated control (G), 14 day PLX3397 (H), and mice following 7 (I) and 14 day recovery (J). (J1) Higher resolution images of repopulating cell wavefront seen in HS chimeras during WM repopulation. (K) Quantification of number of GFP+ and IBA1+ cells treated HS irradiated mice. % above bar graph indicates %GFP+IBA1+/IBA1+ cells. Data are represented as mean ± SEM (n=3–7). *p < 0.05, ** p < 0.01, *** p < 0.001. CTX, cortex; CP, caudate putamen; LV, lateral ventricle; ChP, choroid plexus; WM, white matter.
-
Figure 7—source data 1
WM repopulating cells do not derive from the periphery.
- https://cdn.elifesciences.org/articles/66738/elife-66738-fig7-data1-v2.xlsx
Figure 7—figure supplement 1
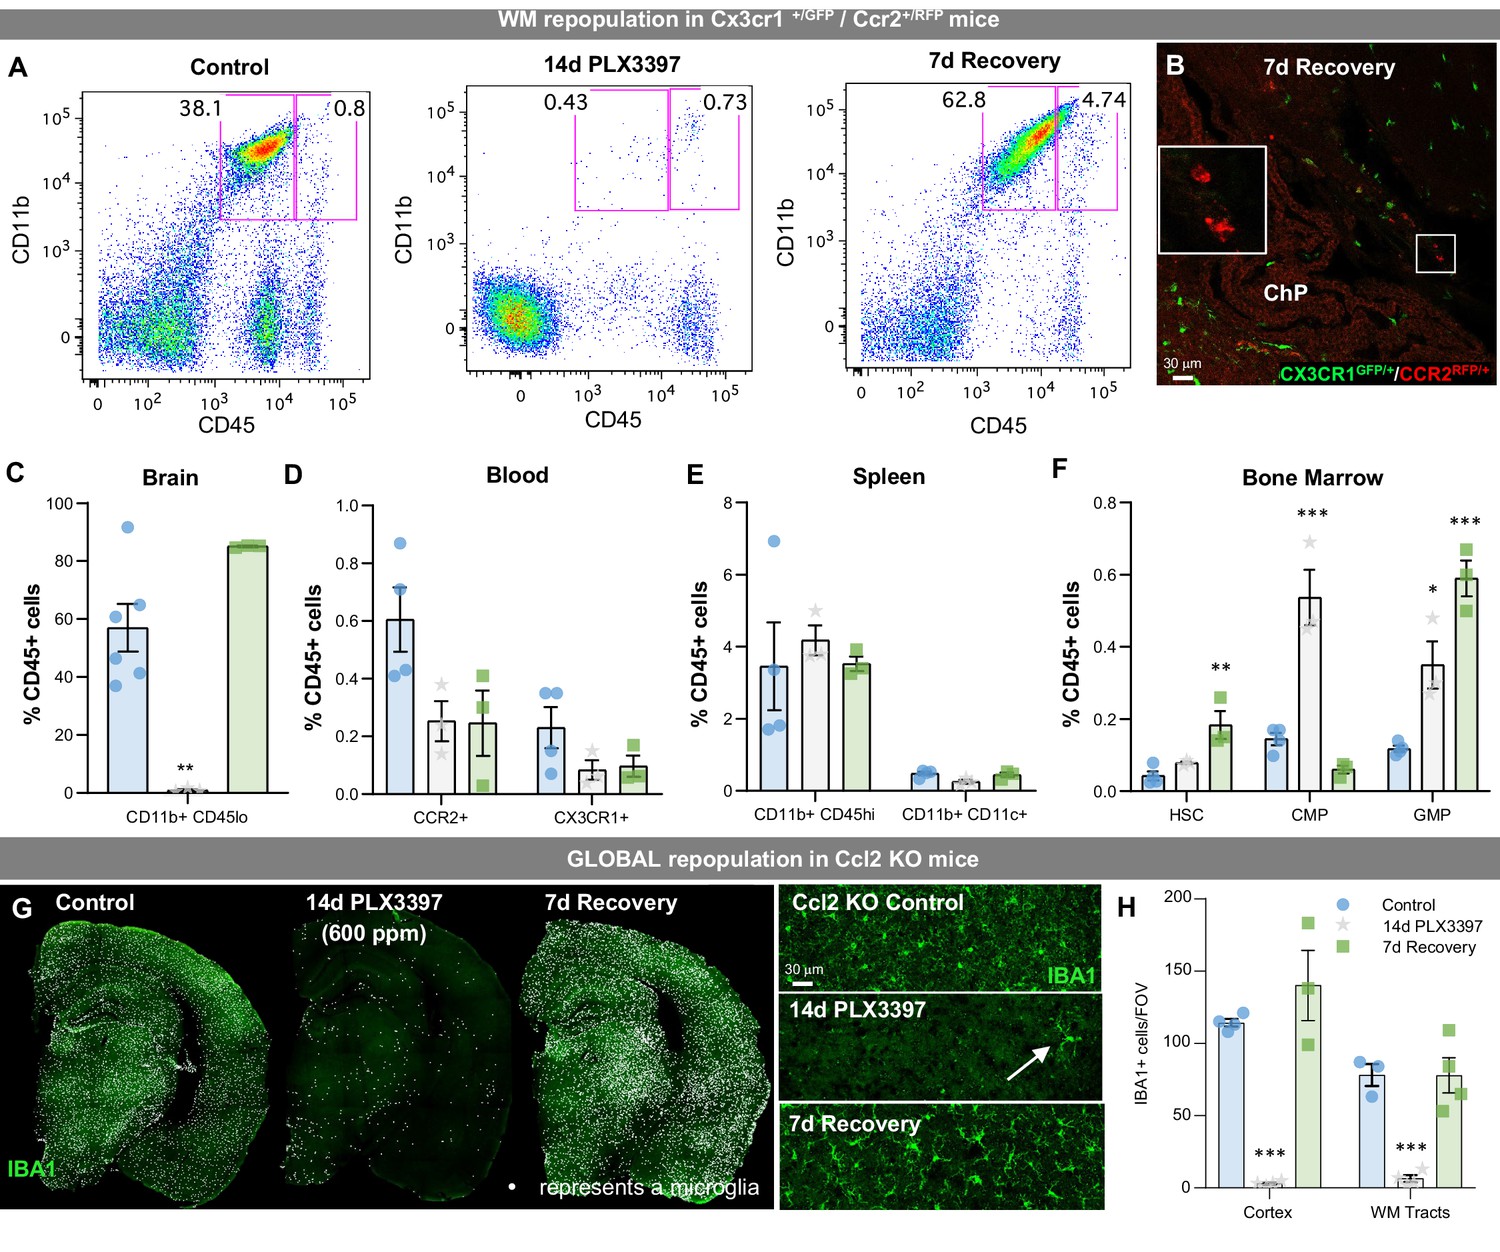
Evaluation of peripheral cell dynamics and CCL2 signaling in WM repopulation.
(A–F) Sustained microglial depletion and WM repopulation in Cx3cr1GFP/+CCR2RFP/+mice. (A) Flow cytometry gating strategy for identifying microglial (CD11b+CD45lo) cells in the brain. (B) Representative immunofluorescence image of CX3CR1+ (green) and CCR2+ (red) cells in 7 day recovery mice. WM repopulation is apparent and no CCR2+ cells are present in the brain parenchyma. CCR2+ cells are only found in the choroid plexus (see insert), indicating that repopulating cells do not derive from CCR2+ (a common marker for peripheral myeloid cells or monocytes) cells. (C–F) Quantification of the impact of treatment on microglia in the brain (C) and distinct myeloid or myeloid precursor cell subsets in the blood (D), spleen (E), and bone marrow (F). (G–H) Ccl2 KO mice were treated with PLX3397 for 14 days (600 ppm in chow), the drug was withdrawn, and then mice were provided with 7 days to recover, allowing for repopulation. (G) Representative whole brain images of IBA1+ (green) cells in these animals, showing incomplete microglial depletion leads to GLOBAL repopulation. Inserts show higher resolution images of IBA1+ (green) cells. (H) Quantification of the average number of IBA1+ cells per FOV in the cortex and white matter tract of control, 14 day PLX3397 (600 pm), and 7 day recovery mice. Data are represented as mean ± SEM (n=3–4). *p < 0.05, **p < 0.01, ***p < 0.001. ChP, choroid plexus; HSC, hematopoietic stem cell; CMP, common myeloid progenitor; GMP, granulocyte-macrophage progenitor.
Figure 8 with 1 supplement
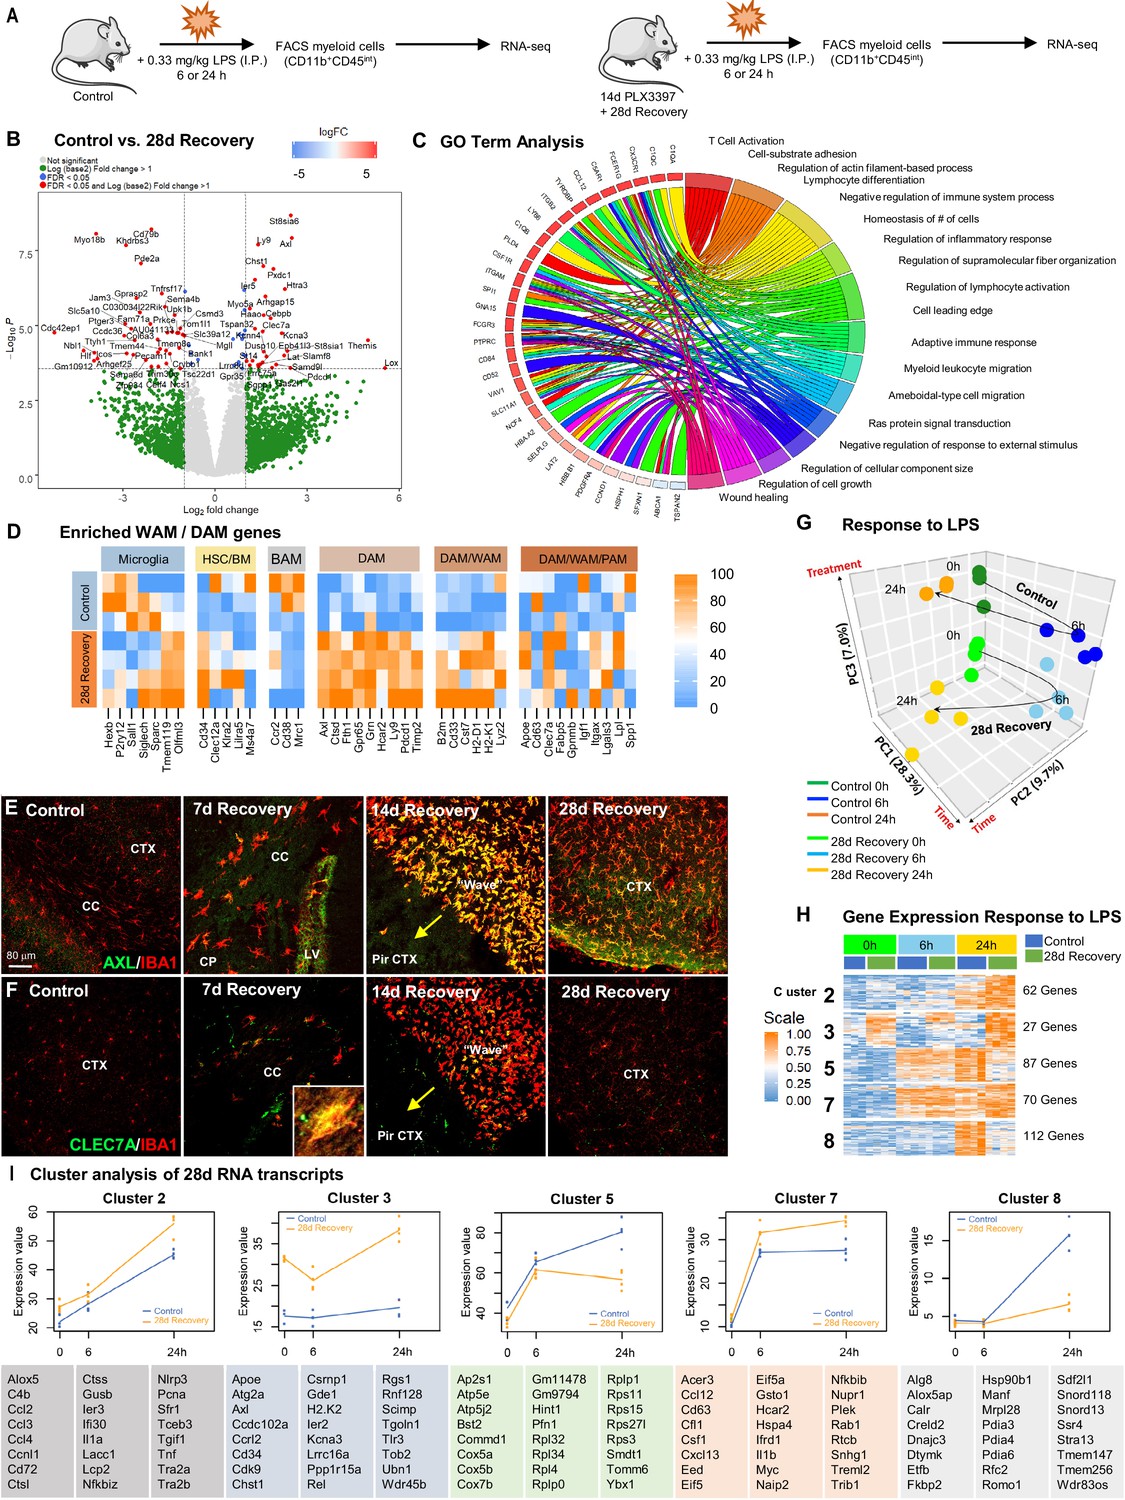
Repopulating myeloid cells are transcriptionally distinct and mount a differential response to inflammatory stimulus compared to homeostatic microglia.
(A) Two-month-old WT control or 28 day recovery mice were given intraperitoneal injections of either PBS or LPS (0.33 mg/kg) and then collected at 6 or 24 hr post injection. Controls, which were mice that did not receive LPS, are referred to as 0 hr post LPS. Myeloid cells were extracted from whole brain hemispheres, isolated using FACS gating for CD11b+CD45int and processed for RNA-seq. (B) Volcano plots displaying the fold change of genes (log2 scale) and their significance (y axis, -log10 scale) between control vs. 28 day recovery mice. (C) Gene ontology chord plot of DEGs between control and 28 day recovery myeloid cells. (D) Heatmap showing expression of genes enriched in DAM, HSC/BM-derived cells, canonical microglia, BAM, PAM, and WAM signatures in control and 28 day repopulating myeloid cells. (E–F) Representative immunofluorescence 20x images of IBA1+ (red) and AXL+ (green, I) or CLEC7A+ (green, J) cells shown in areas with high repopulating cell deposition in control, 7, 14, and 28 day recovery mice. (G) Principal component analysis plot of extracted control and 28 day recovery cells, across time (0 hr, 6 hr, 24 hr) and treatment (+/- LPS), depicting the separation of groups into six clusters. (H) Heatmap of selected time-series cluster analysis of control and 28 day recovery cells. Provided number indicates number of genes per cluster. (I) Time-series cluster analysis of control vs. 28 day recovery myeloid cell response (during WM repopulation) to LPS challenge following 14 day PLX3397 (600 ppm in chow; from H). Clusters showing distinct responses to LPS between control and 28 day WM repopulated cells, across time, were plotted as eigengene values, along with the top represented genes within each cluster. Data are represented as mean ± SEM (n=3–5). *p < 0.05, ** p < 0.01, *** p < 0.001. CP, caudoputamen; CC, corpus callosum; CTX, cortex; LV, lateral ventricle; PirCTX, piriform cortex. Gene expression data can be explored at http://rnaseq.mind.uci.edu/green/alt_repop_lps/gene_search.php.
-
Figure 8—source data 1
Repopulating myeloid cells are transcriptionally distinct and mount a differential response to inflammatory stimulus compared to homeostatic microglia.
- https://cdn.elifesciences.org/articles/66738/elife-66738-fig8-data1-v2.xlsx
Figure 8—figure supplement 1
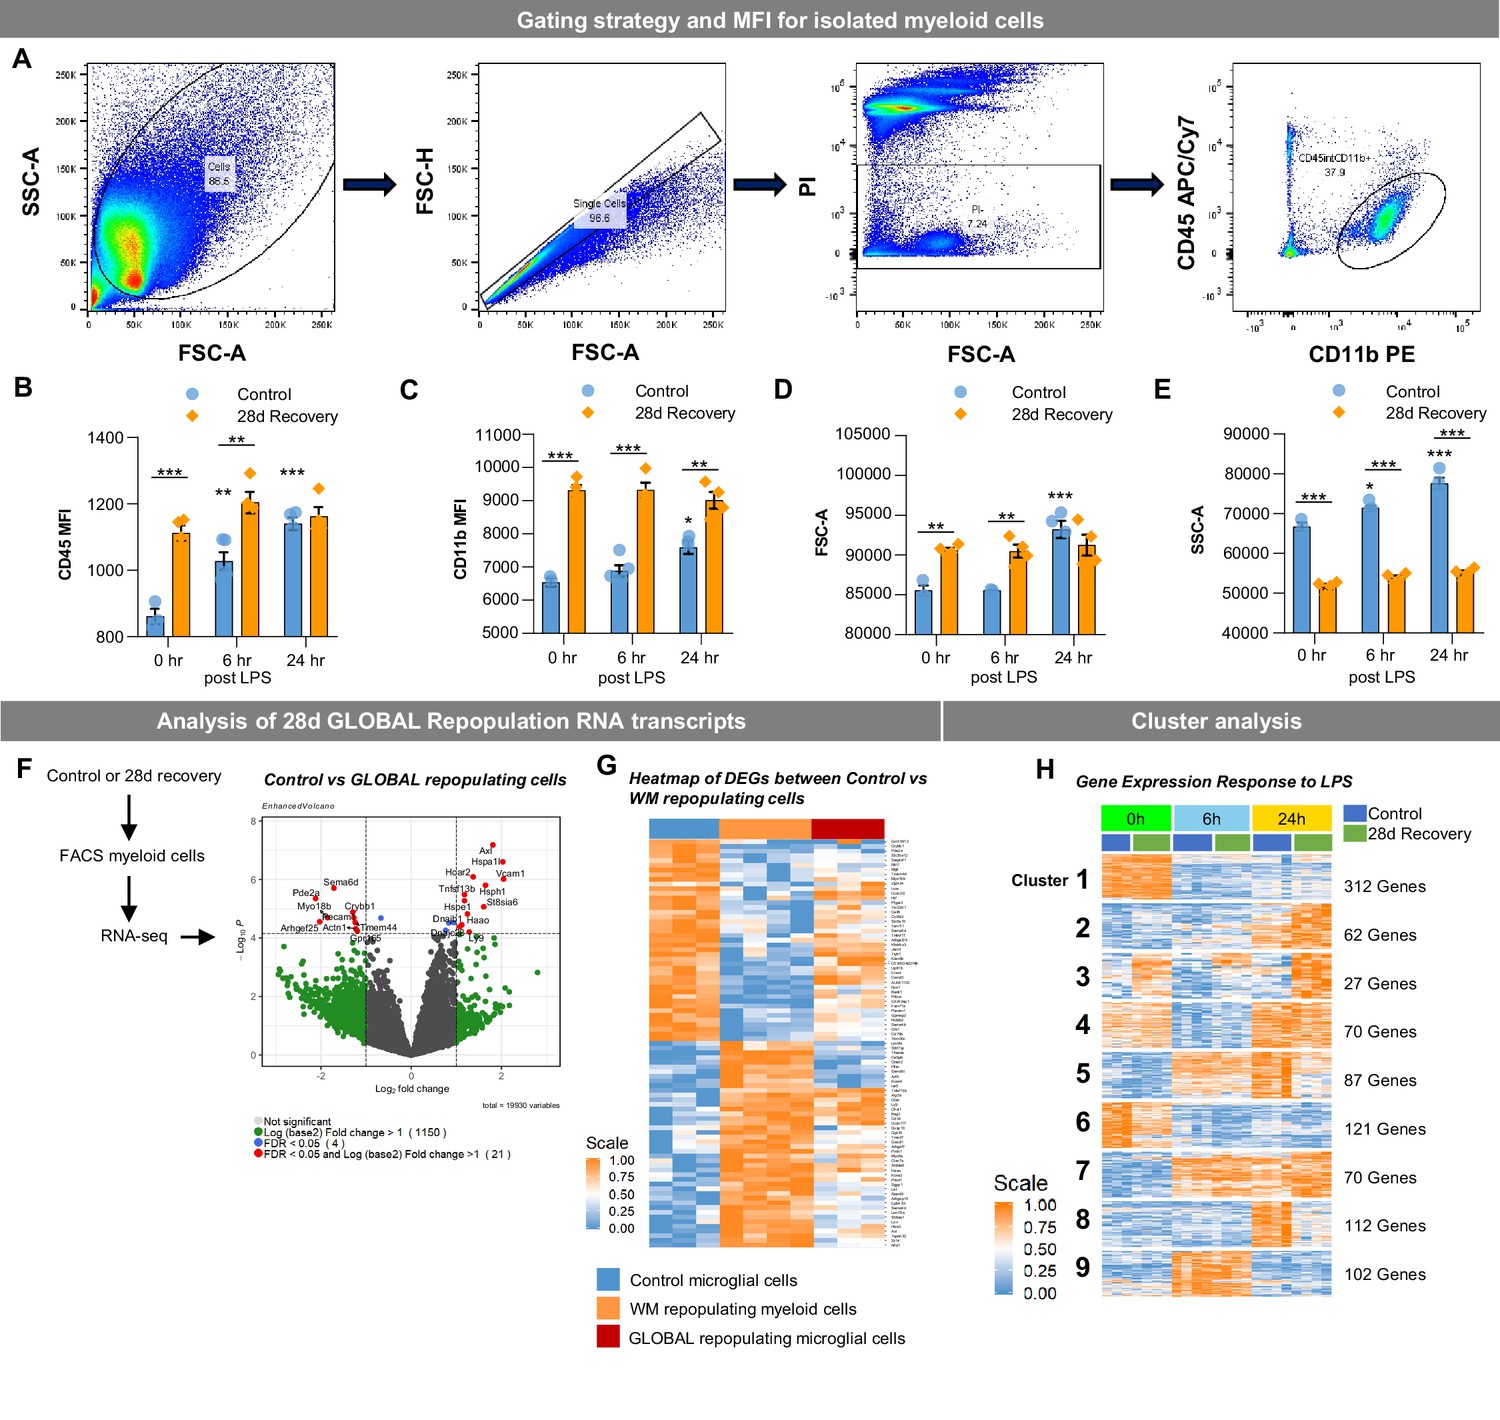
WM repopulating myeloid cells are transcriptionally distinct from homeostatic microglia.
(A) FACS gating strategy for CD11b+CD45int myeloid cells isolated from half brains. (B–C) Quantification of CD45 and CD11b intensities of extracted myeloid cells, respectively. (D–E) Quantification of forward- and side- scatter values of extracted myeloid cells, respectively. (F–G) Two-month-old WT mice treated with vehicle (blue) or PLX3397 (600 ppm in chow) for 7 or 14 days to stimulate GLOBAL (red) and WM (orange) repopulation, respectively. Microglia were isolated via FACS at 28 days recovery, RNA was extracted, and gene expression analysis was performed using RNA-seq. (F) Volcano plots displaying the fold change of genes (log2 scale) and their significance (y axis, -log10 scale) between control vs. GLOBAL repopulation microglia in 28 day recovery mice. (G) Heatmap of identified differentially-expressed genes (DEGs) between control vs. 28 day myeloid cells following 14 days of PLX3397 (600 ppm in chow; from Figure 2F), showing distinct expression patterns in control (blue), WM repopulated cells (orange), and GLOBAL repopulated cells (red). (H) Heatmap of full time-series cluster analysis of control and 28 day recovery cells. Provided number indicates number of genes per cluster. Data are represented as mean with individual data points (n=3).
Figure 9 with 1 supplement

Repopulating myeloid cells elicit few functional differences in behavior, injury, and neuronal-associated structures.
(A–H) Two-month-old WT mice treated with vehicle or PLX3397 (600 ppm in chow) for 14 days, followed by 28 days of recovery, filling the brain with WM repopulated myeloid cells. Mice underwent behavioral assessment by Open Field, Y-Maze, and Elevated Plus Maze, Social Interaction Test, and Novel Object/Place recognition. In Open Field, distance traveled (A) and average speed (B) were reduced in 28 day recovery groups, but time spent in each zone (C) was unchanged. No changes in performance were seen in the Y-maze, as measured by the number of alternations (D). No changes in anxiety behaviors were seen in the elevated plus maze, as measured by time spent in the open or closed arms (E). No changes in social preference were seen in the social interaction test (F). No changes in novel object recognition memory were seen (G), but 28 day recovery mice had a significant impairment in novel place recognition memory (H). Data are represented as mean ± SEM (n=10). *p < 0.05. (I–L) Two-month-old Cx3cr1-GFP+ mice treated with vehicle or PLX3397 (600 ppm in chow) for 14 days, followed by 35 days of recovery, filling the brain with WM repopulated myeloid cells. (I) Analysis of motility and focal laser response in WM repopulating myeloid cells. Representative images of Cx3cr1-GFP+ myeloid cell response to laser ablation, over time, obtained via two-photon imaging in control and 35 day recovery mice. (J) Quantification of the average normalized GFP+ intensity measured within a 50 µm radius of the site of damage over time. (K) Representative image of Cx3cr1-GFP+ myeloid cell at process motility from 0 min (red) to 2 min (green) time-period. (L) Quantification of process motility (i.e. extension of process µm per min) measuring the difference in visibly moving processes over 2 min in control and 28 day recovery myeloid cells. Data are represented as mean ± SEM (n=4). (M–N) Two-month-old WT mice treated with vehicle or PLX3397 (600 ppm in chow) for 14 days, followed by 28 days of recovery, filling the brain with WM repopulated myeloid cells. (M) Representative immunofluorescence 20x images of Parvalbumin+ (PV, green), WFA (a marker for perineuronal nets, red), and IBA1+ (blue) cells shown in the cortex of control, 14 day PLX3397, and 28 day recovery mice. (N) Quantification of % area of WFA per field of view (FOV) in the cortex. Data are represented as mean ± SEM (n=4–6). ** p < 0.01.
-
Figure 9—source data 1
Repopulating myeloid cells elicit few functional differences in behavior, injury, and neuronal-associated structures.
- https://cdn.elifesciences.org/articles/66738/elife-66738-fig9-data1-v2.xlsx
Figure 9—figure supplement 1

Effects of WM repopulation on white matter and cells of oligodendrocyte lineage.
(A–B) Representative 20x immunofluorescence images of Olig2+ (A), a marker for oligodendrocytes, and PDGFRα+ (B), a marker for oligodendrocyte precursor cells (OPC), cells from control and 28d recovery mice in white matter, cortical, and thalamic regions. (C) Representative 20x immunofluorescence images of myelin basic protein (MBP; green), NEUN+ cells (red, to show brain structure), and IBA1+ cells (blue) from control and 28 day recovery mice in the hippocampus and cortex. (D) Quantification of (A). (E) Quantification of (B). (F–G) Quantification of (C). Data are represented as mean ± SEM (n=4–6). CTX, cortex; HC, hippocampus; THAL, thalamus.
Figure 10
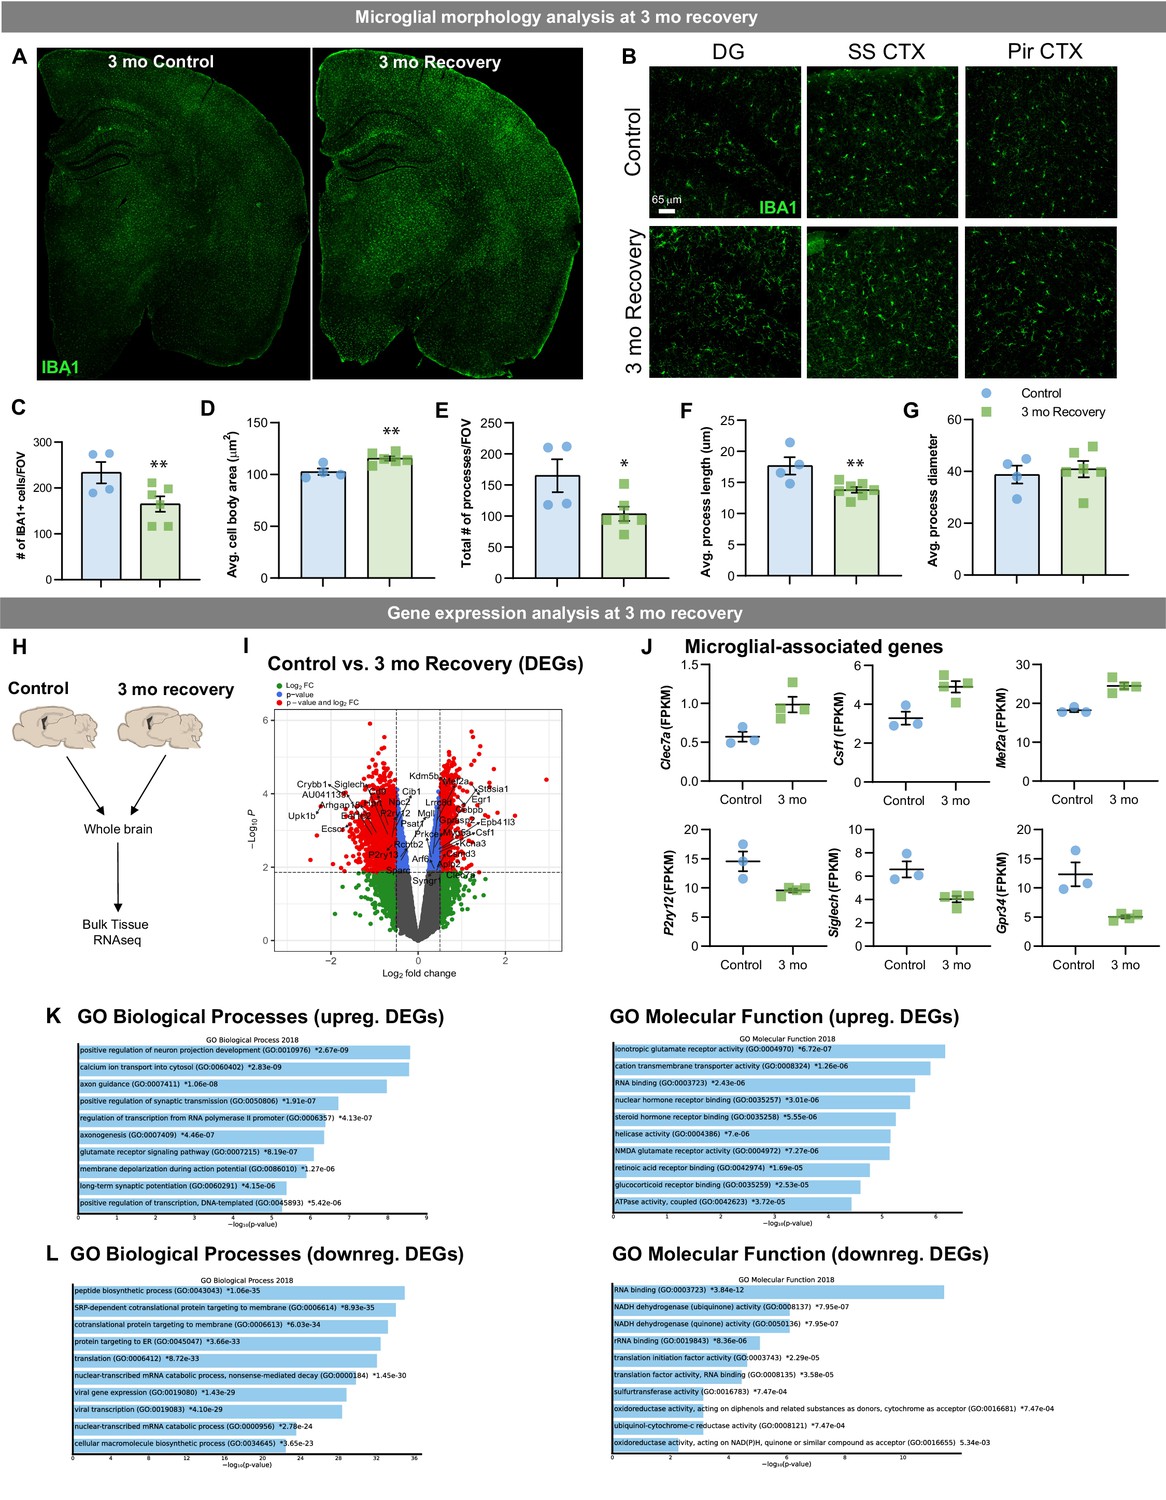
Lasting phenotypic and transcriptional profiles of WM repopulating cells after 3 month recovery.
Two-month-old WT mice treated with vehicle or PLX3397 (600 ppm in chow) for 14 days. Chow was then withdrawn, and animals were allowed to recover on control diet for three months, assessing the long-term effects of filling the brain with WM repopulated myeloid cells. (A-B) Representative whole brain slice and 20x immunofluorescence confocal images of IBA1+ cells in control and 3-month recovery mice. (C-G) Quantification of IBA1+ cells and morphology: IBA1+ cells per field of view (C), cell body area (D), total number of IBA1+ processes (E), average process/filament length (F), and average process/filament diameter (G). (H-L) Transcriptional analysis of 3-month recovery WM repopulation brain tissue. (A) Bulk tissue RNA-seq analysis was performed on whole brain hemispheres from control and 3-month recovery brains. (I) Volcano plot displaying the fold change of DEGs (log2 scale) and their significance (y axis, -log10 scale) between control vs. 3 month recovery. (J) Quantification of relative expression (FPKM, fragments per kilobase of transcript per million) for microglial-associated genes in control and 3 month recovery brain tissue. (K-L) Gene ontology analysis of upregulated (K) and downregulated (L) DEGs between control and 3 month recovery mice. Data are represented as mean ± SEM (n=3-4). * p < 0.05, ** p < 0.01. DG, dentate gyrus; SS CTX, somatosensory cortex; Pir CTX, piriform cortex.
-
Figure 10—source data 1
Lasting phenotypic and transcriptional profiles of WM repopulating cells after 3-month recovery.
- https://cdn.elifesciences.org/articles/66738/elife-66738-fig10-data1-v2.xlsx
Videos
Video 1
Cx3cr1-GFP+ myeloid cell response in control mice after laser ablation.
Representative video of Cx3cr1-GFP+ myeloid cell response to laser ablation (1–5 s long) captured over a 62 min time period in control mice obtained via two-photon imaging. Each frame captures 30 s of elapsed time.
Video 2
Cx3cr1-GFP+ myeloid cell response in 35 day recovery mice after laser ablation.
Representative video of Cx3cr1-GFP+ myeloid cell response to laser ablation (1–5 s long) captured over a 62-min time period in 35 day recovery mice obtained via two-photon imaging. Each frame captures 30 s of elapsed time.
Tables
Key resources table
| Reagent type (species) or resource | Designation | Source or reference | Identifiers | Additional information |
|---|---|---|---|---|
| Strain, strain background (M. musculus) | B6.129P2(C)-Cx3cr1tm2.1(cre/ERT2)Jung | Jackson Laboratory | IMSR Cat# JAX:020940, RRID:IMSR_JAX:020940 | |
| Strain, strain background (M. musculus) | STOCK Ascl1tm1.1(Cre/ERT2)Jejo/J | Jackson Laboratory | IMSR Cat# JAX:012882, RRID:IMSR_JAX:012882 | |
| Strain, strain background (M. musculus) | C57BL/6-Tg (Nes-cre/ERT2)KEisc/J | Jackson Laboratory | IMSR Cat# JAX:016261, RRID:IMSR_JAX:016261 | |
| Strain, strain background (M. musculus) | B6.129X1-Gt(ROSA)26Sortm1(EYFP)Cos/J | Jackson Laboratory | IMSR Cat# JAX:006148, RRID:IMSR_JAX:006148 | |
| Strain, strain background (M. musculus) | B6.129(Cg)-Cx3cr1tm1LittCcr2tm2.1Ifc/JernJ | Jackson Laboratory | IMSR Cat# JAX:032127, RRID:IMSR_JAX:032127 | |
| Strain, strain background (M. musculus) | B6.129S4-Ccl2tm1Rol/J | Jackson Laboratory | IMSR Cat# JAX:004434, RRID:IMSR_JAX:004434 | |
| Strain, strain background (M. musculus) | C57BL/6-Tg(CAG-EGFP)131Osb/LeySopJ | Jackson Laboratory | IMSR Cat# JAX:006567, RRID:IMSR_JAX:006567 | |
| Strain, strain background (M. musculus) | C57BL/6J | Jackson Laboratory | IMSR Cat# JAX:000664, RRID:IMSR_JAX:000664 | |
| Antibody | Anti-Iba1 (Rabbit polyclonal) | FUJIFILM Wako Shibayagi | Cat# 019–19741, RRID:AB_839504 | IF(1:1000) |
| Antibody | Anti-Iba1 (Goat polyclonal) | Abcam | Cat# ab5076, RRID:AB_2224402 | IF(1:1000) |
| Antibody | Anti-Cd11b (Rat monoclonal) | Bio-rad | Cat# MCA711, RRID:AB_321292 | IF(1:50) |
| Antibody | Anti-P2RY12 (Rabbit polyclonal) | Sigma-Aldrich | Cat# HPA014518, RRID:AB_2669027 | IF(1:200) |
| Antibody | Anti-TMEM119 (Rabbit monoclonal) | Abcam | Cat# ab209064, RRID:AB_2800343 | IF(1:200) |
| Antibody | Anti-AXL (Goat polyclonal) | R and D Systems | Cat# AF854, RRID:AB_355663 | IF(1:100) |
| Antibody | Anti-Dectin-1 (CLEC7A) (Rat monoclonal) | InvivoGen | Cat# mabg-mdect, RRID:AB_2753143 | IF(1:30) |
| Antibody | Anti-Ki67 (Rabbit monoclonal) | Abcam | Cat# ab16667, RRID:AB_302459 | IF(1:200) |
| Antibody | Anti-Ccl12 (Goat polyclonal) | R and D Systems | Cat# AF428, RRID:AB_2070875 | 100 ug/0.5 ml sterile HBSS |
| Antibody | Anti-Nestin (Mouse monoclonal) | Abcam | Cat# ab6142, RRID:AB_305313 | IF(1:200) |
| Antibody | Anti-MASH1 (Mouse monoclonal) | BD Biosciences | Cat# 556604, RRID:AB_396479 | IF(1:200) |
| Antibody | Anti-TIE2 (Mouse monoclonal) | Abcam | Cat# ab24859, RRID:AB_2255983 | IF(1:100) |
| Antibody | Anti-GFAP (Chicken polyclonal) | Abcam | Cat# ab4674, RRID:AB_304558 | IF(1:3000) |
| Antibody | Anti-doublecortin (DCX) (Goat polyclonal) | Santa Cruz Biotechnology | Cat# sc-8066, RRID:AB_2088494 | IF(1:200) |
| Antibody | Anti-Olig2 (Rabbit monoclonal) | Abcam | Cat# ab109186, RRID:AB_10861310 | IF(1:200) |
| Antibody | Anti-SOX2 (Goat polyclonal) | R and D Systems | Cat# AF2018, RRID:AB_355110 | IF(1:200) |
| Antibody | Anti-GFP (Rabbit polyclonal) | Abcam | Cat# ab6556, RRID:AB_305564 | IF(1:200) |
| Antibody | Anti-GFP (Chicken polyclonal) | Abcam | Cat# ab13970, RRID:AB_300798 | IF(1:200) |
| Antibody | Anti-PU.1 (Rabbit monoclonal) | Cell Signaling Technology | Cat# 2258, RRID:AB_2186909 | IF(1:200) |
| Antibody | Anti-Collagen IV (Rabbit polyclonal) | Abcam | Cat# ab6586, RRID:AB_305584 | IF(1:200) |
| Antibody | Anti-Parvalbumin (Mouse monoclonal) | Millipore | Cat# MAB1572, RRID:AB_2174013 | IF(1:200) |
| Antibody | Anti-Wisteria floribunda lectin (WFA) (Biotinylated) | Vector Laboratories | Cat# B-1355, RRID:AB_2336874 | IF(1:1000) |
| Antibody | Anti-PDGF Receptor alpha (PDGFRα) (Rabbit polyclonal) | Abcam | Cat# ab124392, RRID:AB_10978090 | IF(1:200) |
| Antibody | Anti-Myelin Basic Protein (MBP) (Rat monoclonal) | Millipore | Cat# MAB386, RRID:AB_94975 | IF(1:200) |
| Antibody | Anti-NeuN (Mouse monoclonal) | Millipore | Cat# MAB377, RRID:AB_2298772 | IF(1:1000) |
| Software, algorithm | Leica Application Suite X (LASX) | Leica | RRID:SCR_013673 | |
| Software, algorithm | Imaris | Bitplane | RRID:SCR_007370 | |
| Software, algorithm | Image J | Image J | RRID:SCR_003070 | |
| Software, algorithm | Fiji | Fiji | RRID:SCR_002285 | |
| Software, algorithm | Weighted Gene Co-expression Network Analysis | Software R package | RRID:SCR_003302 | |
| Software, algorithm | EdgeR | Bioconductor software package | RRID:SCR_012802 | |
| Software, algorithm | DESeq | Bioconductor software package | RRID:SCR_000154 | |
| Software, algorithm | LIMMA | Bioconductor software package | RRID:SCR_010943 | |
| Software, algorithm | Glimma | Bioconductor software package | RRID:SCR_017389 | |
| Software, algorithm | ggplot2 | Software R package | RRID:SCR_014601 | |
| Software, algorithm | EnhancedVolcano | Bioconductor software package | RRID:SCR_018931 | |
| Software, algorithm | clusterProfiler | Bioconductor software package | RRID:SCR_016884 | |
| Software, algorithm | maSigPro | Bioconductor software package | RRID:SCR_001349 | |
| Software, algorithm | Enrichr | Enrichr | RRID:SCR_001575 | |
| Software, algorithm | Ethovision XT | Noldus | RRID:SCR_000441 | |
| Software, algorithm | GraphPad Prism | GraphPad | RRID:SCR_002798 |
Additional files
Download links
A two-part list of links to download the article, or parts of the article, in various formats.
Downloads (link to download the article as PDF)
Open citations (links to open the citations from this article in various online reference manager services)
Cite this article (links to download the citations from this article in formats compatible with various reference manager tools)
Subventricular zone/white matter microglia reconstitute the empty adult microglial niche in a dynamic wave
eLife 10:e66738.
https://doi.org/10.7554/eLife.66738


