Activity in perirhinal and entorhinal cortex predicts perceived visual similarities among category exemplars with highest precision
- Brain and Mind Institute, University of Western Ontario, Canada
- Robarts Research Institute Schulich School of Medicine and Dentistry, University of Western Ontario, Canada
- Cervo Brain Research Center, University of Laval, Canada
- Department of Psychology, Florida State University, United States
- Department of Physiology and Pharmacology, University of Western Ontario, Canada
- School of Biomedical Engineering, University of Western Ontario, Canada
- Department of Medical Biophysics, University of Western Ontario, Canada
- Department of Psychology, University of Western Ontario, Canada
Figures
Figure 1 with 2 supplements
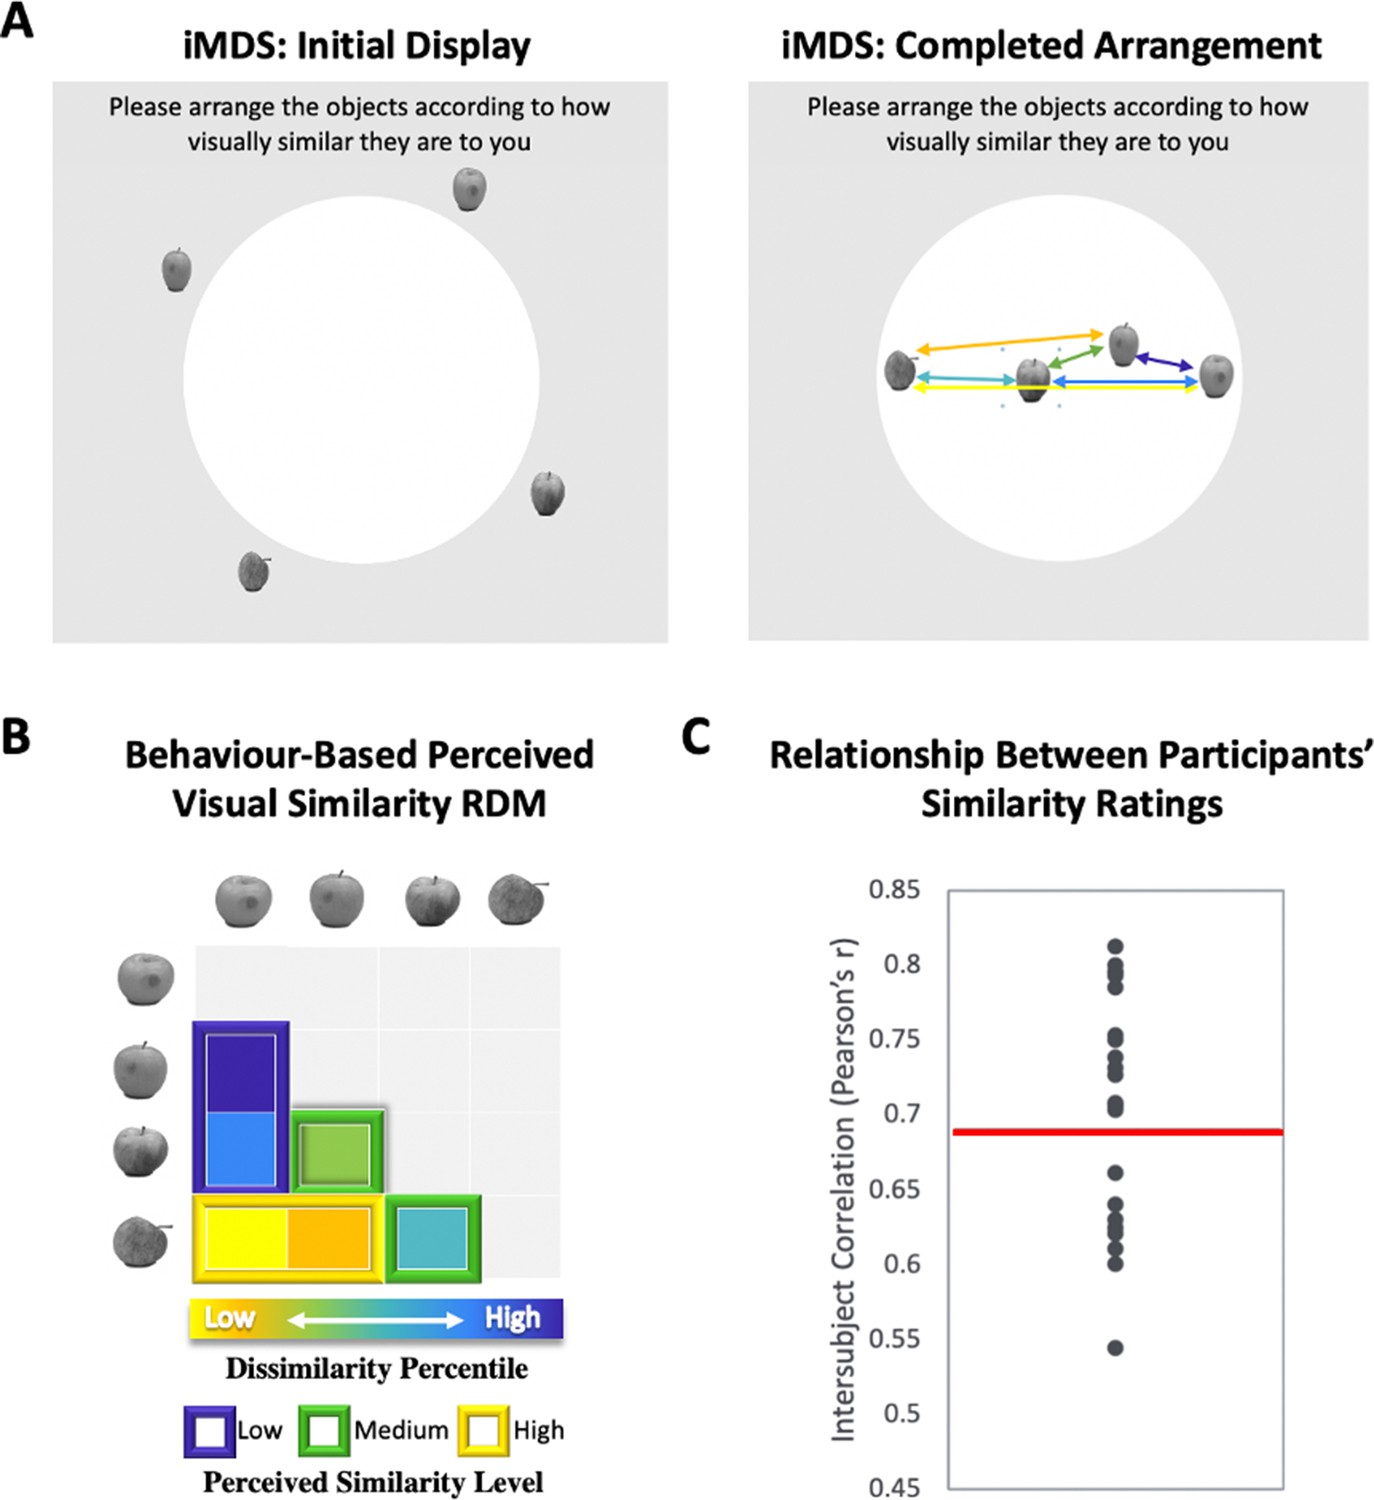
Perceived visual similarity ratings obtained offline with inverse multidimensional scaling (iMDS).
(A) Task required placement of all exemplars from each category in circular arena, with distances reflecting perceived visual similarity. Arrows indicate the six pairwise distances used to compute representational dissimilarity matrix (RDM). (B) Behaviour-based RDM computed using dissimilarity (1 − Pearson’s r) and conversion to percentiles for individual observers. Only values below diagonal were included. Six distances (between four exemplars) per category were rank ordered and grouped into three levels of similarity (low, middle, and high; for more detail, Figure 1—figure supplement 1). (C) Intersubject correlations for perceived similarity ratings across all exemplars and categories. Correlations were computed between each participant’s RDM with the mean RDM (excluding the participant). Red horizontal line marks mean intersubject correlation, with variability in perceived visual similarity structure across observers reflected in the range displayed.
Figure 1—figure supplement 1
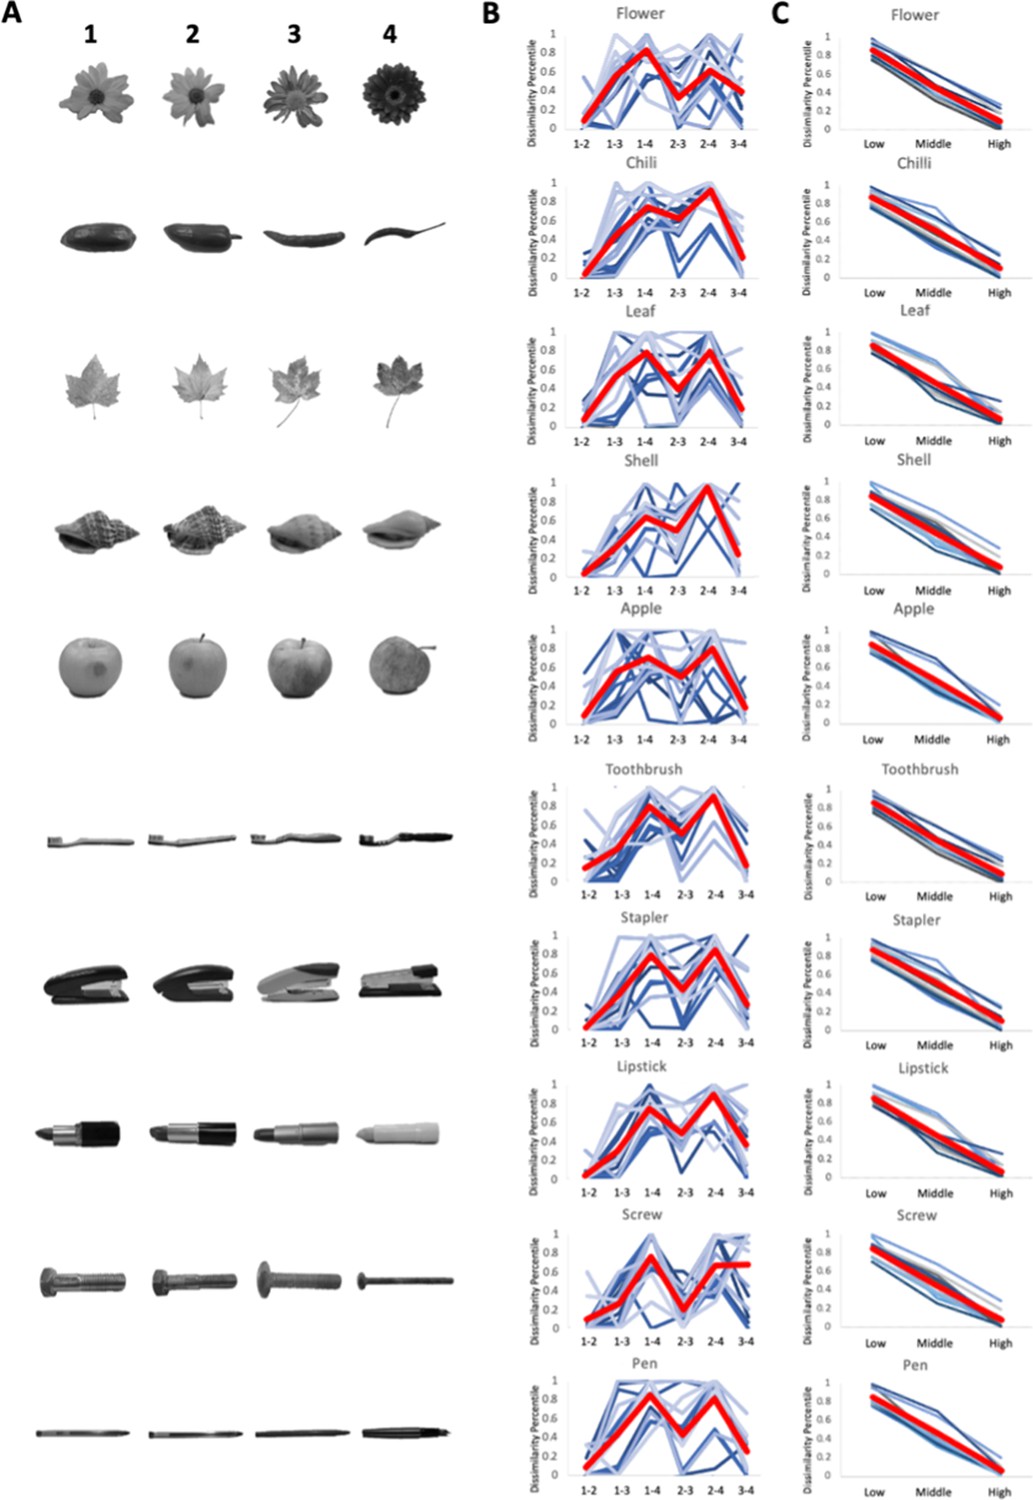
Stimuli employed and behavioural data obtained for specific object categories.
(A) Forty images of object stimuli sampled from Migo et al., 2013 and employed in current study. Images of objects are from 10 categories with 4 exemplars in each category. Feature dimensions on which exemplars differ include external shape envelope, texture, and internal spatial configuration of parts. (B) Behavioural results from inverse multidimensional scaling (iMDS) task obtained offline from all 24 participants in the fMRI study (mean in thick red line). Perceived similarity ratings (expressed as dissimilarity percentile) were obtained separately for each category. They are displayed for all pairwise comparisons (with numbers indicating specific exemplars as shown in A) in arbitrary order along x-axis. Ratings reveal some variability across participants in all categories, which is also reflected in intersubject correlations shown in Figure 2c in Main text. (C) Ratings from (B) reordered according to participant’s own rank ordering of perceived similarity. We grouped the two lowest, two middle, and two highest similarities in observer-specific manner. Shown dissimilarity percentiles reflect average values for two pairs of ratings in each grouped ranking. Notably, the range of dissimilarity percentile values was comparable across the three levels (p > 0.5). Displayed rank-ordered data were employed to assess sensitivity of behaviour and fMRI responses to participants’ own perceived similarity structure among category exemplars.
Figure 1—figure supplement 2

In a follow-up study, a separate group of 30 participants completed 2 sessions of the inverse multidimensional scaling (iMDS) task for the 10 object categories separated by 7 ± 1 days.
(A) Intrasubject correlations for perceived similarity ratings across all exemplars and categories. Correlations were computed between each participants’ perceived similarity representational dissimilarity matrices (RDMs) from Session 1 and from Session 2. The mean within-subject correlation across the two sessions was 0.84, indicating high stability of participant’s perceived similarity ratings over 1 week. (B) Intersubject correlations for perceived similarity ratings across all exemplars and categories. Correlations were computed between each participant’s RDM Session 1 with the mean RDM (excluding the participant) in Session 2. Mean intersubject correlation was 0.68. Critically, a paired t-test (intrasubject > intersubject correlation) confirmed that intrasubject correlations were significantly higher than intersubject correlations (p < 0.0001). This pattern of results indicates that the perceived similarity structure that is unique to the individual observer is a stable characteristic.
Figure 2
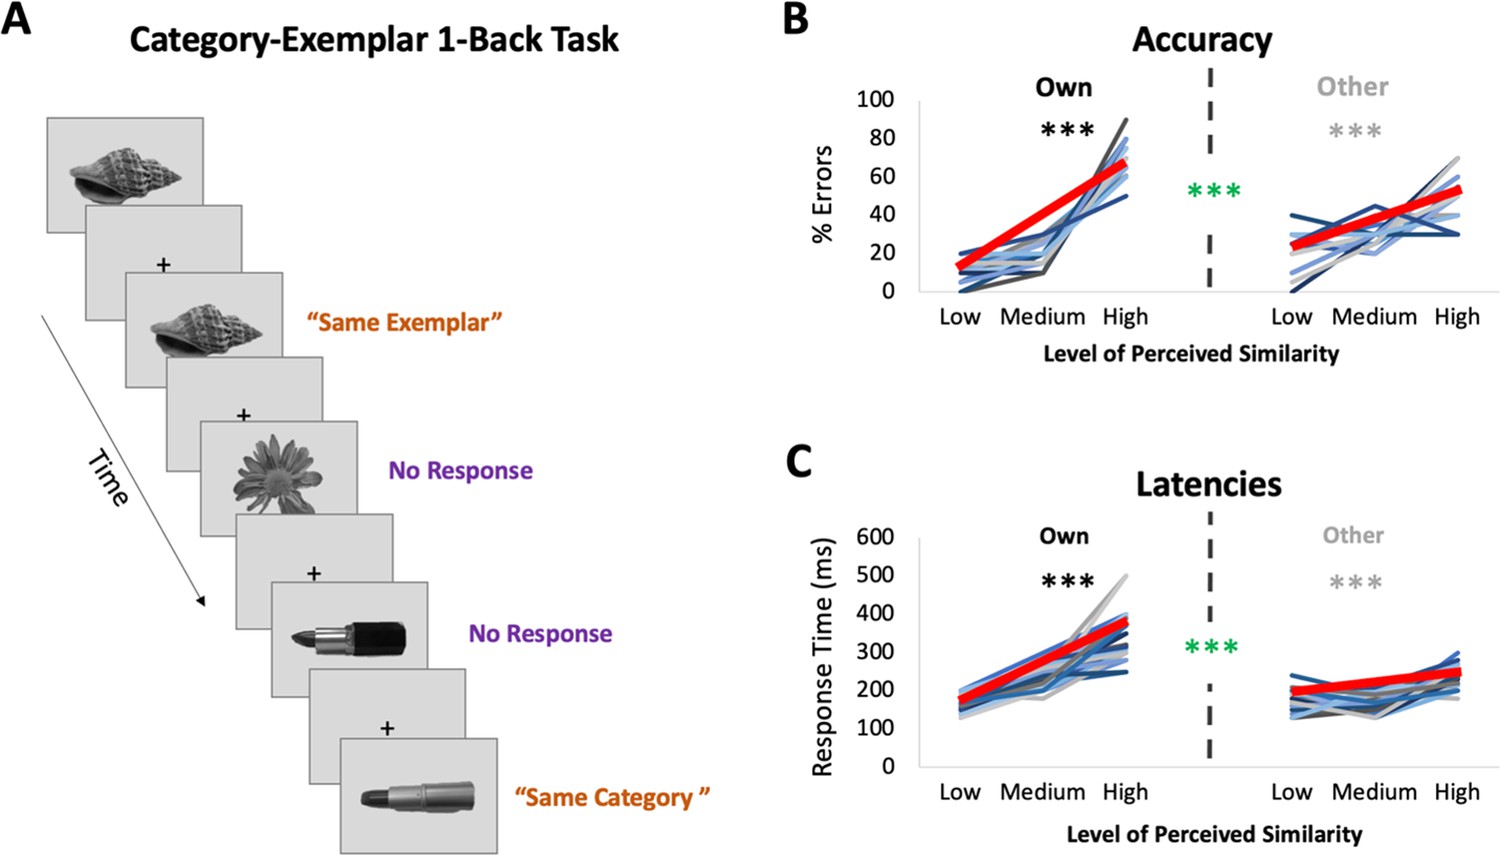
fMRI task: Category-Exemplar 1-Back Task.
(A) Images of objects depicting one of the 4 exemplars from 10 different categories were presented. Participants indicated repetitions on catch trials with two different button presses depending on whether the image was an exact repeat of the one previously presented (same exemplar, same category) or a repeat at the category level (different exemplar, same category). The majority of trials (75%) reflected no repetitions on either level and required no response. Only trials that required no response (noncatch trials) were included in the fMRI analyses. (B) Percentage of errors that reflect incorrect same-exemplar responses on same-category trials as a function of perceived similarity (mean slope indicated with thick red line; for accuracy on all other trial types see Supplementary file 1). Own values reflect behavioural performance as a function of participants’ own visual similarity ratings; Other values reflect performance based on other participants’ ratings (for a total of 22 iterations, which were then averaged). Error rate increased with increasing similarity as reflected in slopes (in black/grey ***p < 0.0001). Error rate was more sensitive to participants’ own ratings as reflected in significantly higher slopes for the Own versus Other ratings (in green ***p < 0.0001). (C) Response times on correct same-category trials as a function of perceived similarity (mean slope indicated with thick red line). Own and Other values calculated as in (B). Response times increased with increasing similarity and were more sensitive to participants’ own than other participants’ ratings. Results in (B, C) show that behavioural performance on 1-back task is most sensitive to perceived similarity as reflected in participants’ own ratings.
Figure 3 with 1 supplement

Brain-based representational dissimilarity matrices (RDMs) and their relationship to perceived visual similarity.
(A) In each region of interest (ROI), mean multivoxel activation patterns were calculated for every exemplar using the no-response trials in the Category-Exemplar 1-Back Task. Pairwise pattern dissimilarities were computed as 1 − Pearson’s r. (B) Pairwise pattern dissimilarity percentiles were used to create participant-specific brain-based RDMs. (C) Brain-based RDMs were correlated with participants’ own behaviour-based similarity RDMs derived from their offline reports (black double arrows = within subject r). (D) Activation patterns in EVC, LOC, PrC, and alErC show significant correlations with participants’ own perceived similarity ratings of objects (brain-based RDM × behaviour-based perceived similarity RDM within subjects; *p < 0.05, **p < 0.01 Bonferroni-corrected based on regions; error bars represent SEM). EVC = early visual cortex; LOC = lateral occipital complex; PrC = perirhinal cortex; alErC = anterolateral entorhinal cortex; pmErC = posteromedial entorhinal cortex; PhC = parahippocampal cortex; TP = temporal pole; see Figure 5A for visualization.
Figure 3—figure supplement 1
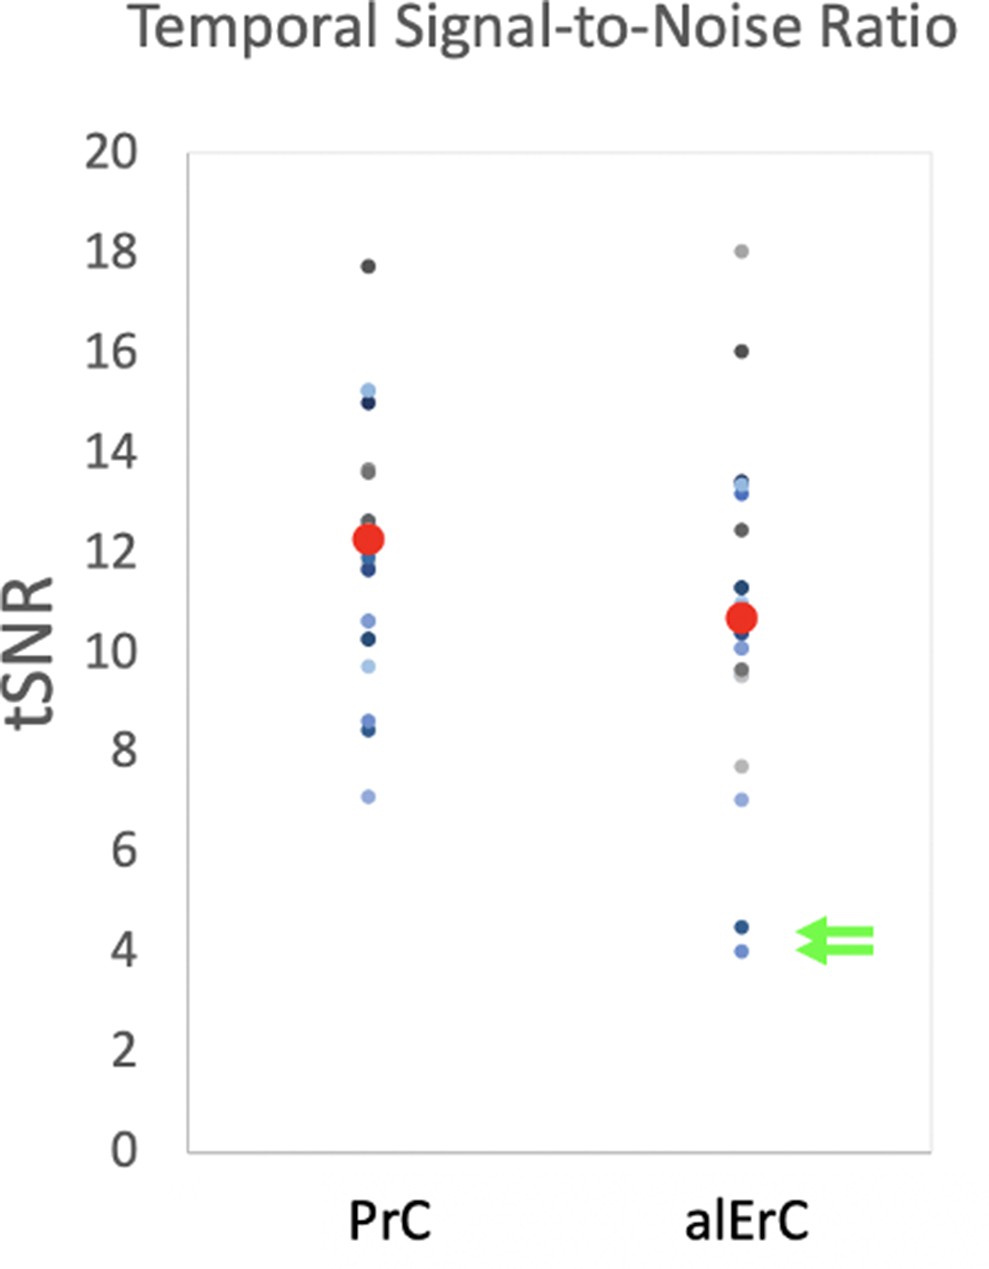
Temporal signal-to-noise ratio in perirhinal cortex (PrC; M = 12.25, SD = 2.68) and anterolateral entorhinal cortex (alErC; M = 10.80, SD = 3.05) in each of the 25 participants (average denoted by bolded red dot).
Green arrows indicate two participants with tSNR in alErC below 2 SD of the mean. These participants were excluded from fMRI analyses.
Figure 4 with 1 supplement
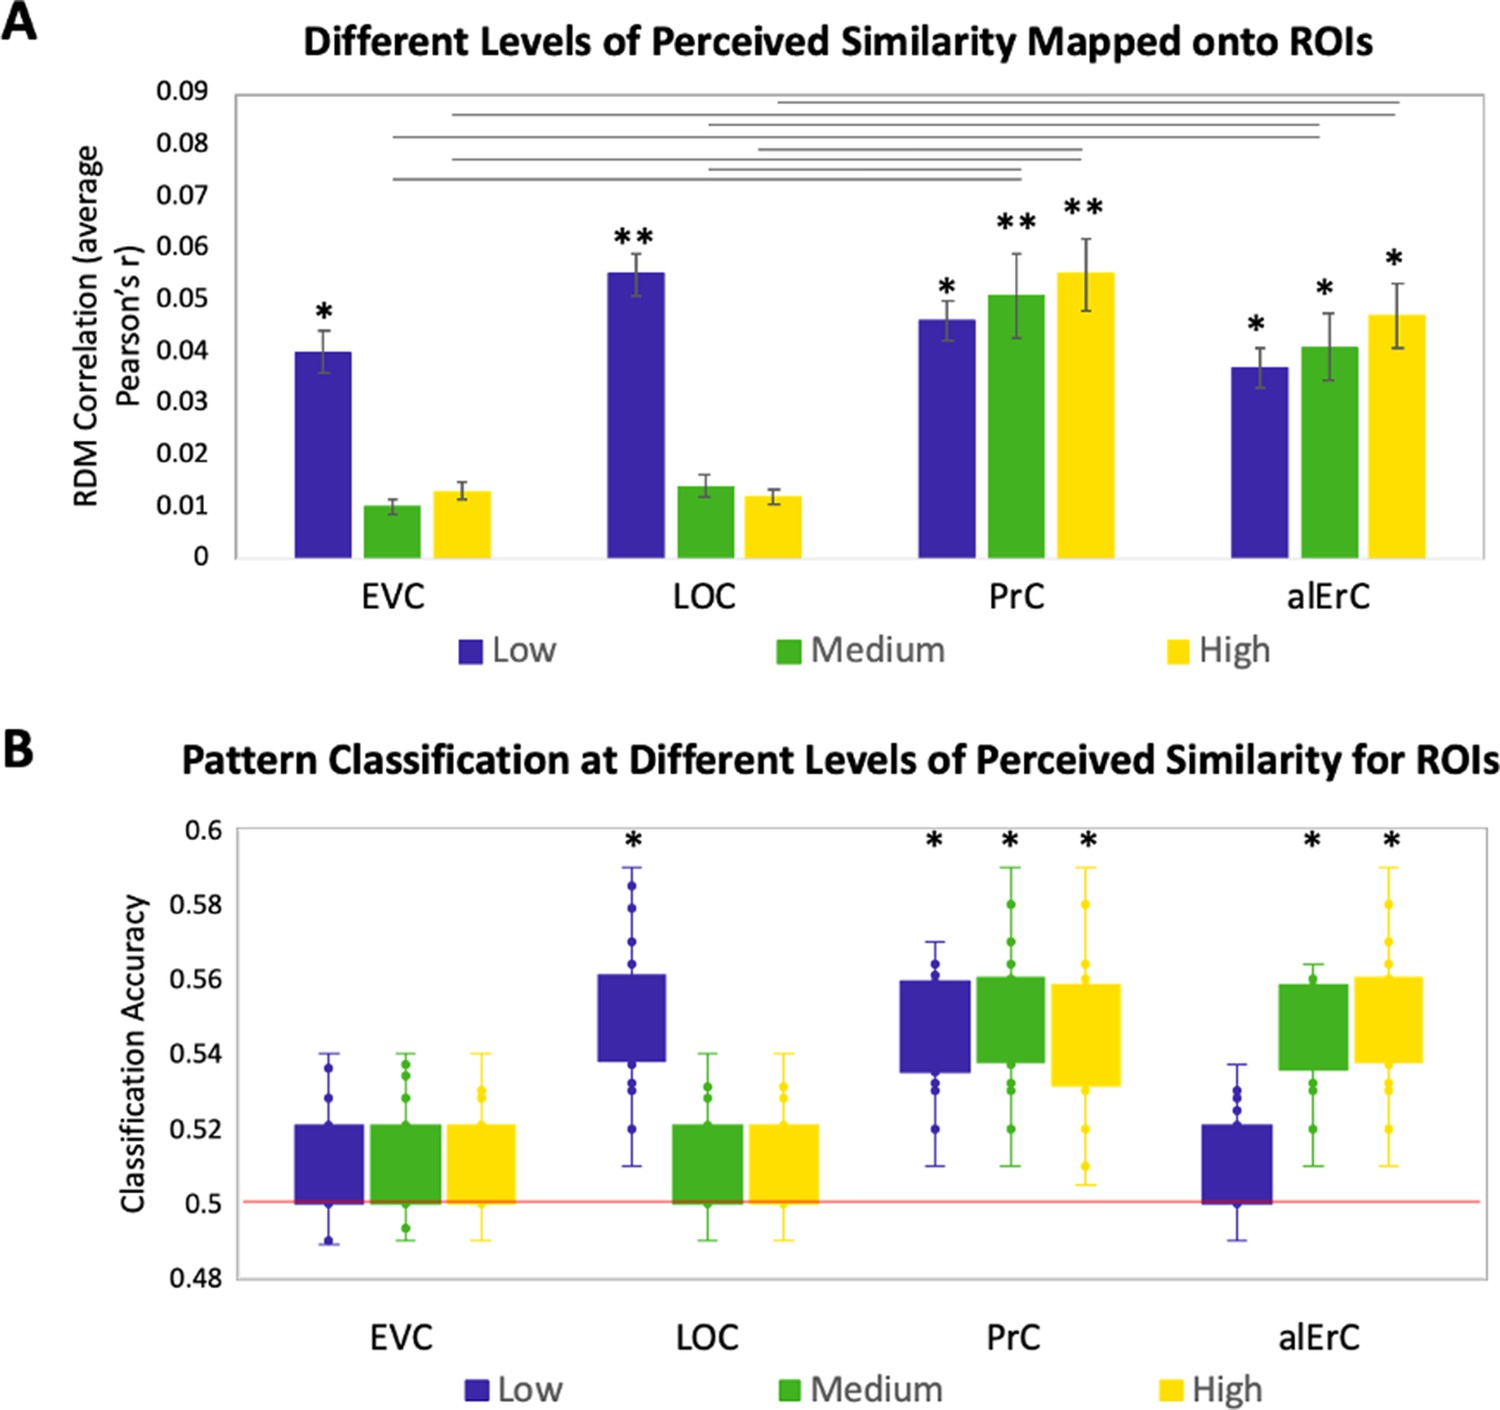
Relationship between brain representational dissimilarity matrices (RDMs) and reports at different levels of perceived visual similarity for region of interests (ROIs) showing significant effects in Figure 3D.
(A) Correlation of brain-based RDM and participants’ own behaviour-based RDM at low, medium, and high levels of similarity. Only activation patterns perirhinal cortex (PrC) and anterolateral entorhinal cortex (alErC) show significant correlation with ratings at middle and high levels of perceived similarity (**p < 0.01, *p < 0.05, Bonferroni-corrected for regions and levels). Correlations in PrC and alErC were significantly larger than those in early visual cortex (EVC) and lateral occipital cortex (LOC) at the medium and high levels of perceived similarity (horizontal lines indicate p < 0.05). (B) Box and whisker plots for classification accuracy of neural activation patterns at each level of perceived similarity in different ROIs. We adopted a common classification approach using linear support vector classifier and leave-one-run-out cross-validation (Misaki et al., 2010). Results from one tailed t-tests to probe whether classifier performance was above chance indicate that patterns in LOC are distinguishable only at lowest level of perceived similarity within categories. PrC and alErC are only regions in which patterns are distinguishable at medium and high levels of perceived similarity (*p < 0.05, Bonferroni-corrected).
Figure 4—figure supplement 1
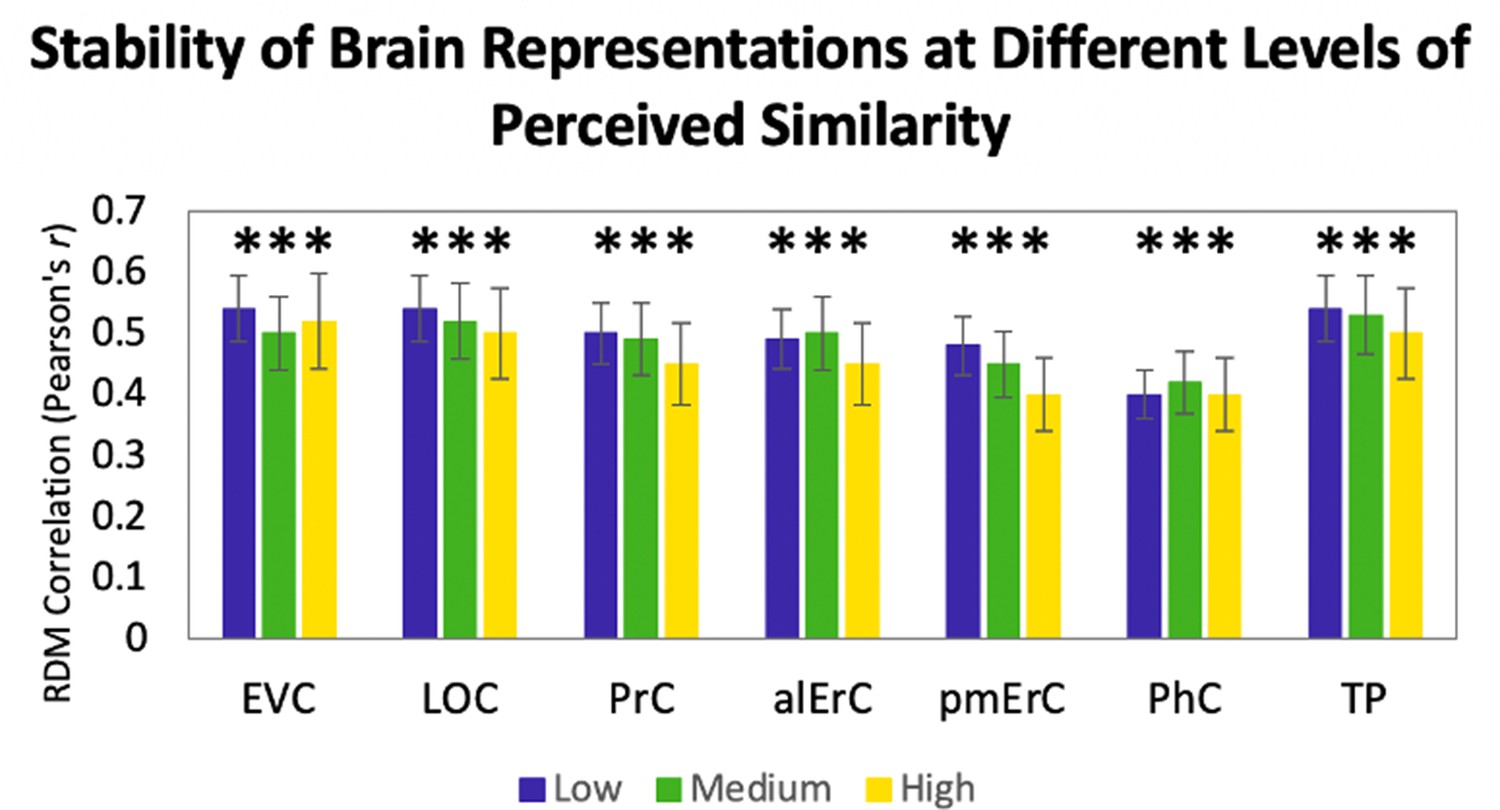
Relationship between brain-based representational dissimilarity matrices (RDMs) in even and odd runs, within and between participants at different levels of perceived similarity.
Correlation of brain-based RDMs for even and odd runs at low, medium, and high levels of similarity. Activation patterns in all region of interests (ROIs) show significant correlations at all levels of perceived similarity (***p < 0.001, Bonferroni-corrected for regions and levels).
Figure 5
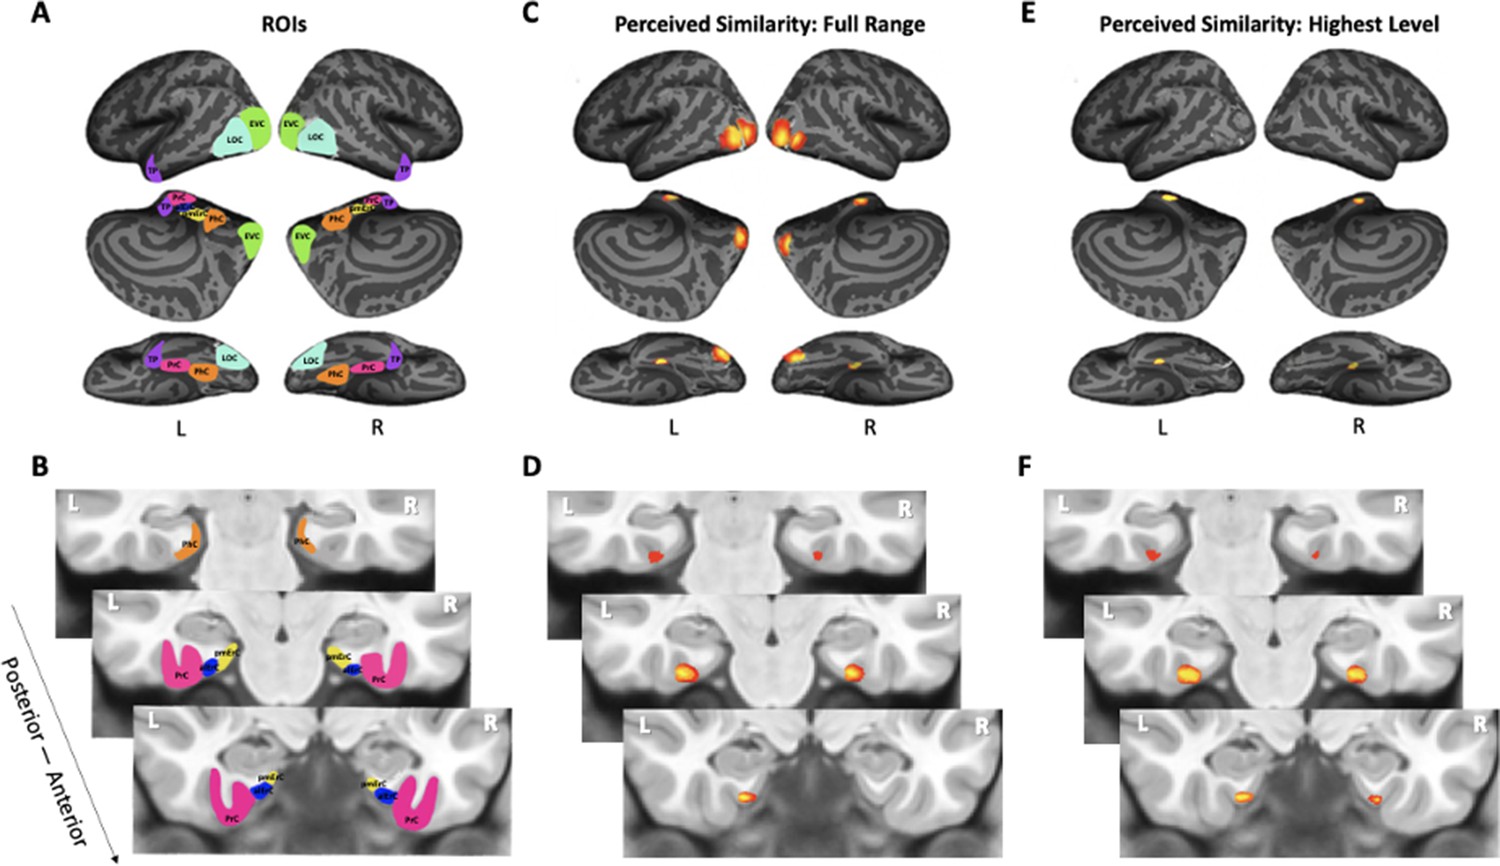
Visualization of region of interests (ROIs) and results from whole-volume searchlight analyses.
(A, B) Visual depiction of ROIs. Early visual cortex (EVC = green), lateral occipital complex (LOC = cyan), perirhinal cortex (PrC = pink), parahippocampal cortex (PhC = orange), anterolateral entorhinal cortex (alErC = blue), posteromedial entorhinal cortex (pmErC = yellow), temporal pole (TP = purple). (C, D) Cortical regions revealed with searchlight analysis in which brain-based representational dissimilarity matrices (RDMs) were significantly correlated with behaviour-based perceived similarity RDMs across full range. Significant correlations were observed in PrC, alErC, and more posterior ventral visual stream (VVS) regions. (E, F) Cortical regions revealed with searchlight analysis in which brain-based RDMs were significantly correlated with behavioural RDMs at highest level of perceived similarity. Significant correlations were observed only in PrC and alErC. Maps are displayed with corrected statistical threshold of p < 0.05 at cluster level (using threshold-free cluster enhancement).
Figure 6
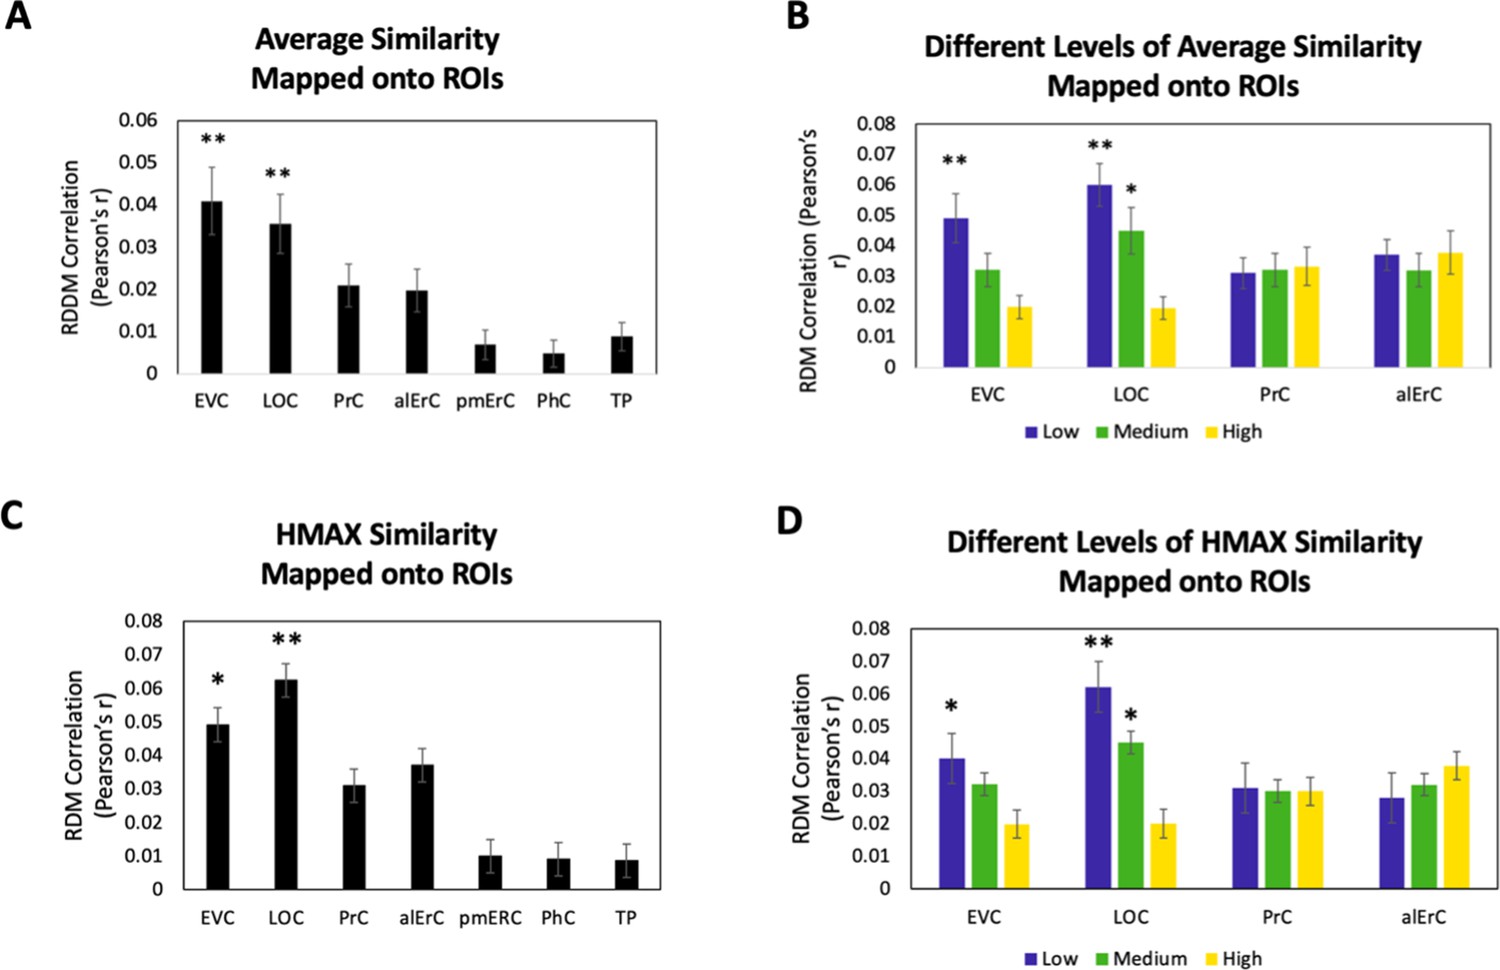
Brain-based representational dissimilarity matrices (RDMs) and their relationship to average perceived visual similarity.
Brain-based RDMs were correlated with (A) the average behaviour-based similarity RDMs and (B) the different levels of average similarity RDMs; and with (C) the entire RDM derived from the HMAX model (D) the RDMs at different levels of similarity derived from the HMAX model. Patterns in EVC and LOC show relationship to average whole perceived similarity ratings **p < 0.01, Bonferroni-corrected based on regions. EVC and LOC also show correlations to the average low, and LOC to the medium level of perceived similarity *p < 0.05, Bonferroni-corrected. EVC = early visual cortex; LOC = lateral occipital complex; PrC = perirhinal cortex; alErC = anterolateral entorhinal cortex; pmErC = posteromedial entorhinal cortex; PhC = parahippocampal cortex; TP = temporal pole.
Figure 7 with 2 supplements
Brain-based representational dissimilarity matrices (RDMs) and their relationship to observer-specific perceived visual similarity.
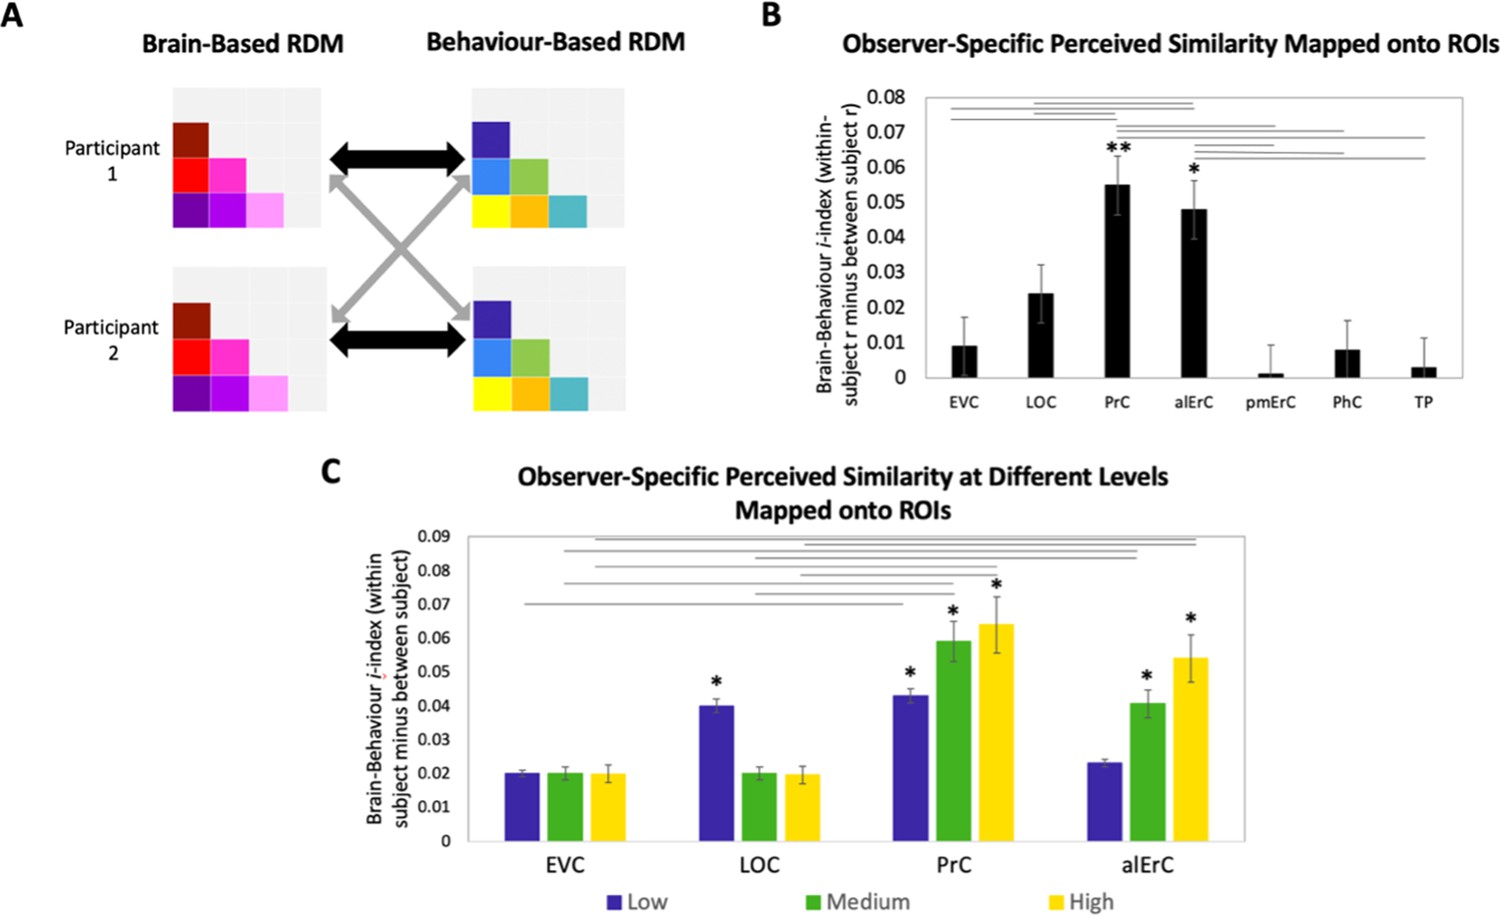
(A) Brain-based RDMs were correlated with (1) participants’ own behaviour-based similarity RDMs (black double arrows = within subject r) and (2) other participants’ behaviour-based similarity RDMs (grey arrows = between subject r) for comparison. (B) Patterns in PrC and alErC show relationship to perceived similarity ratings that are observer specific as reflected in brain–behaviour i-index (i.e., within minus between subject correlation; *p < 0.05, **p < 0.01, Bonferroni-corrected based on regions, with testing against a null distribution created by randomizing subject labels; error bars represent standard error of the mean [SEM] estimated based on randomization). PrC and alErC also show significant higher i-index than other regions as indicated with horizontal lines; *p < 0.05, Bonferroni-corrected. (C) Only patterns in PrC and alErC show relationship observer-specific perceived similarity ratings at the middle and high levels of perceived similarity; (*p < 0.05, Bonferroni-corrected for regions and levels). Correlations in PrC and alErC were significantly larger than those in EVC and LOC at the medium and high levels of perceived similarity (horizontal lines indicate p < 0.05). EVC = early visual cortex; LOC = lateral occipital complex; PrC = perirhinal cortex; alErC = anterolateral entorhinal cortex; pmErC = posteromedial entorhinal cortex; PhC = parahippocampal cortex; TP = temporal pole; see Figure 5a for visualization.
Figure 7—figure supplement 1
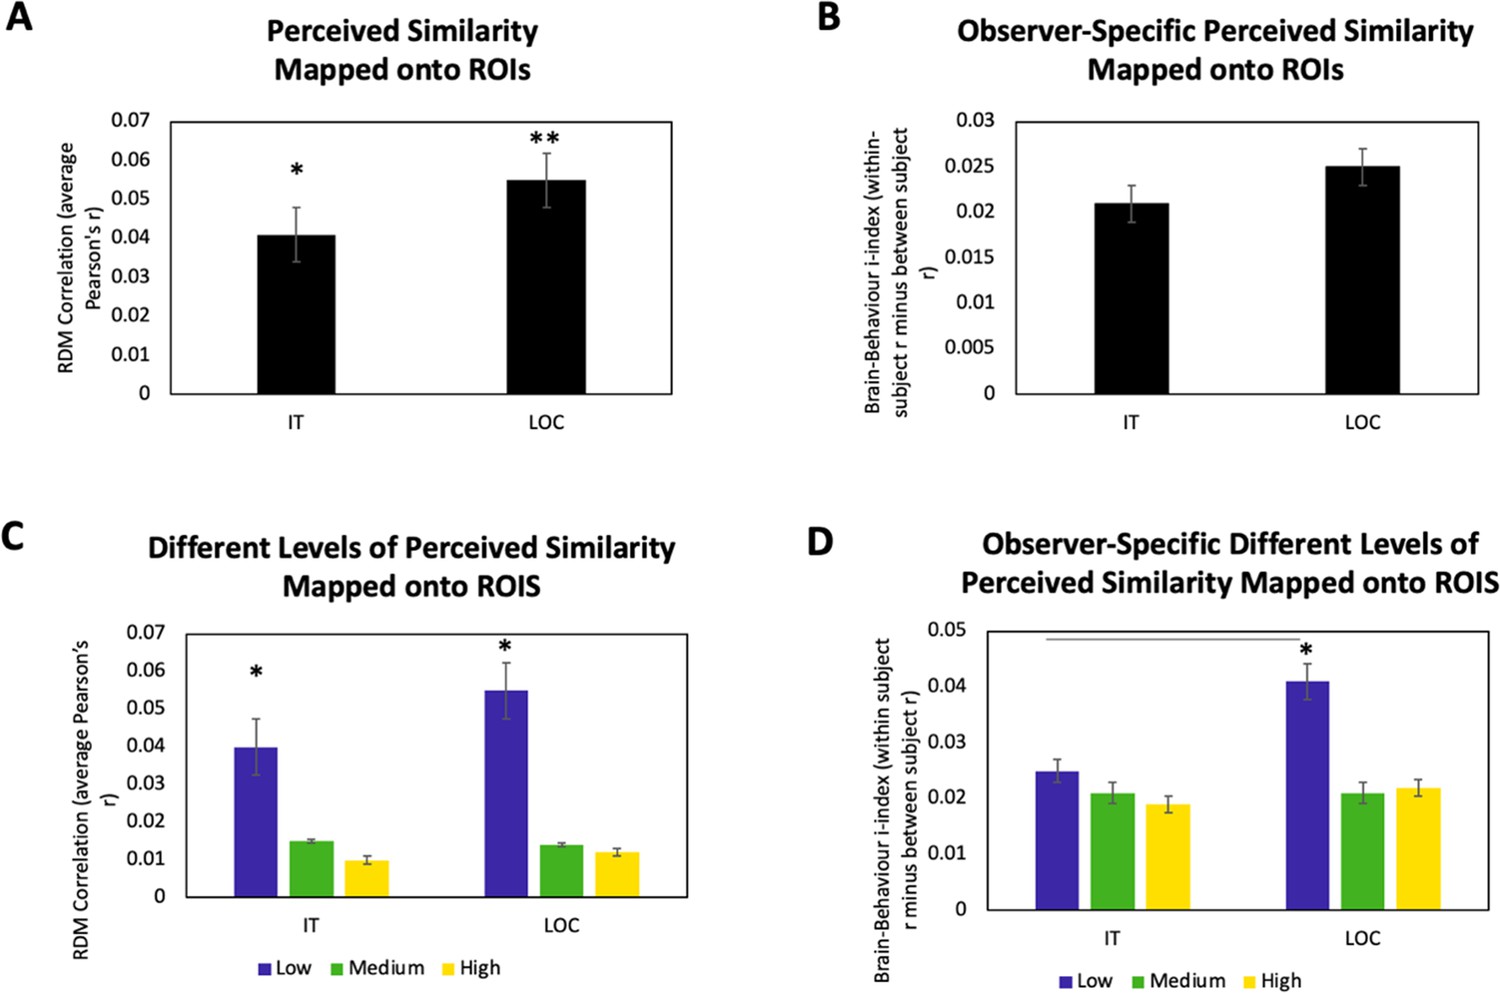
Comparison between inferotemporal (IT) cortex and lateral occipital complex (LOC): brain-based representational dissimilarity matrices (RDMs) and their relationship to perceived visual similarity (A) at all levels of perceived similarity (**p < 0.01, *p < 0.05) and (B) corresponding i-index; and (C) at different levels of perceived similarity and (D) corresponding i-index (*p < 0.05).
These four analyses from the main experiment were included here to compare results in IT cortex with those in LOC. IT cortex is a large swath of cortex that extends across occipital and temporal cortex. This region of interest (similar to the one used in Charest et al., 2014) overlaps with regions of interest used in the main experiment including LOC, PhC, and TP. We were specifically interested in LOC – the object selective portion of larger IT cortex – because our stimuli were objects. The results across these four sets of analyses were highly similar between the two regions, with the only noticeable exception that LOC activity patterns predict observer-specific perceived similarity at low levels of similarity while IT patterns do not predict any observer-specific similarity.
Figure 7—figure supplement 2
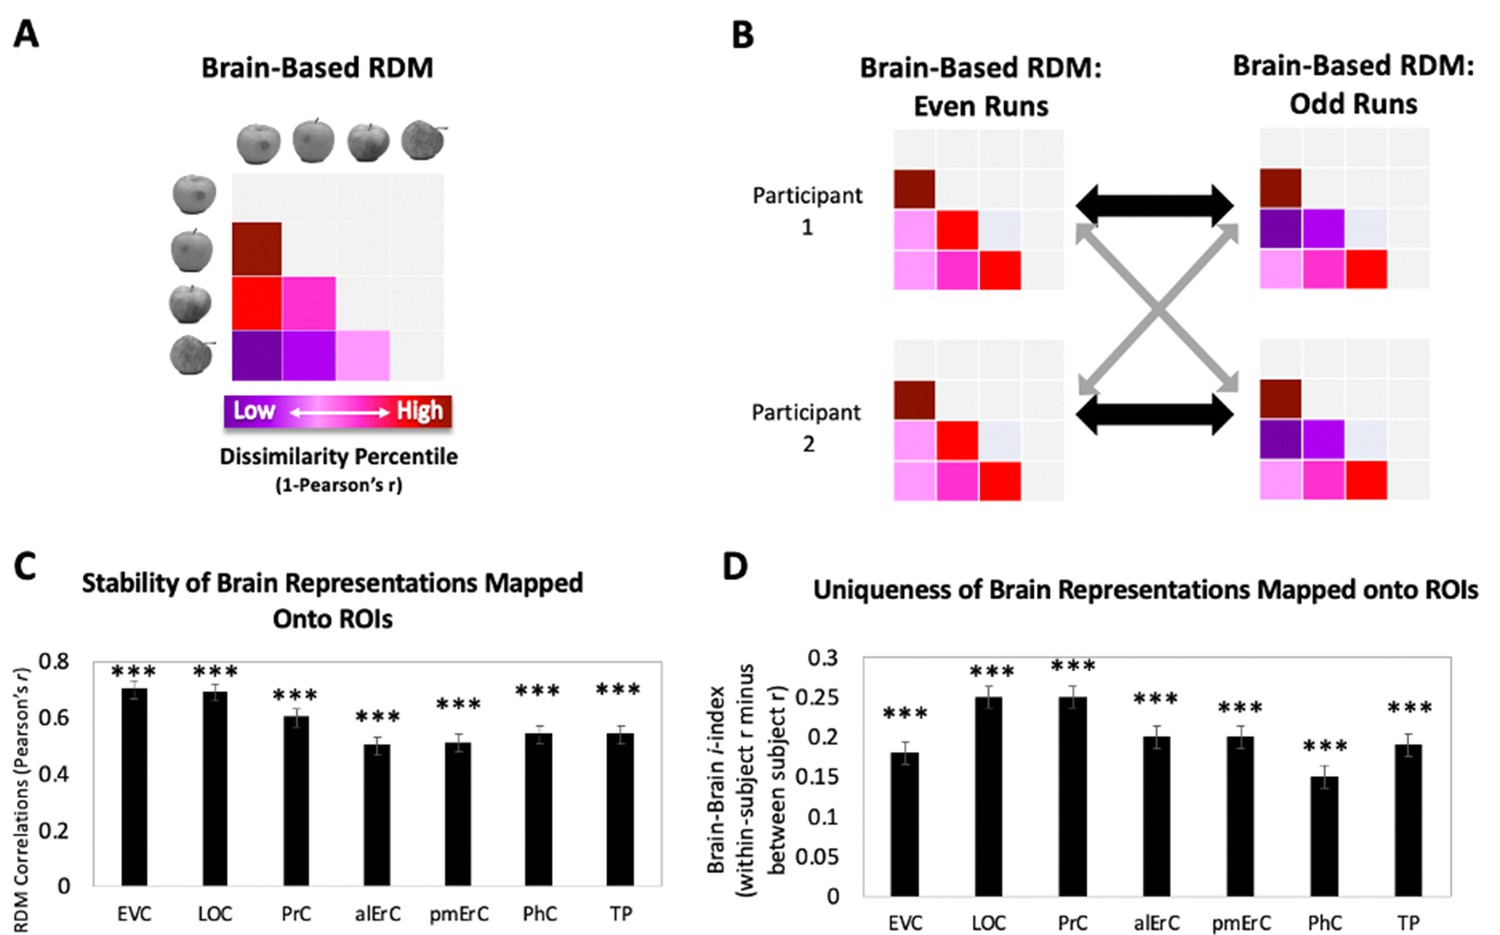
Relationship between brain-based representational dissimilarity matrices (RDMs) in even and odd runs, within and between participants.
(A) Pairwise pattern dissimilarity percentiles were used to create observer-specific brain-based RDMs for even and odd runs. (B) Brain-based RDMs from even runs were correlated with (1) observers’ brain-based RDMs for odd runs (black double arrows = within subject r) and (2) other observers’ brain-based RDMs from odd runs (grey arrows = between subject r) for comparison. (C) Patterns in all region of interests (ROIs) show stable similarity structure as reflected in significant correlations between odd and even run; ***p < 0.001, Bonferroni-corrected based on regions; error bars represent standard error of the mean (SEM). (D) Patterns in all ROIs are unique to each individual as reflected in significant brain–brain i-index (i.e., within minus between subject correlation; ***p < 0.001, Bonferroni-corrected based on regions, with testing against a null distribution created by randomizing subject labels; error bars represent SEM estimated based on randomization). EVC = early visual cortex; LOC = lateral occipital complex; PrC = perirhinal cortex; alErC = anterolateral entorhinal cortex; pmErC = posteromedial entorhinal cortex; PhC = parahippocampal cortex; TP = temporal pole.
Additional files
-
Supplementary file 1
Behavioural performance on Category-Exemplar 1-Back Task.
Proportion of correct responses for each trial type are indicated in green.
- https://cdn.elifesciences.org/articles/66884/elife-66884-supp1-v2.docx
-
Supplementary file 2
Multiple linear regression: brain RDM ~ (own RDM + average RDM).
- https://cdn.elifesciences.org/articles/66884/elife-66884-supp2-v2.docx
-
Transparent reporting form
- https://cdn.elifesciences.org/articles/66884/elife-66884-transrepform1-v2.pdf
Download links
A two-part list of links to download the article, or parts of the article, in various formats.
Downloads (link to download the article as PDF)
Open citations (links to open the citations from this article in various online reference manager services)
Cite this article (links to download the citations from this article in formats compatible with various reference manager tools)
Activity in perirhinal and entorhinal cortex predicts perceived visual similarities among category exemplars with highest precision
eLife 11:e66884.
https://doi.org/10.7554/eLife.66884


