Integrative transcriptomic analysis of tissue-specific metabolic crosstalk after myocardial infarction
- Science for Life Laboratory, KTH - Royal Institute of Technology, Sweden
- Department of Molecular and Clinical Medicine, University of Gothenburg, The Wallenberg Laboratory, Sahlgrenska University Hospital, Sweden
- National Bioinformatics Infrastructure Sweden (NBIS), Science for Life Laboratory, Department of Biochemistry and Biophysics, Stockholm University, Sweden
- Centre for Host-Microbiome Interactions, Faculty of Dentistry, Oral & Craniofacial Sciences, King's College London, United Kingdom
- Department of Medical Biology, Faculty of Medicine, Atatürk University, Turkey
- Translational Genomics, BioPharmaceuticals R&D, Discovery Sciences, AstraZeneca, Sweden
- Bioscience Cardiovascular, Research and Early Development, Cardiovascular, Renal and Metabolism (CVRM), BioPharmaceuticals R&D, AstraZeneca, Sweden
Figures
Figure 1 with 4 supplements
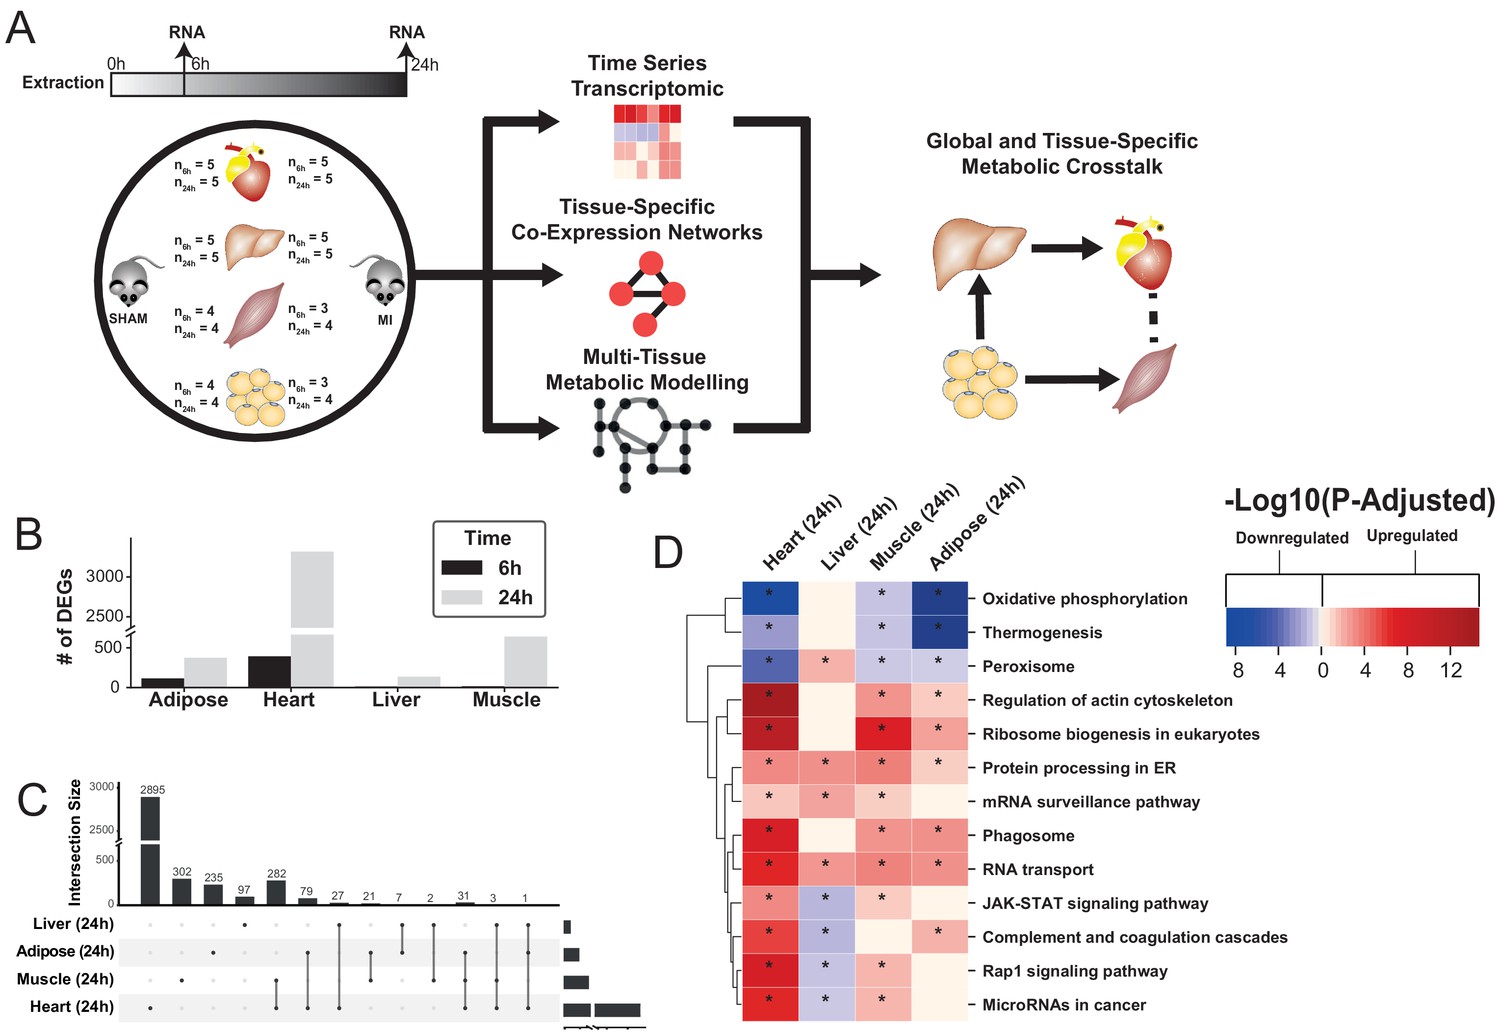
Study overview and transcriptional changes 24 hours after MI.
(A) Overview of this study (B) Number of differentially expressed genes for each tissue at each time point. Effect of MI shown to be more pronounced after 24 hr. (C) UpSet plot to show intersection between differentially expressed genes (FDR < 5%) in different tissues. The plot showed that each tissue has its specific set of genes that were affected by MI. (D) KEGG pathway analysis (FDR < 0.05 in at least three tissues) for 24 hours post MI compared to its control for each tissue. We observed that 141 (5 upregulated) and 125 (14 upregulated) pathways are significantly altered in heart 6 and 24 hr after infarction, respectively. For other tissues, we found that 24 (9 upregulated), 61 (54 upregulated), and 48 (15 upregulated) pathways are altered in liver, muscle, and adipose, respectively.
Figure 1—figure supplement 1
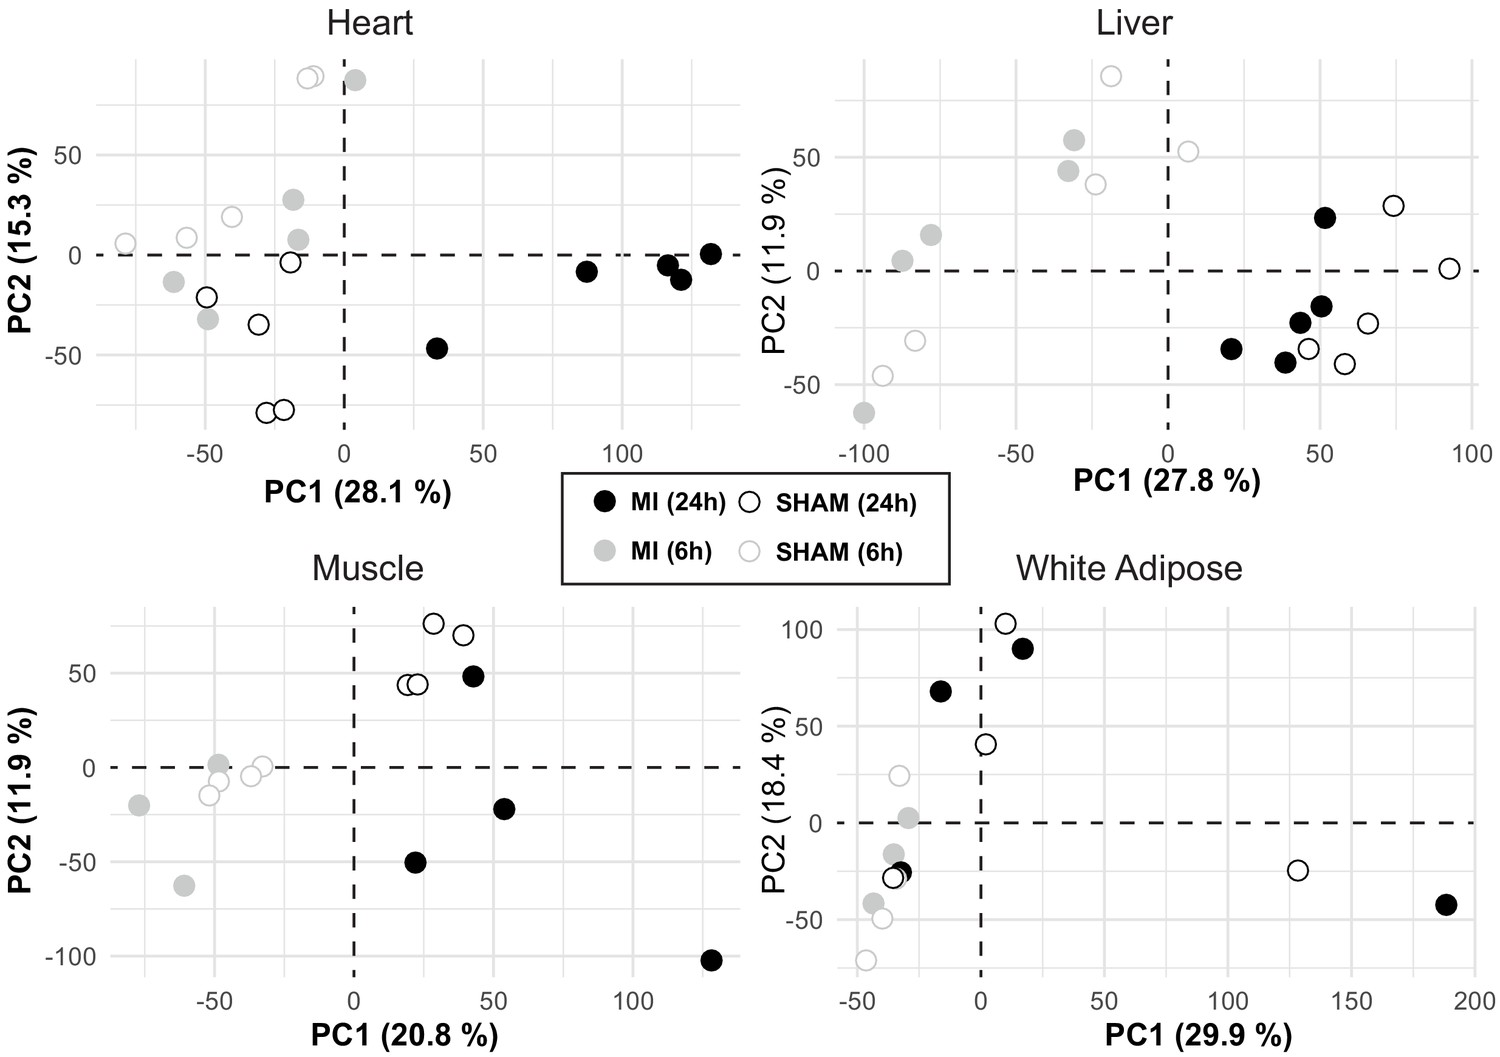
Data exploration of the samples.
PCA plots of each tissue showing data from mice 6 and 24 hr after an MI or sham operation. The plot showed that heart was affected the most by the change in conditions and the rest were most affected by time shifts.
Figure 1—figure supplement 2
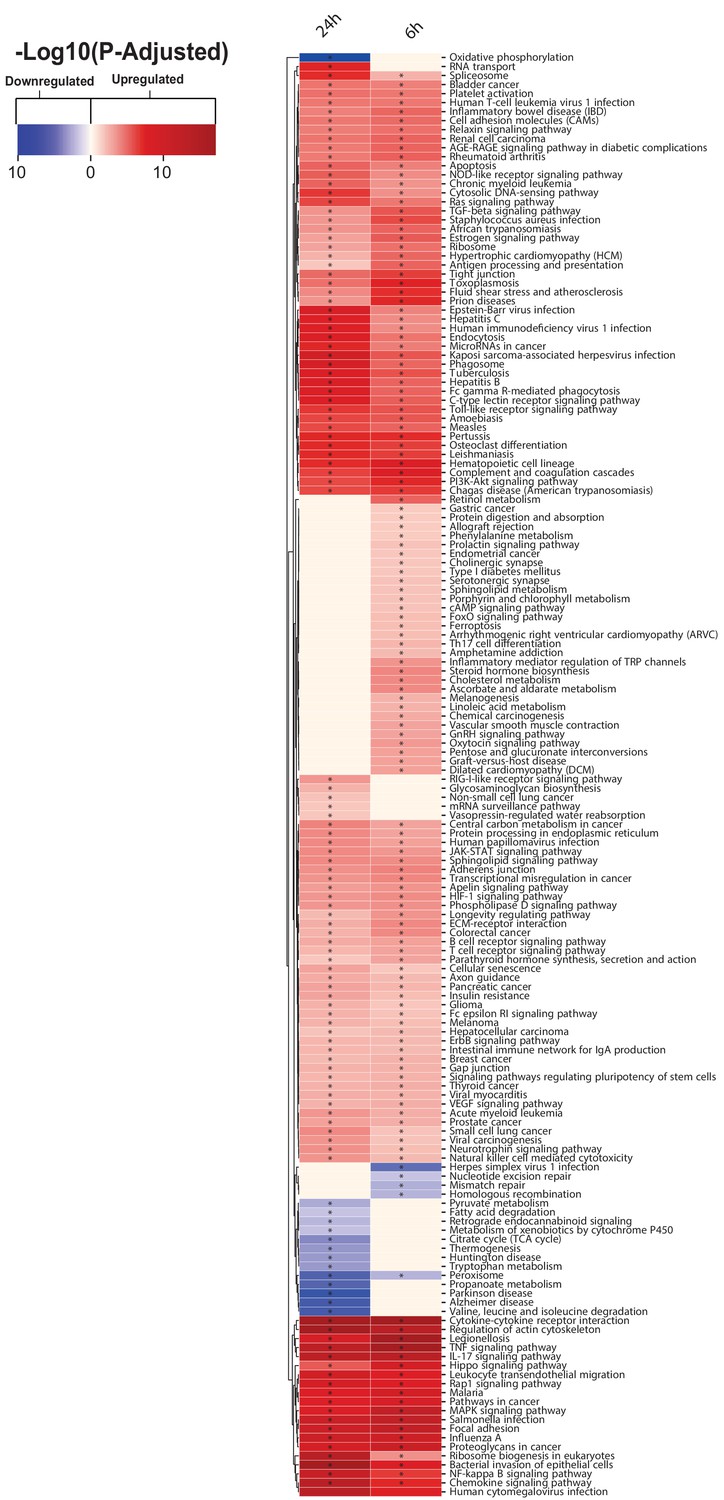
KEGG pathway analysis results for Heart 6- and 24 hr post MI.
Figure 1—figure supplement 3
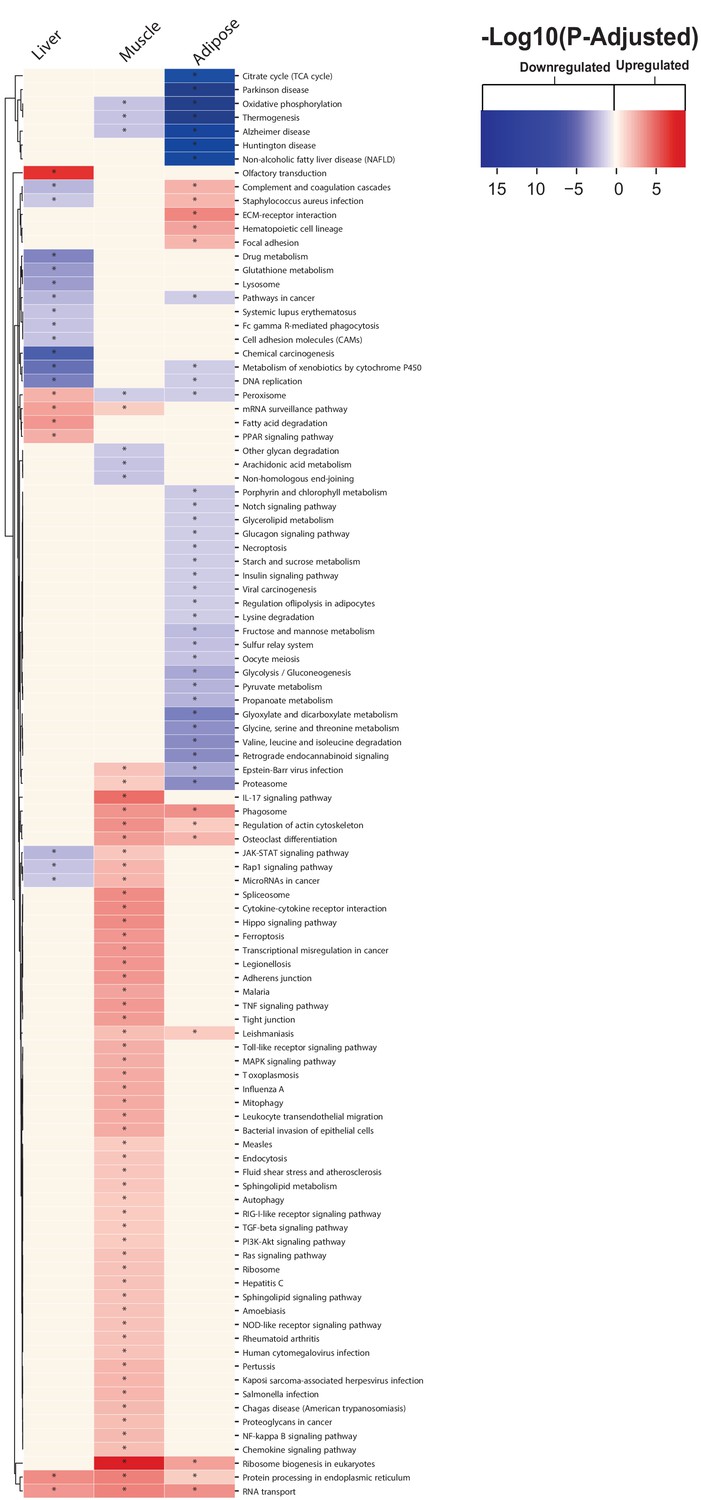
KEGG pathway analysis results for each tissue liver, muscle, and adipose tissue 24 hr post MI.
Figure 1—figure supplement 4

KEGG pathways related to cardiac problems show activation after an MI.
Figure 2
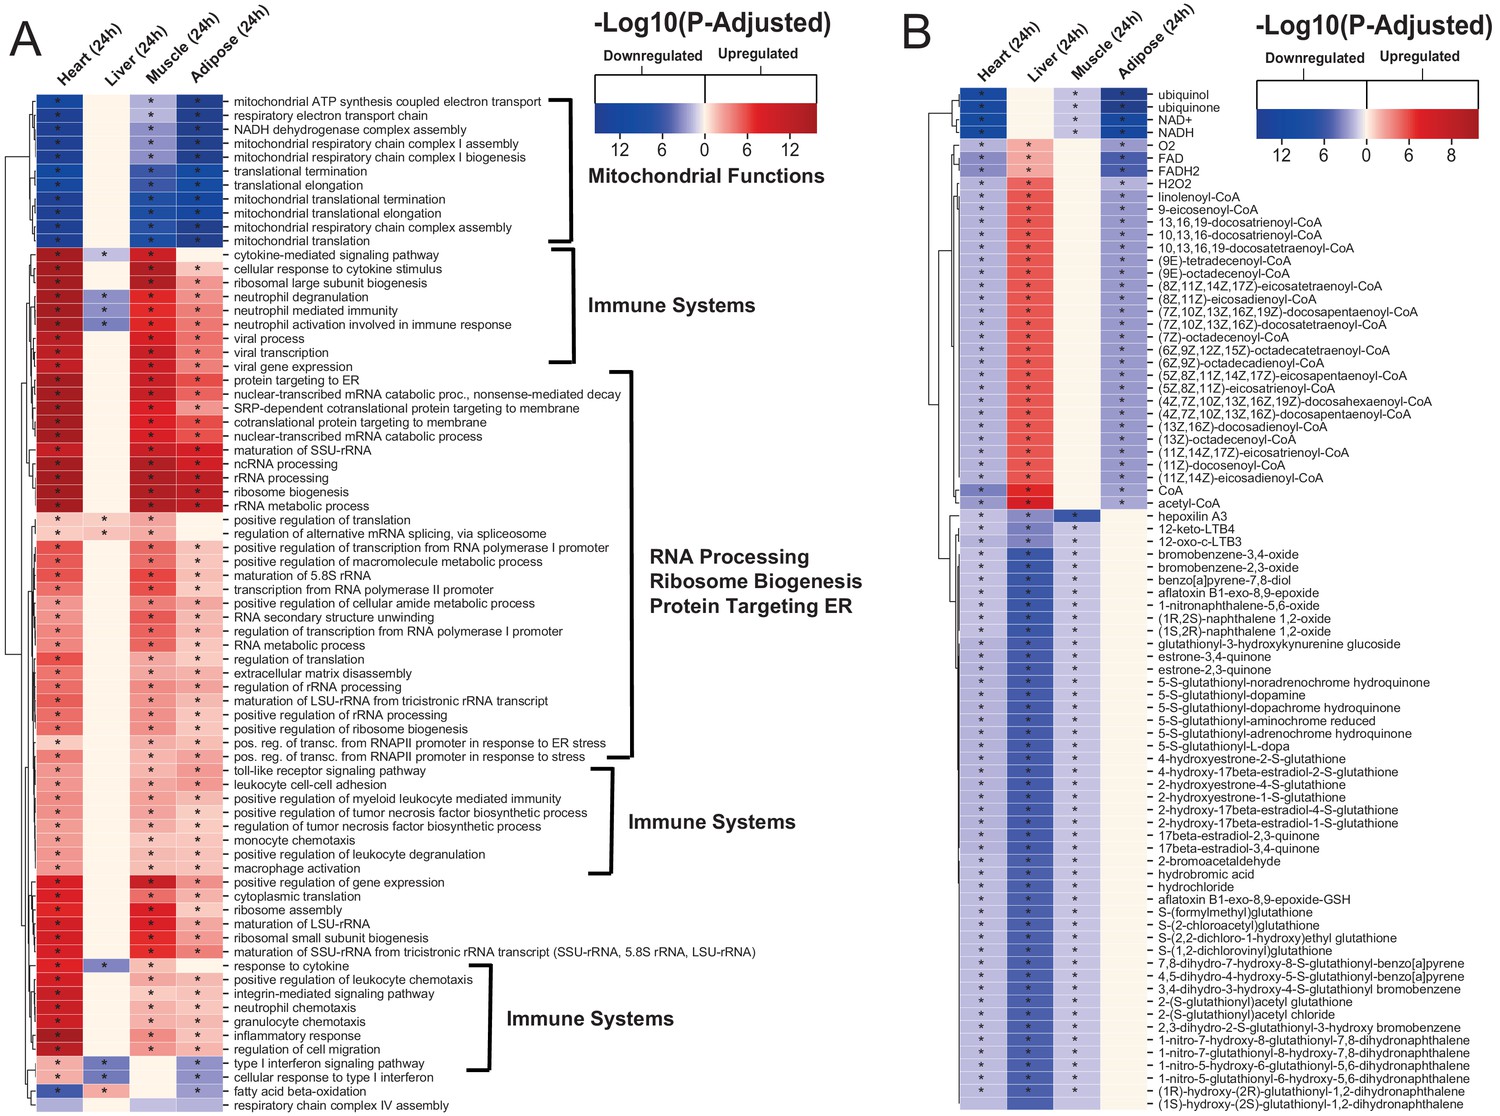
Gene ontology and reporter metabolites analysis results.
(A) Functional analysis with GO (FDR < 0.05% in at least three tissues) revealed that 944 (919 upregulated) and 1019 (970 upregulation) BPs are significantly altered in heart 6 and 24 hr after infarction, respectively. The results also showed 38 (16 upregulated), 376 (357 upregulated), and 193 (116 upregulated) BPs are significantly altered 24 hr after infarction in liver, muscle and adipose, respectively. Most tissues show significant alterations in multiple biological processes, including mitochondrial functions, RNA processes, cell adhesion, ribosome, and immune systems. The results of this analysis showed alterations concordant with those observed for KEGG pathways. (B) Reporter metabolites analysis shows significant alteration in important metabolites. Our analysis revealed that 169, 324, 118, and 51 reporter metabolites are significantly altered in heart, liver, skeletal muscle and adipose tissues, respectively, at 24 hr post-infarction (Table S4).
Figure 3
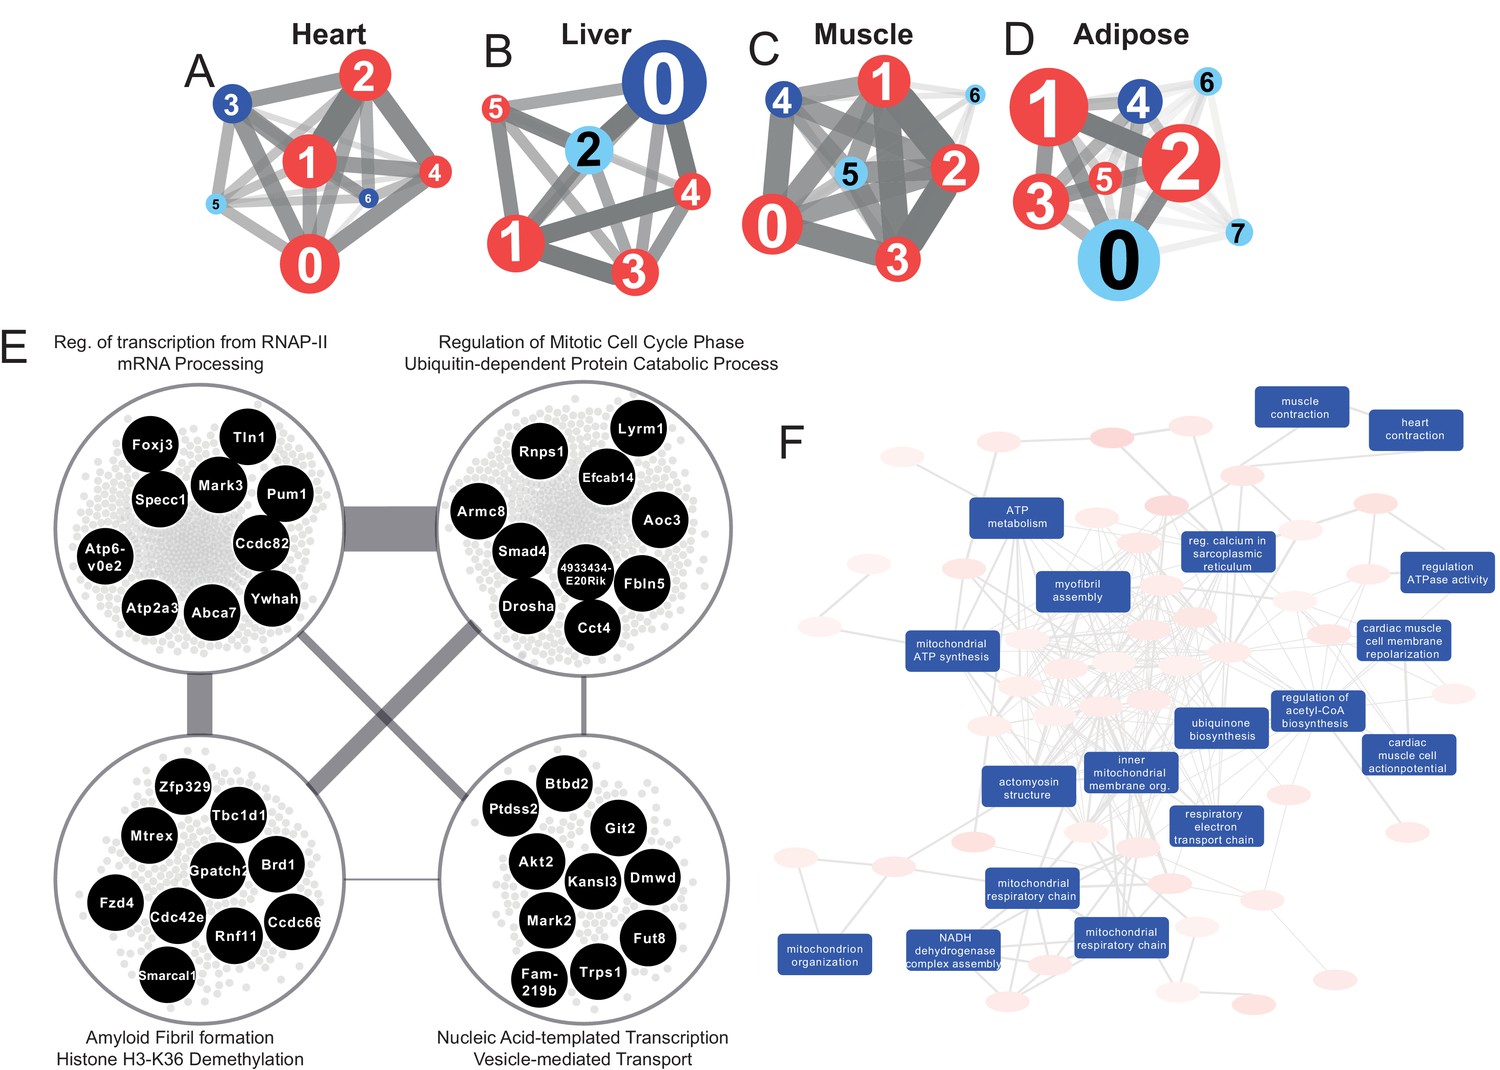
Tissue-specific gene co-expression network analyses.
(A) Heart co-expression network clusters with superimposed DEGs 24 h post-infarction (Blue = downregulated, Red = upregulated) marked with the cluster numbers. The edges between the clusters were aggregation of the inter-cluster edges (B) Liver. (C) Muscle. (D) Adipose. (E) Intersection of the most central clusters in all tissues shows that the central architecture of the network was conserved in all tissues. We found four sub-clusters within the network intersection. Top 10 most connected genes are marked in black. (F) Enriched GO BP in heart-specific cluster generated by Revigo.
Figure 4 with 2 supplements
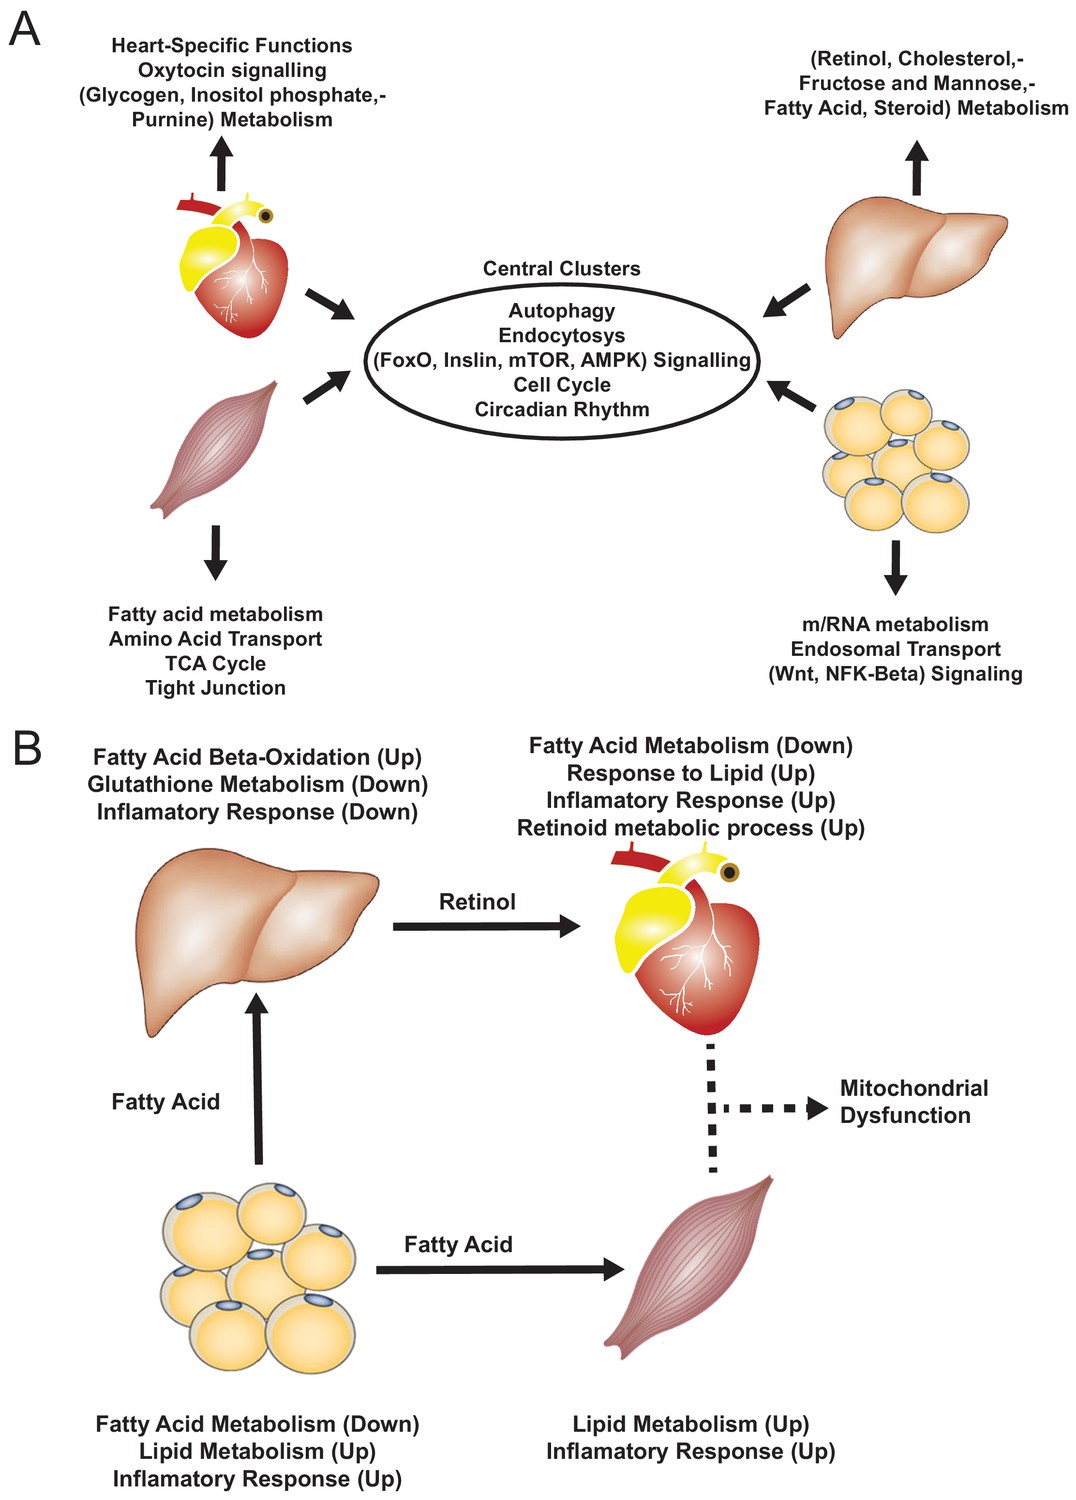
Functional analysis of network clusters and hypothesized metabolites flow.
(A) Similarity of functions in the most central cluster and specific functions of each tissue-specific cluster. (B) Functional analysis for each tissue and hypothesized flow of metabolites.
Figure 4—figure supplement 1
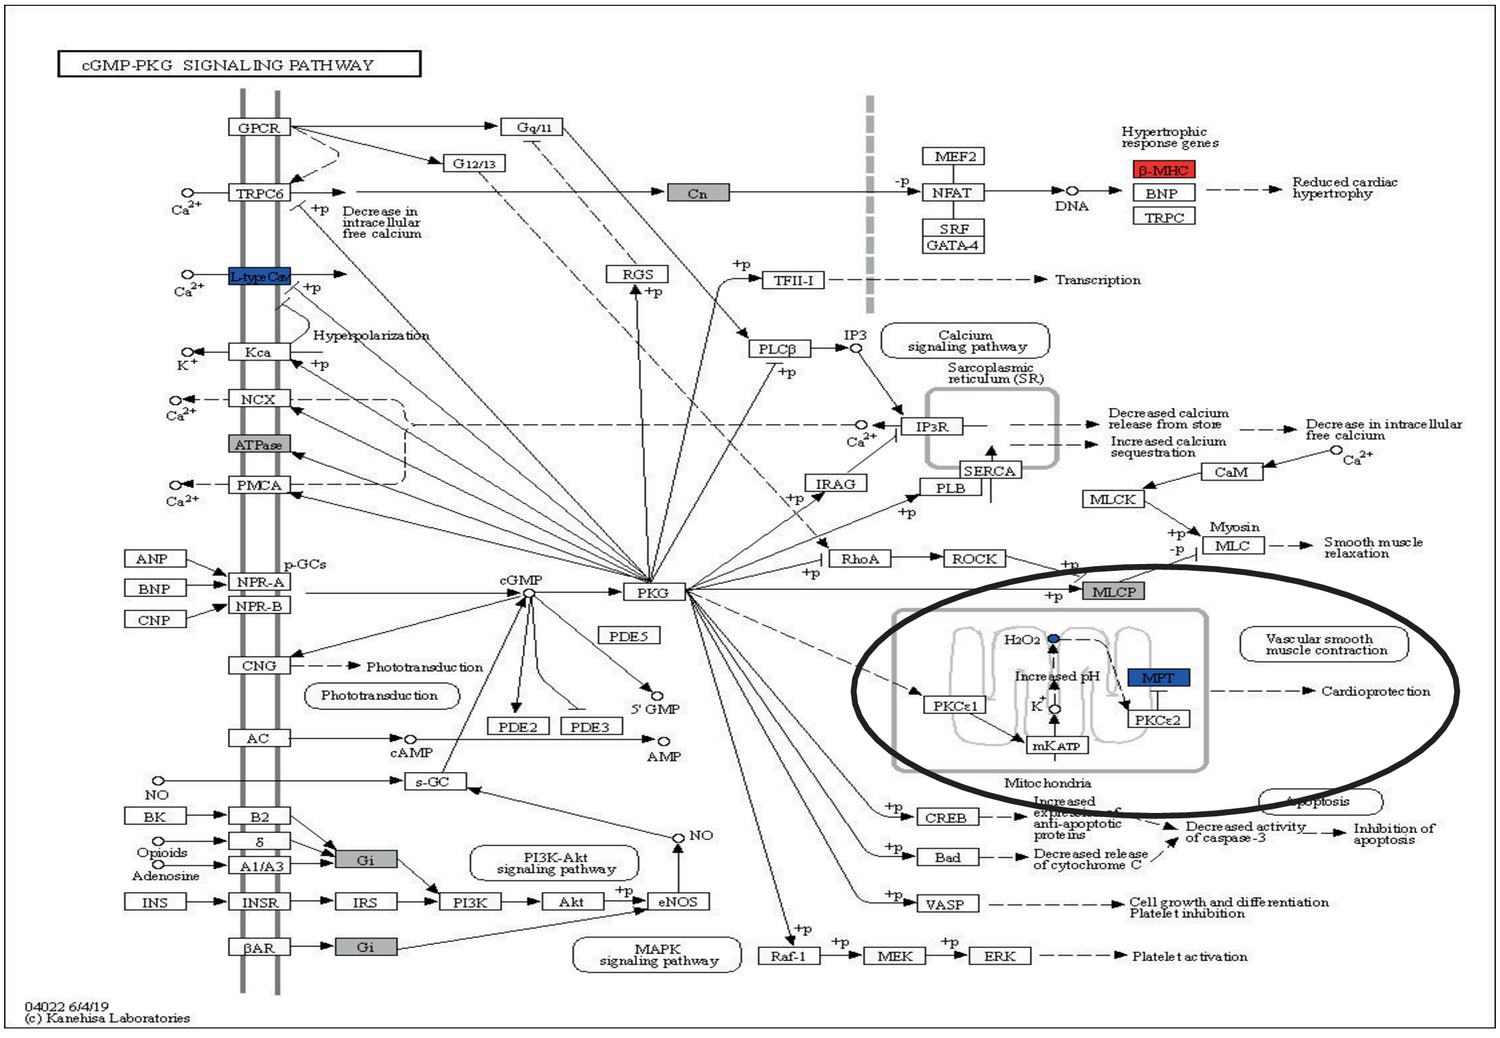
cGMP-PKG with overlay data from differential expression and reporter metabolites analysis.
Figure 4—figure supplement 2
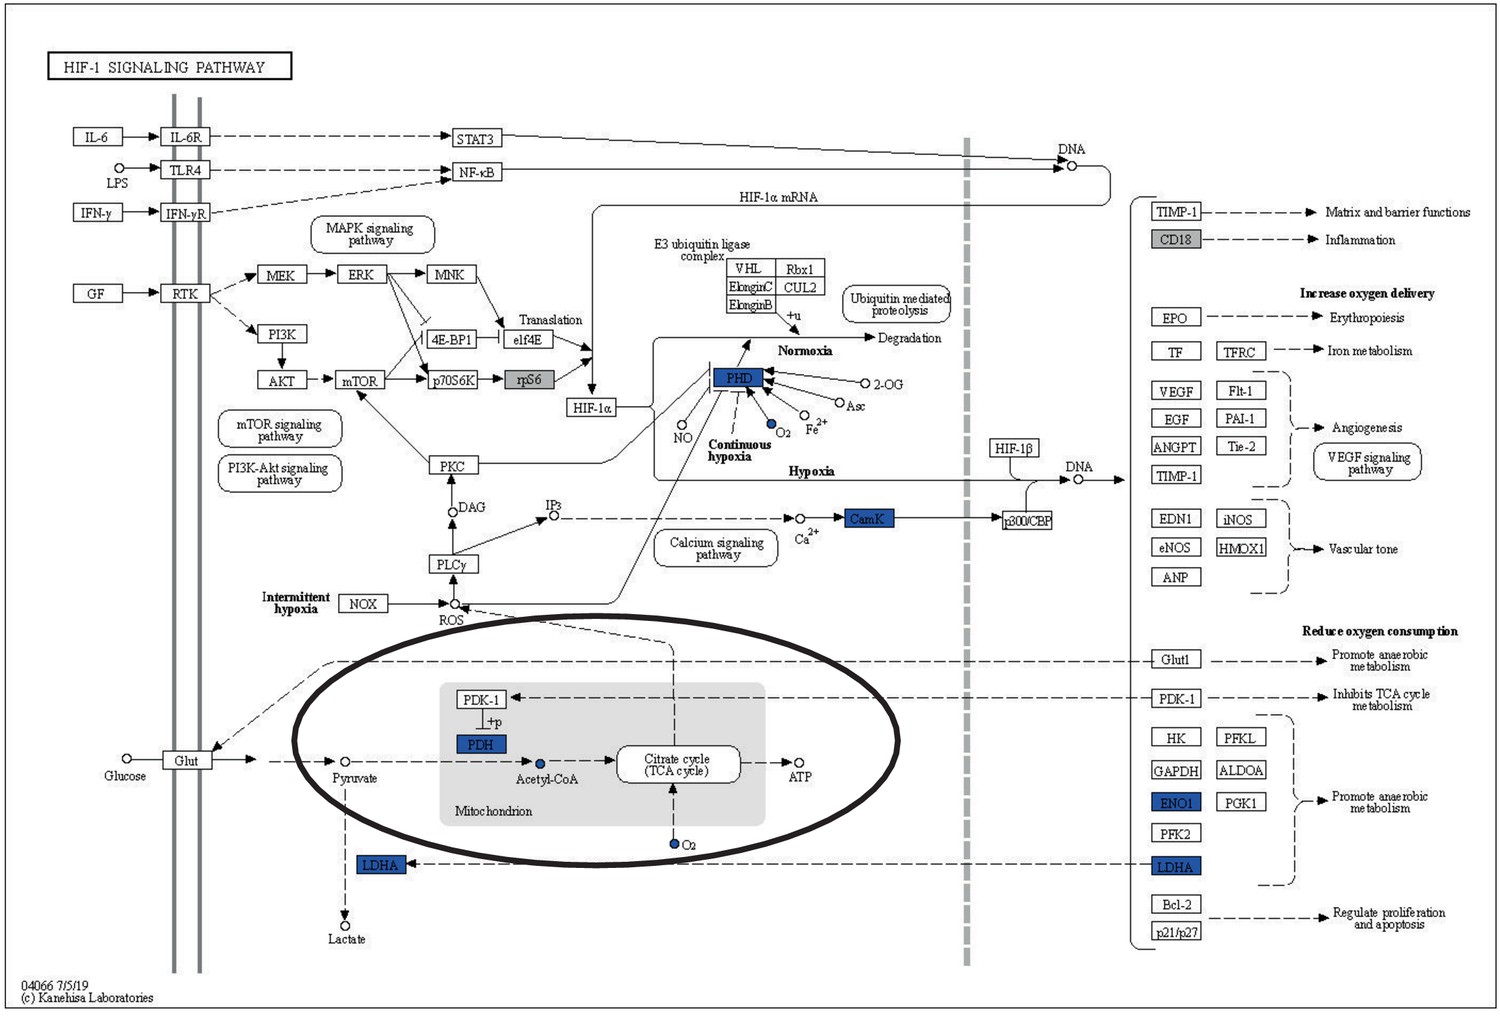
HIF-1 signaling pathway with overlay data from differential expression and reporter metabolites analysis.
Figure 5
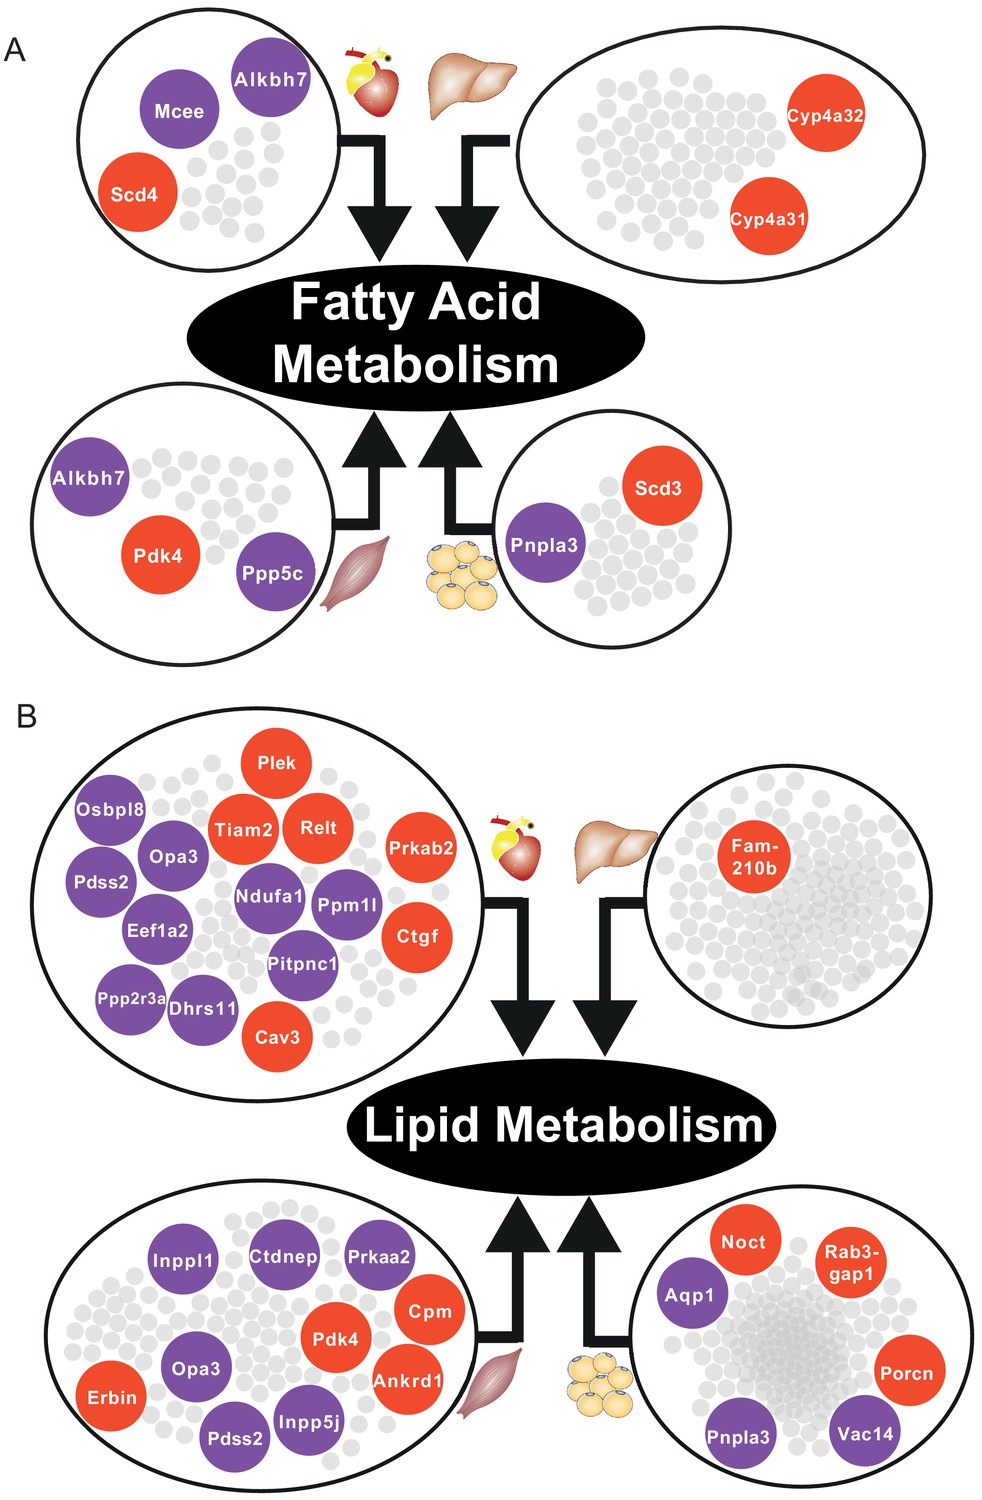
Central DEGs in fatty acid and lipid metabolism.
(A) Significantly differentially expressed central genes of each tissue-specific cluster to fatty acid metabolism, as one of the most affected metabolic process. (B) Lipid metabolism. Red = upregulated, blue = downregulated.
Figure 6
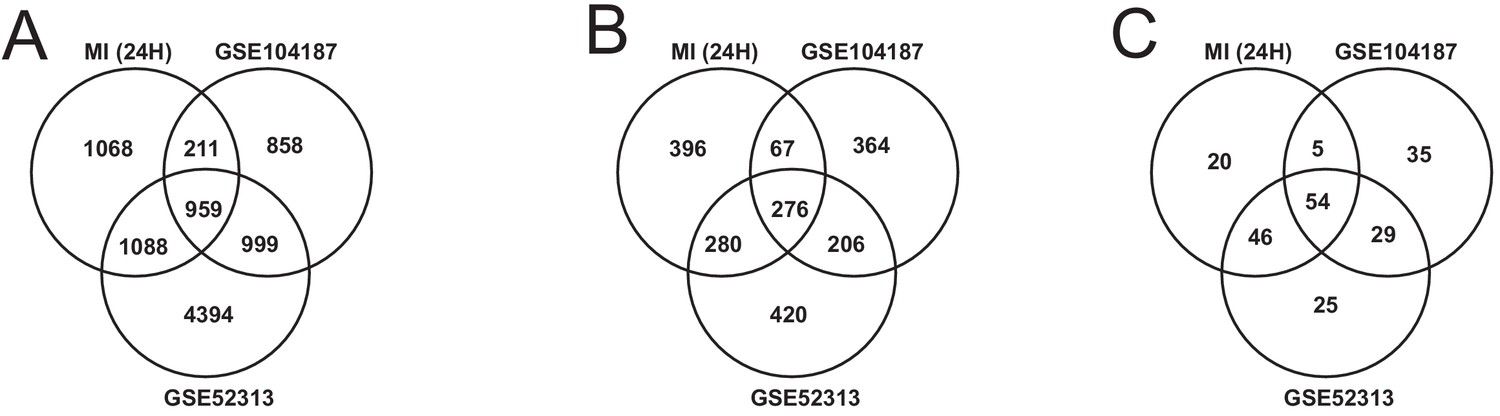
Comparison of our analysis results with the independent validation cohorts.
(A) DEGs intersection of our data and validation cohort (B) and (C) intersection of functional analysis results (GO BP and KEGG Pathways) of our data and validation cohort.
Tables
Table 1
Properties of the co-expression network.
| Tissue | # of Genes | # of Edges | # of Clusters | Modularity scores |
|---|---|---|---|---|
| Heart | 8793 | 1570898 | 7 | 0.540 |
| Liver | 7760 | 1103589 | 6 | 0.577 |
| Muscle | 8834 | 1660603 | 7 | 0.521 |
| Adipose | 10790 | 2636378 | 8 | 0.495 |
Key resources table
| Reagent type (species) or resource | Designation | Source or reference | Identifiers | Additional information |
|---|---|---|---|---|
| Commercial assay or kit | RNeasy Fibrous Tissue Mini Kit | Qiagen | Heart and Skeletal Muscle Tissue | |
| Commercial assay or kit | RNeasy Mini Kit | Qiagen | Liver Tissue | |
| Commercial assay or kit | RNeasy Lipid Tissue Mini Kit | Qiagen | Adipose Tissue | |
| Commercial assay or kit | cDNA Reverse Transcription Kit | Applied Biosystems | ||
| Commercial assay or kit | TaqMan real-time PCR in a ViiA seven system | Applied Biosystems | ||
| Commercial assay or kit | NovaSeq6000 | Illumina | ||
| Software, algorithm | NovaSeq Control Software 1.6.0/RNA v3.4.4 | Illumina | ||
| Software, algorithm | CASAVA Software Suite | Illumina | ||
| Software, algorithm | Kallisto | RRID:SCR_016582 | ||
| Software, algorithm | Python 3.7 | Python Programming Language | RRID:SCR_008394 | |
| Software, algorithm | sklearn | Python Package | RRID:SCR_019053 | |
| Software, algorithm | R | R Project for Statistical Computing | RRID:SCR_001905 | |
| Software, algorithm | Rpy2 | Python Package | https://rpy2.github.io/ | |
| Software, algorithm | DESeq2 | R Package | RRID:SCR_015687 | |
| Software, algorithm | PIANO | R Package | RRID:SCR_003200 | |
| Software, algorithm | SciPy | Python Package | RRID:SCR_008058 | |
| Software, algorithm | Statsmodel | Python Package | RRID:SCR_016074 | |
| Software, algorithm | iGraph | Python Package | RRID:SCR_019225 | |
| Software, algorithm | Leiden Clustering | Python Package | https://github.com/vtraag/leidenalg | |
| Software, algorithm | Matlab | Mathworks | RRID:SCR_001622 |
Additional files
-
Supplementary file 1
Differential expression analysis results.
- https://cdn.elifesciences.org/articles/66921/elife-66921-supp1-v2.xlsx
-
Supplementary file 2
KEGG pathways.
- https://cdn.elifesciences.org/articles/66921/elife-66921-supp2-v2.xlsx
-
Supplementary file 3
Gene ontology biological processes.
- https://cdn.elifesciences.org/articles/66921/elife-66921-supp3-v2.xlsx
-
Supplementary file 4
DEG comparison between liver and other tissues.
- https://cdn.elifesciences.org/articles/66921/elife-66921-supp4-v2.xlsx
-
Supplementary file 5
Reporter metabolite analysis.
- https://cdn.elifesciences.org/articles/66921/elife-66921-supp5-v2.xlsx
-
Supplementary file 6
Enrichment analyses of clusters, clusters properties.
- https://cdn.elifesciences.org/articles/66921/elife-66921-supp6-v2.xlsx
-
Supplementary file 7
Food intake, energy expenditure, and flux balance analysis (FBA) of whole-body modeling.
- https://cdn.elifesciences.org/articles/66921/elife-66921-supp7-v2.xlsx
-
Supplementary file 8
Validation result (differential expression and functional analysis).
- https://cdn.elifesciences.org/articles/66921/elife-66921-supp8-v2.xlsx
-
Supplementary file 9
Detailed information of 16 key genes that are DEGs in at least three tissues and neighbors and functional analysis results of The Neighbors of 4 key genes.
- https://cdn.elifesciences.org/articles/66921/elife-66921-supp9-v2.xlsx
-
Transparent reporting form
- https://cdn.elifesciences.org/articles/66921/elife-66921-transrepform-v2.docx
Download links
A two-part list of links to download the article, or parts of the article, in various formats.
Downloads (link to download the article as PDF)
Open citations (links to open the citations from this article in various online reference manager services)
Cite this article (links to download the citations from this article in formats compatible with various reference manager tools)
Integrative transcriptomic analysis of tissue-specific metabolic crosstalk after myocardial infarction
eLife 10:e66921.
https://doi.org/10.7554/eLife.66921


