Erythropoietin directly remodels the clonal composition of murine hematopoietic multipotent progenitor cells
- Institut Curie, Université PSL, Sorbonne Université, CNRS UMR168, Laboratoire Physico Chimie Curie, France
- Netherlands Cancer Institute, Netherlands
Figures
Figure 1 with 4 supplements
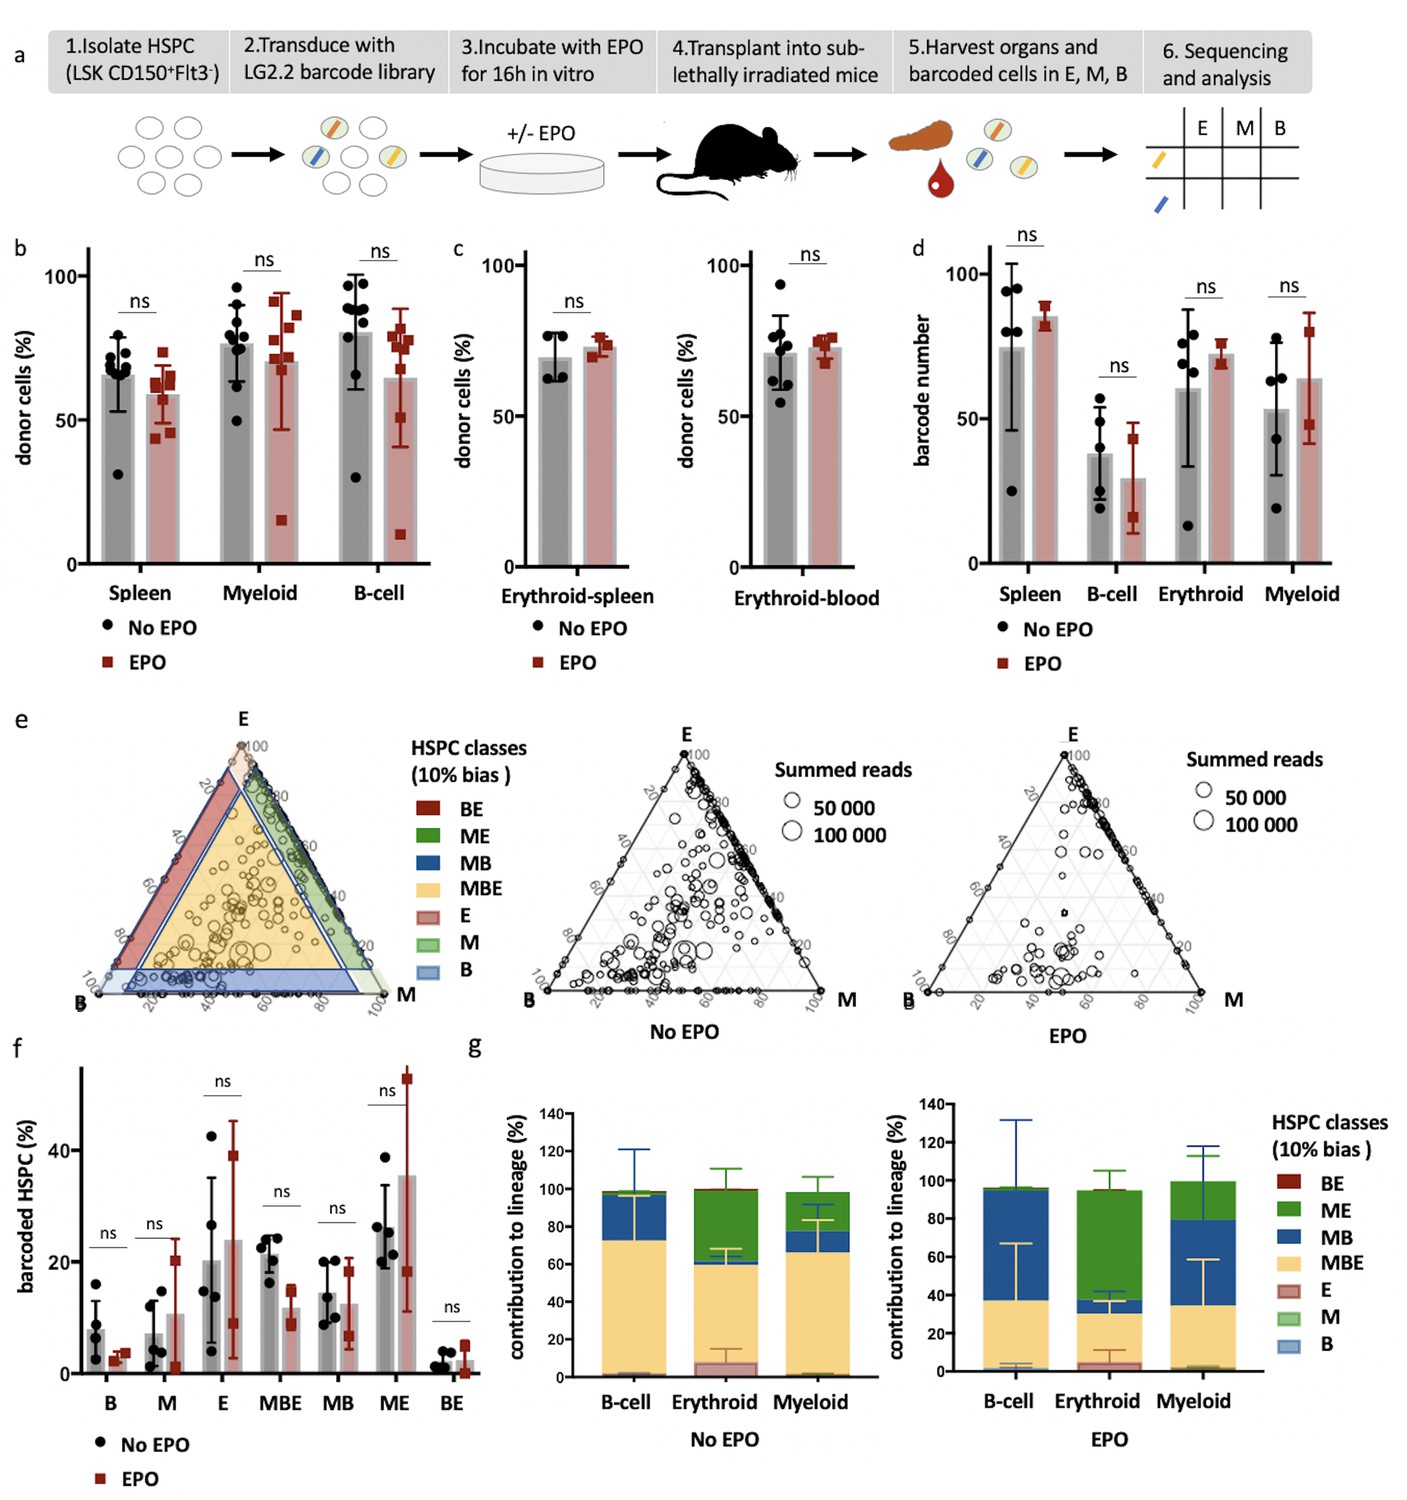
High-output ME- and MB-biased clones occur after erythropoietin (EPO) exposure and transplantation of hematopoietic stem and progenitor cells (HSPCs).
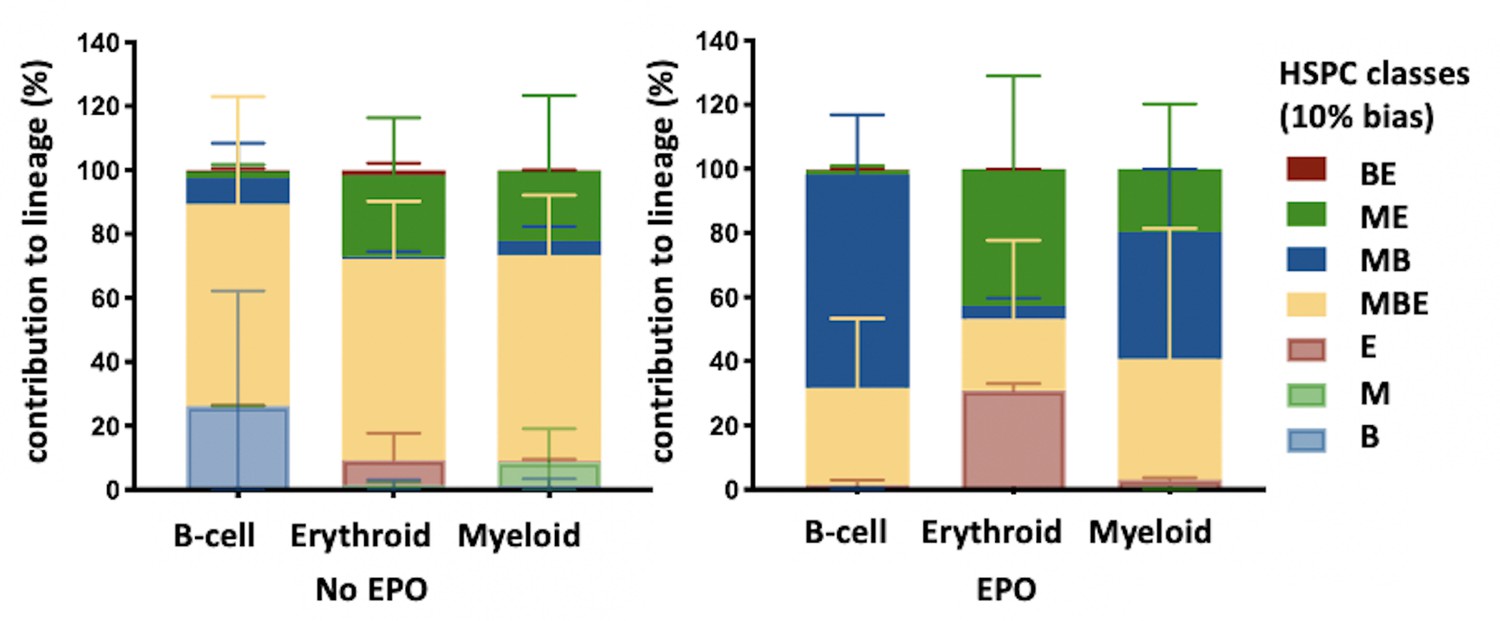
(a) HSPCs were sorted from the bone marrow of donor mice, lentivirally barcoded, cultured ex vivo with or without 1000 ng/ml EPO for 16 hr, and transplanted into sublethally irradiated mice. At week 4 post-transplantation, the erythroid (E), myeloid (M), and B-cells (B) lineages were sorted from the spleen and processed for barcode analysis. (b) The percentage of donor-derived cells (CD45.1+) among the total spleen, myeloid cells (CD11b+) or B-cells (CD19+) in the spleen of control and EPO group. (c) To better assess chimerism in erythroid cells, mTdTomato/mGFP donor mice were used. The fraction of Tom+ cells among erythroid cells (Ter119+) in the spleen and blood in control and EPO group. (d) The number of barcodes retrieved in the indicated lineages at week 4 after transplantation in the control and EPO groups. (e) Triangle plots showing the relative abundance of barcodes (circles) in the E, M, and B lineage with respect to the summed output over the three lineages (size of the circles) for the control and EPO groups. (f) Tthe percentage of HSPCs classified by the indicated lineage bias using a 10% threshold for categorization. (g) Quantitative contribution of the classes as in (f) to each lineage. Shown are values from several animals (n = 8 EPO, n = 10 control in b, n = 3 EPO, n = 4 control in c , spleen, n = 4 EPO, n = 8 control in c , blood collected over five different experiments d–g, n = 5 for the control group and n = 2 for the EPO group collected over one experiment). For all bar graphs, mean and SD between mice are depicted. Statistical significance tested using Mann–Whitney U-test p=0,05 for (b, c). Statistical significance tested by permutation test for different subsets in (g) (see Table 1).
Figure 1—figure supplement 1

Gating strategies and hematopoietic stem and progenitor cell (HSPC) marker expression after lentiviral transduction and ex vivo culture with or without erythropoietin (EPO).
(a) HSPCs were gated as propidium iodide-negative single C-Kit+ Sca-1+ Flt3- CD150+ cells of C-Kit+-enriched bone marrow cells. (b) Erythroblast cells were gated as Ter119+ CD44+ FSChi cells on Ter+ enriched cells. (c) Gating strategy for B-cells (CD19+ CD11b-), dendritic cells (CD19- CD11b- CD11c+), and myeloid cells (CD119- CD11c- CD11b+) on Ter119- live single-donor cells. (d) Gating for MkP (C-Kit+ Sca-1- CD150+ CD41+) from C-Kit+-enriched bone marrow cells. (e) Sort gating for GFP+ erythroid, myeloid, B-, and dendritic cells, respectively, used for barcoding analysis. (f) Representative flow cytometry plots of sorted HSPC pool after 6 hr lentiviral transduction and 16 hr ex vivo incubation with or without EPO.
Figure 1—figure supplement 2

Correlations in barcoding profiles of spleen and bone.
Hematopoietic stem and progenitor cells (HSPCs) were sorted from the bone marrow of donor mice, lentivirally barcoded, cultured ex vivo for 16 hr, and transplanted into sublethally irradiated mice. At week 4 post-transplantation, erythroid (E), B-cells (B), and the myeloid lineage (M) cells monocytes, eosinophils, neutrophils, and macrophages were sorted from the spleen and from bone and processed for barcode analysis. The myeloid lineage was merged according to the percentage of total donor myeloid each subset contributed as in Figure 3—figure supplement 1b. (a) Heatmaps showing the output of individual barcodes (rows) in different samples (columns) as indicated. Data is normalized by cell subset, log transformed, and clustered by complete linkage using Euclidean distance. No output is represented in black. (b) The percentage of barcodes in spleen and bone detected in the respective other organ. The Spearman rank correlation of barcodes in bone and spleen was for the B-, M-, and E-lineage 0.81, 0.69, and 0.7, respectively. Shown are values from several animals (n = 3). For all bar graphs, mean and SD between mice are depicted. Statistical significance tested using Mann–Whitney U-test p=0.05 for (b).
Figure 1—figure supplement 3

Characterization of lineage biases after transplantation of erythropoietin (EPO)-exposed hematopoietic stem and progenitor cells (HSPCs).
(a) Triangle plots from Figure 1e color coded by mice. (b) Quantitative contribution of the classes to each lineage as in Figure 1 using different thresholds of 0, 5, 10, 15, and 20%. (c–f) Data for an additional experiment as in Figure 1. (c) Number of barcodes retrieved in the indicated lineages at week 4 after transplantation in the control and EPO groups. (d) Triangle plots showing the relative abundance of barcodes (circles) in the erythroid (E), myeloid (M), and B-cell (B) lineage with respect to the summed output over the three lineages (size of the circles) for the control and EPO groups. (e) Proportion of HSPCs classified in the indicated lineage bias category using a 10% classification threshold. (f) Quantitative contribution of the classes as in (f) to each lineage. Shown are values from several animals (a–c, n = 5 for the control group and n = 2 for the EPO group [collected over one experiment], d–f, n = 2 for the control group and n = 3 for the EPO group [collected over one experiment]). For all bar graphs, mean and SD between mice are depicted. Statistical significance tested using Mann–Whitney U-test p=0.05 for (c, e).
Figure 1—figure supplement 4
High-output ME- and MB-biased hematopoietic stem and progenitor cells (HSPCs) occur 6 weeks after transplantation of erythropoietin (EPO)-exposed HSPCs.
HSPCs were sorted from the bone marrow of donor mice, lentivirally barcoded, cultured ex vivo with or without 1000 ng/ml EPO for 16 hr, and transplanted into sublethally irradiated mice. At week 6 post-transplantation, the erythroid (E), myeloid (M), and B-cells (B) lineages were sorted from the spleen and processed for barcode analysis. Quantitative contribution of HSPCs classified by the indicated lineage bias using a 10% threshold for categorization to each lineage. Shown are values from several animals (n = 2 EPO, n = 4 control). Mean and SD between mice are depicted.
Figure 2 with 1 supplement
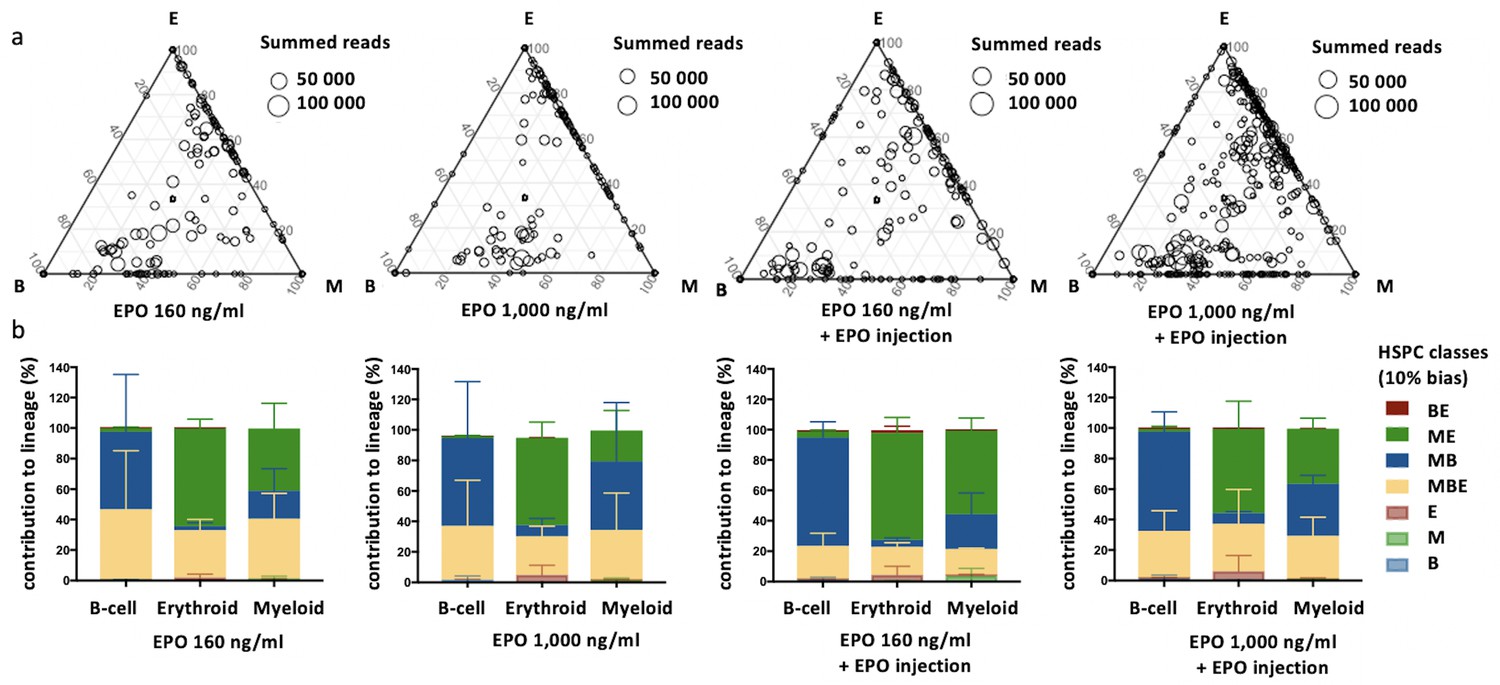
Effect of different erythropoietin (EPO) concentrations on hematopoietic stem and progenitor cell (HSPC) clonality after transplantation.
Same protocol as in Figure 1 but HSPCs were cultured with different concentrations of EPO (160 ng/ml or 1000 ng/ml) for 16 hr, and when indicated a single dose of EPO (133 µg/kg) was injected together with barcoded cells at the moment of transplantation. (a) Triangle plots showing the relative abundance of barcodes (circles) in the erythroid (E), myeloid (M), and B-lymphoid (B) lineage with respect to the summed output over the three lineages (size of the circles) for the different experimental groups as indicated. (b) The percentage of each lineage produced by the barcodes categorized by bias using a 10% threshold. Shown are values from several animals (n = 2 for 160 ng/ml, 1000 ng/ml, and 160 ng/ml + EPO injection, n = 4 for 1000 ng/ml + EPO injection [collected over four different experiments]). For all bar graphs mean and SD between mice are depicted. Statistical significance tested by permutation test for different subsets in (b) (see Table 1).
Figure 2—figure supplement 1

Variability in the effect of different erythropoietin (EPO) concentrations on clonality after hematopoietic stem and progenitor cell (HSPC) transplantation at different timepoints.
(a) Triangle plots showing the relative abundance of barcodes (circles) in the erythroid (E), myeloid (M), and B-cell (B) lineage with respect to the summed output over the three lineages (size of circles) for the control and EPO groups of Figure 2, color coded by mice. (b) Same representation as in (a) for data of Figure 8.
Figure 3 with 1 supplement
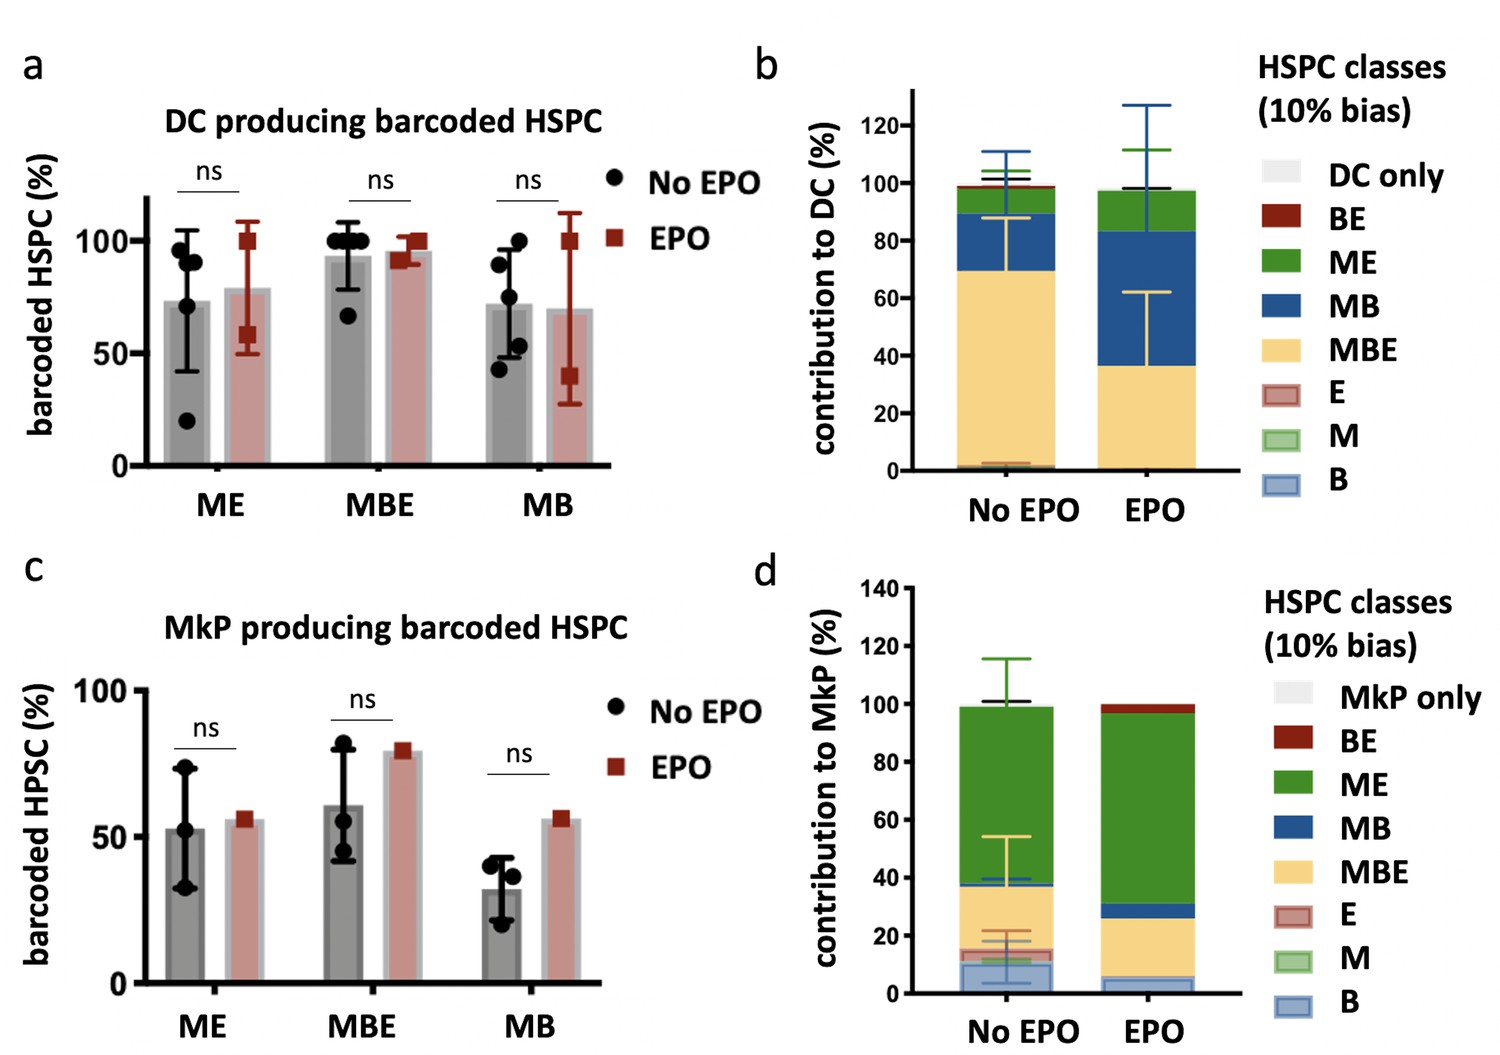
Production of dendritic cells (DCs) and megakaryocyte progenitors (MkP) by hematopoietic stem and progenitor cells (HSPCs) after erythropoietin (EPO) exposure and transplantation.
In addition to the analysis of barcodes in the erythroid (E), the myeloid (M), and the B-cell (B) lineage, the DC lineage in spleen and MkP in bone marrow were added. (a) Percentage of barcoded HSPCs producing DC in the different HSPC categories (classification as in Figure 2 based on the M, E, and B lineage only using a 10% threshold; the DC-only category was added). (b) The percentage of the DC lineage produced by the barcodes categorized by bias as in (a). (c, d) Representations as in (a, b) for barcode detection in MkP. Data is derived from a cohort with detailed myeloid sorting. The myeloid lineage was merged according to the percentage of total donor myeloid each subset contributed as in Figure 2—figure supplement 1a to allow classification as in (a, b) based on the M, E, and B lineage only using a 10% threshold. The MkP-only category was added. Shown are values from several animals (a, b, n = 5 for the control group and n = 2 for the EPO group; c, d, n = 3 for the control group and n = 1 for the EPO group [collected over two experiments]). For all bar graphs, mean and SD between mice are depicted. Statistical significance tested using Mann–Whitney U-test p=0.05 for (a, c). Statistical significance tested by permutation test for different subsets in (b) (see Table 1).
Figure 3—figure supplement 1
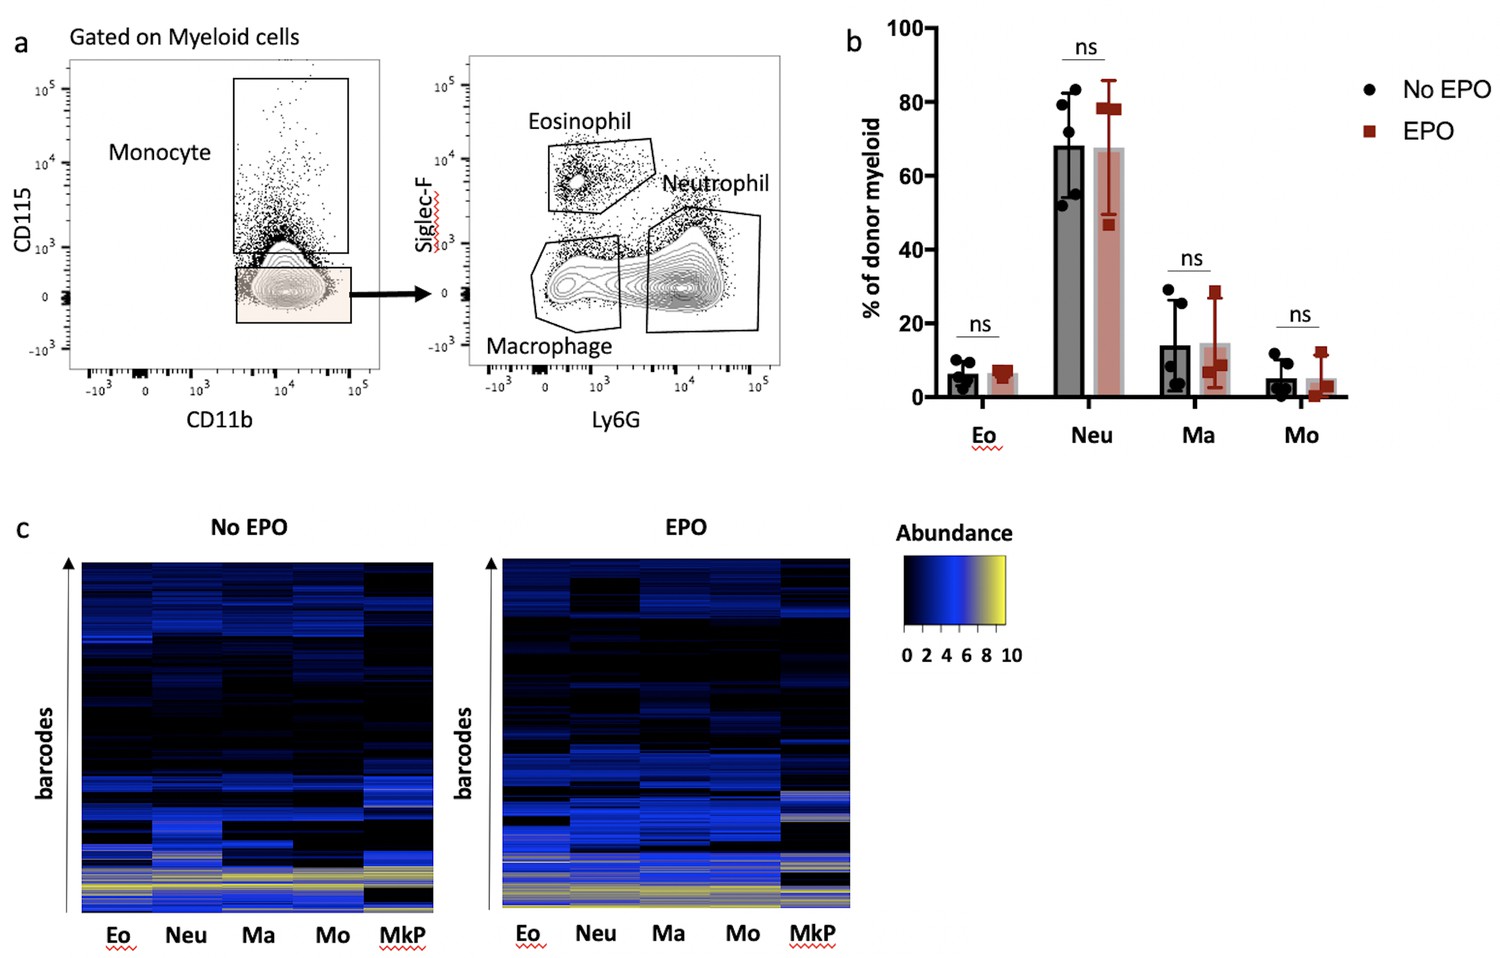
Production of macrophages (Ma), monocytes (Mo), neutrophils (Neu), eosinophils (Eo), and megakaryocyte progenitors (MkP) by hematopoietic stem and progenitor cells (HSPCs) after erythropoietin (EPO) exposure and transplantation.
Same experimental protocol as in Figure 1 but the myeloid cells were subdivided into Mo, Eo, Ma, and Neu, and MkP were sorted. (a) Gating for detailed myeloid subsets on myeloid cells. Mo were sorted as CD115+ cells, Eo as CD115- SiglecF+ Ly6G+, Ma as CD115- SiglecF- Ly6G-, and Neu as CD115- SiglecF- Ly6G+ cells. (b) The contribution of different cell types to the overall donor myeloid subset in the control and EPO groups. (c) Heatmaps showing the output of individual barcodes (rows) in different samples (columns) as indicated. Data is normalized by cell subset, log transformed, and clustered by complete linkage using Euclidean distance. No output is represented in black. Shown are values from several animals (b, n = 5 for the control group and n = 3 for the EPO group, c, n = 3 for the control group and n = 2 for the EPO group [collected over two experiments]). For all bar graphs, mean and SD between mice are depicted. Statistical significance tested using Mann–Whitney U-test p=0.05 for (b).
Figure 4
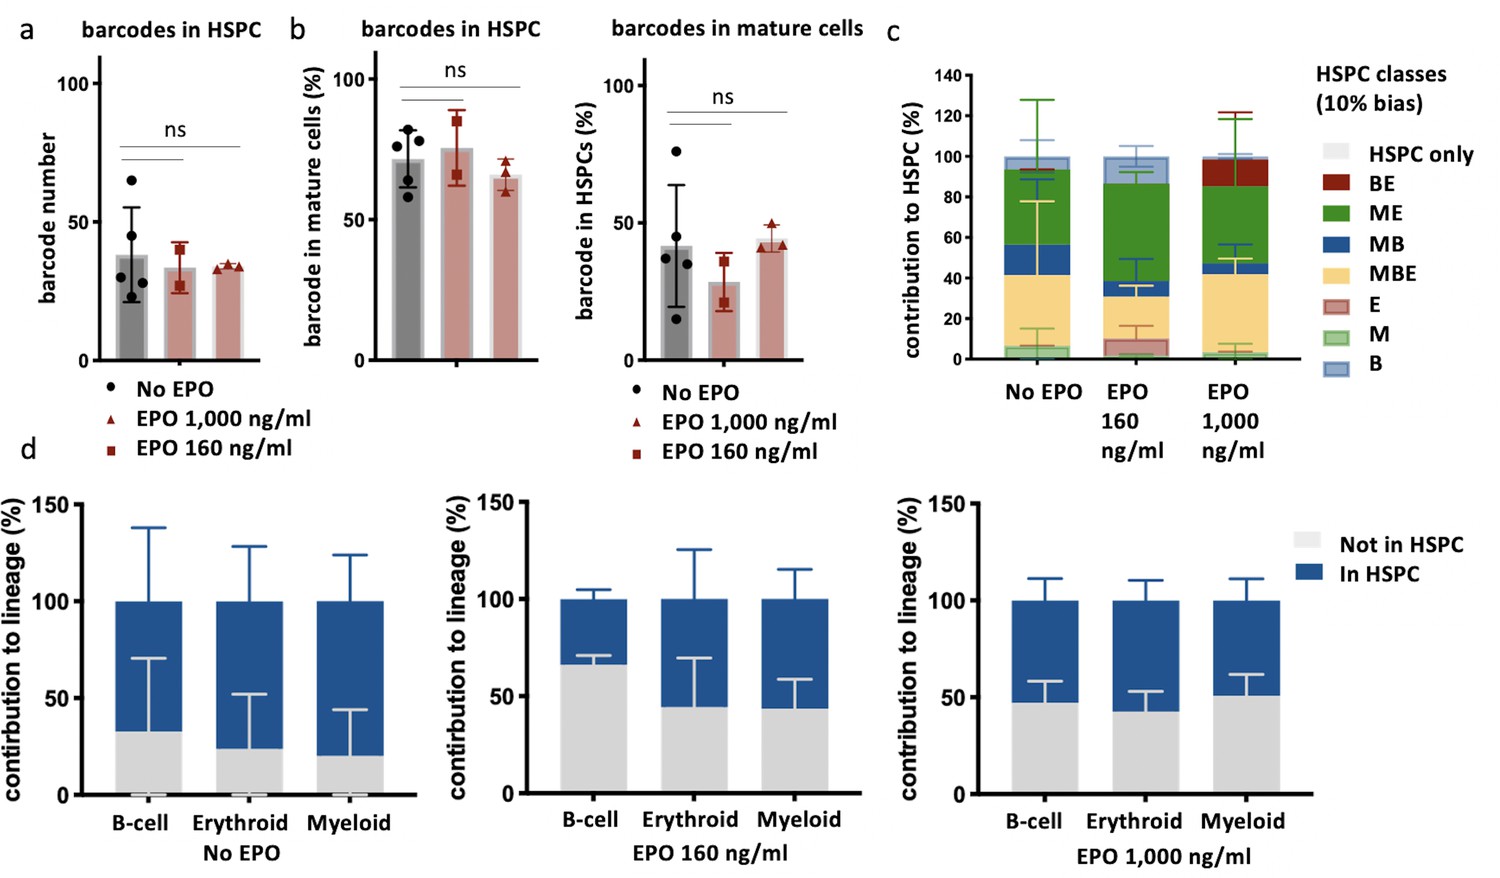
Overlap of barcodes in hematopoietic stem and progenitor cells (HSPCs) and mature cells after transplantation of erythropoietin (EPO)-exposed HSPCs.
Same protocol as in Figure 1 but HSPCs were cultured with two different concentrations of EPO (160 ng/ml or 1000 ng/ml) for 16 hr. In addition, HSPCs were sorted and subjected to barcode analysis. (a) The total number of barcodes found back in HSPCs. (b) The percentage of barcodes in the mature cell subsets also detected in HSPCs and the percentage of barcodes in HSPCs also detected in mature cells. (c) The percentage of the HSPC lineage contributed by barcodes categorized by bias as in Figure 2 based on the myeloid (M), erythroid (E), and B-cells (B) lineage using a 10% threshold. (d) The percentage of each lineage produced by the barcodes color coded for presence (blue) and absence (gray) in HSPCs. Shown are values from several animals (n = 5 for the control group, n = 2 for the EPO 160 ng/ml group and n = 3 for the EPO 1000 ng/ml group). For all bar graphs, mean and SD between mice are depicted. Statistical significance tested using Mann–Whitney U-test p=0.05 for (a, b). Statistical significance tested by permutation test for different subsets in (d) (see Table 1).
Figure 5 with 2 supplements
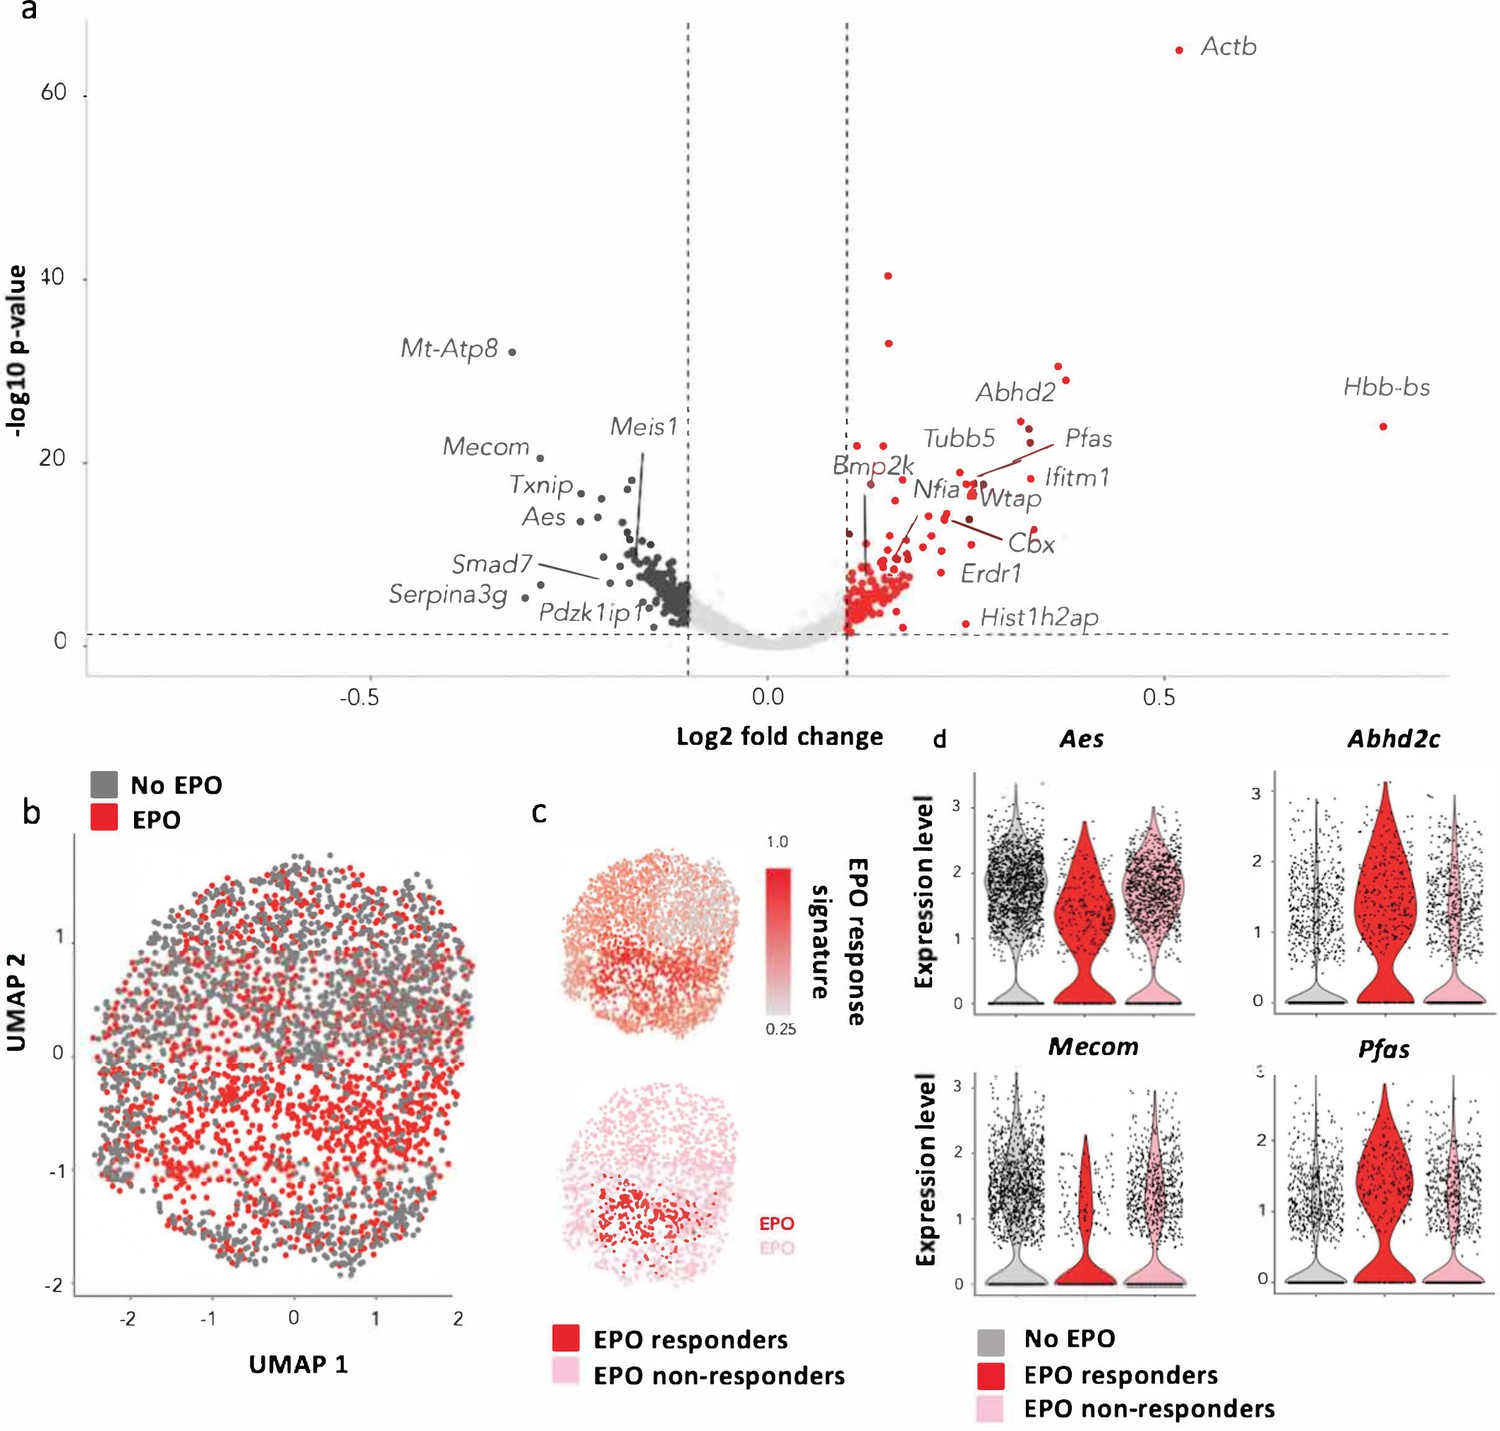
Characterization of erythropoietin (EPO)-exposed hematopoietic stem and progenitor cells (HSPCs) by single-cell RNA sequencing (scRNAseq).
HSPCs were sorted, barcoded, and cultured ex vivo with or without 1000 ng/ml EPO for 16 hr and analyzed by scRNAseq using the 10X Genomics platform. 1706 cells from control and 1595 cells from the EPO group passed quality control. (a) Volcano plot of log2 fold change of the differentially expressed genes between control and EPO-exposed cells versus the adjusted p-value. Genes of interest are annotated. Differentially expressed genes were used to define an EPO response signature. (b) UMAP visualization of the EPO-exposed and control HSPCs. (c) The level of expression in the EPO-exposed HSPCs of the genes in the EPO response signature (top), and definition of the EPO responder and nonresponder subgroups using the 90th percentile expression of the EPO response signature from (c) (bottom). (d) The expression of the indicated genes in the control, EPO responder, and nonresponder subgroups as defined in (c). Genes that are significantly upregulated in the EPO responder group when compared to the control and nonresponder groups. Differential expression was assessed using a logistic regression testing approach, as implemented in Seurat. Figure supplements correspond to one 10× experiment of a pool of eight mice.
Figure 5—figure supplement 1

Single-cell RNA sequencing (scRNAseq) analysis of control and erythropoietin (EPO)-exposed hematopoietic stem and progenitor cells (HSPCs).
(a) UMAP projection of the scRNAseq dataset from Dahlin et al., 2018 annotated with flt3, CD150, and gata1 gene expression. (b) Projecting of erythroid-biased progenitors from Tusi et al., 2018 on UMAP projection of (a). (c) Robustness of the UMAP visualization and unsupervised clustering of the data in Figure 4c.The amount of variance explained by each principle component (left) and UMAP-based visualization using 10 principal component analysis (PCA) (right) for different number of genes. (d) The expression of genes encoding known EPO receptors in each subgroup. (e) Overview of the reference map using supervised cell-type annotation of the dataset from Dahlin et al., 2018. On the right-hand side, we overlay the MPP4 signature defined by Pietras et al., 2015 onto our reference map to facilitate cell-type annotation. (f) HSPCs were sorted, barcoded, and cultured ex vivo with or without 1000 ng/ml EPO for 16 hr and analyzed by scRNAseq using the 10X Genomics platform. Mapping of the transcriptomes of the 1706 cells from control and 1595 cells from the EPO group obtained after quality control onto the reference map using a k-nearest-neighbors mapping approach.
Figure 5—figure supplement 2

Unsupervised clustering of control and erythropoietin (EPO)-exposed hematopoietic stem and progenitor cells (HSPCs).
(a) Cluster stability analysis varying the resolution parameter of the Seurat clustering method. The significant variable genes using 10 principal component analysis (PCA) were used as input. (b) UMAP visualization of the data in (a) using a clustering resolution of 0.1, with the proportion of each cluster as in the control, EPO responder, and nonresponder subgroups. (c) Expression of published signatures of established cell types used to annotate our clusters. All comparisons in signature expression between clusters were statistically significant (adjusted p-value<0.05) as determined by a Kruskal–Wallis test and Dunn’s post-hoc analysis. (d) Nearest-neighbor mapping of unsupervised clusters from (b) onto the reference map.
Figure 6
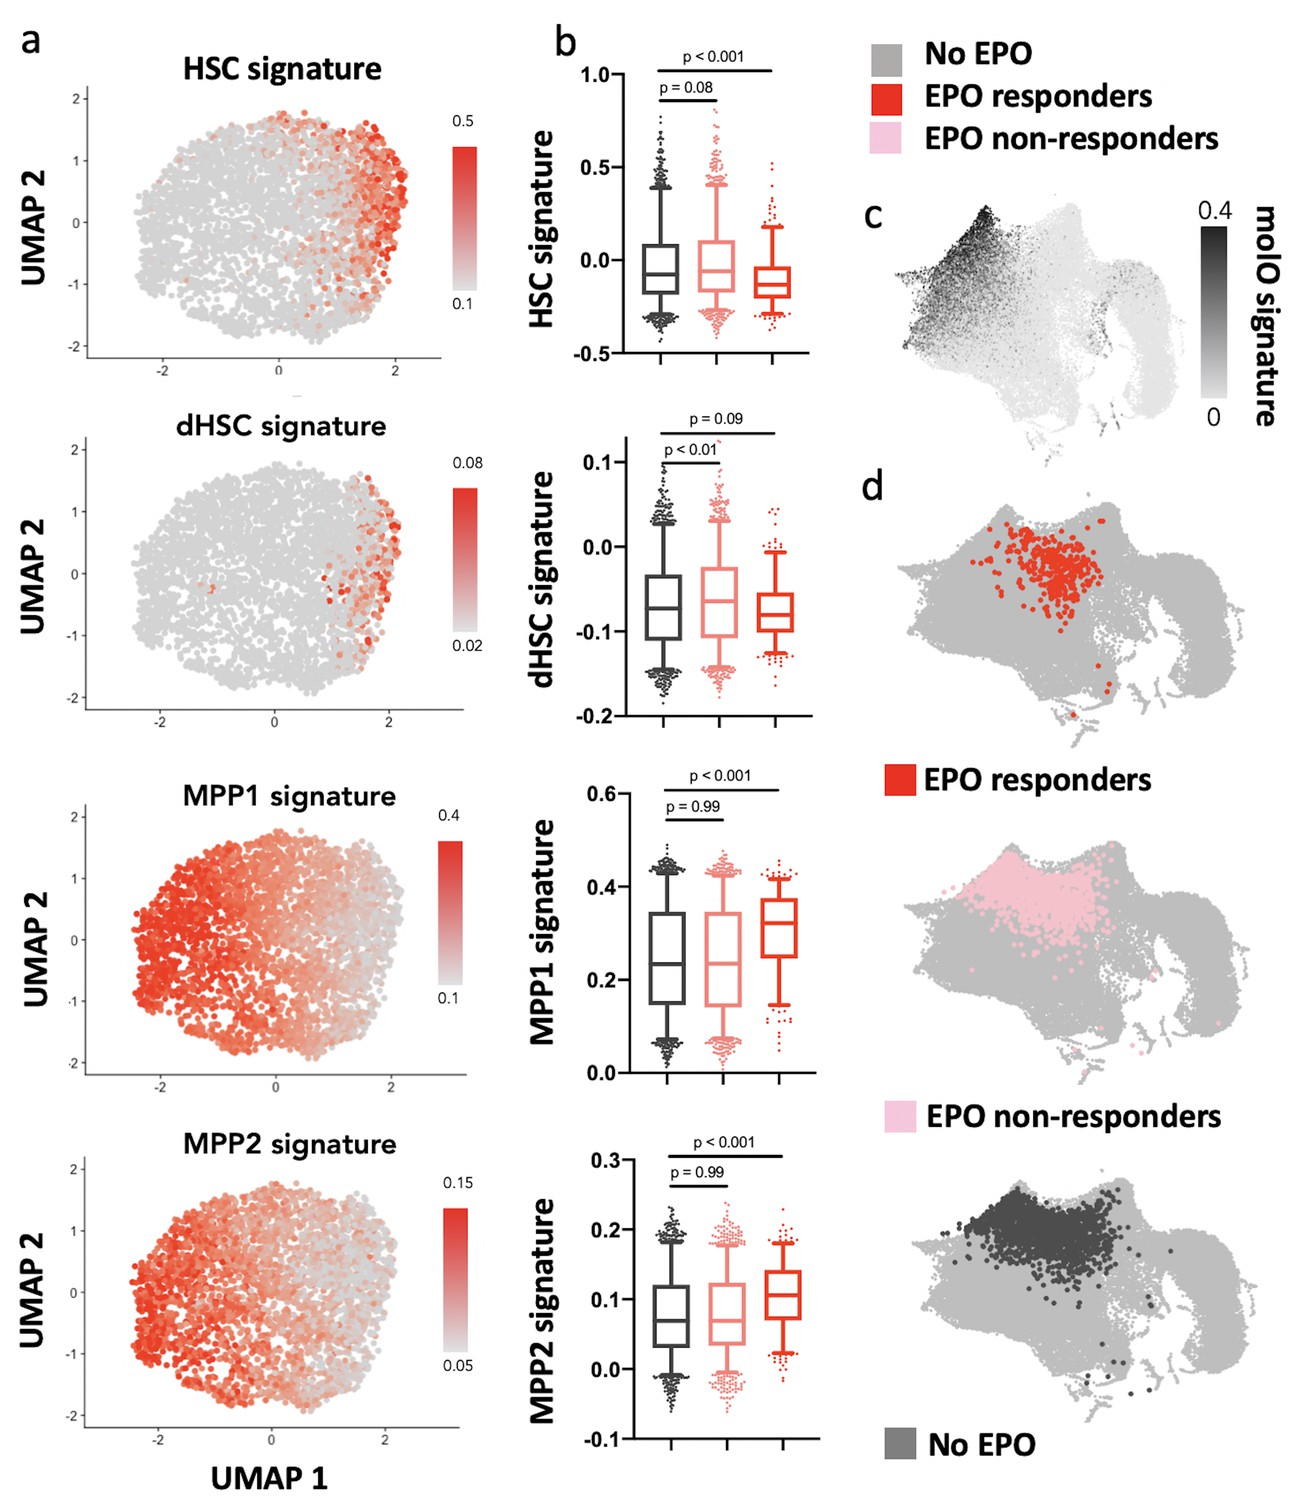
Erythropoietin (EPO) responders are multipotent progenitors, not hematopoietic stem cells (HSCs).
Same protocol as in Figure 5. (a) Expression of published gene signatures of HSCs (dormant HSC [Cabezas-Wallscheid et al., 2017], molecular overlap [molO] HSC signature [Wilson et al., 2015]) and multipotent progenitors (MPPs) (MPP1 [Cabezas-Wallscheid et al., 2017]-2 [Pietras et al., 2015]) across the entire dataset (see Materials and methods). (b) Expression of the signatures from (a), across control, nonresponder, and EPO responder groups as defined in Figure 5c. Statistical comparisons made using a Kruskal–Wallis test with a Dunn’s multiple comparisons post-hoc test. (c) Expression of the molO HSC signature on the published reference map (Dahlin et al., 2018). (d) Nearest-neighbor mapping of control, EPO responder, and nonresponder cells onto the published reference map (Dahlin et al., 2018).
Figure 7 with 1 supplement
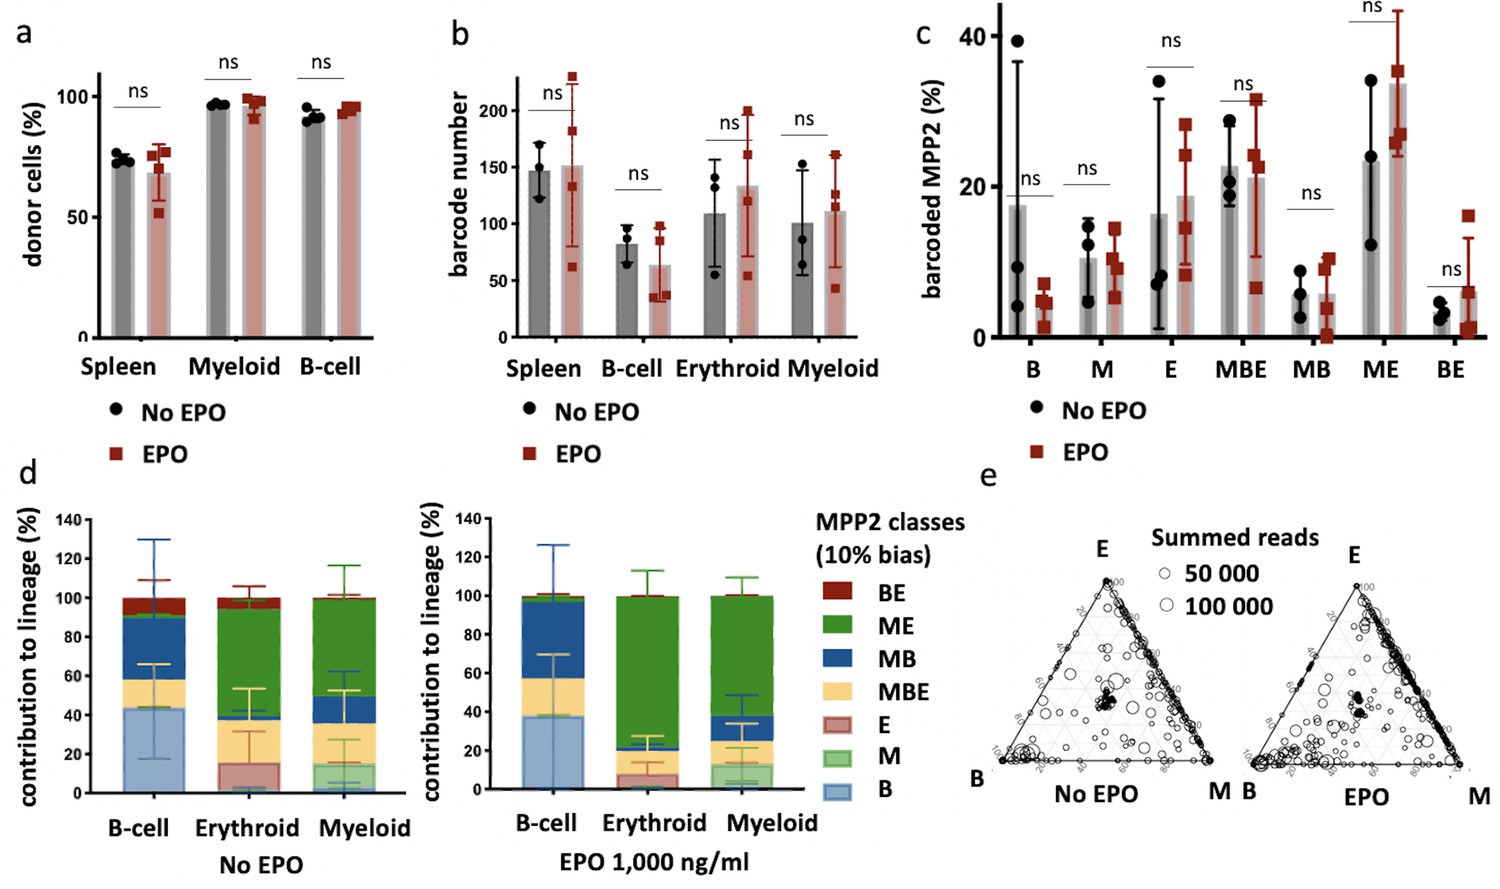
Multipotent progenitor 2 (MPP2) are enriched for ME-biased clones after erythropoietin (EPO) exposure and transplantation.
MPP2 and CD48- hematopoietic stem and progenitor cells (HSPCs) were sorted from the bone marrow of donor mice, MPP2 were lentivirally barcoded, and both populations cultured ex vivo with or without 1000 ng/ml EPO for 16 hr. After the culture, barcoded MPP2 and unbarcoded CD48- HSPCs were mixed and transplanted into sublethally irradiated mice. At week 4 post-transplantation, the erythroid (E), myeloid (M), and B-cells (B) lineages were sorted from the spleen and processed for barcode analysis. (a) The fraction of donor cells among the indicated cell types in spleen. (b) Barcode number retrieved in the indicated lineage at 4 weeks after transplantation in the control and EPO 1000 ng/ml groups. (c) Percentage of MPP2s classified using a threshold of 10% in the experimental groups as indicated. (d) The percentage of each lineage produced by the MPP2 barcodes categorized by bias using a 10% threshold. (e) Triangle plots showing the relative abundance of barcodes (circles) in the erythroid (E), myeloid (M), and B-lymphoid (B) lineage with respect to the summed output over the three lineages (size of the circles). Shown are data from several mice (n = 3 for the control group and n = 4 for the EPO group). For all bar graphs, mean and SD between mice are depicted. Statistical significance tested using Mann–Whitney U-test p=0,05 for (c–e). Statistical significance tested by permutation test for different subsets in (a) (see Table 1).
Figure 7—figure supplement 1
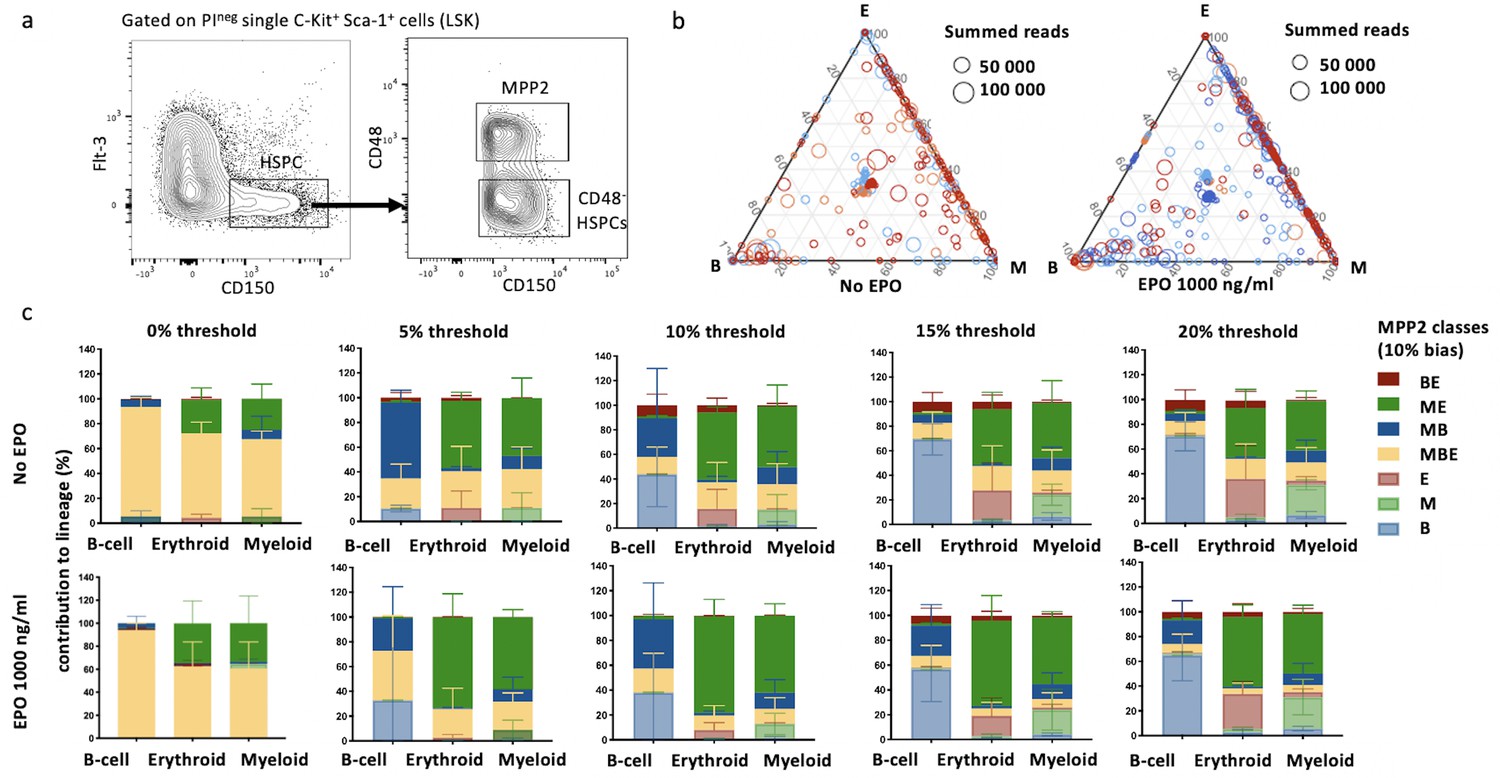
Characterization of lineage biases after transplantation of erythropoietin (EPO)-exposed multipotent progenitor 2 (MPP2).
(a) MPP2s and CD48- hematopoietic stem and progenitor cells (HSPCs) were gated as propidium iodide-negative single C-Kit+ Sca-1+ Flt3- CD150+ CD48+ (MPP2) and CD48- (CD48- HSPCs) cells of C-Kit+-enriched bone marrow cells. (b) Triangle plots from Figure 7b color coded by mice. (c) Quantitative contribution of the classes to each lineage as in Figure 7a using different thresholds of 0, 5, 10, 15, and 20% (a–c, n = 5 for the control group and n = 2 for the EPO group [collected over one experiment]). Shown are values from several animals (n = 3 for the control group, n = 4 for the EPO group (collected over one experiment)). For all bar graphs, mean and SD between mice are depicted.
Figure 8
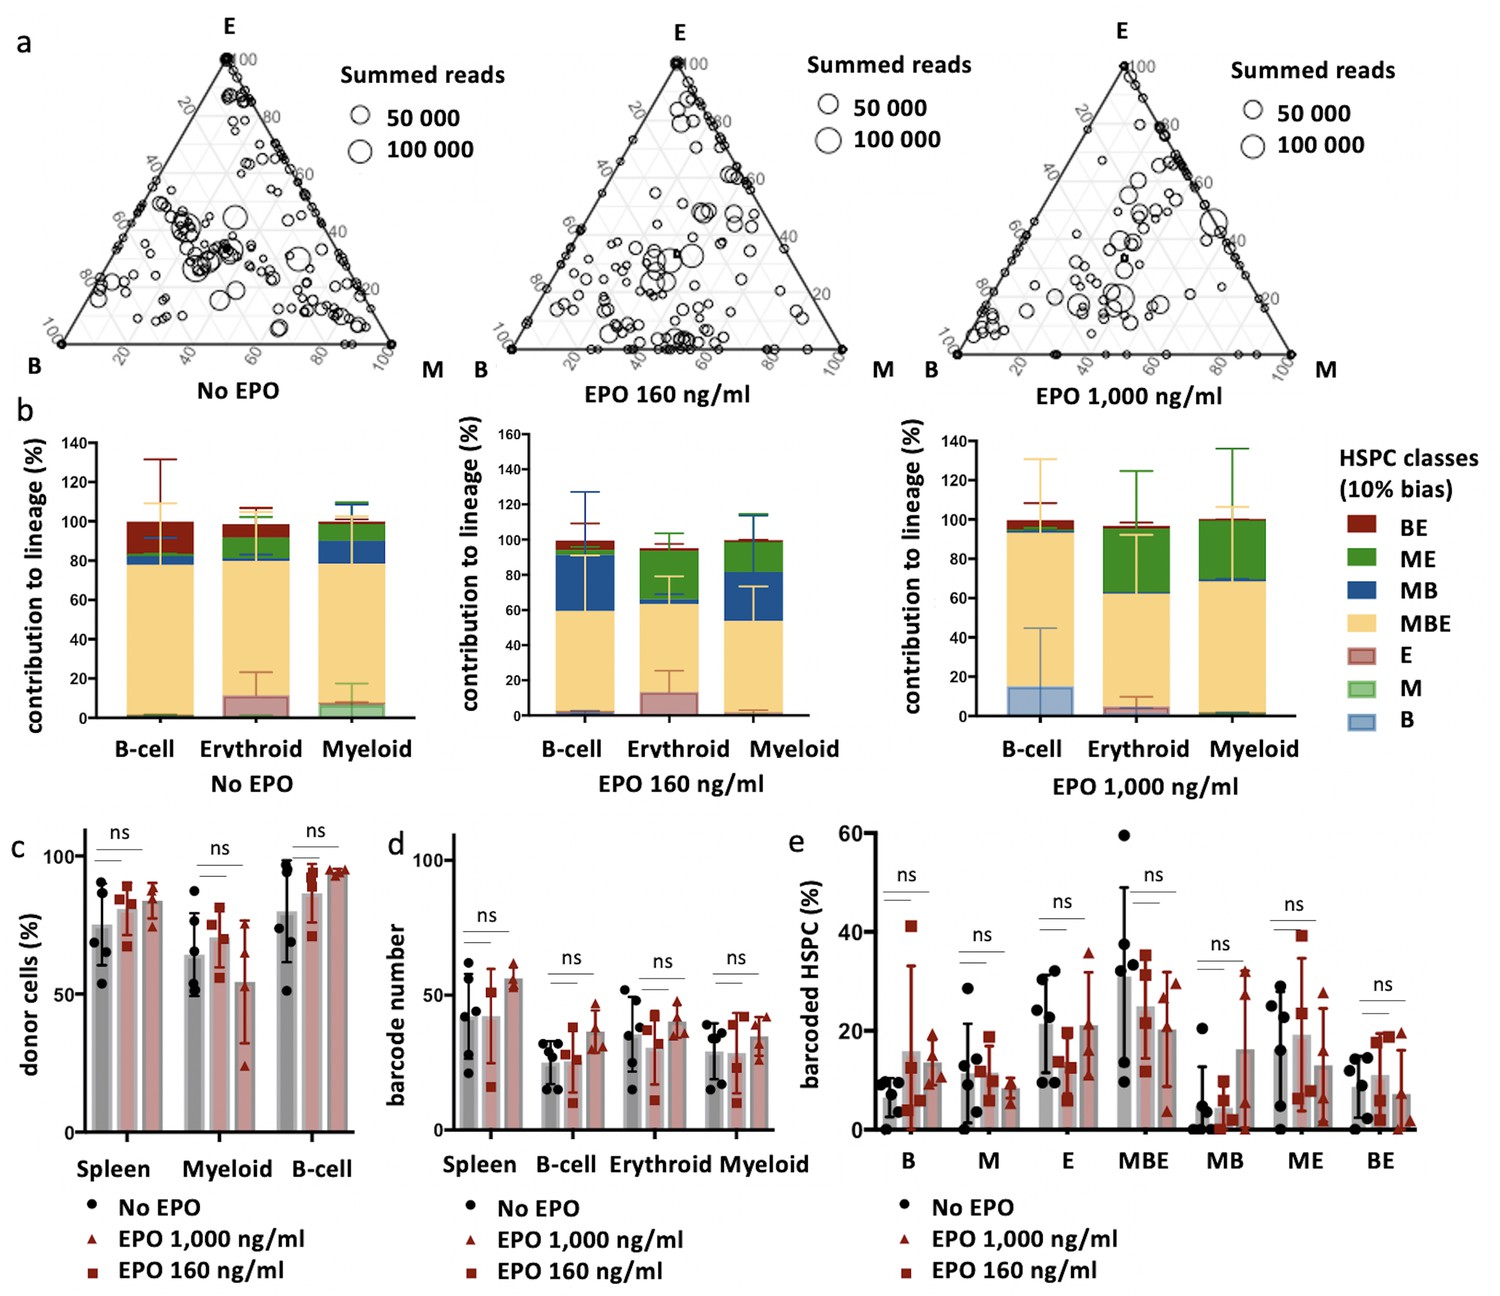
The effect of erythropoietin (EPO) on hematopoietic stem and progenitor cell (HSPC) clonality after transplantation is transient.
Same protocol as in Figure 1, but barcodes in the erythroid (E), myeloid (M), and B-cell (B) lineage in spleen of individual mice sacrificed at month 4 post-transplantation were analyzed. (a) Triangle plots showing the relative abundance of barcodes (circles) in the E, M, and B lineage with respect to the summed output over the three lineages (size of the circles) for the different experimental groups as indicated. (b) The percentage of each lineage produced by the barcodes categorized by bias using a 10% threshold. (c) The fraction of donor cells among the indicated cell types in spleen. (d) Barcode number retrieved in the indicated lineage at month 4 after transplantation in the control, EPO 160 ng/ml, and the EPO 1000 ng/ml group. (e) Percentage of HSPCs classified using a threshold of 10% in the experimental groups as indicated. Shown are data from several mice (c, n = 5 for the control group and n = 4 for each EPO group, a, b, d, e ,n = 6 for the control group and n = 4 for each EPO group [collected over two experiments]). For all bar graphs, mean and SD between mice are depicted. Statistical significance tested using Mann–Whitney U-test p=0.05 for (c–e). Statistical significance tested by permutation test for different subsets in (b) (see Table 1).
Tables
Table 1
Permutation testing of changes in clonality after transplantation of erythropoietin (EPO)-exposed hematopoietic stem and progenitor cells (HSPCs).
Same data as in Figures 1—4,7. HSPCs or multipotent progenitor 2 (MPP2) were cultured with different concentrations of EPO (160 ng/ml or 1000 ng/ml) for 16 hr, and when indicated a soluble dose of EPO (133 µg/kg) was injected together with barcoded HSPCs at the moment of transplantation. Barcodes in the erythroid (E), myeloid (M), B-lymphoid (B) lineage, dendritic cell (DC), and HSPCs were analyzed 4 weeks after transplantation and categorized by bias using a 10% threshold. For the data of Figures 1, 2 and 7, the output of MB and ME classified barcodes to the B, M, and E lineages was analyzed using a permutation test. For the data of Figure 3, the output of MBE and MB classified barcodes to the DC lineage was analyzed. For the data of Figure 4, the output of barcodes present in HSPCs to the B, M, and E lineages was analyzed using a permutation test. By permutating the mice of the control and EPO groups, the random distribution of this output was generated and compared to the real output difference between the control and EPO groups. A p-value was generated as in Tak et al., 2019.
| Figure | Condition | p-Value | |||
|---|---|---|---|---|---|
| MB in B | MB in M | ME in E | ME in M | ||
| Figure 1 | HSPCs 160 ng/ml | 0.02 | 0.04 | 0.02 | 0.04 |
| Figures 1 and 2 | HSPCs 1000 ng/ml | 0.0075 | 0.0071 | 0.0071 | 0.012 |
| Figure 2 | HSPCs 160 ng/ml + inj. | 0.01 | 0.016 | 0.012 | 0.011 |
| Figure 2 | HSPCs 1000 ng/ml + inj. | 0.0018 | 0.0018 | 0.002 | 0.0025 |
| Figure 7 | MPP2 1000 ng/ml | 0.006 | 0.008 | 0.004 | 0.004 |
| MBE in DC | MB in DC | ||||
| Figure 3 | HSPCs 1000 ng/ml | 0.07 | 0.0075 | ||
| HSPC in B | HSPC in M | HSPC in E | |||
| Figure 4 | HSPCs 160 ng/ml | 0.035 | 0.029 | 0.029 | |
| HSPCs 1000 ng/ml | 0.008 | 0.06 | 0.01 | ||
| ME in E | ME in M | ||||
| Figure 8 | HSPCs 160 ng/ml | 0.016 | 0.0025 | ||
| HSPCs 1000 ng/ml | 0.00625 | 0.0038 | |||
Key resources table
| Reagent type (species) or resource | Designation | Source or reference | Identifiers | Additional information |
|---|---|---|---|---|
| Strain, strain background (Mus musculus) | C57BL/6J CD45.1+ | Jackson Laboratory | B6.SJL-Ptprca Pepcb/BoyJ, Stock# 002014, B6 Cd45.1 | Male |
| Strain, strain background( M. musculus) | C57BL/6J CD45.2+ | Jackson Laboratory | C57BL/6J, Stock# 000664, B6 | Male |
| Strain, strain background (M. musculus) | Rosa26CreERT2;mT/mG | Jackson Laboratory | STOCK Gt(ROSA)26Sortm4(ACTB-tdTomato,-EGFP)Luo/J, Stock# 007576, mT/mG, mTmG | Male |
| Strain, strain background (Escherichia coli) | ElectroMAX Stbl4 Competent Cells | Thermo Fisher Scientific | Cat# 11635018 | |
| Recombinant DNA reagent | pRRL-CMV-GFP plasmid (Dull et al., 1998) | PMID:9765382 | Ton Schumacher lab, NKI, Amsterdam | |
| Cell line (human) | HEK293T cells | Other | Philippe Benaroch lab, Institute Curie, Paris | |
| Recombinant DNA reagent | p8.9-QV | Other | Philippe Benaroch lab, Institute Curie, Paris | |
| Recombinant DNA reagent | pVSVG | Other | Philippe Benaroch lab, Institute Curie, Paris | |
| Chemical compound, drug | Anti-CD117 magnetic beads | Miltenyi | Cat# 130-091-224; RRID:AB_2753213 | |
| Chemical compound, drug | Propidium iodide | Sigma | Cat# 81845 | |
| Chemical compound, drug | StemSpanMedium SFEM | STEMCELL Technologies | Cat# 9650 | |
| Chemical compound, drug | Mouse recombinant SCF | STEMCELL Technologies | Cat# 78064.2 | |
| Chemical compound, drug | Eprex, erythropoietin alpha | Janssen | ||
| Chemical compound, drug | Anti-biotinylated beads | Miltenyi | Cat# 130090485; RRID:AB_244365 | |
| Antibody | Anti-Ter119-biotin (rat, monoclonal) | BD Biosciences | Cat# 553672, clone TER119; RRID:AB_394985 | (1:100) |
| Antibody | Anti-cd45.1-PE (mouse, monoclonal) | BD Biosciences | Cat# 553776, clone A20; RRID:AB_395044 | (1:100) |
| Antibody | Anti-Ter119-PE-Cy7 (rat, monoclonal) | BD Biosciences | Cat# 557853, clone TER119; RRID:AB_396898 | (1:100) |
| Antibody | Anti-cd11c-APC (hamster, monoclonal) | eBioscience | Cat# 17-0114-82, clone N418; RRID:AB_469346 | (1:100) |
| Antibody | Anti-cd19-APC-Cy7 (rat, monoclonal) | BD Biosciences | Cat# 557655, clone ID3; RRID:AB_396770 | (1:100) |
| Antibody | Anti-cd11b-PerCP-Cy5.5 (rat, monoclonal) | eBioscience | Cat# 45-0112-82, clone M1/70; RRID:AB_953558 | (1:100) |
| Antibody | Anti-cd117-APC (rat, monoclonal) | BioLegend | Cat# 105812, clone 2B8; RRID:AB_313221 | (1:100) |
| Antibody | Anti-cd135-PE (rat, monoclonal) | eBioscience | Cat# 12 135182, clone A2F10; RRID:AB_465859 | (100) |
| Antibody | Anti-cd135-PE-Cy5 (rat, monoclonal) | Life Technologies | Cat# 15_1351_82, clone A2F10; RRID:AB_494219 | (1:100) |
| Antibody | Anti-Sca1-PacificBlue (rat, monoclonal) | BioLegend | Cat# 122520, clone D7; RRID:AB_2143237 | (1:200) |
| Antibody | Anti-cd150-PE-Cy7 (rat, monoclonal) | BioLegend | Cat# 115914, clone TC15-12F12.2; RRID:AB_439797 | (1:100) |
| Antibody | Anti-cd44-PE (rat, monoclonal) | BD Biosciences | Cat# 553134, clone IM7; RRID:AB_394649 | (100) |
| Antibody | Anti-cd41-BV510 (rat, monoclonal) | BD Biosciences | Cat# 740136, clone MVVREG30; RRID:AB_2739892 | (1:100) |
| Antibody | Anti-Siglec-F-PE-CF594 (rat, monoclonal) | BD Biosciences | Cat# 562757, clone E50-2440; RRID:AB_2687994 | (1:200) |
| Antibody | Anti-Ly6g-BV510 (rat, monoclonal) | BioLegend | Cat# 127633. clone 1A8; RRID:AB_2562937 | (1:200) |
| Antibody | Anti-cd115-PE (rat, monoclonal) | BioLegend | Cat# 135505, clone AFS98; RRID:AB_1937254 | (1:200) |
| Antibody | Anti-cd48- APC-Cy7 (hamster, monoclonal) | BD Biosciences | Cat# 561242clone HM48-1; RRID:AB_10644381 | (1:100) |
| Chemical compound, drug | Viagen Direct PCR Lysis Reagent (cell) | Euromedex | Cat# 301C | |
| Chemical compound, drug | Proteinase K Solution RNA grade | Invitrogen | Cat# 25530-049 | |
| Sequence-based reagent | top-LIB | This paper | PCR primer | TGCTGCCGTCAACTAGA ACA |
| Sequence-based reagent | bot-LIB | This paper | PCR primer | GATCTCGAATCAGGCGCTTA |
| Sequence-based reagent | PCR2-Read1-plate-index-forward | This paper | PCR primer | ACACTCTTTCCCTACACGACGCTCTTCCGAT CTNNNNCTAGAACACTCGAGATCAG |
| Sequence-based reagent | PCR2-Read2-reverse | This paper | PCR primer | GTGACTGGAGTTCAGACGTGTGCTCTTCCGAT CGATCTCGAATCAGGCGCTTA |
| Sequence-based reagent | PCR3-P5-forward | This paper | PCR primer | AATGATA CGGCGACCACCGAGATCTACACTCTTTCCC TACACGACGCTCTTCCGATCT |
| Sequence-based reagent | PCR3-P7-sample-index-reverse | This paper | PCR primer | CAAGCAGAAGACGGCATACGAGANNNNNNN GTGACTGGAGTTCAGA CGTGCTCTTCCGATC |
| Commercial assay or kit | Agencourt AMPure XP system | Beckman Coulter | Cat# A63881 | |
| Commercial assay or kit | Chromium Single Cell 3′ Reagent Kits v2 Chemistry | 10X Genomics | ||
| Software, algorithm | R-3.4.0 | Other | R Development Core Team (2019) http://www.R-project.org | |
| Software, algorithm | GraphPad Prism version 8.0 for Mac | GraphPad | RRID:SCR_002798 | GraphPad Software, La Jolla, CA, https://www.graphpad.com |
| Software, algorithm | XCALIBR | Other | https://github.com/NKI-GCF/xcalibr; Netherlands Cancer Institute - Genomics Core Facilty, 2015 | |
| Software, algorithm | Cellranger v3 | 10X Genomics | RRID:SCR_017344 | |
| Software, algorithm | Seurat v3 | doi:10.1016/j.cell.2019.05.031 | RRID:SCR_007322 |
Author response table 1
| Reference | in vitro EPO dose | in vivo EPO dose (route, duration ) |
|---|---|---|
| Eisele et al., | 160-1000ng/ml | 133 ug/kg (1 single injection) |
| Grover et al., 2014 | 200ng/ml | 1µg/ml (plasma level, continous) |
| Giladi et al., 2018 | 83 ug/kg (injection/day, for 2 days) | |
| Shiozawa et al., 2010 | 50ug/kg (3 injection/week, for 28 days) | |
| Tusi et al., 2018 | 33 ug/kg (injection/day, for 2 days) |
Additional files
-
Supplementary file 1
Permutation testing of changes in clonality after transplantation of erythropoietin (EPO)-exposed hematopoietic stem and progenitor cells (HSPCs).
Same data as in Figure 1—figure supplement 4 and Figure 1—figure supplement 3. HSPCs were cultured with EPO (1000 ng/ml) for 16 hr. Barcodes in the erythroid (E), myeloid (M), B-lymphoid (B) lineage, dendritic cell (DC), and HSPCs were analyzed 4 weeks after transplantation and categorized by bias using a 10% threshold. The output of MB and ME classified barcodes to the B, M, and E lineages was analyzed using a permutation test. By permutating the mice of the control and EPO groups, the random distribution of this output was generated and compared to the real output difference between the control and EPO group. A p-value was generated by permutation testing.
- https://cdn.elifesciences.org/articles/66922/elife-66922-supp1-v2.docx
-
Transparent reporting form
- https://cdn.elifesciences.org/articles/66922/elife-66922-transrepform1-v2.pdf
Download links
A two-part list of links to download the article, or parts of the article, in various formats.
Downloads (link to download the article as PDF)
Open citations (links to open the citations from this article in various online reference manager services)
Cite this article (links to download the citations from this article in formats compatible with various reference manager tools)
Erythropoietin directly remodels the clonal composition of murine hematopoietic multipotent progenitor cells
eLife 11:e66922.
https://doi.org/10.7554/eLife.66922


