Emergence of a smooth interface from growth of a dendritic network against a mechanosensitive contractile material
- Department of Cell and Systems Biology, University of Toronto, Canada
Figures
Figure 1

Individual simulations of actomyosin and Arp2/3 networks.
(A) Schematics show major aspects of the node-based actomyosin network: (top) the connections randomly made by one node within a search radius, (middle) the actomyosin and elastic forces along node-node connections, (bottom) the organization of nodes and connections mimicking a broad cortical network with a small thickness. (B–E) Within a large circle of nodes with only elastic connections (blue), node-based contractility is additionally induced in specific patterns (white). Twofold magnifications of the central region show the shape changes of the activated regions over indicated simulation steps (bottom right of each panel). Red squares provide references to detect the shape changes in C-E. In each case, similar results were observed for five simulations with distinct starting conditions. (F) Schematics show major aspects of the node-based Arp2/3 network, focusing on (1) the displacement of one plus end node from a nucleation point (minus end), (2) branching from this connection, (3) halting of the plus end node displacement, and (4) deletion of the plus end node. (G) Growth of plus end nodes (yellow) from a central patch of nucleation points over indicated simulation steps. Bottom right quadrants show the original simulation images and visualization of the other quadrants was enhanced by Gaussian blurring and a brightness and contrast adjustment. (H) The setup and visualization is the same as (G) except a circular wall was in place until simulation step 3000 (the position of the wall is shown at simulation step 2). (I) Network area plotted over simulation steps without a wall (black) and with a wall from the start of the simulation to simulation step 3000 (red). Note the similar area growth rate of both cases after simulation step 3000. Means ± SD shown for four simulations with distinct starting conditions.
Figure 2
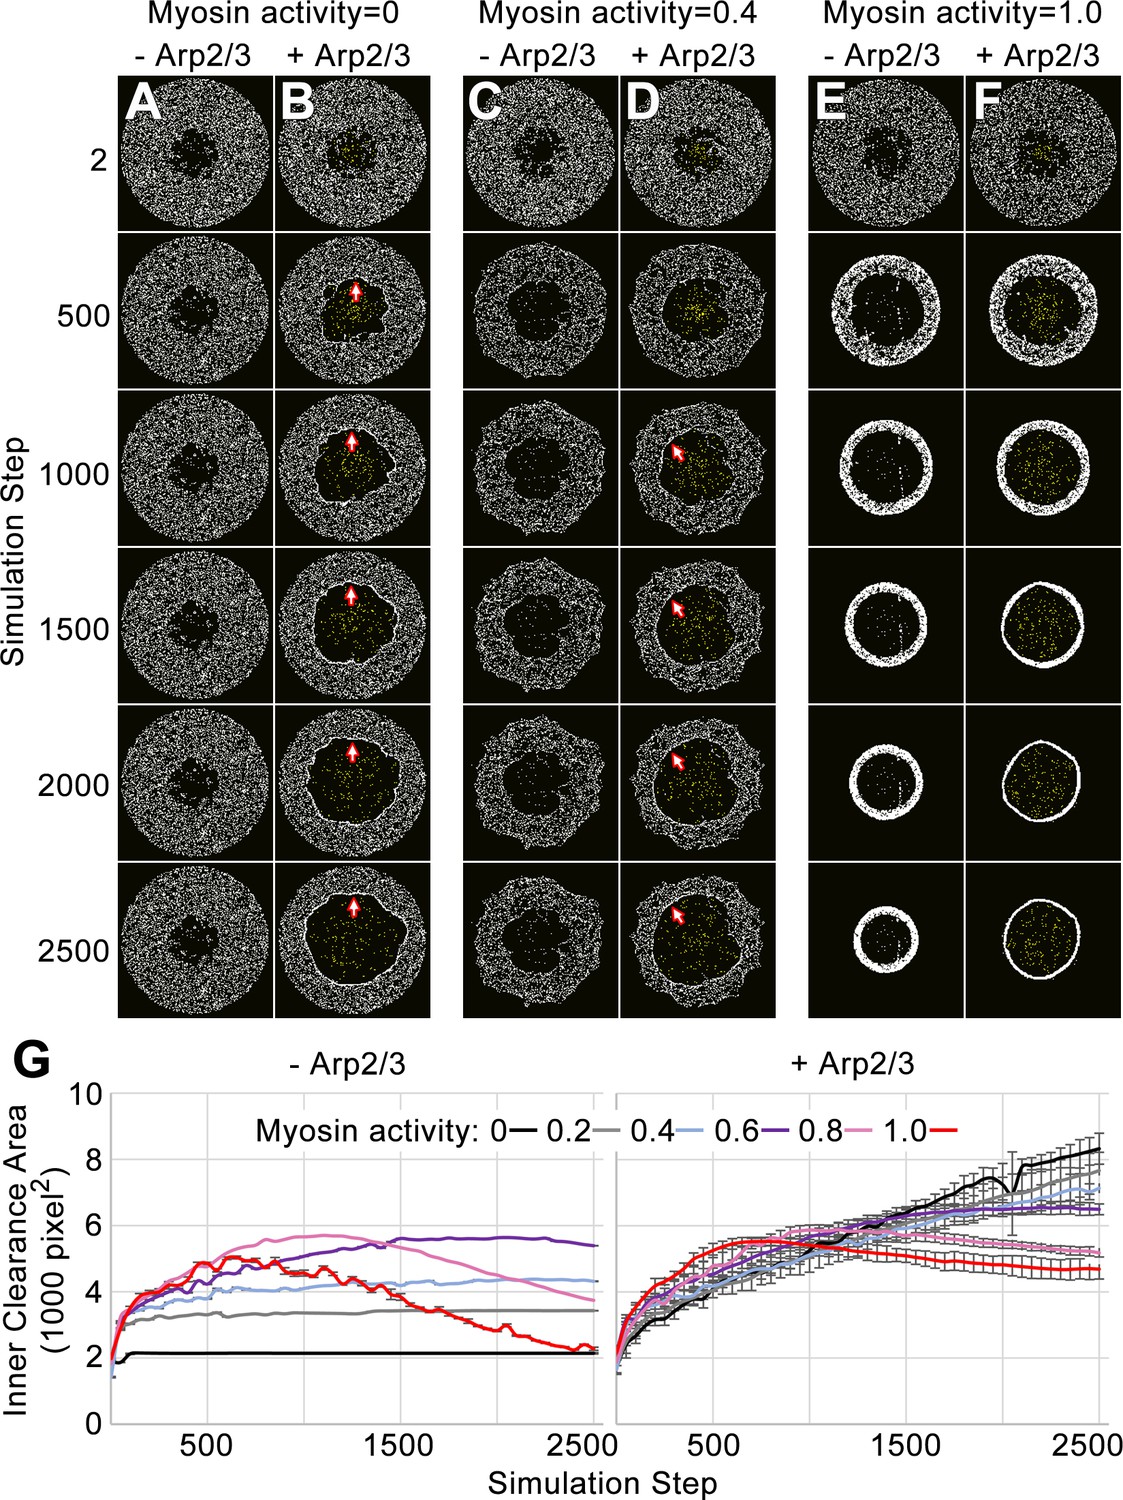
Simulation of the network-network interface allows the networks to displace each other and remain segregated.
(A–F) Actomyosin networks (white) with zero (A–B), moderate (0.4) (C–D), or full (1.0) (E–F) myosin activity. In each case, the initial configuration is a circle with an inner clearance of nodes removed in a rough pattern. Each case is simulated with (B, D, F) or without (A, C, E) an Arp2/3 network grown from a central patch of nucleation points within the inner clearance (Arp2/3 networks shown in yellow). (A) With zero myosin activity, the actomyosin network maintains its shape without an Arp2/3 network. (B) In response to Arp2/3 network growth, the inner area expands and myosin nodes aggregate at the network-network interface (arrows). (E) With full myosin activity (1.0) in the absence of an Arp2/3 network, the thickness of the actomyosin ring first decreases (accompanied by an increase to the inner clearance area and an increased density of myosin nodes in the ring) and then the overall ring constricts (accompanied by a decrease to the inner circle area). (F) With full myosin activity (1.0) in the presence of a growing Arp2/3 network, the actomyosin ring undergoes greater thinning and then the overall constriction of the ring is reduced. (C–D) Simulations of moderately contractile actomyosin networks (0.4 activity) alone or with a growing Arp2/3 network, displayed intermediate behaviors. (G) Quantifications of inner clearance area versus simulation step for actomyosin networks with a range of activities (0–1.0), without Arp2/3 networks (left) or with Arp2/3 networks (right). Means ± SD shown for three simulations with distinct starting conditions. SD values were low without addition of the growing Arp2/3 networks.
Figure 3 with 1 supplement
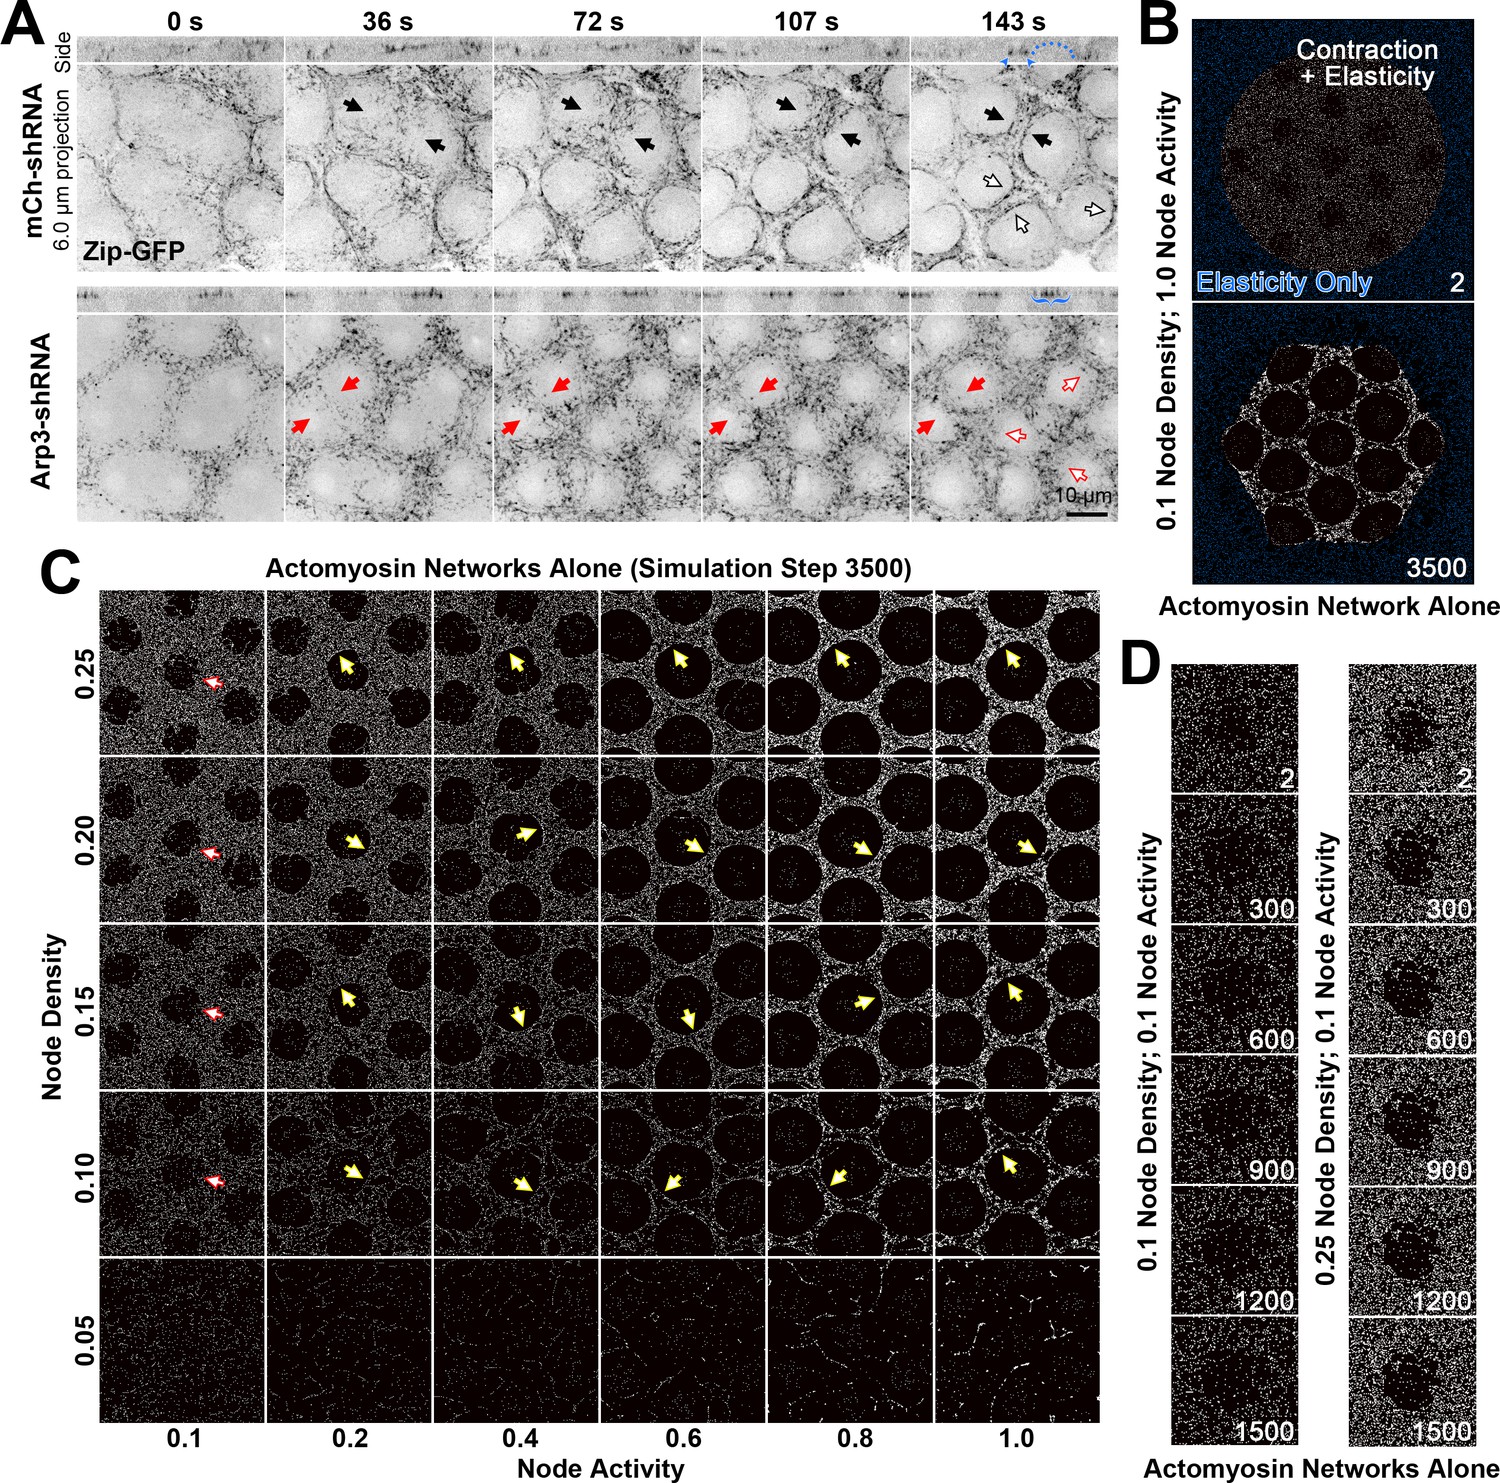
Actomyosin network organization in the absence of Arp2/3 networks in vivo and in silico.
(A) In vivo live imaging of Zip-GFP (myosin) from telophase of cycle 10 to prophase of cycle 11 in control (mCh-shRNA) and Arp3 RNAi (Arp3-shRNA) embryos. In the control embryo, solid black arrows show the rough-to-smooth transitions of myosin network boundaries from 36 s to 143 s. By 143 s, the boundaries display an accumulation of Zip-GFP (solid and hollow black arrows), and doming of the cortex (blue dots) is evident in the side view with myosin accumulations at the base of the dome (blue arrowheads). In the Arp3 RNAi embryo, the boundaries of the myosin network remain rough (red arrows) and fail to accumulate Zip-GFP, which retains a punctate distribution (red solid and hollow arrows). In the side views, the cortex remains flat with broader distributions of Zip-GFP (blue brackets). These observations were made in 15/15 control embryos and 8/9 Arp3 RNAi embryos (additional examples shown in Figure 3—figure supplement 1). (B) An example of the configuration used to simulate the in vivo organization of the actomyosin network. At the start of the simulation, a large circle of myosin nodes with contractility and elasticity (white) is surrounded by a square boundary of myosin nodes with only elasticity (blue). Within the large contractile circle, 13 roughed-edged clearances were laid out at the beginning of the simulation. Simulation step 3500 shows the contracted state of the simulation with high myosin activity. (C) A phase diagram of increasing myosin node densities compared with increasing myosin node activities. The central seven clearances of configurations similar to (B) are shown at simulation step 3500. Note the network fragmentation at node densities of 0.05 (bottom row). Yellow arrows indicate smooth boundary formation at node densities between 0.10 and 0.25 and myosin activities between 0.2 and 1.0. Red arrows indicate rough boundary maintenance at node densities between 0.10 and 0.25 and myosin activity of 0.1. (D) At 0.1 myosin activity, network shapes change initially (step 2–300) but are then maintained. The central clearance of configurations similar to (B) are shown for node densities of 0.1 and 0.25. The observations of (C) and (D) were reproduced in three sets of simulations with distinct starting conditions.
Figure 3—figure supplement 1
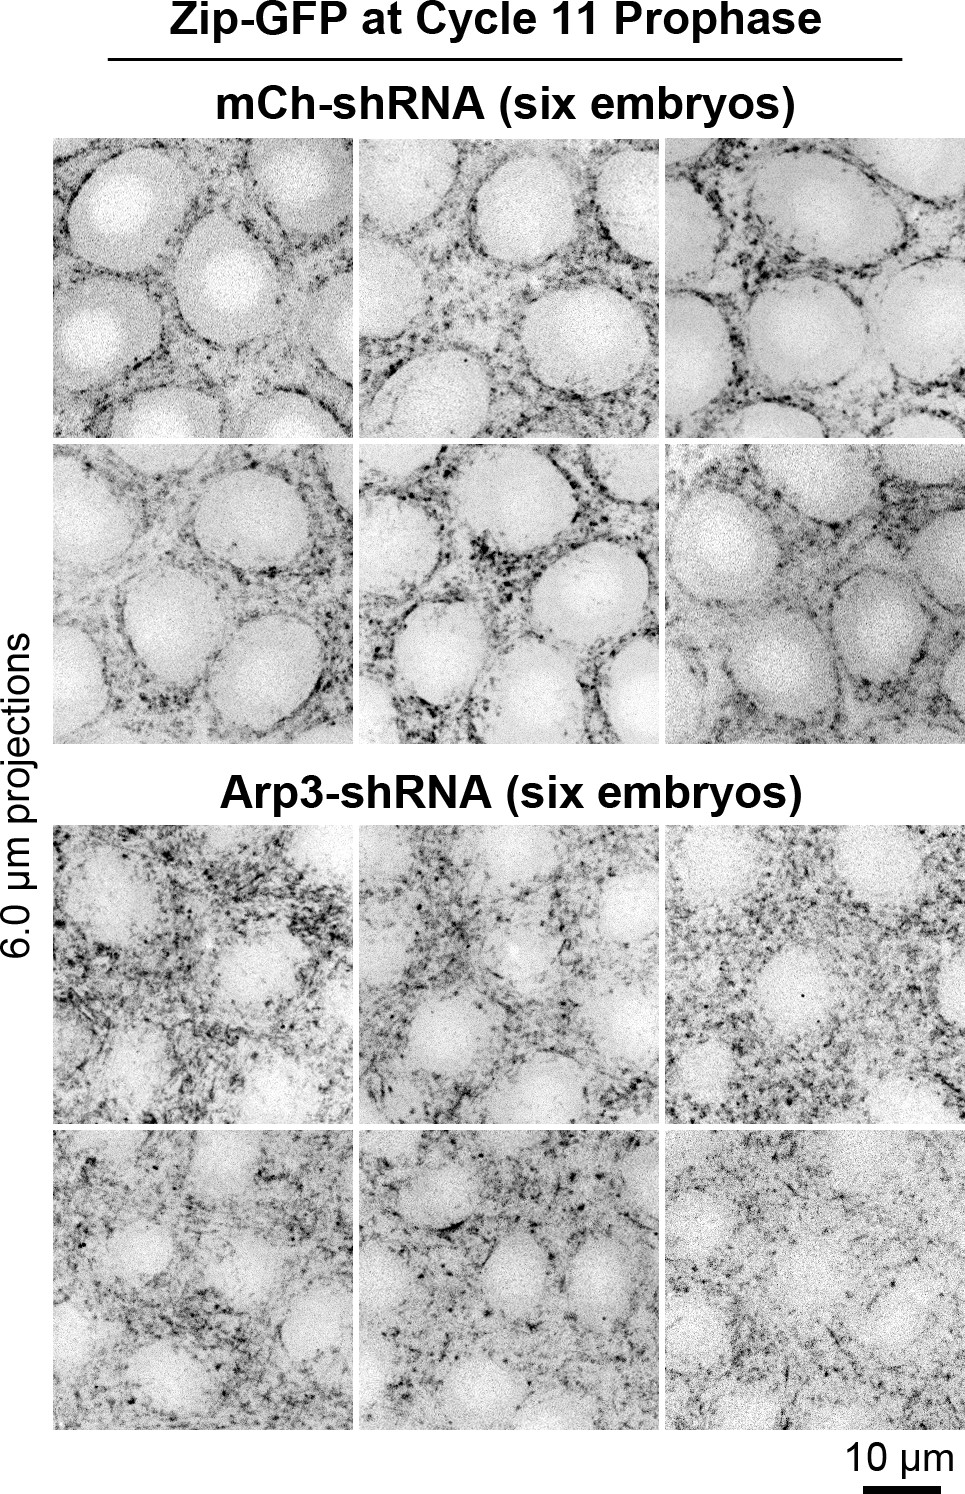
Multiple examples of myosin organization in control and Arp3 RNAi embryos at cycle 11 prophase.
Top, six control RNAi (mCh-shRNA) embryos displaying smooth and circular boundaries of actomyosin zone (Zip-GFP) at their interfaces with growing actin caps (devoid of Zip-GFP signal). Bottom, six Arp3 RNAi embryos displaying rough boundaries of actomyosin zones (Zip-GFP) at their interfaces with diminished actin caps (smaller areas devoid of Zip-GFP signal). Related to Figure 3A.
Figure 4 with 7 supplements
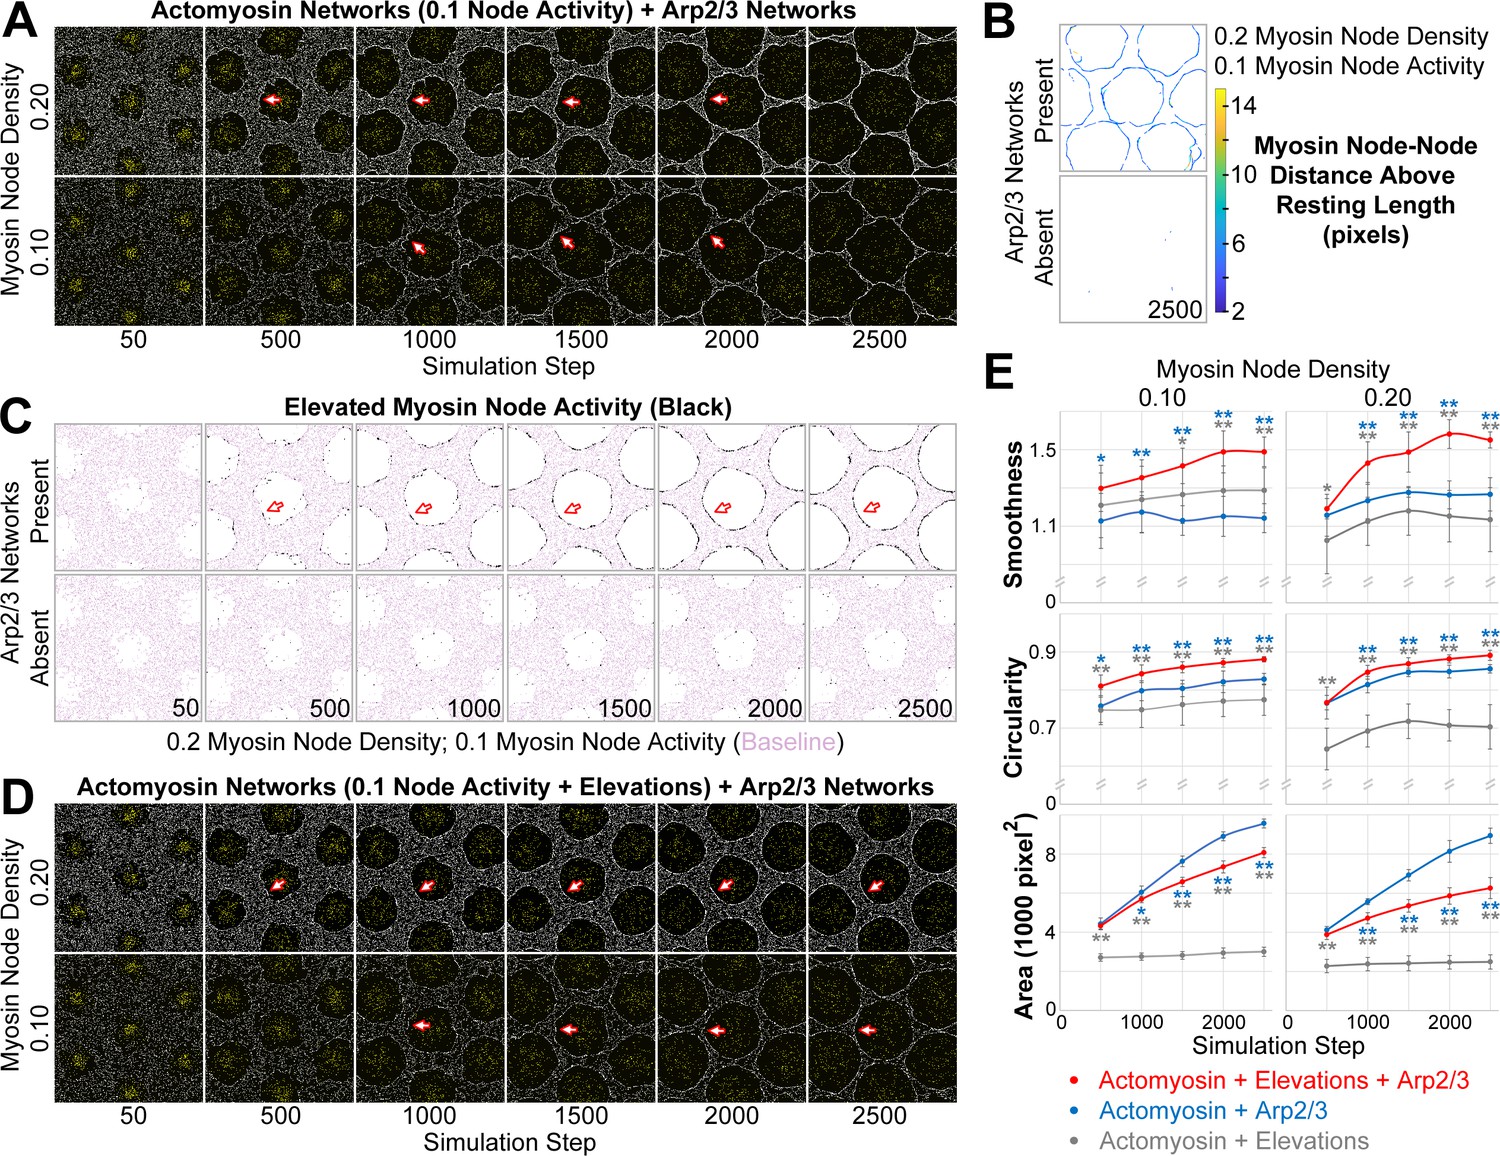
Emergence of a smooth interface from growth of an Arp2/3 network against a mechanosensitive actomyosin network.
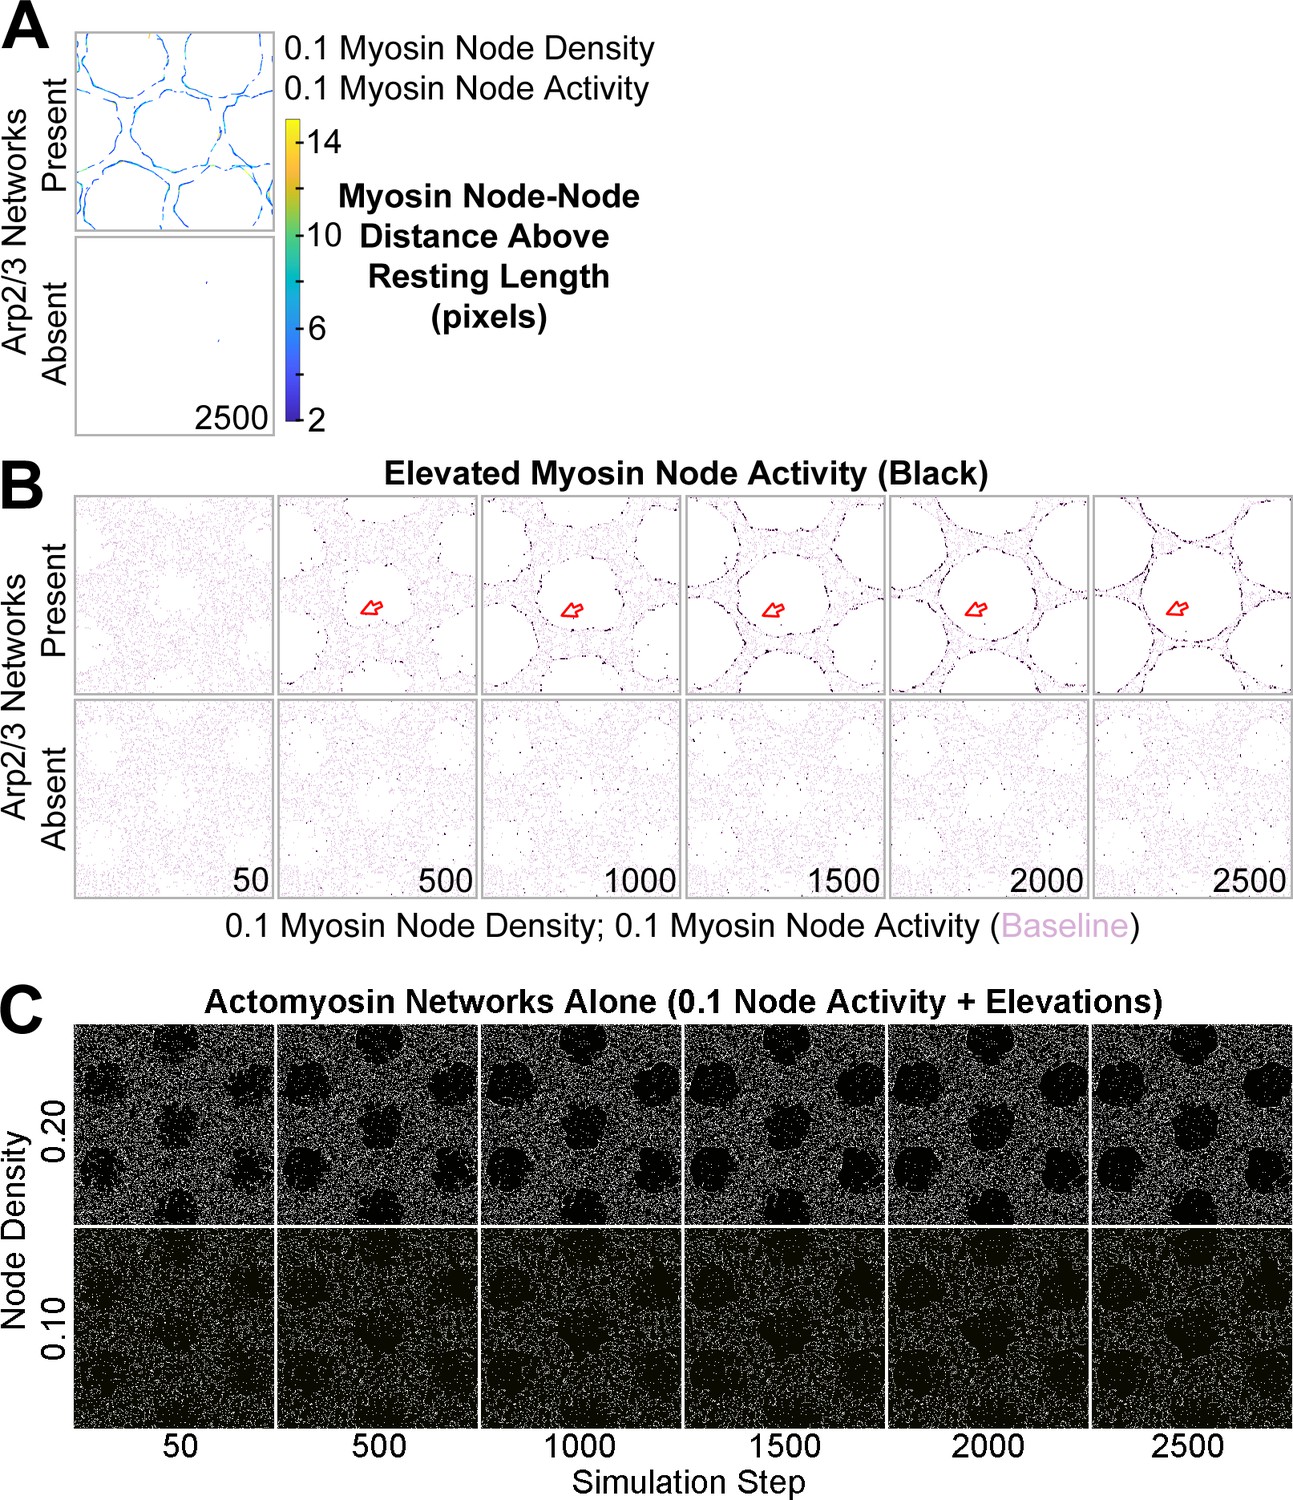
(A–D) Central views of configurations similar to Figure 3B. (A) Addition of growing Arp2/3 networks (yellow) to the clearances of actomyosin networks with low contractility (myosin nodes in white), led to clearance area increases (compare with Figure 3D) and accumulation of myosin nodes at the network-network interface (arrows), but the interfaces were wavy and the clearances became polygonal. These effects were documented at two myosin node densities (0.10 and 0.20). (B) Detection of myosin node-node distances greater than the resting length by two pixels or more (see color scale). The detections accumulated at the interface between the actomyosin network and growing Arp2/3 networks, and were rare in actomyosin networks without Arp2/3 networks. Shown at simulation step 2500. Representative of four replicates. Shown for myosin node density of 0.2, and also seen for myosin node density of 0.1 (Figure 4—figure supplement 7A). (C) Enrichment of myosin node activity elevations (black) above baseline (pink) at the interface of a mechanosensitive actomyosin network with growing Arp2/3 caps (arrows). The enrichment increased as the Arp2/3 network grew (compared simulation steps 500 to 2500), did not occur in other regions of the actomyosin network, and did not occur in the absence of growing Arp2/3 networks. Shown for myosin node density of 0.2, and also seen for myosin node density of 0.1 (Figure 4—figure supplement 7B). (D) Addition of growing Arp2/3 networks (yellow) to the clearances of actomyosin networks with low contractility and mechanosensitivity (myosin nodes in white), led to clearance area increases, accumulation of myosin nodes at the network-network interface (arrows), and interfaces that were smooth and circular. These effects were documented at two myosin node densities (0.10 and 0.20). Compared with the non-mechanosensitive actomyosin networks of (A), the mechanosensitive networks retained greater separation between clearances as the Arp2/3 networks grew (compare simulation steps 2500 in A and D). (E) Quantifications of the smoothness, circularity and area of the central clearance of simulations indicated. Means ± SD shown for eight simulations with distinct starting conditions. Blue asterisks compare mechanosensitive actomyosin networks plus Arp2/3 networks with non-mechanosensitive actomyosin networks plus Arp2/3 networks. Gray asterisks compare mechanosensitive actomyosin networks plus Arp2/3 networks with mechanosensitive actomyosin networks alone (example images of the latter in Figure 4—figure supplement 7C). Single asterisk; p<0.05: double asterisks; p<0.01.
Figure 4—figure supplement 1
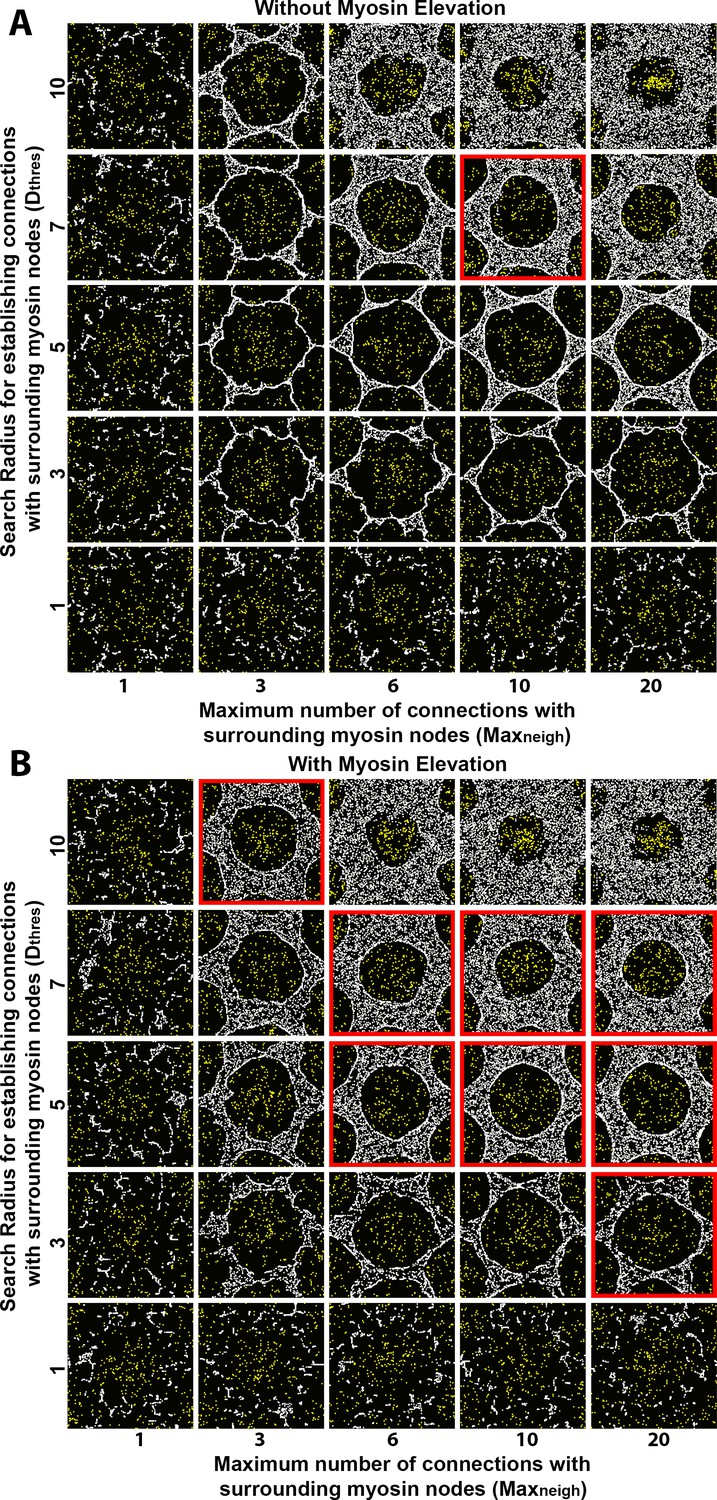
Sensitivity of interface smoothness and circularity to changes of search radius for establishing myosin node connections and of the maximum number of connections a myosin node can make.
Each square shows step 2500 of a distinct simulation. In all the simulations, myosin node activity was 0.1 and myosin node density was 0.2. All the simulations had a configuration similar to Figure 3B, except they were conducted with a central clearance surrounded by only six outer clearances to reduce overall computation time (the central clearance of each simulation is shown in each square of the figure). Myosin nodes are white. Arp2/3 network plus end nodes are yellow. (A) Without myosin node elevations, only one combination of tested parameter values resulted in a smooth and circular interface (red outline), suggesting an increase to both the search radius for making connections and the maximum number of connections can produce an actomyosin network with sufficient contractility to form a smooth contractile ring. The parameter values of the center square are the same as those used in Figure 4A. (B) With myosin node elevations allowed, smooth and circular interfaces formed with many more parameter values, indicated with red outlines. The parameter values of the center square are the same as those used in Figure 4D. When the search radius for establishing connections was too low (bottom), or the maximum number of connections was too low (left), the myosin networks fragmented. When myosin nodes could make excessive interconnections over long distances (top right), a smooth and circular interface also failed to form.
Figure 4—figure supplement 2
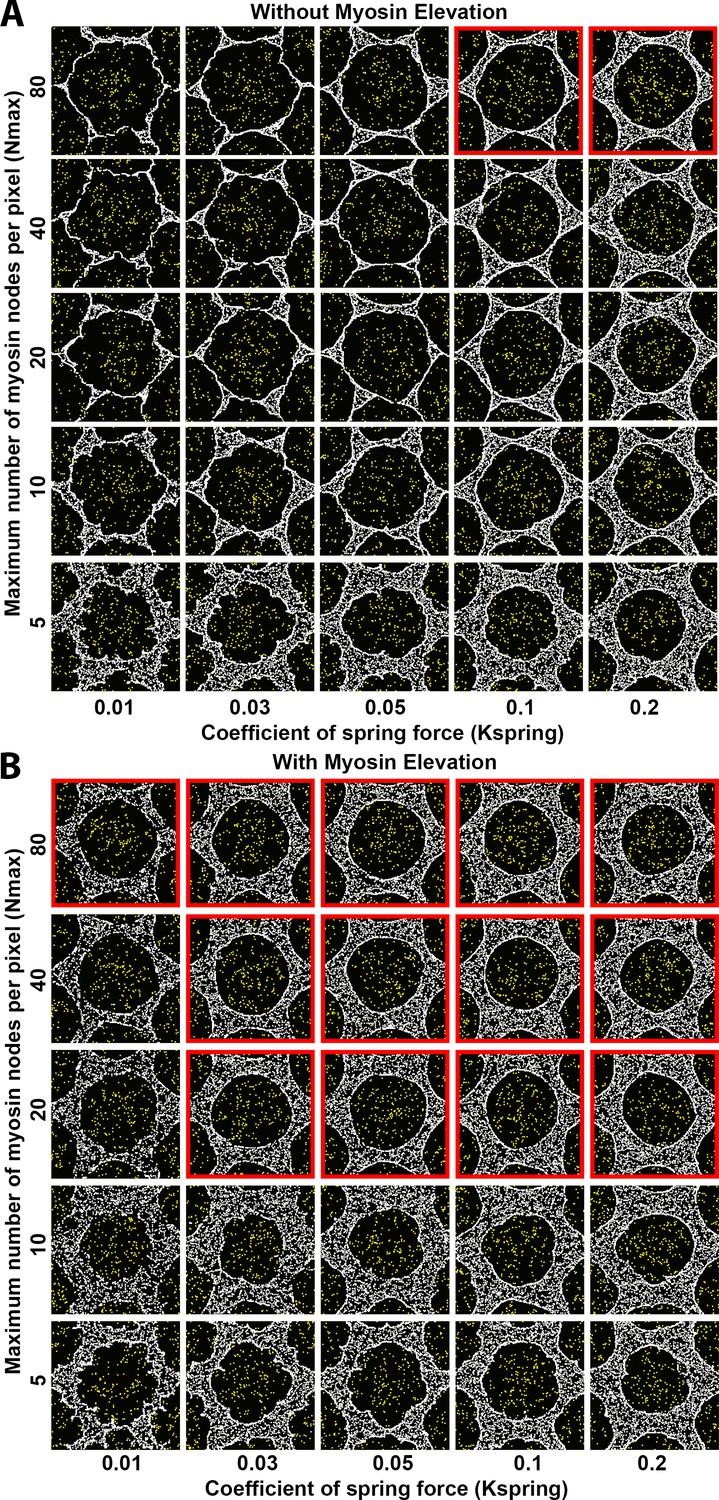
Sensitivity of interface smoothness and circularity to changes of maximum myosin node density per pixel and of internode spring force strength.
Analyses conducted and displayed as in Figure 4—figure supplement 1. (A) Without myosin node elevations, only two combinations of tested parameter values resulted in a smooth and circular interface (red outline), suggesting high levels of both parameters can produce an actomyosin network with sufficient contractility to form a smooth contractile ring. The parameter values of the center square are the same as those used in Figure 4A. (B) With myosin node elevations allowed, smooth and circular interfaces formed with many more parameter values, indicated with red outlines. The parameter values of the center square are the same as those used in Figure 4D. When the maximum number of myosin nodes allowed per pixel was reduced (bottom two rows), smooth and circular boundaries failed to form, and myosin node elevation events would be restricted since they depend on a myosin node being allowed to move into a pixel already occupied by five or more myosin nodes. The lowest spring force between myosin nodes also compromised formation of a smooth and circular interface (left column).
Figure 4—figure supplement 3
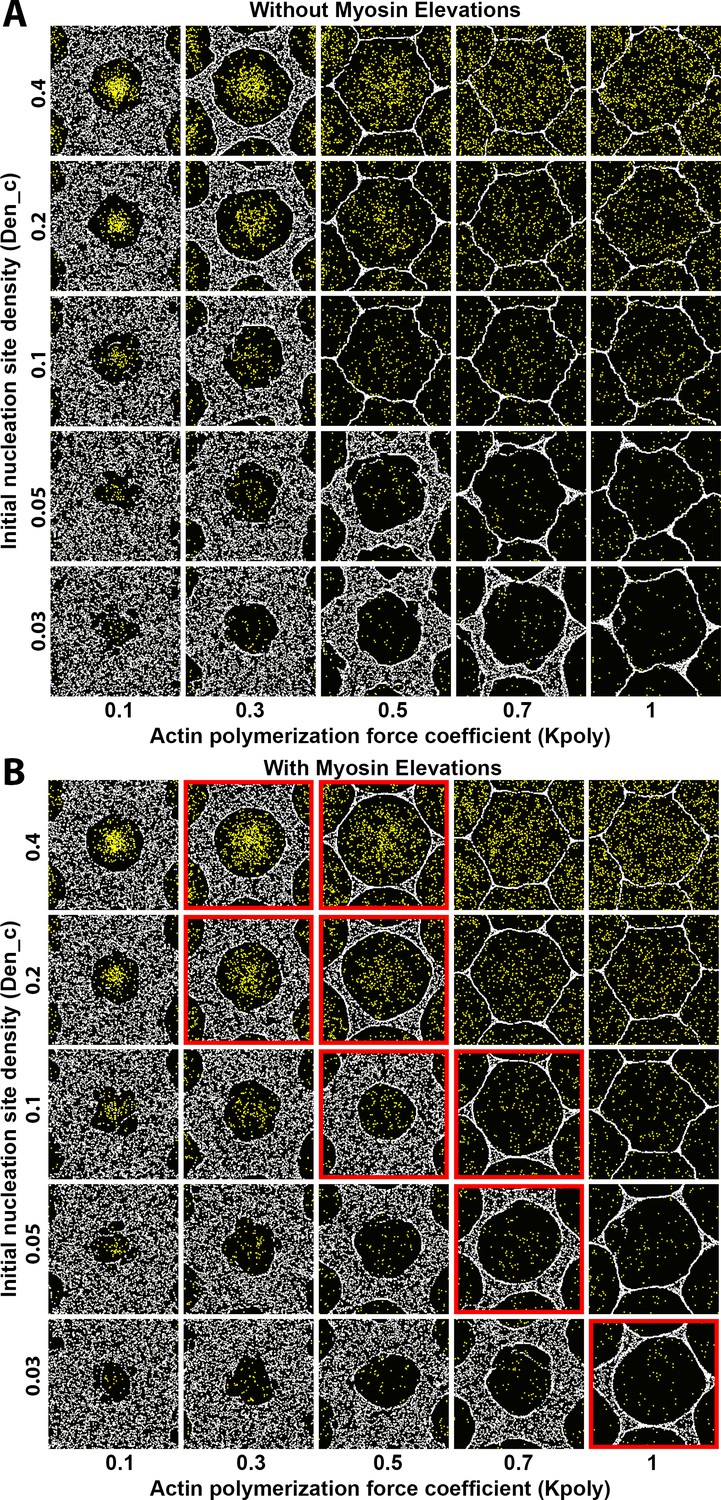
Sensitivity of interface smoothness and circularity to changes of Arp2/3 network nucleation site density and of actin polymerization force.
Analyses conducted and displayed as in Figure 4—figure supplement 1. (A) Without myosin node elevations, no combination of tested parameter values resulted in a smooth and circular interface. The parameter values of the center square are the same as those used in Figure 4A. (B) With myosin node elevations allowed, smooth and circular interfaces formed with the parameter values indicated with red outlines. The parameter values of the center square are the same as those used in Figure 4D. When the initial nucleation site density and the actin polymerization force coefficient were both excessively decreased, myosin nodes were minimally displaced and retained a rough boundary (to bottom left). When the initial nucleation site density and the actin polymerization force coefficient were both excessively increased, myosin nodes were strongly displaced and gained hexagonal boundaries, likely due to a space filling effect from the dominant expansive forces of the Arp2/3 networks (to top right).
Figure 4—figure supplement 4
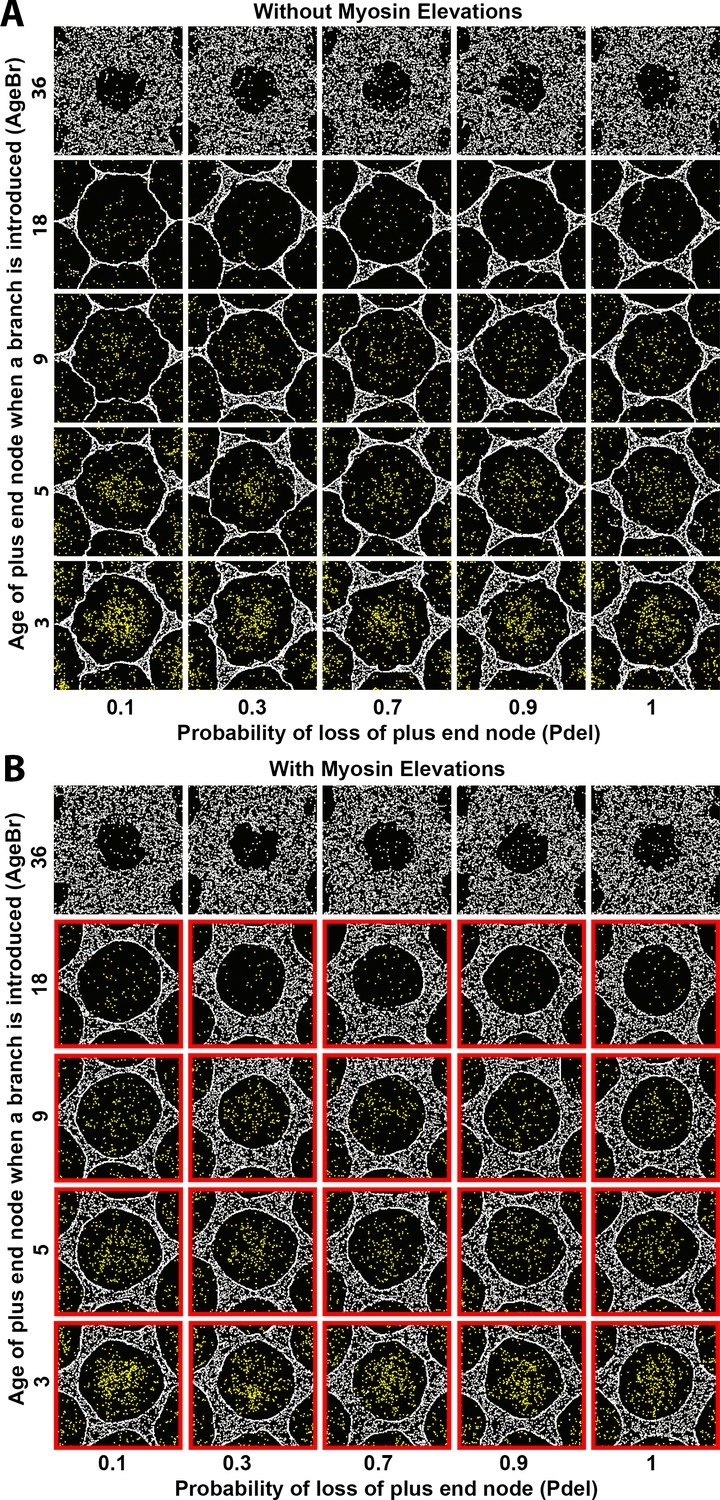
Sensitivity of interface smoothness and circularity to changes of Arp2/3 network branch timing and of plus end node loss probability.
Analyses conducted and displayed as in Figure 4—figure supplement 1. (A) Without myosin node elevations, no combination of tested parameter values resulted in a smooth and circular interface. The parameter values of the center square are the same as those used in Figure 4A. (B) With myosin node elevations allowed, smooth and circular interfaces formed with the parameter values indicated with red outlines. The parameter values of the center square are the same as those used in Figure 4D. When network branches were added infrequently, myosin nodes were minimally displaced and retained a rough boundary (top row). Changes to the probability of plus end node loss had minimal effects (left-to-right).
Figure 4—figure supplement 5
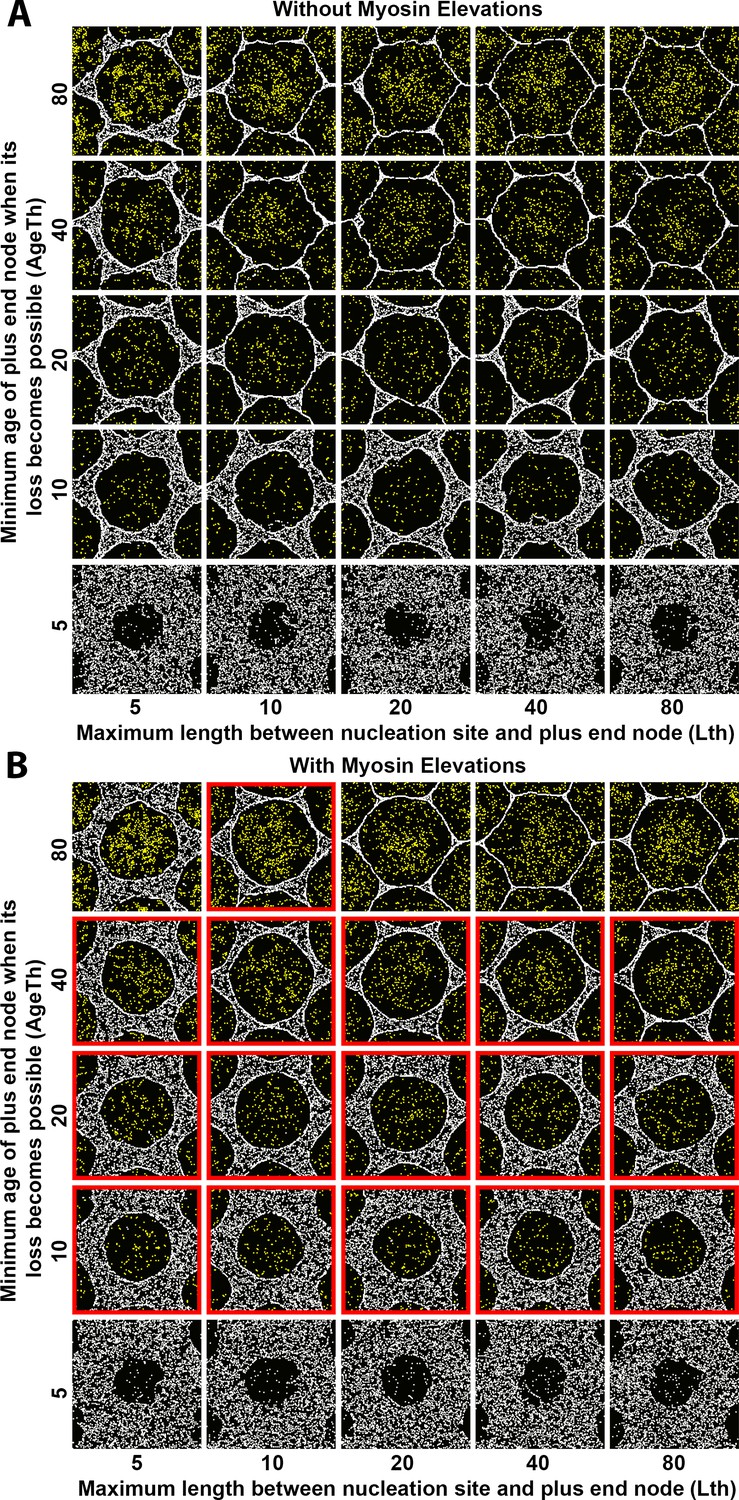
Sensitivity of interface smoothness and circularity to changes of Arp2/3 network plus end node loss timing and of maximum polymer length.
Analyses conducted and displayed as in Figure 4—figure supplement 1. (A) Without myosin node elevations, no combination of tested parameter values resulted in a smooth and circular interface. The parameter values of the center square are the same as those used in Figure 4A. (B) With myosin node elevations allowed, smooth and circular interfaces formed with the parameter values indicated with red outlines. The parameter values of the center square are the same as those used in Figure 4D. When plus end node loss became possible for young plus end nodes, myosin nodes were minimally displaced and retained a rough boundary (bottom row). When plus end node loss only became possible for old plus end nodes, myosin nodes were strongly displaced and gained hexagonal boundaries, likely due to a space filling effect from the dominant expansive forces of the Arp2/3 networks (top-right). Changes to maximum polymer length had minimal effects (left-to-right).
Figure 4—figure supplement 6
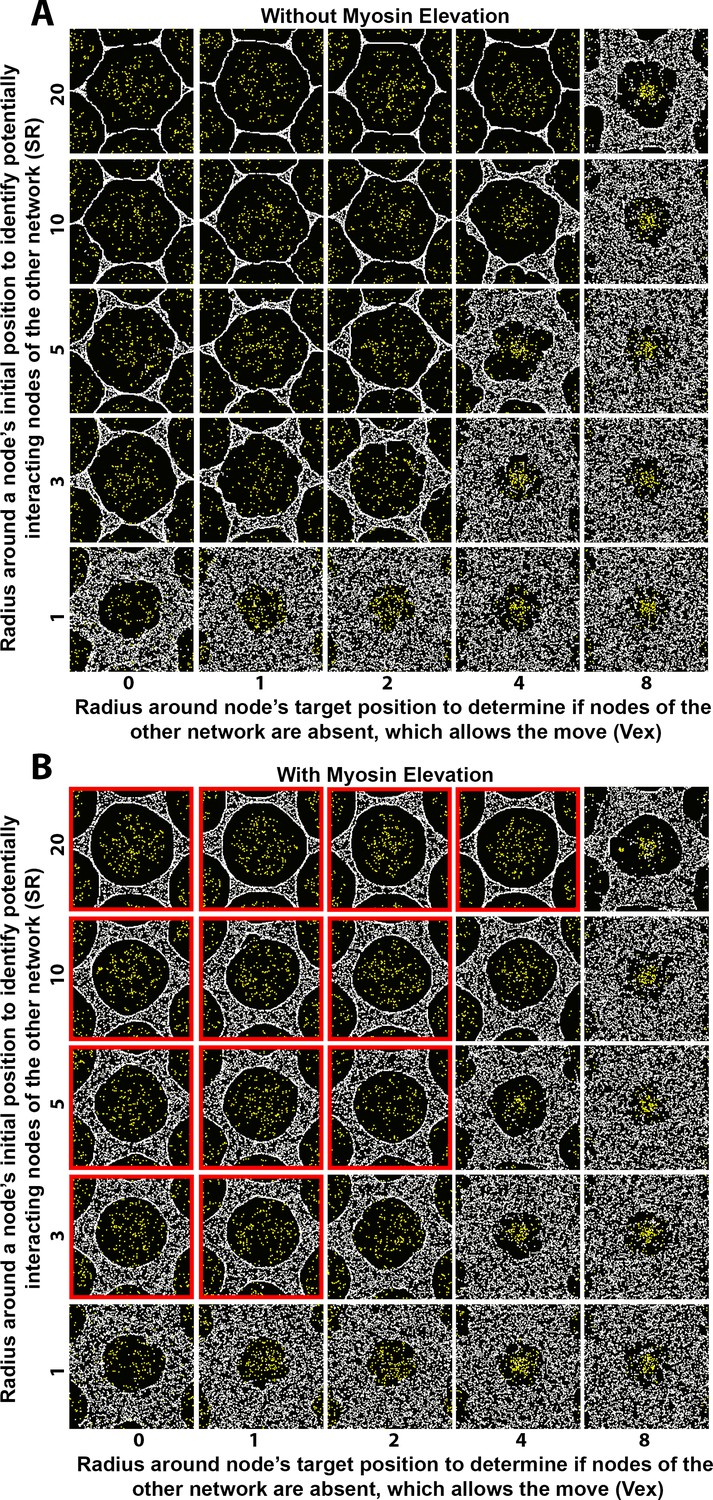
Sensitivity of interface smoothness and circularity to changes of search radii distances controlling network-network interactions.
Analyses conducted and displayed as in Figure 4—figure supplement 1. (A) Without myosin node elevations, no combination of tested parameter values resulted in a smooth and circular interface. The parameter values of the center square are the same as those used in Figure 4A. (B) With myosin node elevations allowed, smooth and circular interfaces formed with the parameter values indicated with red outlines. The parameter values of the center square are the same as those used in Figure 4D. Reducing the radius used by a node of one network to search for a node of the other network to physically affect resulted in rough interfaces (bottom row) and would decrease myosin node elevation events since they occur by Arp2/3 network plus end nodes displacing myosin nodes. Increasing the radius used by a node of one network to test if its movement is into a region lacking nodes of the other network resulted in rough interfaces (right column) and would decrease myosin nodes elevation events because of restricted allowance of Arp2/3 network plus end node movements.
Figure 4—figure supplement 7
Additional data related to Figure 4.
(A) Detection of myosin node-node distances greater than the resting length by two pixels or more (see color scale). The detections accumulated at the interface between the actomyosin network and growing Arp2/3 networks and were rare in actomyosin networks without Arp2/3 networks. Shown at simulation step 2500. Representative of four replicates. Shown for myosin node density of 0.1. Related to Figure 4B. (B) Enrichment of myosin node activity elevations (black) above baseline (pink) at the interface of a mechanosensitive actomyosin network with growing Arp2/3 caps (arrows). The enrichment increased as the Arp2/3 network grew (compared simulation steps 500–2500), did not occur in other regions of the actomyosin network, and did not occur in the absence of growing Arp2/3 networks. Shown for myosin node density of 0.1. Related to Figure 4C. (C) In the absence of Arp2/3 networks, actomyosin networks of 0.1 node activity and the potential to elevate node activity underwent minimal change. Shown for node densities of 0.1 and 0.2. Related to Figure 4E.
Figure 5
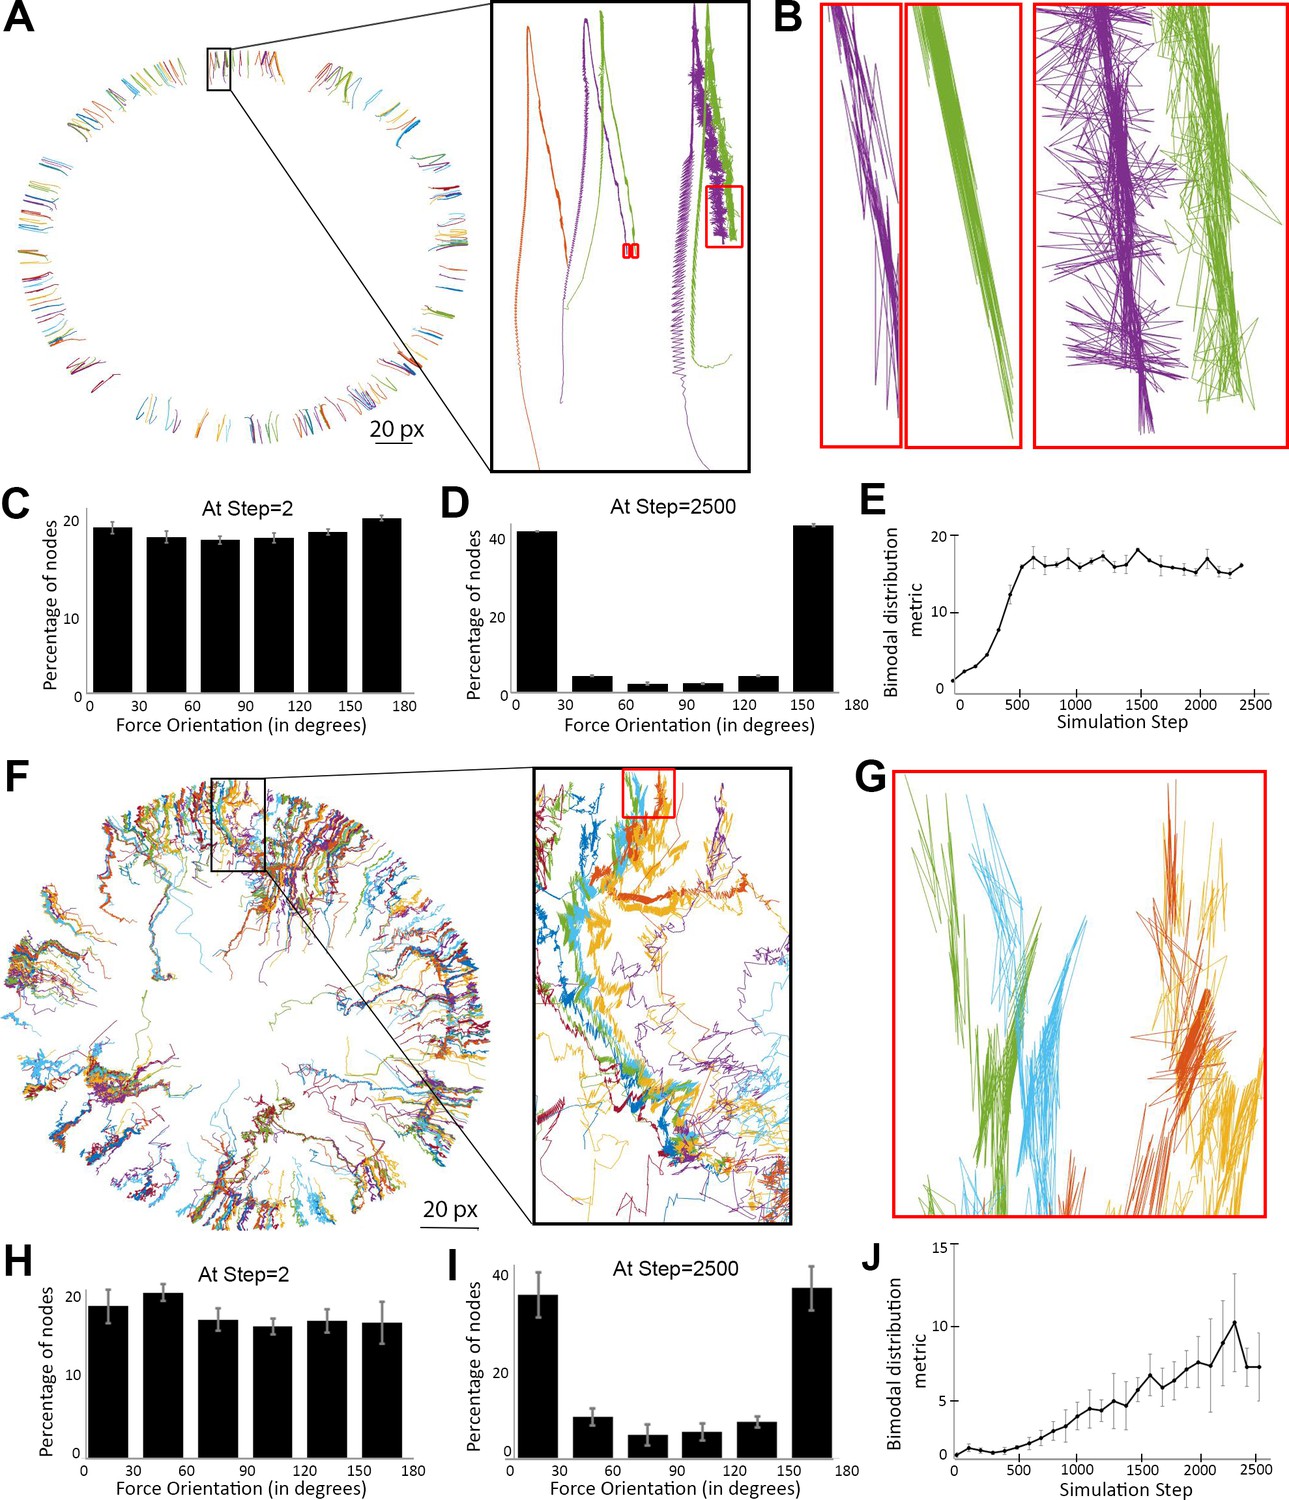
Myosin nodes activated by Arp2/3 network growth behave as a contractile ring during smoothening of the network-network interface.
(A) Tracings of the displacements of individual myosin nodes selected around the inner circumference of a single actomyosin ring that started with a rough configuration, thinned, and constricted over 2500 simulation steps, similar to Figure 2E. Each line is the tracing of one node. The magnified inset (black box) shows the displacement of five nodes. The nodes move from the bottom half of the box to the top of the box as the ring thins, and then move back to the center of the box as the ring constricts. The red boxes indicate the final steps of the simulation. (B) Magnified views of the red boxes in (A) show back-and-forth displacements of the nodes, and that most of these displacements are closely aligned with the local radius of the circle (see circle center in (A)). (C–D) Histograms of node displacement angles relative to local radii of the circle at the beginning of the simulation when an even distribution occurred (C) and at the end of the simulation when the distribution became bimodal with most nodes in close alignment with the radii (D). Means ± SD shown for three simulations with distinct starting configurations. 7200–7400 nodes of the entire rings quantified per simulation. (E) Quantification of the simulations of (C–D) gaining bimodal distributions between steps 0 and 2500 by plotting the number of nodes oriented more parallel with the radii [those with angles of (0–30°) + (150–180°)] divided by the number of nodes oriented more perpendicular to the radii [those with angles of (60–120°)]. (F) Tracings of the displacements of individual activated myosin nodes selected around the boundary of a mechanosensitive actomyosin network at its interface with an expanding Arp2/3 network (similar to the central ring of the two-network analysis in Figure 4D with myosin node density of 0.2). Each line is the tracing of one node before and after elevation of its activity. The magnified inset (black box) shows the displacement of ~12 nodes. The nodes move from the bottom of the box to the top of the box as the network-network interface accumulates activated myosin nodes and smoothens. The red box indicates the final steps of the simulation. (G) Magnified view of the red box in (F) shows back-and-forth displacements of the nodes, and that most of these displacements are closely aligned with the local radius of the circle (see circle center in (F)). (H–I) Histograms of node displacement angles relative to local radii of the circle at the beginning of the simulation when an even distribution occurred (H) and at the end of the simulation when the distribution became bimodal with most nodes in close alignment with the radii (I). Means ± SD shown for three simulations with distinct starting configurations. 186–314 nodes quantified per simulation. (J) Quantification of the simulations of (H–I) gaining bimodal distributions between steps 0 and 2500, calculating the bimodal distribution metric as in (E).
Figure 6

Schematic model of how a smooth interface forms from growth of an Arp2/3 network against a mechanosensitive actomyosin network.
Half of a clearance is shown at three stages of the rough-to-smooth transition of the network-network interface. (A) Arp2/3 network plus end nodes (yellow circles) polymerize to the rough boundary of weakly contractile myosin nodes (gray circles). (B) The plus end nodes apply forces to interface myosin nodes which gain activity (gray circles with red outlines). (C) Activated myosin nodes form a local contractile ring (bottom half of ring shown) which smoothens the network-network interface.
Tables
Table 1
Parameters used in simulations.
| Parameter | Value | Remark |
|---|---|---|
| One simulation step | 0.1 s | Estimated from in vivo cap growth (Jiang and Harris, 2019) |
| One pixel | 0.1 micron | Estimated from in vivo cap growth (Jiang and Harris, 2019) |
| Actomyosin network | ||
| Myosin node density (Den_m) | Varied (0–1) | Proportion of total pixels in the actomyosin zone with a myosin node |
| Myosin node activity (M) | Varied (0–1) | Relative activities |
| Search radius for establishing connections with surrounding myosin nodes (Dthres) | five pixels | Based on optimal actin filament length for cortical actomyosin contractility (Chugh et al., 2017) |
| Maximum number of connections with surrounding myosin nodes (MaxNeigh) | 6 | Optimized* |
| Maximum number of myosin nodes per pixel (Nmax) | 20 | Optimized* |
| Coefficient of myosin force (Kmyosin) | 0.5 nN | Order of magnitude measured for myosin force (Finer et al., 1994) |
| Coefficient of spring force (Kspring) | 0.05 nN/nm | Order of magnitude measured for actin elasticity (Kojima et al., 1994) |
| Node-node connection resting length (lo) | Variable | Mean length of all connections before a simulation starts |
| Arp2/3 network | ||
| Initial nucleation site density (Den_c) | 0.1 and 0.01‡ | Proportion of total pixels in the nucleation zone with a nucleation site† |
| Actin polymerization force coefficient (Kpoly) | 0.5 nN | Order of magnitude measured for Arp2/3 networks with same area (Bieling et al., 2016)† |
| Age of plus end node when a branch is induced (AgeBr) | nine steps | Optimized* |
| Maximum length between nucleation site and plus end node (Lth) | 20 pixels | Ordered of magnitude calculated for capped actin filaments (Schafer et al., 1996) |
| Minimum age of plus end node when its loss becomes possible (Ageth) | 20 steps | Optimized* |
| Probability of loss of plus end node at each step (Pdel) | 0.7 | Optimized* |
| Network-network Interface | ||
| Radius around a node’s initial position to identify potentially interacting nodes of the other network (SR) | five pixels | Assumed‡ |
| Radius around a node’s target position to determine if nodes of the other network are absent, which allows the move (Vex) | two pixels | Assumed‡ |
-
*Optimized in relation to other parameters of the actomyosin or Arp2/3 model (see Model Formulation for details).
†These parameters of the Arp2/3 model were coarsened to account for a plus end node representing only one actin filament whereas a myosin node represents a myosin mini-filament connected to many actin filaments. To increase the impact of each plus end node relative to a myosin node, the initial actin nucleation site density was set on the lower side whereas the polymerization force of a single plus end node was set on the higher side.
-
‡See Model Formulation for details.
Key resources table
| Reagent type (species) or resource | Designation | Source or reference | Identifiers | Additional information |
|---|---|---|---|---|
| Genetic reagent (D. melanogaster) | maternal-GAL4-VP16 | Mark Peifer | ||
| Genetic reagent (D. melanogaster) | UASp-Arp3-shRNA | Bloomington Drosophila Stock Center (BDSC) | BDSC #53972 RRID:BDSC_53972 | |
| Genetic reagent (D. melanogaster) | UASp-mCherry-shRNA | BDSC | BDSC #35785 RRID:BDSC_35785 | |
| Genetic reagent (D. melanogaster) | Zipper-GFP | Flytrap | BDSC #51564 RRID:BDSC_51564 | |
| Software, algorithm | MATLAB | MathWorks | ||
| Software, algorithm | Volocity | Quorum Technologies Inc | ||
| Software, algorithm | Image J | NIH | ||
| Software, algorithm | Excel | Microsoft | ||
| Software, algorithm | PowerPoint | Microsoft | ||
| Software, algorithm | Photoshop | Adobe |
Additional files
-
Source code 1
Annotated code for the model of the actomyosin network alone.
MATLAB code is available at: https://github.com/medha7575/sharma-et-al-ELIFE2021.
- https://cdn.elifesciences.org/articles/66929/elife-66929-code1-v2.zip
-
Source code 2
Annotated code for the model of the Arp2/3 actin network alone.
MATLAB code is available at: https://github.com/medha7575/sharma-et-al-ELIFE2021.
- https://cdn.elifesciences.org/articles/66929/elife-66929-code2-v2.zip
-
Source code 3
Annotated code for the model of the two networks combined.
MATLAB code is available at: https://github.com/medha7575/sharma-et-al-ELIFE2021.
- https://cdn.elifesciences.org/articles/66929/elife-66929-code3-v2.zip
-
Transparent reporting form
- https://cdn.elifesciences.org/articles/66929/elife-66929-transrepform-v2.pdf
Download links
A two-part list of links to download the article, or parts of the article, in various formats.
Downloads (link to download the article as PDF)
Open citations (links to open the citations from this article in various online reference manager services)
Cite this article (links to download the citations from this article in formats compatible with various reference manager tools)
Emergence of a smooth interface from growth of a dendritic network against a mechanosensitive contractile material
eLife 10:e66929.
https://doi.org/10.7554/eLife.66929


