Physiology and ecology combine to determine host and vector importance for Ross River virus
- Department of Biology, Stanford University, United States
- Natural Capital Project, Woods Institute for the Environment, Stanford University, United States
- Centre for Planetary Health and Food Security, Griffith University, Australia
- Public Health Virology, Forensic and Scientific Services, Department of Health, Australia
Figures
Figure 1
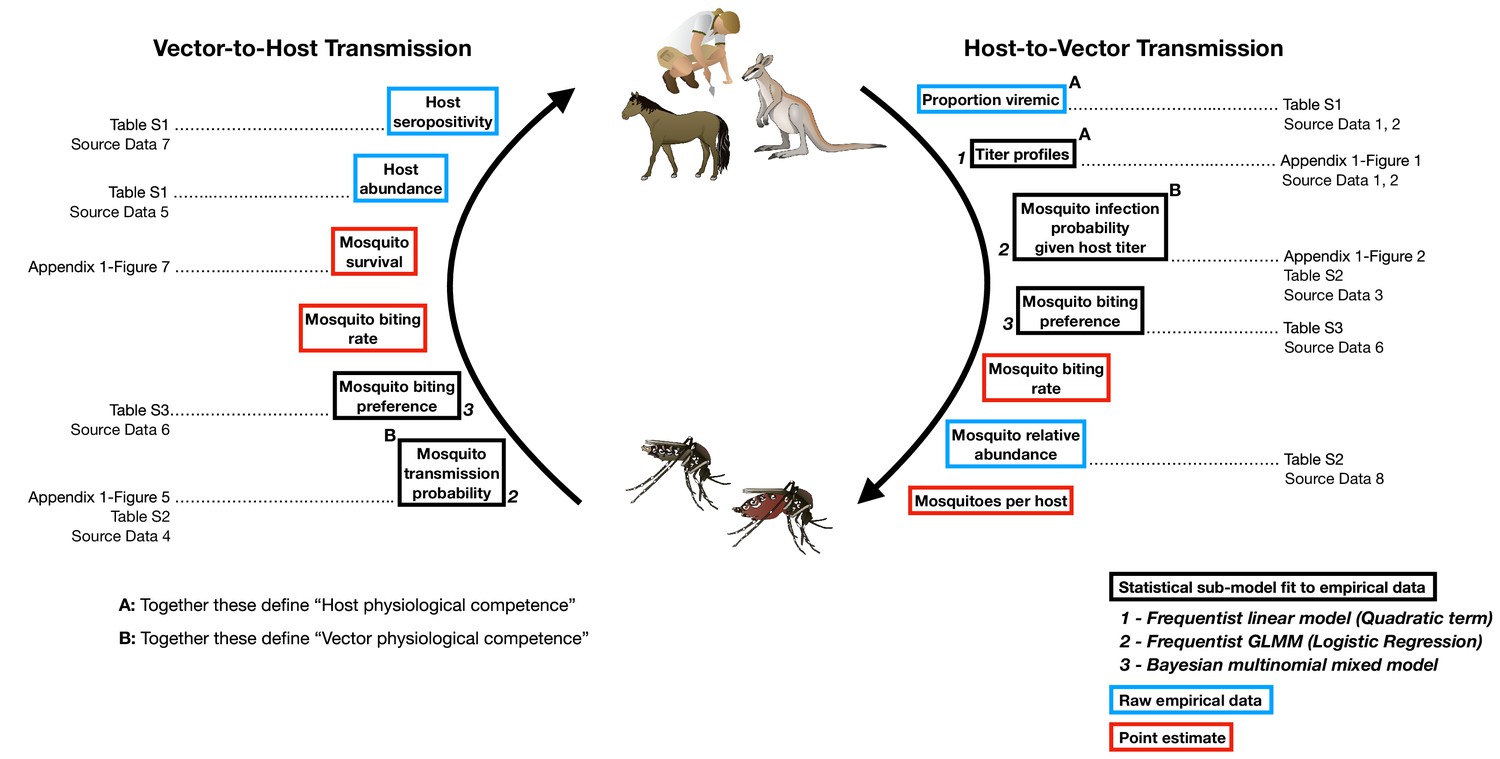
The transmission cycle of Ross River virus, a multi-host, multi-vector arbovirus, and the components our framework uses to model this transmission cycle.
The first requirements for transmission are physiologically competent hosts that become infected (A: ‘proportion viremic’) and are able to replicate the virus to suitable levels to infect vectors (A: ‘titer profiles’) and vector species that can become infected (B: ‘Mosquito infection probability’) and eventually are able to transmit virus (B: ‘Mosquito transmission probability’). Physiologically competent hosts and vectors contribute to the transmission of the virus through a continuous cycle of transmission, which can be viewed from two perspectives, either starting with an infected host or starting with an infected vector; regardless of perspective, a single complete cycle contains a single set of physiological and ecological components. Each of these components are used in our framework in one of three ways: statistical models fit to empirical data, from which uncertainty is propagated into the final calculations of transmission (boxes outlined in black); raw empirical data (boxes outlined in blue); and point estimates (boxes outlined in red). Italic bold numbers and text next to the boxes outlined in black describe, in brief, the type of statistical model used to estimate each component (GLMM stands for generalized linear mixed model). Details on all components are provided in the Materials and Methods, Supplementary files, and Appendix Figures that are listed next to framework components; associated raw Source Data files are also listed.
Figure 2
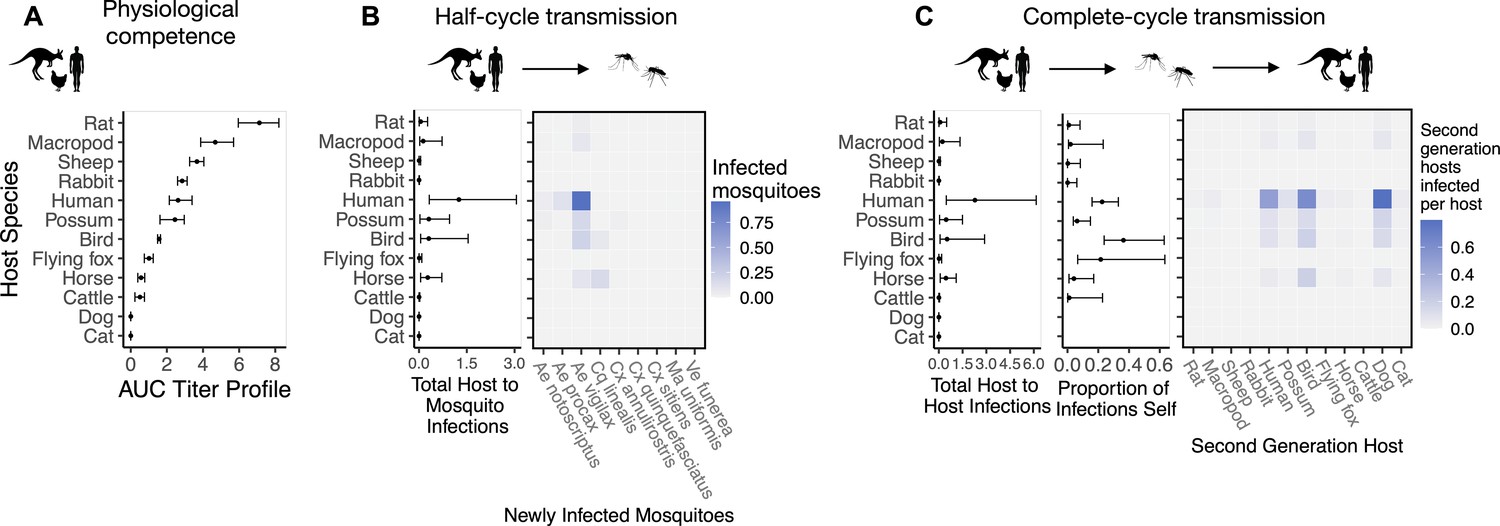
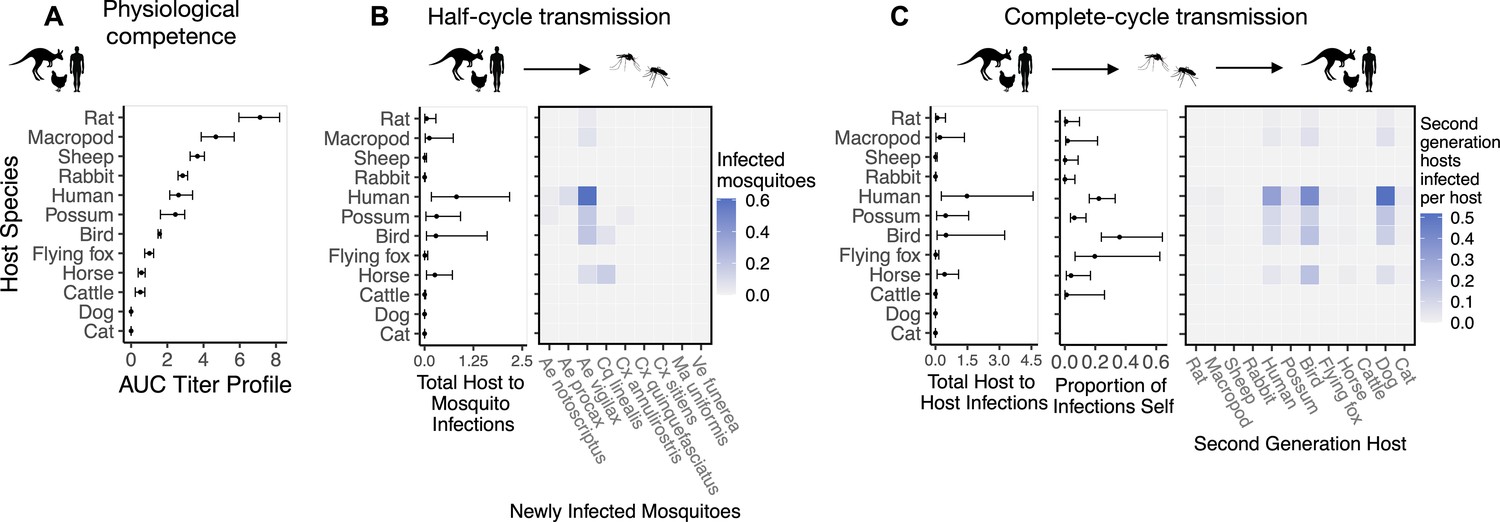
The most competent host species for Ross River virus (RRV) transmission in Brisbane change when considering physiological traits alone (A) or also considering ecological traits (B, C).
(A) Estimated physiological response of hosts to experimental infection with RRV, summarized using the area under their estimated titer profiles over time (AUC). In all panels, points show median estimates; error bars are 95% confidence intervals (CIs) that combine the uncertainty from all statistical sub-models used to obtain the estimates presented in that panel (see Figure 1 and Box 1 for these components). Titer profile AUC is used only to quantify host physiological competence, while time-dependent titer profiles (pictured in Appendix 1—figure 1) are used in half-cycle and complete-cycle transmission. The ordering of hosts based on highest (top) to lowest (bottom) physiological competence in A is conserved in B and C to aid visualization of host order changes among panels. (B) Host-to-vector transmission; matrices show the median estimated number of vectors infected by each host species, while the points show infection totals (sums across matrix rows), with error bars. (C) Host-vector-host transmission. As in B, the matrices show estimated median numbers of next-generation host infections for all host species pairs, while the points show sums across rows of the matrices (left plot) and the proportion of infections in the second generation that are in the same species as the original infected individual (center plot).
Figure 3
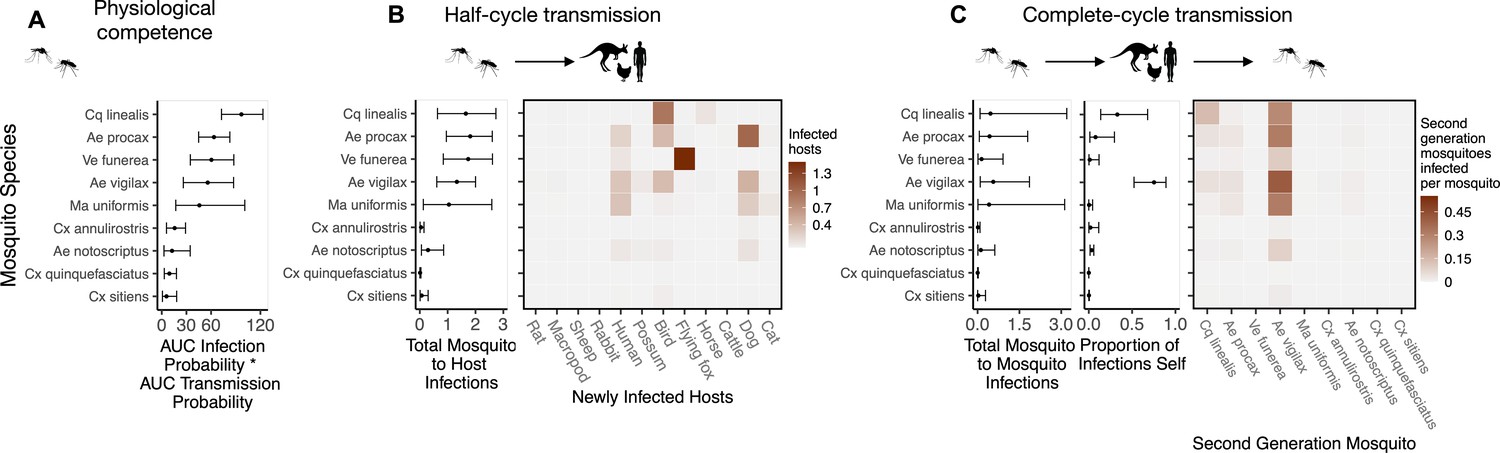
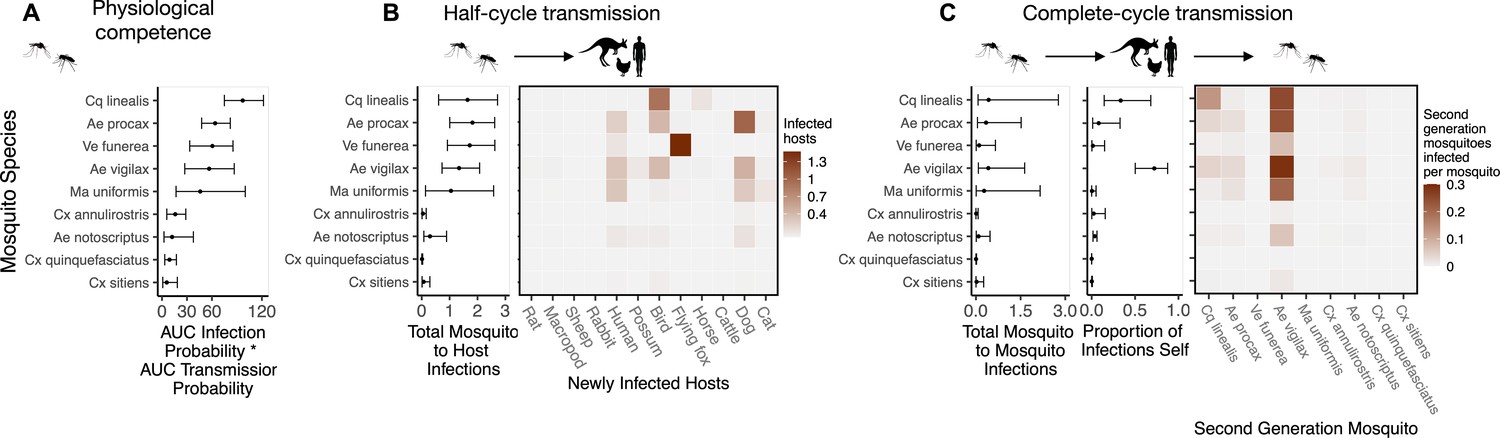
Ross River virus (RRV) transmission capability of Brisbane mosquitoes remained consistent when considering physiological traits alone (A) or also considering ecological traits (B, C).
(A) Physiological response of mosquitoes to experimental infection with RRV, summarized using the area under (AUC) of their estimated infection probability versus dose curves multiplied by the area under their transmission probability versus time curves. Points show median estimates; the error bars in each panel are 95% confidence intervals (CIs) that combine the uncertainty from all statistical sub-models used to obtain the estimates presented in that panel (see Figure 1 and Box 1 for these components). AUC is used only to quantify mosquito physiological competence; raw infection and transmission profiles (pictured in Appendix 1—figure 3 and Appendix 1—figure 4, respectively) are used in calculations of half-cycle and complete-cycle transmission. The ordering of vector species based on highest (top) to lowest (bottom) physiological competence in A is conserved in B and C to aid visualization of vector order changes among panels. (B) Vector-to-host transmission; matrices show the median numbers of hosts infected by each vector species, while the points show infection totals (sums across matrix rows), with error bars. (C) Vector-host-vector transmission. As in B, the matrices show median numbers of next-generation vector infections for all vector species pairs, while the points show sums across rows of the matrices (left plot) and the proportion of infections in the second generation that are in the same species as the original infected individual (center plot).
Figure 4
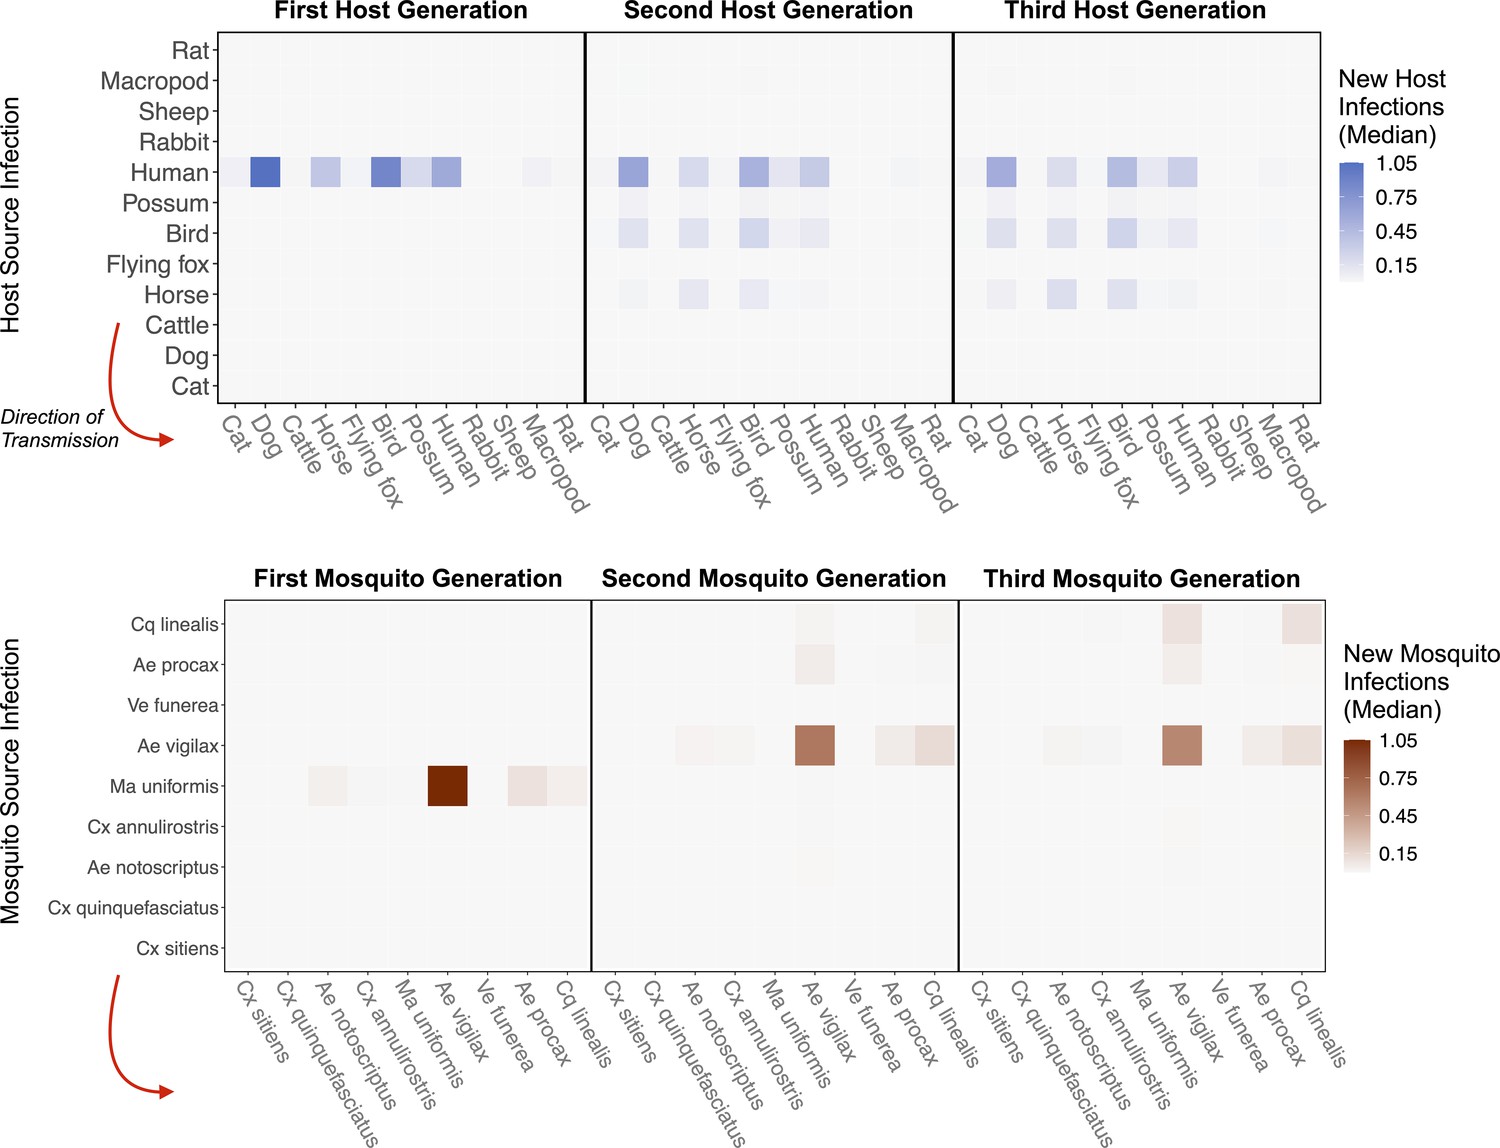
RRV epidemic dynamics propagate through initially naïve host and vector communities.
Epidemics are simulated in two ways: transmission in the host community resulting from an initial infection in a human (top row), or transmission in the mosquito community arising from a source infection in a Ma. uniformis mosquito (bottom row). Each matrix cell contains the median estimated number of new infections in a given species (columns) arising from all infected individuals of a given species in the previous generation (rows). The red arrow shows the direction of infection. We show generations 1–3 here to illustrate how quickly infections propagate through the community and converge on dominant transmission pathways, by generation 3. Uncertainty in the number of new infections in each host and mosquito species over five generations is shown in Appendix 2—figure 5 and Appendix 2—figure 6, respectively.
Appendix 1—figure 1
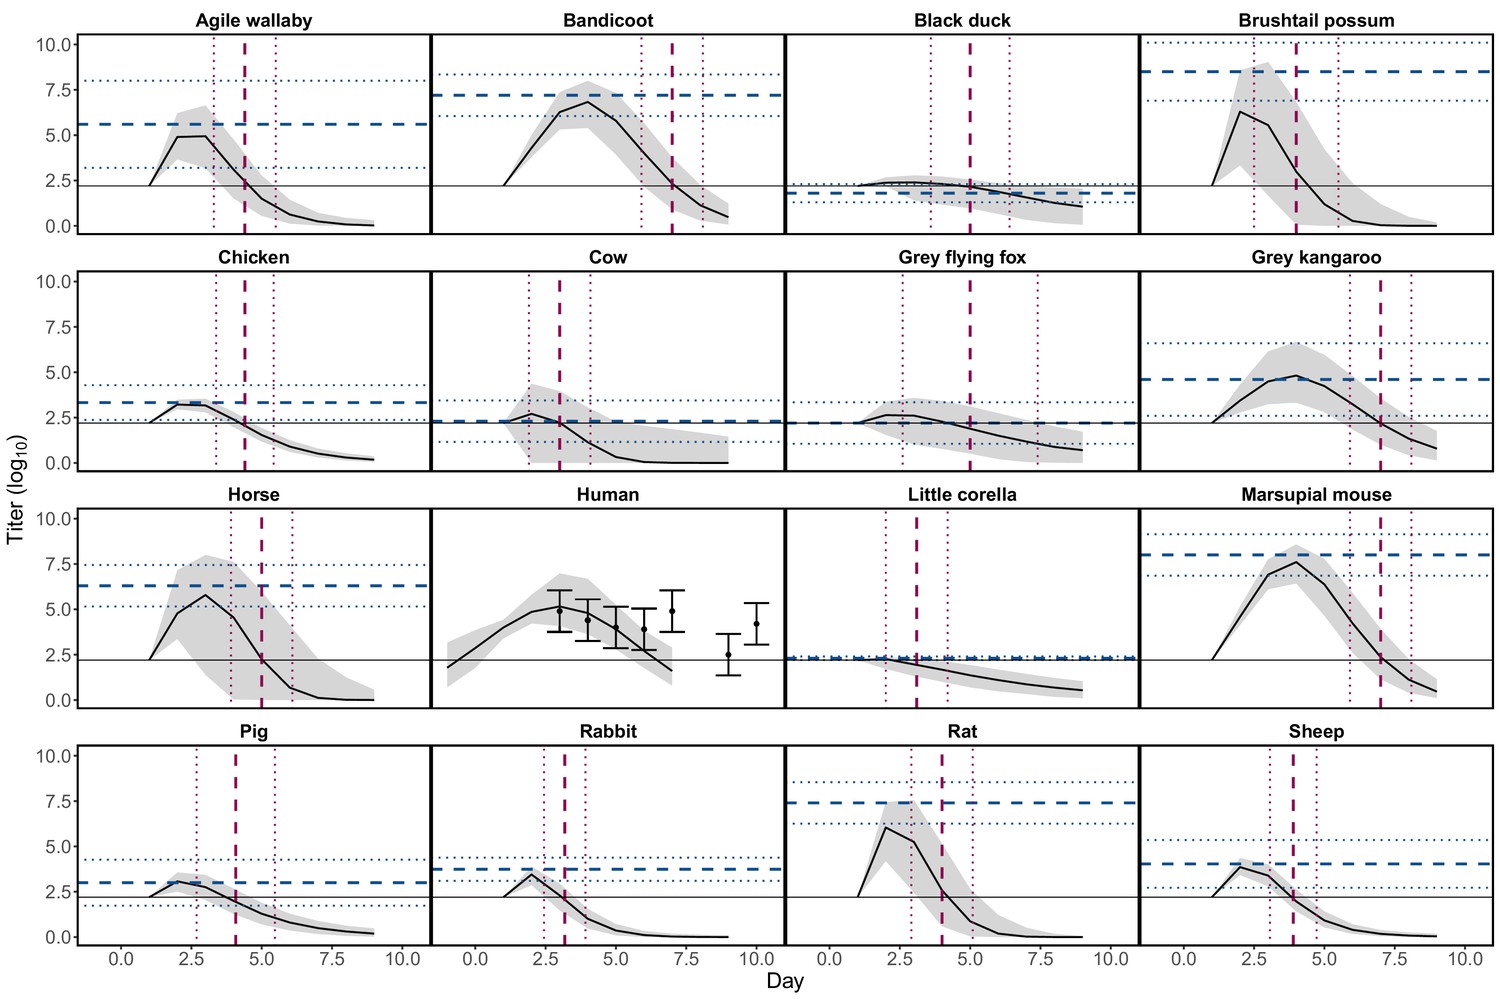
Continuous virus titer profiles over hosts’ infectious periods constructed using empirical estimates of peak titer and titer duration.
For all non-human species ‘Day’ represents days since experimental exposure to Ross River virus (RRV). Solid black curves and gray envelopes show predicted medians and 95% CI calculated from all simulated titer curves. Horizontal dashed blue lines show empirically estimated peak titers (Supplementary file 1) for each species and horizontal dotted blue lines show ± 1 SD. Vertical dashed red lines show empirically estimated end dates of detectable titer and vertical dotted red lines show ± 1 SD. Horizontal solid black lines show the maximum detectable titer. For humans, points show reported means from raw data and error bars show ± 1 SD. The human titer data is shifted in time for visualization purposes (in the raw data the first observation of human titer is recorded on day 1 of symptoms not exposure). Our predictions for humans ignore the outlier data point pictured at day 10, but do simulate titer on days prior to empirically observed titer. For further details see commenting in the R code available on GitHub: Kain, 2021a.
Appendix 1—figure 2
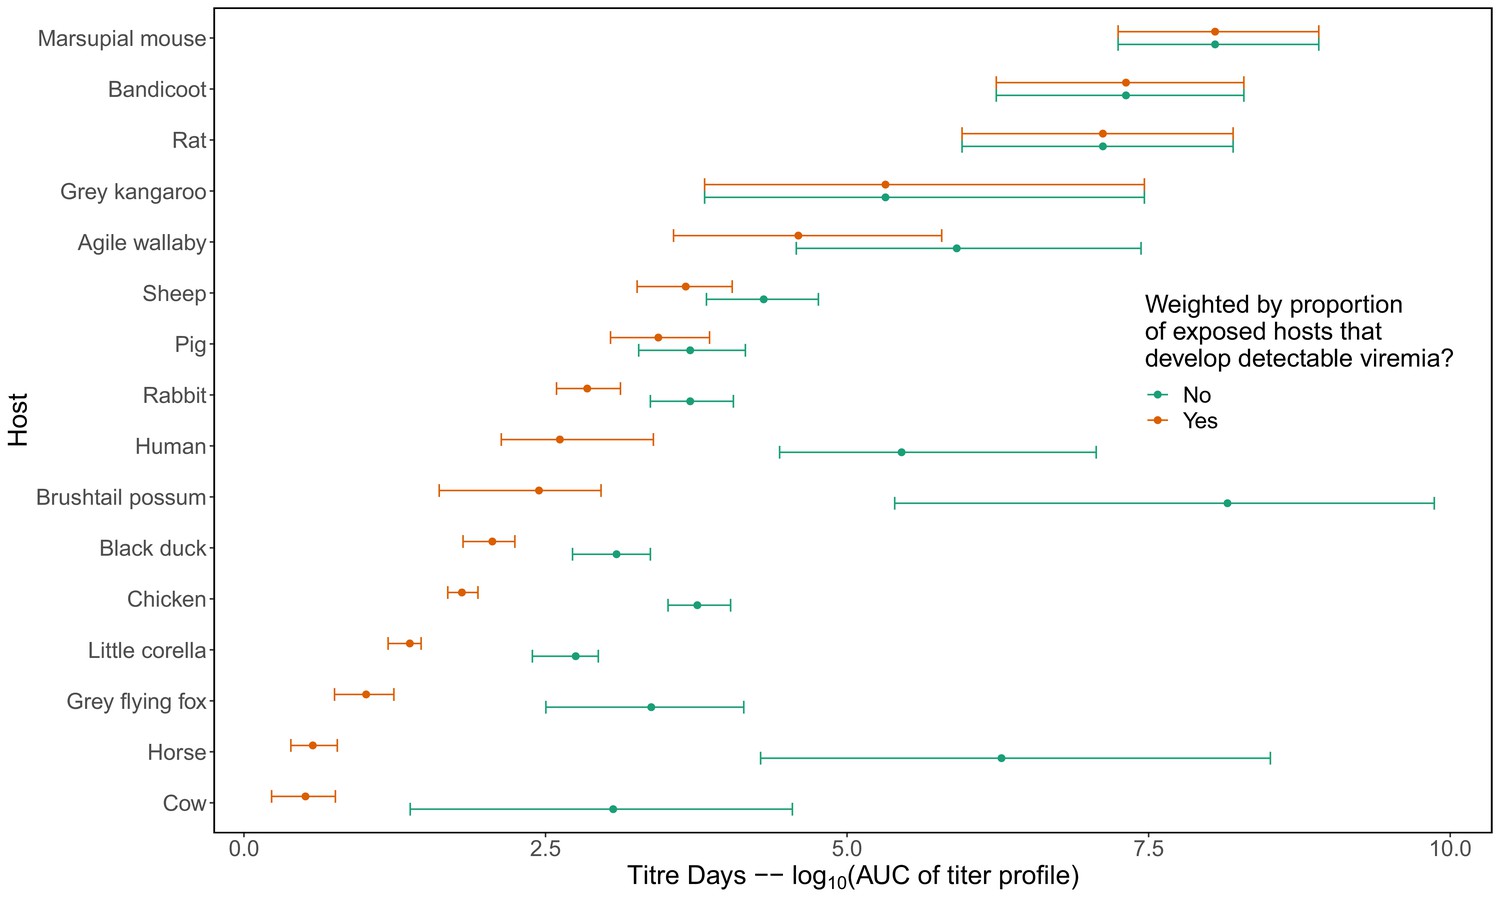
Area under the curve (AUC) calculated from the host virus titer curves pictured in Appendix 1—figure 1.
We use AUC to collapse the continuous host titer curves (Appendix 1—figure 1) into a single metric because it simultaneously captures both the height of the curve (actual titer values) and duration of detectable titer (infectious duration). We use AUC to quantify host physiological responses (see Figure 2A); however, the complete titer curves (Appendix 1—figure 1) are used to host-to-mosquito or mosquito-to-host transmission, not AUC. Orange points and error bars (95% CI) show calculated AUC multiplied by the proportion of all of the individuals of each species that develop detectable viremia when exposed to virus (see Supplementary file 1 for the proportion of individuals of each species that developed a viremic response in infection experiments). Green points and error bars show calculated AUC ignoring ignoring the proportion of hosts that display a viremic response. Note, for example, the large difference in the physiological competence of horses using these two metrics; horses have been considered important hosts historically, although this claim has ignored the large proportion that do not produce detectable viremia (see Stephenson et al., 2018).
Appendix 1—figure 3
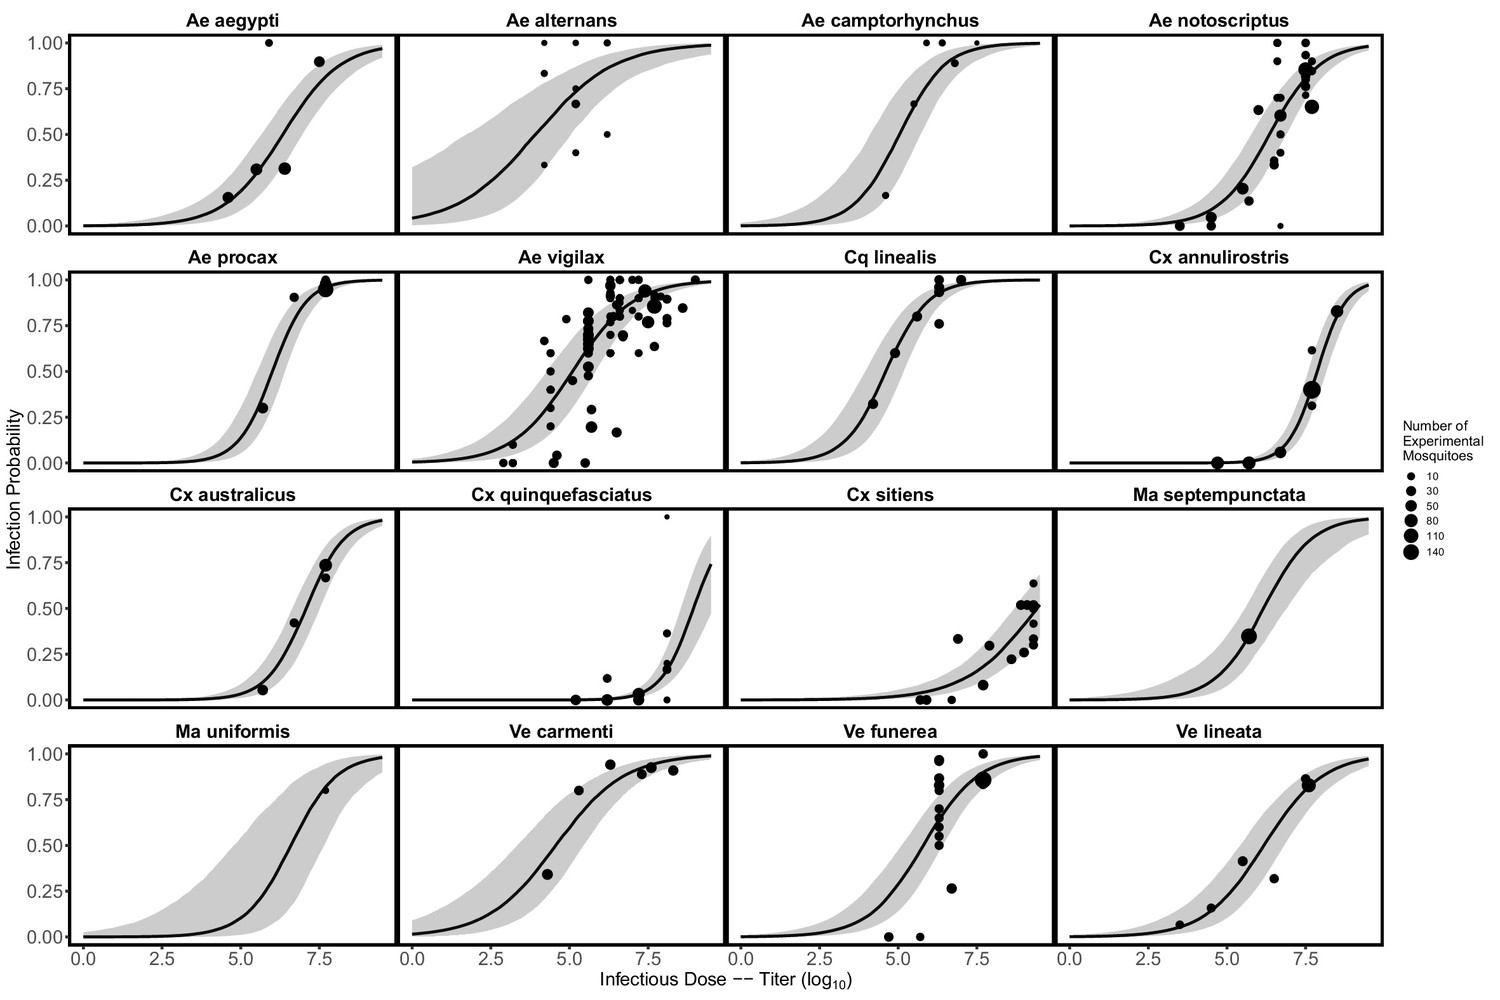
Probability mosquitoes become infected with Ross River virus as a function of infectious dose.
Data points show the proportion of mosquitoes with infection detected at a given infectious dose in laboratory experiments; point size reflects the total number of mosquitoes exposed to infection. Model predictions are from a binomial GLMM, with dose as a fixed effect and mosquito species as a random effect (intercept and slope over dose), which was fit in R using the package lme4 (Bates et al., 2015). Solid black lines show predicted medians, and gray envelopes are 95% CI constructed from the conditional modes and conditional covariances of the random effect (for further details see the code on GitHub: Kain, 2021a).
Appendix 1—figure 4

Probability over time that an infected mosquito transmits Ross River virus to a susceptible host given a feeding event.
Data points show the proportion of mosquitoes transmitting virus in laboratory experiments ; point size reflects the total number of mosquitoes exposed to infection and color shows the experimental dose mosquitoes were exposed to. Model predictions are from a binomial GLMM, with day as a fixed effect and random effects of mosquito species (intercept and slope over day) and reference (intercept), fit in R using the package lme4 (Bates et al., 2015). Solid black lines show predicted medians, and grey envelopes are 95% CI constructed from the conditional modes and conditional covariances of the random effect. We did not include dose as a fixed effect because of model fitting/parameter identifiability issues, but show the doses used in the laboratory experiments here (color). Dotted lines connect data points that are from the same experiment.
Appendix 1—figure 5
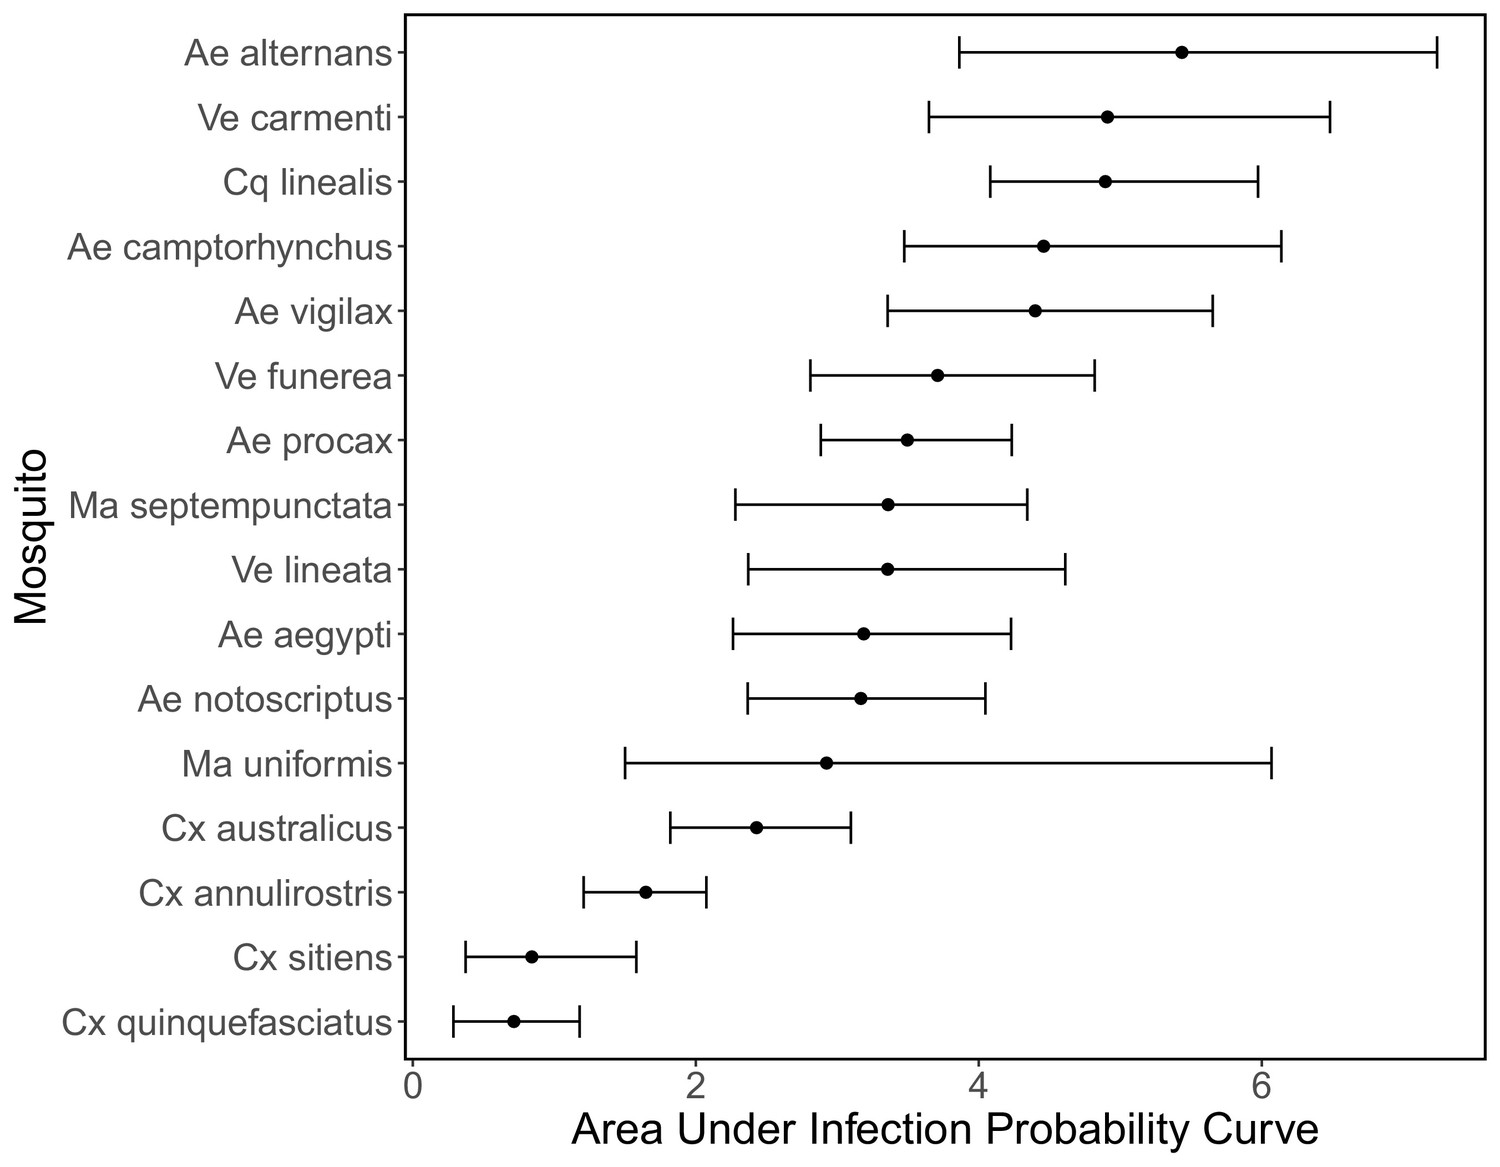
Area under the curve of the mosquito infection probability curves shown in Appendix 1—figure 3.
Points show medians and error bars show 95% CI.
Appendix 1—figure 6
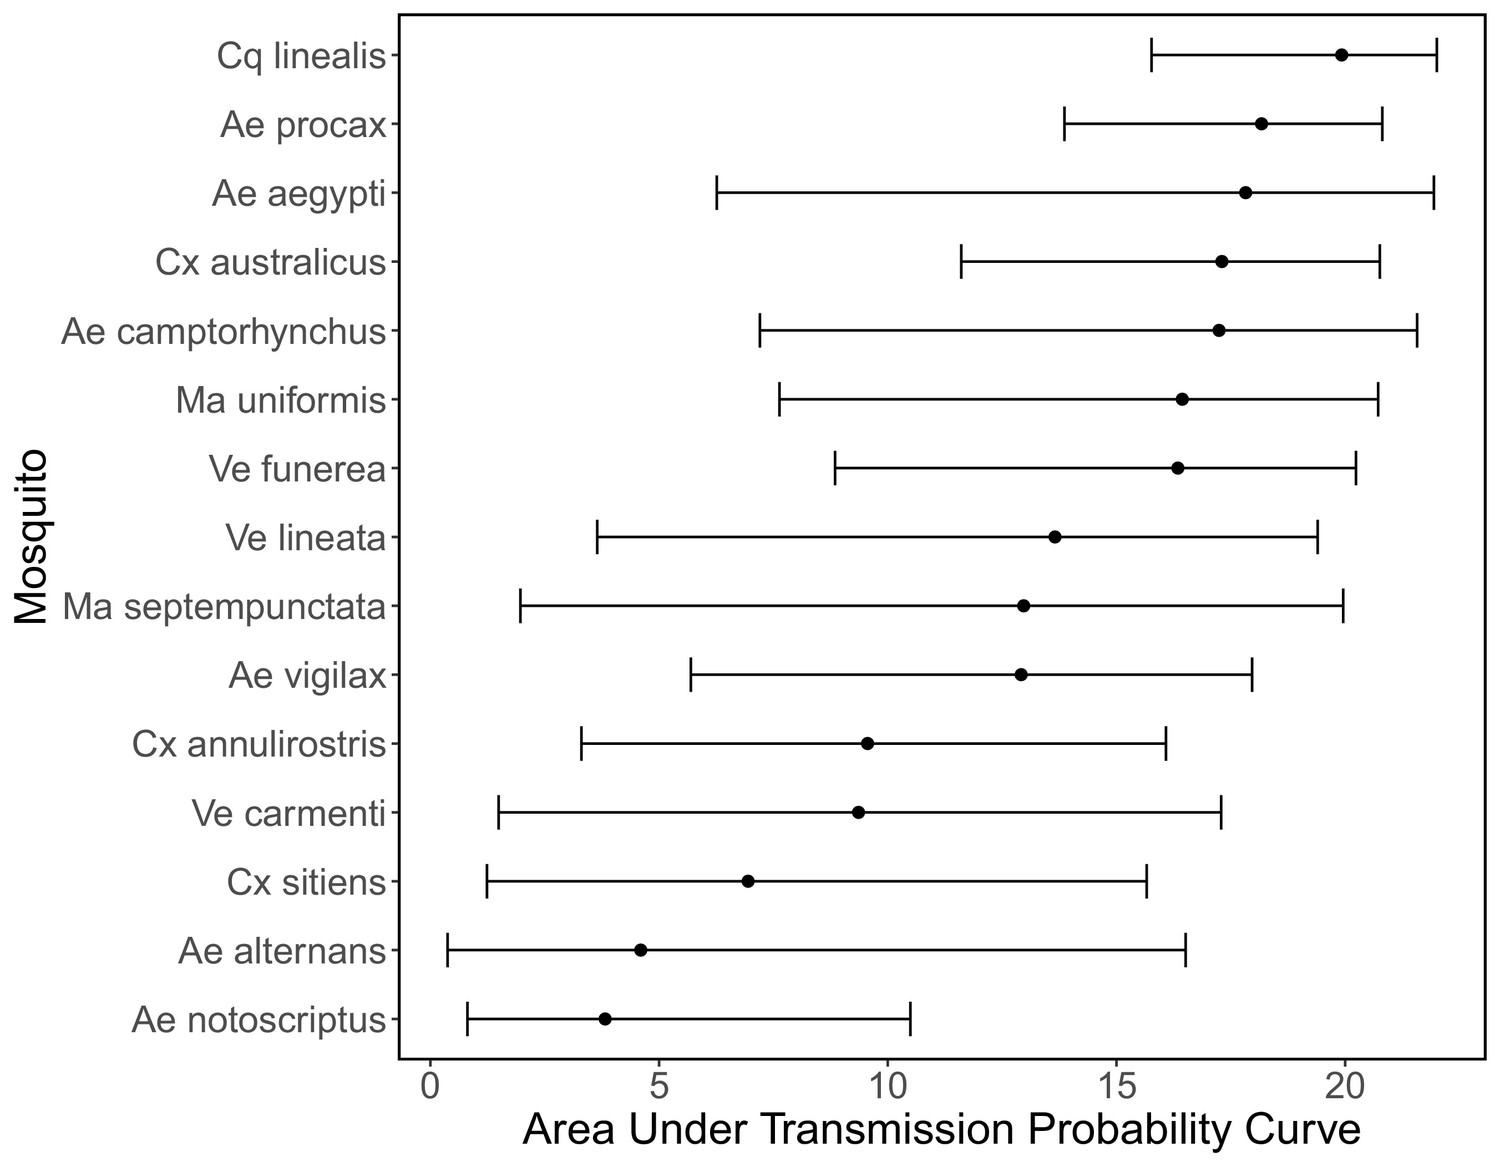
Area under the curve of the mosquito transmission probability curves shown in Appendix 1—figure 4.
Points show medians and error bars show 95% CI. Of all mosquitoes without data just Ve lineata is pictured here as in Appendix 1—figure 4.
Appendix 1—figure 7
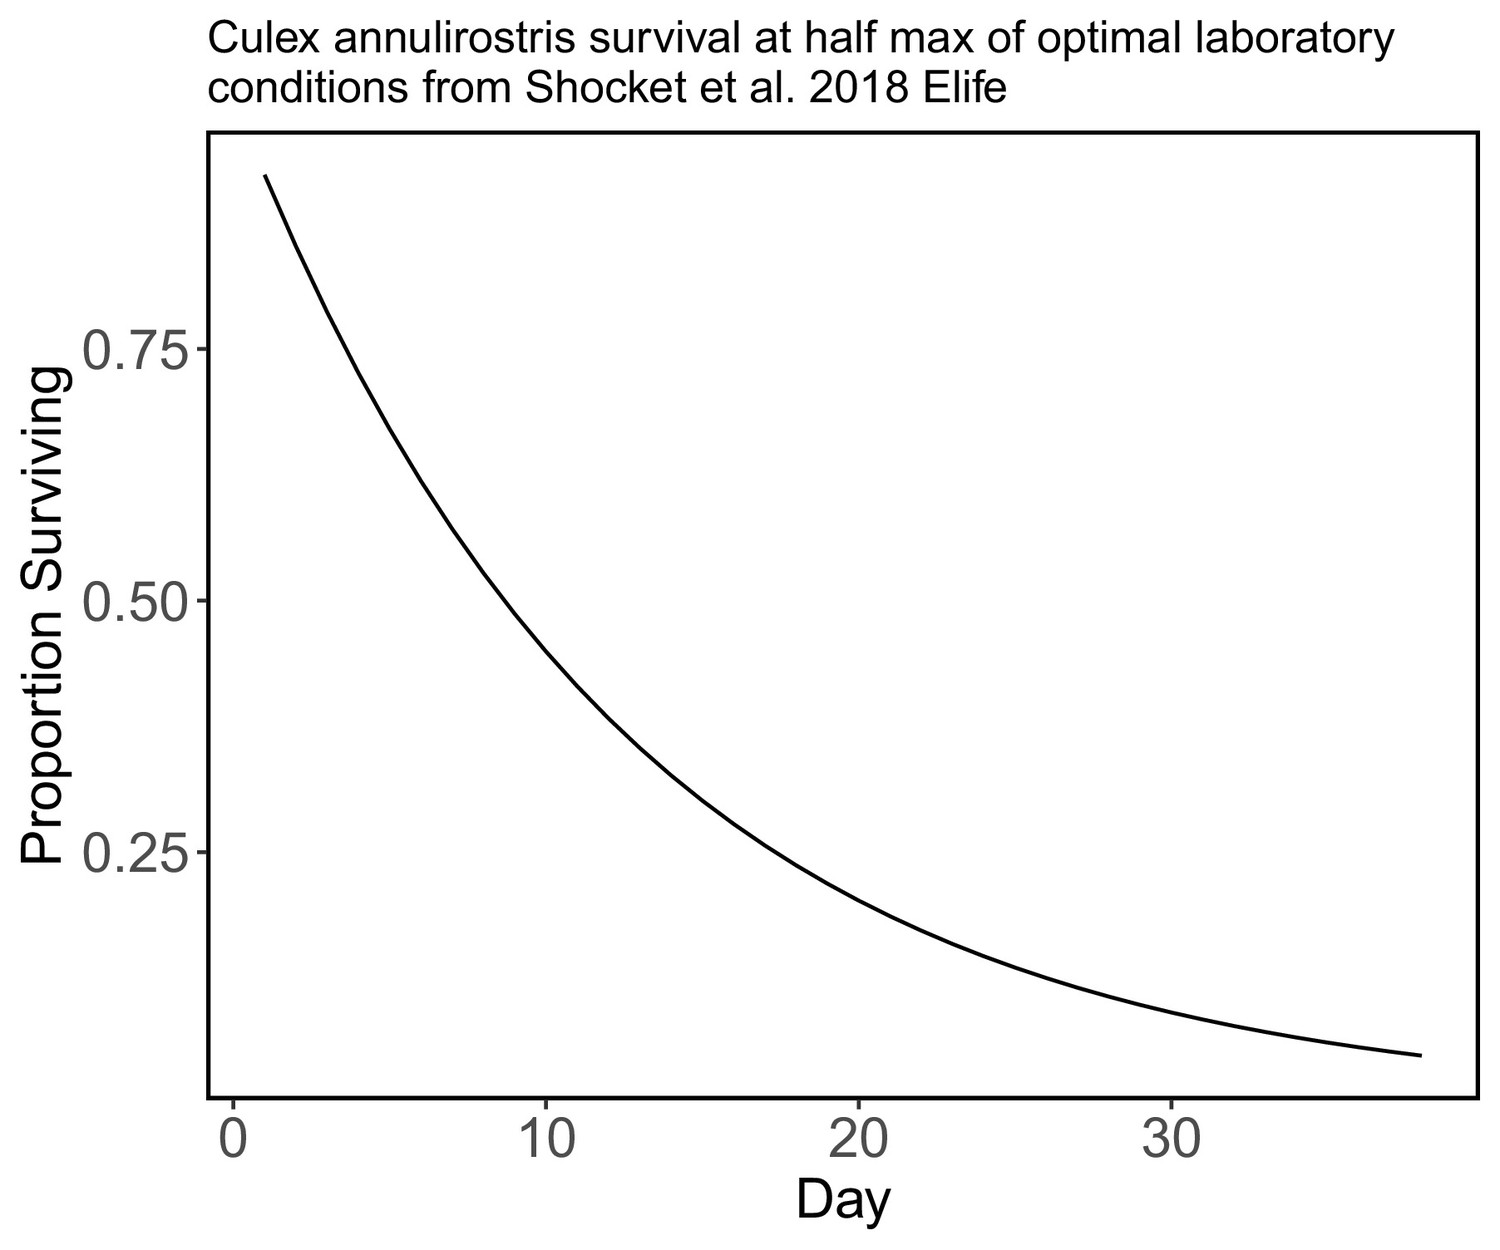
Culex annulirostris daily survival in laboratory conditions using the half-max of survival in optimal conditions.
In the absence of species-specific survival for most of our species we use this survival curve (from Shocket et al., 2018 who used data from McDonald et al., 1980) for all of the species in our model, but assume that survival after day 38 falls to zero.
Appendix 2—figure 1
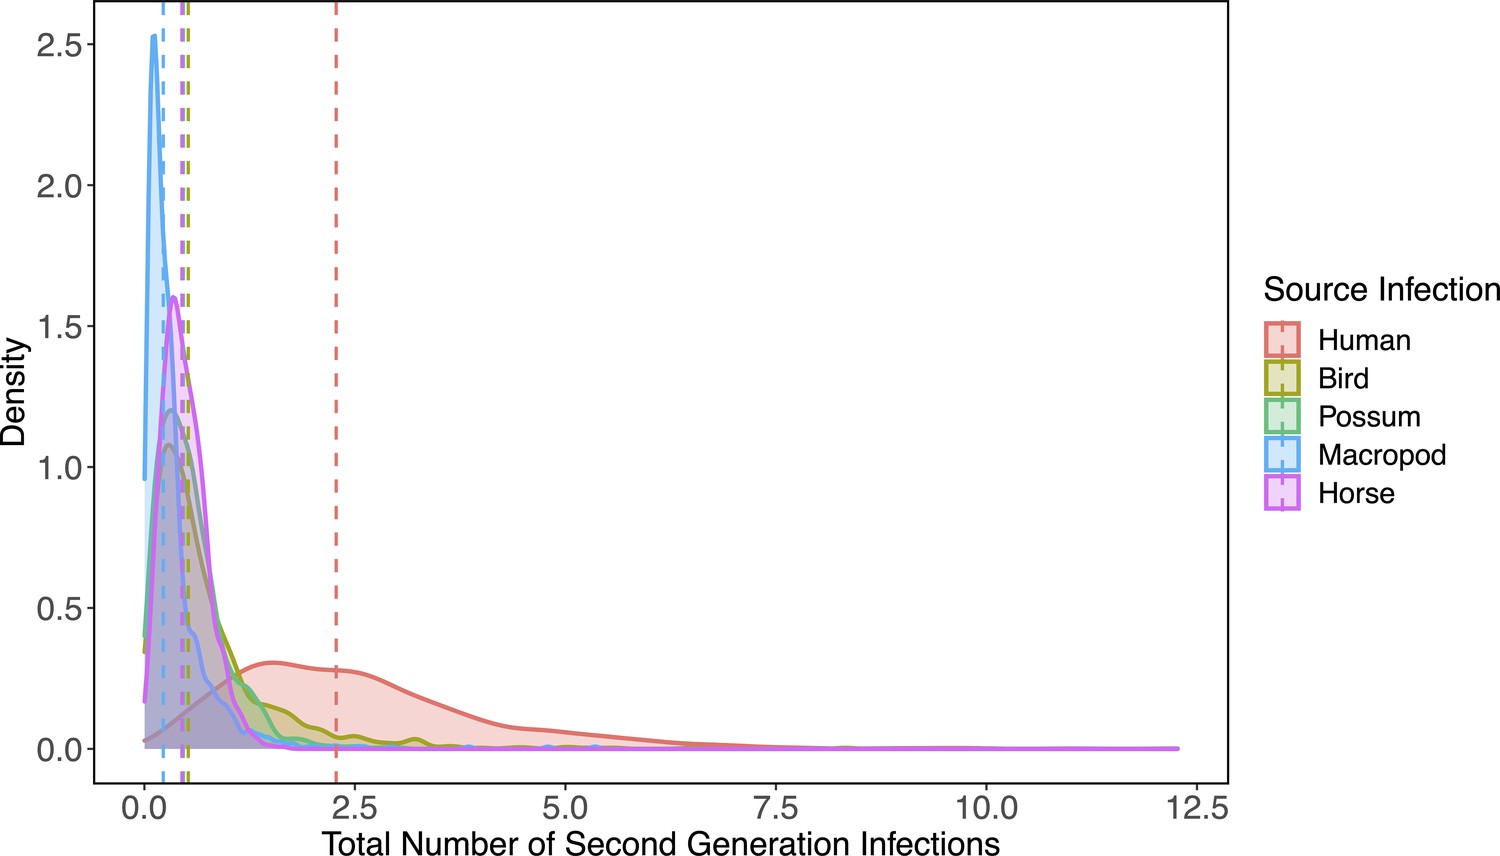
Complete density distributions for total estimated host-to-host transmission for the the top five species by median estimates (humans, birds, possums, horses, macropods).
Distributions show the 1000 samples obtained by propagating uncertainty from all statistical sub-models see Table 1 for details. The vertical dotted lines show distribution medians.
Appendix 2—figure 2
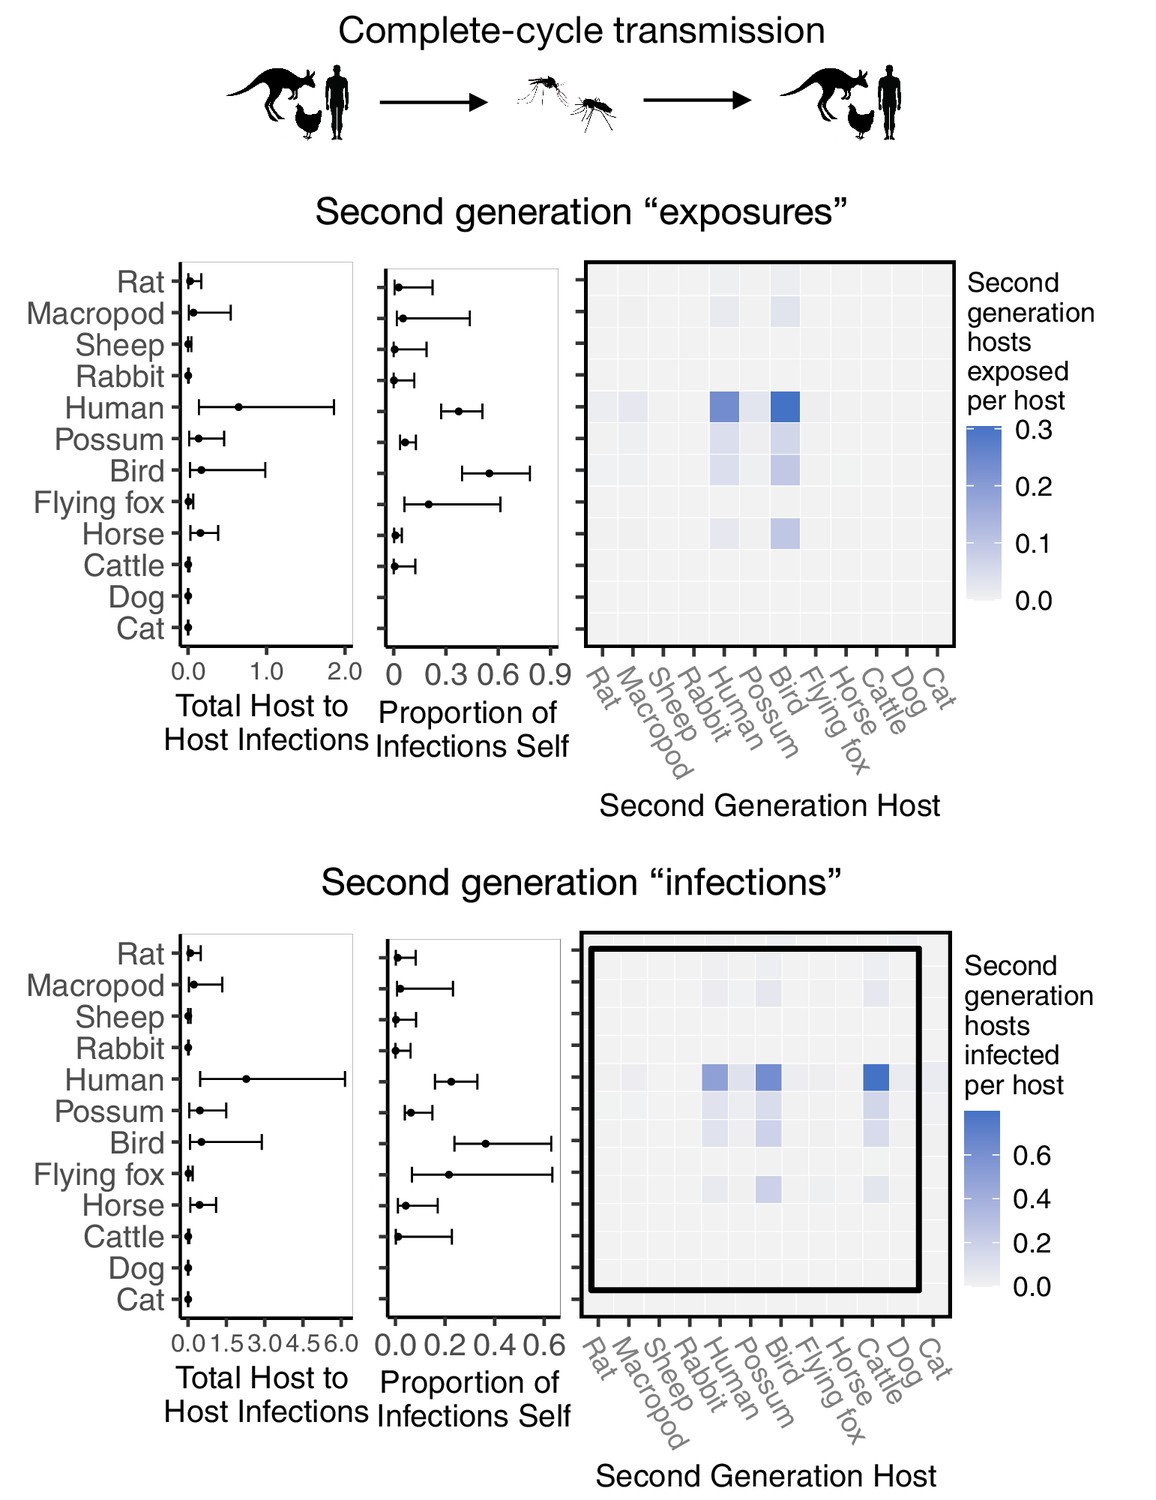
Ross River virus transmission capability of hosts as measured by the number of second generation hosts exposed to infection vs virus transmission capability of hosts as measured by the total number of second-generation hosts that mount a viremic response.
The top panel is recreated from Figure 2C; the bottom row uses the same calculation for transmission but weights all second generation hosts by the proportion of those hosts that display a viremic response (i.e. dogs do not contribute to the sum in the bottom row). Although host ranks do not change depending on the method of quantifying host transmission importance, overall estimates of transmission decrease when removing sink infections (bottom panel).
Appendix 2—figure 3
Ross River virus transmission capability of hosts based on physiological traits alone or with consideration of ecological traits that drive transmission — assuming human titer begins only 1 day prior to symptom onset instead of assuming a full quadratic titer profile as we do in the main text.
A. Physiological response of hosts to experimental infection with RRV, summarized using the area under their estimated titer profiles over time (AUC). In all panels, points show median estimates; error bars are 95% confidence intervals (CIs) that combine the uncertainty from all statistical sub-models used to obtain the estimates presented in that panel (see Figure 1 and Box 1 for these components). Titer profile AUC is used only to quantify host physiological competence, while raw titer profiles (pictured in Appendix 1—figure 1) are used in half-cycle and complete-cycle transmission. The ordering of hosts based on highest (top) to lowest (bottom) physiological competence in A is conserved in B and C to aid visualization of host order changes among panels. B. Host-to-vector transmission; matrices show the median numbers of vectors infected by each host species, while the points show infection totals (sums across matrix rows), with error bars. C. Host-vector-host transmission. As in B, the matrices show median numbers of next-generation host infections for all host species pairs, while the points show sums across rows of the matrices (left plot) and the proportion of infections in the second generation that are in the same species as the original infected individual (center plot).
Appendix 2—figure 4
Ross River virus transmission capability of mosquitoes based on physiological traits alone or with consideration of ecological traits that drive transmission — assuming human titer begins only 1 day prior to symptom onset instead of assuming a full quadratic titer profile as we do in the main text.
A. Physiological response of mosquitoes to experimental infection with RRV, summarized using the area under (AUC) of their estimated infection probability versus dose curves multiplied by the area under their transmission probability versus time curves. Points show median estimates; the error bars in each panel are 95% confidence intervals (CIs) that combine the uncertainty from all statistical sub-models used to obtain the estimates presented in that panel (see Figure 1 and Box 1 for these components). AUC is used only to quantify mosquito physiological competence; raw infection and transmission profiles (pictured in Appendix 1—figure 3 and Appendix 1—figure 4, respectively) are used in calculations of half-cycle and complete-cycle transmission. The ordering of vector species based on highest (top) to lowest (bottom) physiological competence in A is conserved in B and C to aid visualization of vector order changes among panels. B. Vector-to-host transmission; matrices show the median numbers of hosts infected by each vector species, while the points show infection totals (sums across matrix rows), with error bars. C. Vector-host-vector transmission. As in B, the matrices show median numbers of next-generation vector infections for all vector species pairs, while the points show sums across rows of the matrices (left plot) and the proportion of infections in the second generation that are in the same species as the original infected individual (center plot).
Appendix 2—figure 5
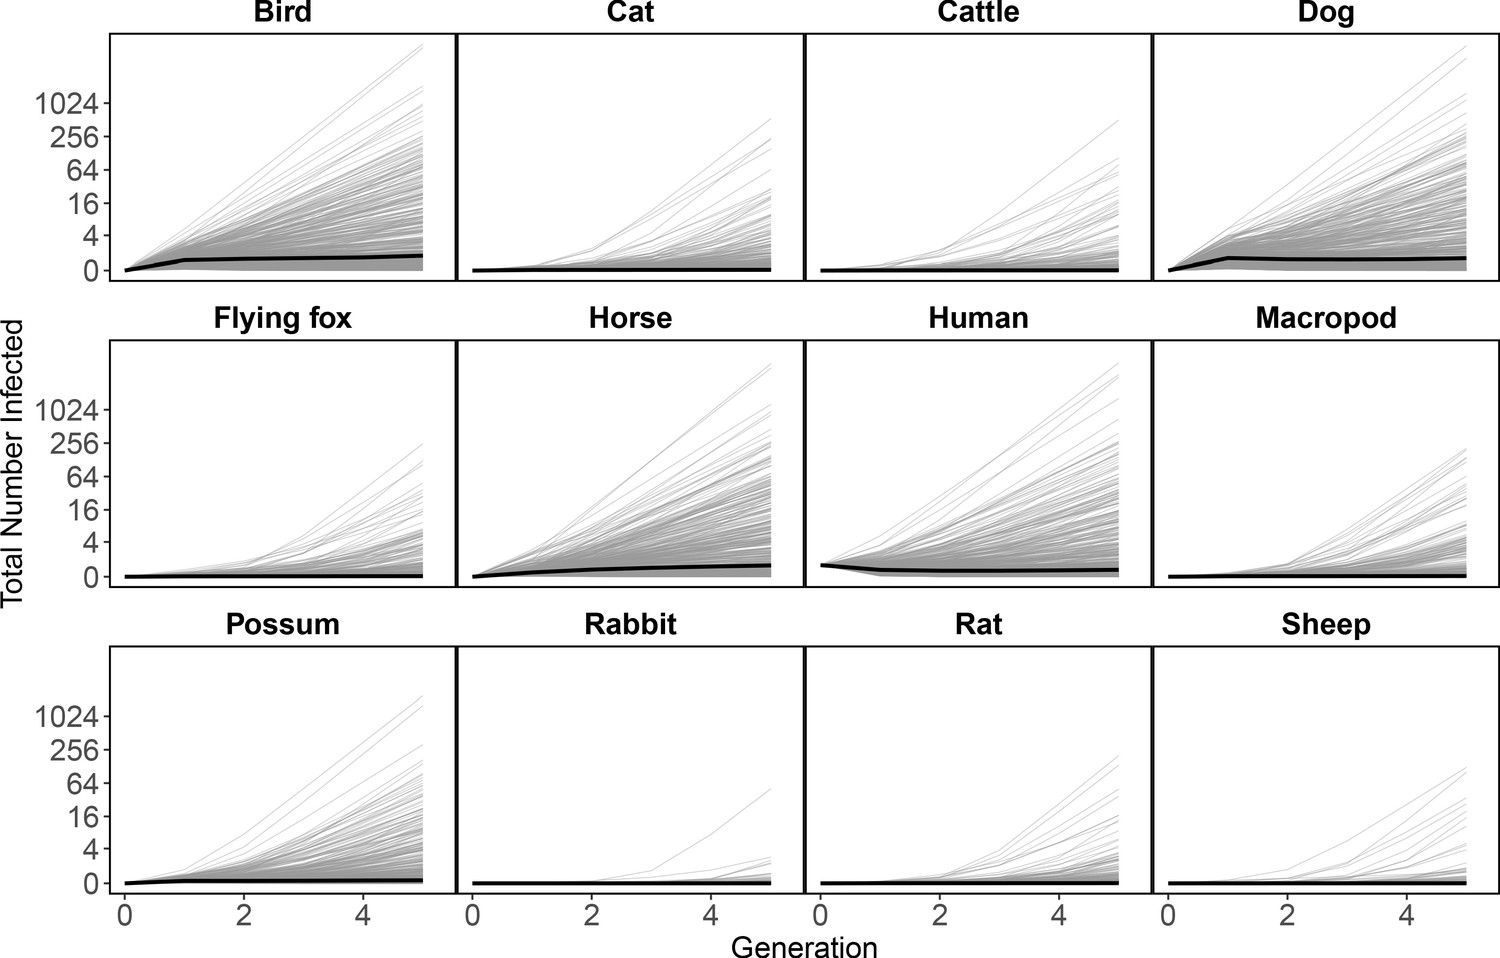
An initial human infection propagates infection through the host community.
Starting with a single infected human in generation ‘zero’ (all hosts begin with zero infected individuals except humans), the next generation matrix approach can be used to approximate (using the time step of a generation) how an epidemic would unfold in the community. Here, we show the total number of new infections of each species as the infection spreads in the community across generations beginning with the source infection in one human. In generation one, all infections arise from the source human infection. In subsequent generations, the plotted number of infections for each species is the estimated total number of infections in that species arising from all transmission pathways. Our median estimate for Ross River virus transmission in Brisbane is just above one, which results in a very slow increase in cases over generations (solid lines); however, large uncertainty for the number of infections produced by each infected host and mosquito (see Figure 2, Figure 3) results in the possibility of explosive epidemics and thousands of infected individual hosts after a few generations. The thin grey black lines are 500 epidemic realizations. Because we assume a fully susceptible host and vector population, this is an epidemic simulation, which would over-estimate the amount of RRV transmission in Brisbane because of the high host immunity in the host population that is ignored here.
Appendix 2—figure 6

An initial Ma. uniformis infection propagates through the mosquito community.
Starting with a single infected Mansonia uniformis in generation ‘zero’, the next generation matrix approach approximates the number of mosquitoes infected in subsequent generations. All generation one mosquito infections arise from the source Ma. uniformis infecting hosts and those hosts infecting mosquitoes; the plotted number of infections for each mosquito species is the estimated total number of infections in that species arising from all transmission pathways. As these results are generated from the same model that produced the results in Appendix 2—figure 5 (simply with a different perspective) median estimates (bold black line) show slightly increasing numbers of infections in mosquitoes over generations. However, large uncertainty for the number of infections produced by each infected host and mosquito (see Figure 2, Figure 3) results in the possibility of explosive epidemics and thousands of infected individual mosquitoes after a few generations. As in Appendix 2—figure 5, the thin grey black lines are 500 epidemic realizations. Because we assume a fully susceptible host and vector population, this is an epidemic simulation, which would over-estimate the amount of Ross River virus transmission in Brisbane because of the high host immunity in the host population that is ignored here.
Appendix 2—figure 7
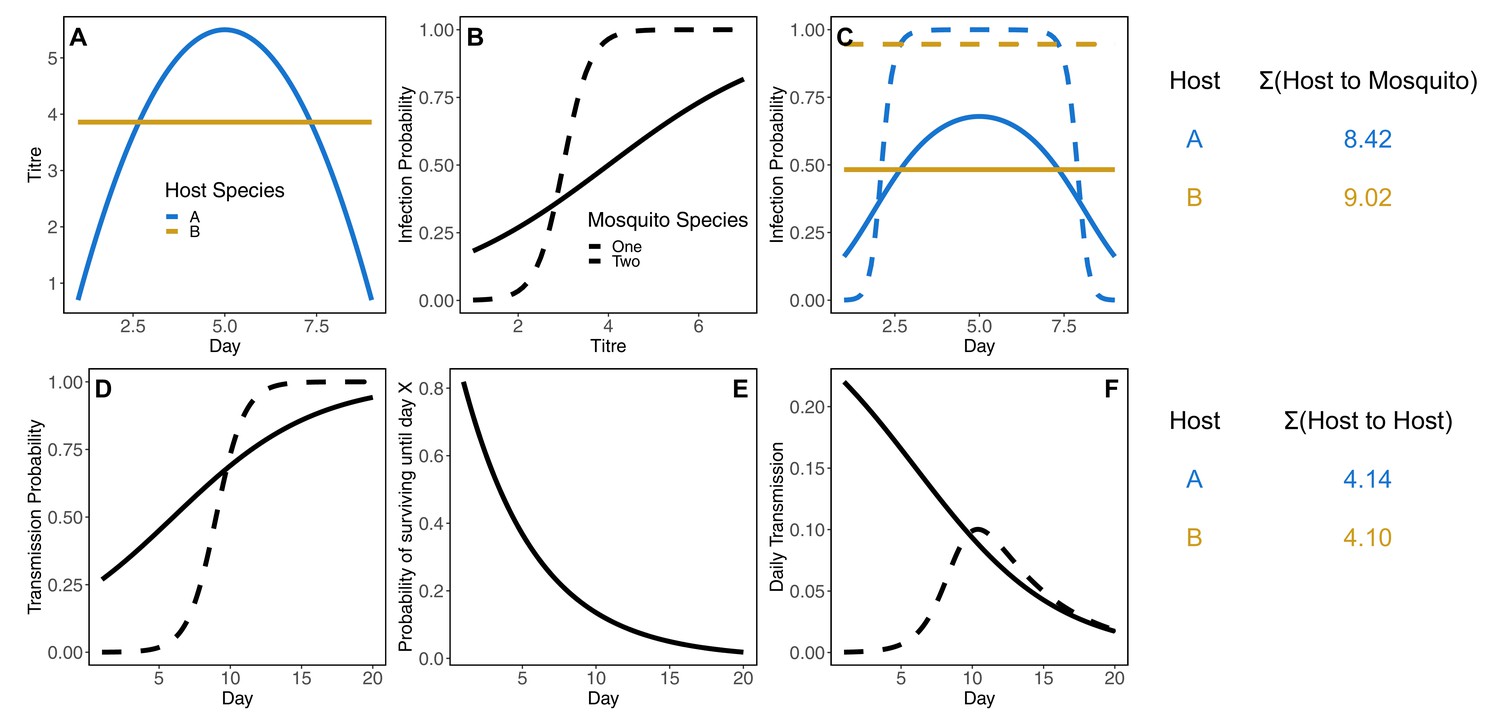
Simulated illustrative example for how host species can change rank between host-to-mosquito (panels A-C) and host-to-host (panels D-F) definitions of competence, even without considering host abundance, mosquito abundance, mosquito biting preference, or differences in mosquito survival (each of these variables makes increases the possible routes to host rank reversal).
In this example, host species A has a more peaked titer curve than host species B (panel A). Here, when each of these host species are bit by two different mosquito species with different infection probability curves (panel B), host species B has an overall higher probability of infecting these two mosquitoes (panel C). To the right of the top panel shows the total number of mosquitoes infected over the course of 8 days of infection in these two host species, assuming five susceptible mosquitoes of each species per host and a daily biting rate of 0.4 for each mosquito species. When these mosquito species differ in their incubation rate and thus transmission probability (panel D), and the same survival probability (differential survival makes the reversal of ranks easier – if mosquito species two has lower survival the gap between host species will widen) even if they have the same survival probability (panel E), they will have different survival-weighted transmission rates per bite over time (panel F). Taking the total number of infected mosquitoes of each species in the host-to-mosquito infection step and multiplying by the total number of transmissions over the mosquitoes lifetime, considering mosquito biting rate, results in host species A producing a fraction more host-to-host infections than species B.
Tables
Table 1
Model components, the transmission metrics in which they are used, and the data and statistical modeling choices used to estimate each.
The column 'Parameter' lists the parameters as they appear in Equation 1 and Equation 2. Abbreviations for the transmission metrics are: HC = host competence; H-to-V = host-to-vector transmission; V-to-H = vector-to-host; H-to-H = host-vector-host; V-to-V = vector-host-vector. The ‘Data’ column lists the name of the Source data file containing the raw data; all citations are listed in the online supplement (Supplementary file 3). Data sources are described in the Supplemental Methods: Data. The ‘Methodological Details’ column lists where in the manuscript methods are described.
| Model Component | Parameter | Transmission Metrics | Data | Statistical Model | Uncertainty | Methodological Details |
|---|---|---|---|---|---|---|
| Proportion of individuals of host species i exposed to infection that produce viremia | HC H-to-V H-to-H V-to-V | host_response.csv human_titer.csv | Raw Data | None (Raw Data) | Methods: Vertebrate hosts: titer profiles; Supplemental Methods: Host physiological competence; Supplementary file 1 | |
| Host titer (in species i on day j) | HC H-to-V H-to-H V-to-V | host_response.csv human_titer.csv | Linear model with a quadratic term for days post infection | 1000 simulated titer curves for each species | Methods: Vertebrate hosts: titer profiles; Supplemental Methods: Host physiological competence; Appendix 1—figure 1; Supplementary file 1 | |
| Proportion of host species i that are seronegative | V-to-H H-to-H V-to-V | host_ seroprevalence.csv | Raw Data | None (Raw Data) | Supplementary file 1 | |
| Infection probability of mosquito species j as a function of dose | VC H-to-V V-to-H H-to-H V-to-V | mosquito_ infection.csv | Generalized linear model (logistic regression) | 1000 samples from a multivariate Normal distribution using the estimated means and vcov matrix | Mosquito vectors: infection and transmission probability; Supplemental Methods: Vector physiological competence; Appendix 1—figure 3; Supplementary file 2 | |
| Transmission probability of mosquito species j r days post infection | VC V-to-H H-to-H V-to-V | mosquito_ transmission.csv | Generalized linear model (logistic regression) | 1000 samples from a multivariate Normal distribution using the estimated means and vcov matrix | Mosquito vectors: infection and transmission probability; Supplemental Methods: Vector physiological competence; Appendix 1—figure 4; Supplementary file 2 | |
| Survival probability of mosquito species j up to r days post infection | V-to-H H-to-H V-to-V | – | Exponential decay using point estimate for daily mortality probability | None | Methods: Mosquito survival; Appendix 1—figure 7 | |
| Proportion of mosquito species j’s blood meals that are obtained from host species i | V-to-H H-to-H V-to-V | mosquito_ feeding.csv host_ abundance.csv | Custom Bayesian regression model | Bayesian posterior | Methods: Mosquito feeding preference; Supplemental Methods: Mosquito feeding preference; Supplementary file 2; Supplementary file 3 | |
| Number of susceptible mosquitoes of species i per host species j | H-to-V H-to-H V-to-V | mosquito_ abundance.csv | Raw Data + Assumption | None (Raw Data + Point Estimate) | ||
| Daily biting rate of mosquito species j | H-to-V V-to-H H-to-H V-to-V | – | Assumption | None (Point Estimate) | Assumed value of 0.5 Day−1 |
Appendix 1—table 1
Reviews suggesting frameworks on how to define the terms ‘host’ and ‘vector’ vary greatly in which physiological and ecological criteria they consider (indicated with ”X’) contribute to the importance of a species as hosts or vectors.
| Reference | Host or vector | Physiological | Ecological | |||||||||
|---|---|---|---|---|---|---|---|---|---|---|---|---|
| Pathogen load (e.g. titre duration and magnitude) | Pathogen detected (e.g. virus isolation) | Immune response (e.g. detectable antibodies) | Survival (i.e. survives long enough to transmit) | Population susceptibility | Abundance | Contact between vector and host | Breeding patterns | Activity patterns | ||||
| DeFoliart et al., 1987 | Host | X | X | X | X | X | ||||||
| Levin et al., 2002 | Host | X | X | X | X | |||||||
| Ashford, 1997 | Host | X | X | X | X | |||||||
| Haydon et al., 2002 | Host | X | X | X | X | |||||||
| Kuno et al., 2017 | Host | X | X | X | X | |||||||
| Cleaveland and Dye, 1995 | Host | X | X | X | ||||||||
| Silva et al., 2005 | Host | X | X | X | X | |||||||
| WHO Scientific Group on Arthropod-Borne and Rodent-Borne Viral Diseases, 1985 | Host | X | X | X | X | X | ||||||
| Scott, 1988 | Host | X | X | X | X | |||||||
| Wilson et al., 2017 | Vector | |||||||||||
| DeFoliart et al., 1987 | Vector | X | X | X | ||||||||
| Kahl et al., 2002 | Vector | X | X | X | ||||||||
| Killick-Kendrick, 1990 | Vector | X | X | X | X | X | ||||||
| Beier, 2002 | Vector | |||||||||||
| WHO Scientific Group on Arthropod-Borne and Rodent-Borne Viral Diseases, 1985 | Vector | X | X | X | ||||||||
Additional files
-
Source data 1
host_response.csv – Viremic responses of non-human vertebrates from experimental infections.
Shown in Appendix 1—figure 1; summarized in Supplementary file 1.
- https://cdn.elifesciences.org/articles/67018/elife-67018-data1-v2.zip
-
Source data 2
human_titre.csv – Viremic response of humans observed during natural infection.
Shown in Appendix 1—figure 1; summarized in Supplementary file 1.
- https://cdn.elifesciences.org/articles/67018/elife-67018-data2-v2.zip
-
Source data 3
mosquito_infection.csv – Laboratory infections of mosquitoes: infection probability.
Shown in Appendix 1—figure 3; summarized in Supplementary file 2.
- https://cdn.elifesciences.org/articles/67018/elife-67018-data3-v2.zip
-
Source data 4
mosquito_transmission.csv – Laboratory infections of mosquitoes: transmission probability.
Shown in Appendix 1—figure 4; summarized in Supplementary file 2.
- https://cdn.elifesciences.org/articles/67018/elife-67018-data4-v2.zip
-
Source data 5
host_abundance.csv – Host densities in Brisbane, Australia.
Summarized in Supplementary file 1.
- https://cdn.elifesciences.org/articles/67018/elife-67018-data5-v2.zip
-
Source data 6
mosquito_feeding.csv – Blood-feeding surveys of mosquito species’ found in Brisbane, Australia.
Summarized in Supplementary file 2.
- https://cdn.elifesciences.org/articles/67018/elife-67018-data6-v2.zip
-
Source data 7
host_seroprevalence.csv – Seroprevalnece of vertebrate hosts in Brisbane, Australia.
Summarized in Supplementary file 1.
- https://cdn.elifesciences.org/articles/67018/elife-67018-data7-v2.zip
-
Source data 8
mosquito_abundance.csv – Abundance of mosquito species in Brisbane, Australia.
Summarized in Supplementary file 2.
- https://cdn.elifesciences.org/articles/67018/elife-67018-data8-v2.zip
-
Supplementary file 1
Table S1: Summary of host data – Summarized host titer, seropositivity, and abundance data.
- https://cdn.elifesciences.org/articles/67018/elife-67018-supp1-v2.docx
-
Supplementary file 2
Table S2: Summary of vector data – Summarized mosquito infection probability, transmission probability, and abundance data.
- https://cdn.elifesciences.org/articles/67018/elife-67018-supp2-v2.docx
-
Supplementary file 3
Table S3: Summary of mosquito blood meal data — Summarized mosquito blood meal data used in the mosquito feeding preference model.
- https://cdn.elifesciences.org/articles/67018/elife-67018-supp3-v2.docx
-
Transparent reporting form
- https://cdn.elifesciences.org/articles/67018/elife-67018-transrepform-v2.pdf
Download links
A two-part list of links to download the article, or parts of the article, in various formats.
Downloads (link to download the article as PDF)
Open citations (links to open the citations from this article in various online reference manager services)
Cite this article (links to download the citations from this article in formats compatible with various reference manager tools)
Physiology and ecology combine to determine host and vector importance for Ross River virus
eLife 10:e67018.
https://doi.org/10.7554/eLife.67018


