Latent gammaherpesvirus exacerbates arthritis through modification of age-associated B cells
- Department of Microbiology and Immunology, The University of British Columbia, Canada
- Department of Pediatrics, Division of Rheumatology, and British Columbia Children's Hospital Research Institute, The University of British Columbia, Canada
Figures
Figure 1 with 1 supplement
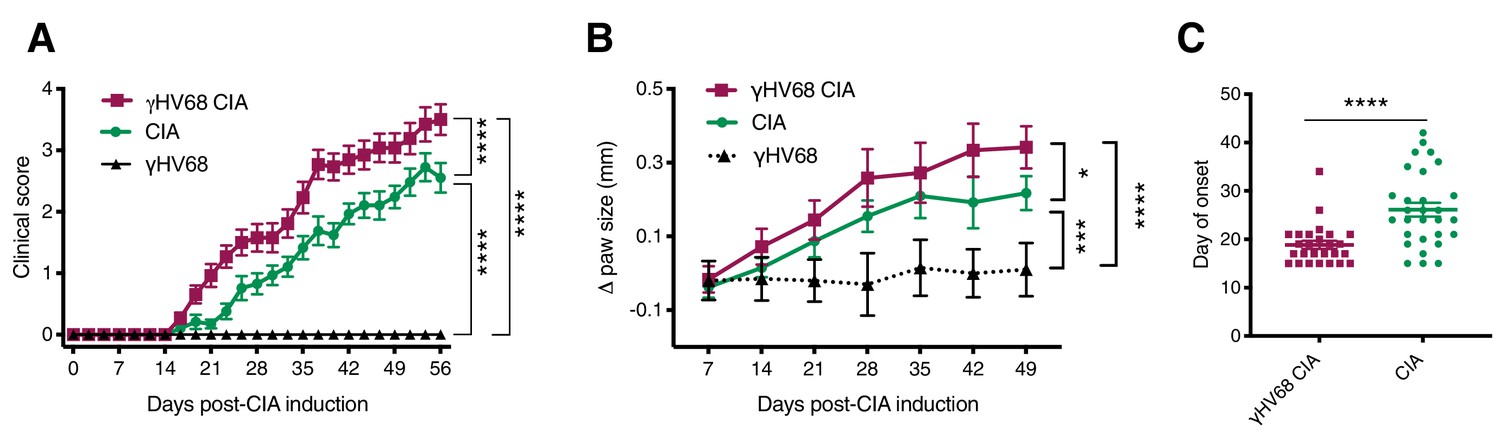
Progression of CIA in latent γHV68-infected and control uninfected mice.
(A) Clinical score (y-axis) of collagen-induced arthritis (CIA) measured three times weekly for 8 weeks (x-axis; days) post-CIA induction in mice without (CIA, filled circles) and with latent γHV68 infection (γHV68-CIA, open squares), and starting at day 35 post-infection in mice infected with latent γHV68 infection but not induced for CIA (γHV68, filled triangles). (B) Change (Δ, y-axis) in thickness of hind paws measured with calipers once per week and averaged for each mouse, γHV68-CIA and CIA being measured on the day of CIA induction and γHV68 at day 35 post-infection. (C) Day (y-axis) of CIA onset (considered 2 consecutive scoring days of a score of at least 1) in mice (x-axis) without (CIA) and with latent γHV68 infection (γHV68-CIA). Each data point represents an individual mouse. (A–C) Data presented as mean ± SEM. Statistical significance determined by (A, B) two-way ANOVA with multiple comparisons with F-values 329.22 (A) and 17.95 (B), (C) Mann-Whitney test. ****p<0.0001, ***p<0.001, **p<0.01, *p<0.05. (A) n = 10–29 mice per group, four experiments; (B) n = 8–20 mice per group, three experiments; (C) n = 26–29 mice per group, four experiments.
-
Figure 1—source data 1
Progression of CIA in latentγHV68 infected and control uninfected mice source data.
- https://cdn.elifesciences.org/articles/67024/elife-67024-fig1-data1-v2.xlsx
Figure 1—figure supplement 1
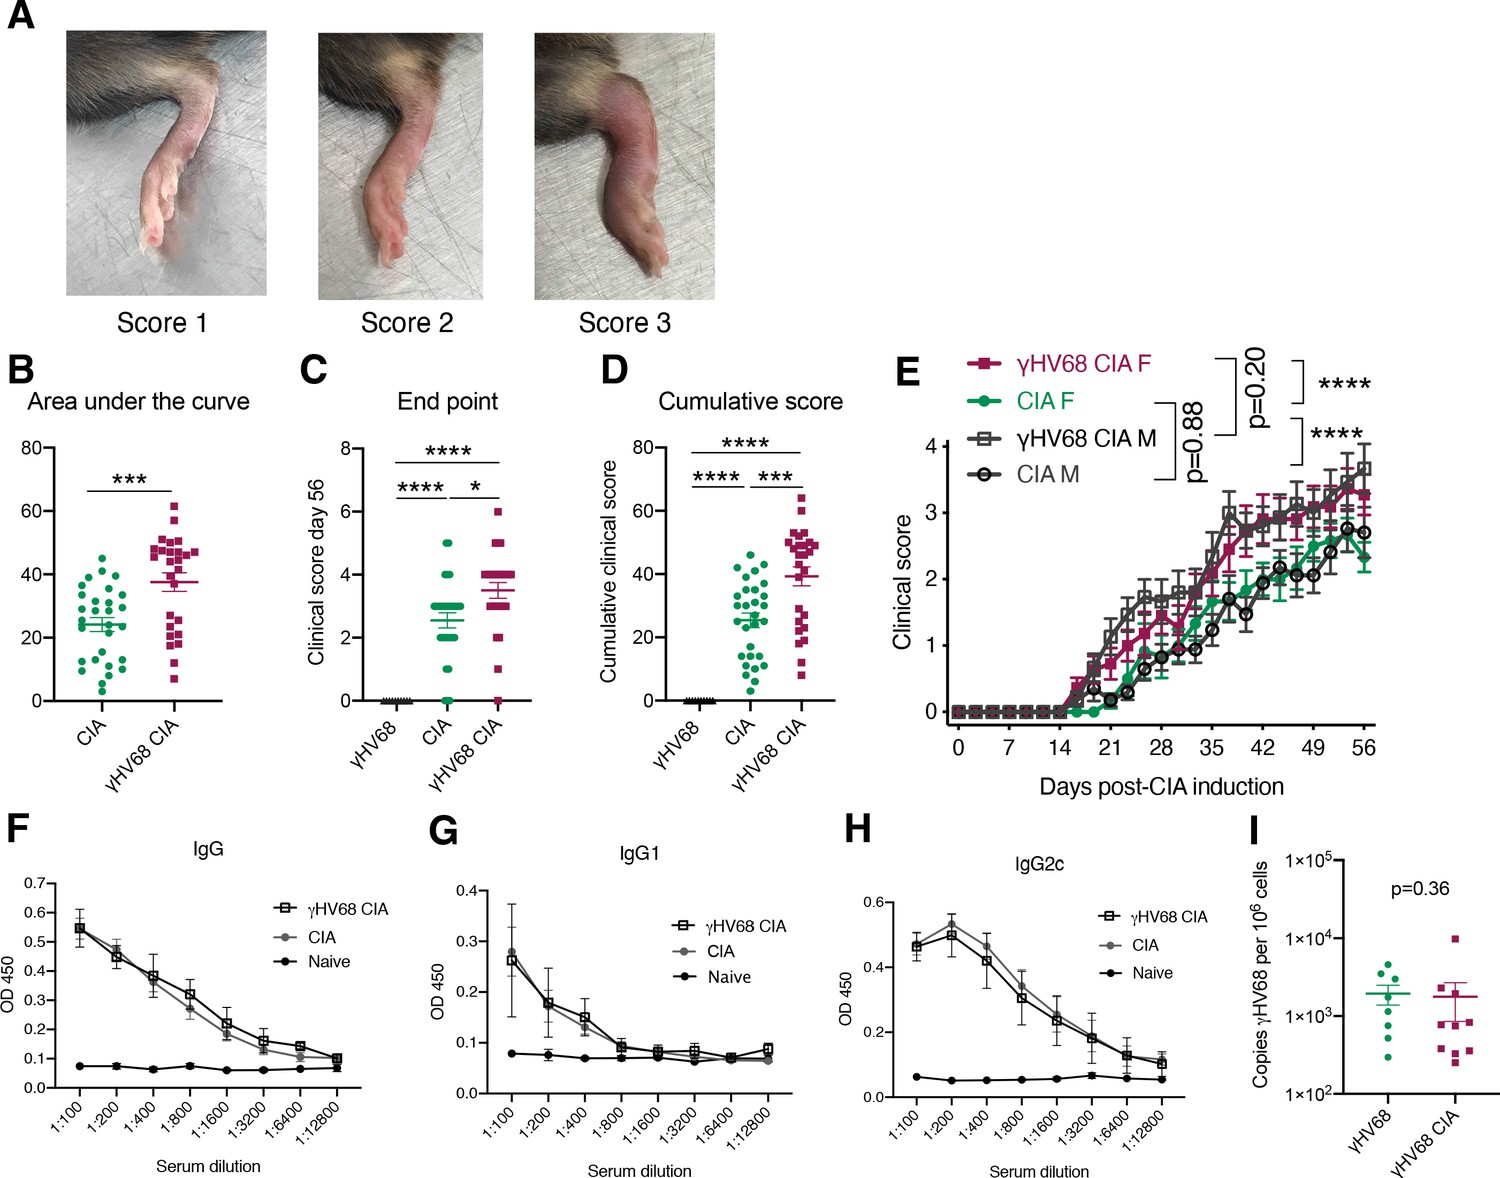
Clinical data, autoantibody titers, and viral load.
(A) Representative photographs of paws with a corresponding collagen-induced arthritis (CIA) clinical score of 1, 2, and 3. (B) Area under the curve, same clinical data as in Figure 1A, each data point representing the total area under the curve for an individual mouse, (C) clinical score per mouse at day 56 post-CIA induction for CIA and γHV68-CIA mice, (D) sum of clinical scores for each individual mouse during the observation period, (E) clinical scores (y-axis) over the course of CIA (x-axis, days post-induction) in mice (n = 11–17 mice per group, same data as in Figure 1A) without (CIA) and with (γHV68-CIA) latent γHV68 infection, separated by sex. (F–H) Optical density (OD, y-axis) reflecting titers (x-axis; dilution of serum) of anti-type II collagen antibodies separated by (F) total IgG, (G) IgG1, and (H) IgG2c in naive (black circles), CIA (gray circles), and γHV68-CIA (open squares) mice; n = 3–4 mice per group. (I) Viral load in the spleen of γHV68 (day 35 p.i.) and γHV68-CIA (56 days post-CIA induction) mice, determined by quantitative PCR (qPCR). Data presented as mean ± SEM. Data presented as mean ± SEM and analyzed by (B, I) Mann-Whitney test, (C–D) one-way ANOVA, and (E) two-way ANOVA with multiple comparisons; *p<0.01, *p<0.05.
-
Figure 1—figure supplement 1—source data 1
Clinical data, autoantibody titers, and viral load source data.
- https://cdn.elifesciences.org/articles/67024/elife-67024-fig1-figsupp1-data1-v2.xlsx
Figure 2
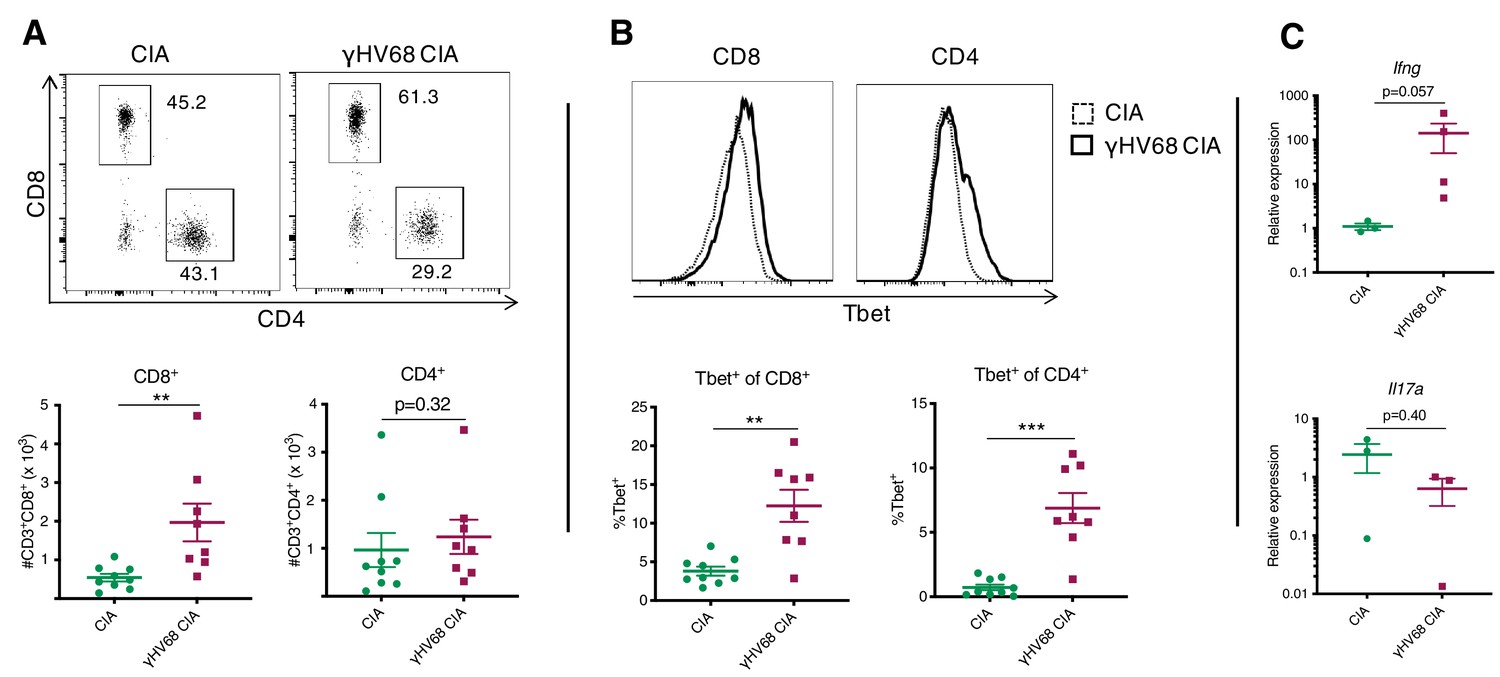
Analysis of immune infiltration to synovium between γHV68-CIA and control CIA mice at day 56 post-CIA induction.
(A) Representative flow cytometry plots of synovial fluid (SF) CD8+ and CD4+ T cells, previously gated on lymphocytes, singlets, live cells, and CD45+CD3+ cells. Flow cytometry plots (concatenated samples) and graphs of total numbers (y-axis) of CD45+CD3+CD8+ and CD45+CD3+CD4+ T cells in uninfected mice with collagen-induced arthritis (CIA) (filled circles) and γHV68-CIA mice (filled squares). (B) Representative flow cytometry plots of Tbet expression (x-axis) by CD8+ or CD4+ T cells in CIA mice (dotted line) and γHV68-CIA mice (solid line). Samples were previously gated on lymphocytes, singlets, live cells, and CD45+CD3+ cells. Percent of CD8+ and CD4+ T cells positive for Tbet (y-axis, gated on a full-minus-one control) in uninfected mice with CIA (filled circles) and γHV68-CIA mice (filled squares). (C) RNA extracted from synovial fluid cells, reverse transcriptase quantitative PCR (RT-qPCR) performed for Ifng and Il17a, and relative expression plotted for uninfected mice with CIA (filled circles) and γHV68-CIA mice (filled squares). (A–B) Flow plots are concatenated samples from all CIA or γHV68-CIA samples from an individual experiment, n = 8–9 mice per group; (C) n = 3–4 mice per group; (A–C) one experiment, data presented as mean ± SEM, analyzed by Mann-Whitney test; ****p<0.0001, ***p<0.001, **p<0.01, *p<0.05.
-
Figure 2—source data 1
Analysis of immune infiltration to synovium betweenγHV68-CIA and control CIA mice at day 56 post-CIA induction.
- https://cdn.elifesciences.org/articles/67024/elife-67024-fig2-data1-v2.xlsx
Figure 3 with 1 supplement

Flow cytometry analysis of spleen and ILN T cells at day 56 post-induction of γHV68-CIA and control CIA mice.
(A–D) Representative flow cytometry plots of spleen samples previously gated on lymphocytes, live cells, singlets, CD45+CD3+ cells, and (A, D) CD4+ cells, (C) CD8+ cells, of uninfected mice with collagen-induced arthritis (CIA) (upper plot) and γHV68-CIA mice (lower plot). (A, C) Side-scatter (SSC) plotted on the y-axis. (A–D) Percent of immune subsets (y-axis) in the spleens of uninfected mice with CIA (filled circles) and γHV68-CIA mice (filled squares). (A) %FoxP3+ of CD4+; (B) %CD3+CD8+ and %CD3+CD4+ of CD45+; (C) %IFNγ+ of CD8+; (D) IFNγ+ or IL17A+ of CD4+; (E) RNA extracted from inguinal lymph node (ILN) cells, real-time quantitative PCR (RT-qPCR) performed for Ifng and Il17a, and relative expression plotted for uninfected mice with CIA (filled circles) and γHV68-CIA mice (filled squares). (A) n = 12–17 mice per group, three experiments; (B) n = 14–17 mice per group, three experiments; (C, D) n = 19–22 mice per group, three experiments; (E) n = 4–8 mice per group, one experiment. (A–E) Each data point represents an individual mouse. Data presented as mean ± SEM, analyzed by Mann-Whitney test; ****p<0.0001, ***p<0.001, **p<0.01, *p<0.05.
-
Figure 3—source data 1
Flow cytometry analysis of spleen and ILN T cells at day 56 post-induction ofγHV68-CIA and control CIA mice.
- https://cdn.elifesciences.org/articles/67024/elife-67024-fig3-data1-v2.xlsx
Figure 3—figure supplement 1
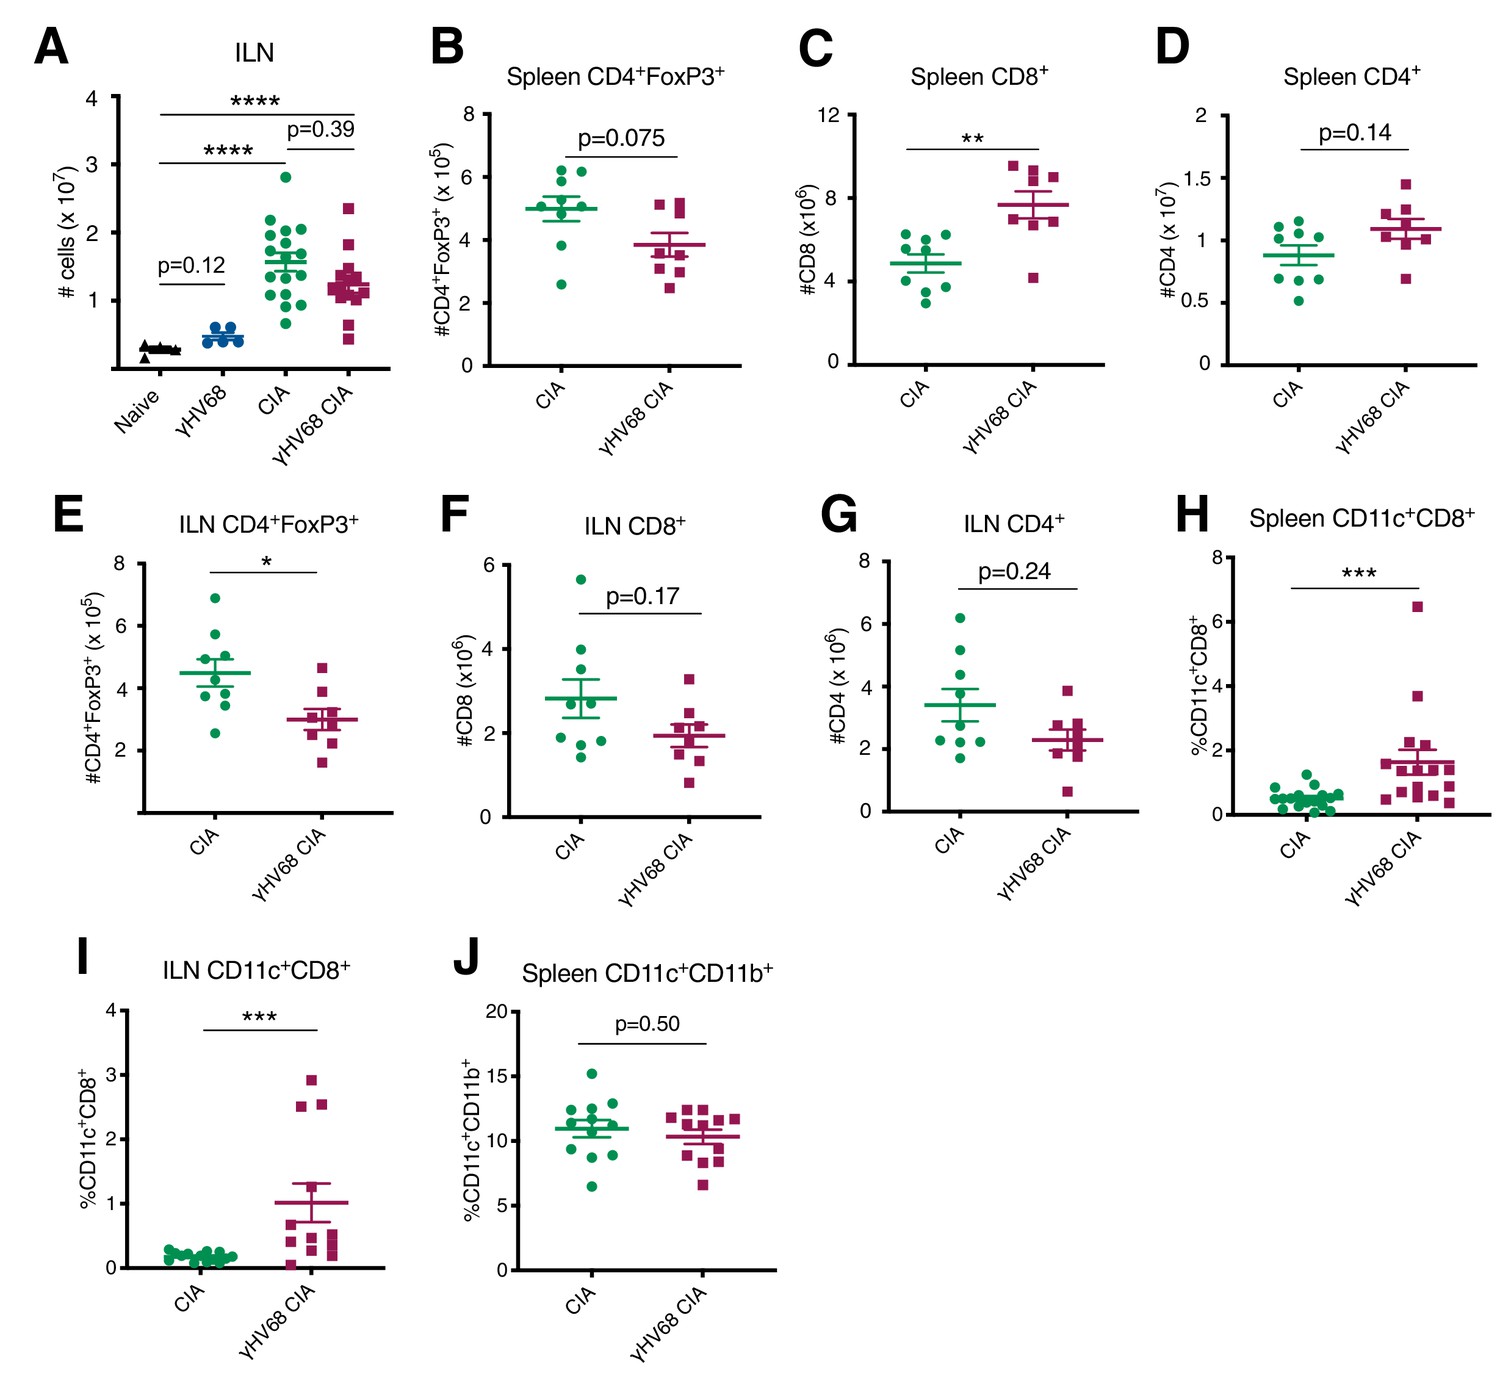
Total numbers of spleen and inguinal lymph node T cell populations at day 56 post-CIA induction.
(A–J) Total numbers of T cell and dendritic cell subsets (y-axis) in the spleen and inguinal lymph nodes (ILNs), as determined by flow cytometry in uninfected mice with collagen-induced arthritis (CIA) (filled circles) and γHV68-CIA mice (filled squares). (A) Total number of cells in the ILN, counted on hemocytometer, (B) total number of CD4+FoxP3+ cells in spleen, (C) total number of CD3+CD8+ cells in spleen, and (D) total number of CD3+CD4+ cells in spleen. (E) Total number of CD4+FoxP3+ cells in ILN, (F) total number of CD3+CD8+ cells in ILN, and (G) total number of CD3+CD4+ cells in ILN. Proportion of CD11c+CD8+ cells of CD45+CD3- in the (H) spleen and (I) ILN. (J) Proportion of CD11c+CD11b+ of CD45+CD19-CD3- in the spleen. (A) n = 4–17 mice per group, three experiments; (B–G) n = 8–9 mice per group, one experiment; (H) n = 16–17 mice per group, three experiments; (I) n = 12–14 mice per group, two experiments; (J) n = 12 mice per group, two experiments. (A–J) Each data point represents an individual mouse. Data presented as mean ± SEM, analyzed by (A) one-way ANOVA, (B–J) Mann-Whitney test; ****p<0.0001, ***p<0.001, **p<0.01, *p<0.05.
-
Figure 3—figure supplement 1—source data 1
Total numbers of spleen and inguinal lymph node T cell populations at day 56 post-CIA induction.
- https://cdn.elifesciences.org/articles/67024/elife-67024-fig3-figsupp1-data1-v2.xlsx
Figure 4

Disease progression and immune profile of latency-free ACRTA-γHV68 CIA mice compared to γHV68-CIA and CIA mice.
Collagen-induced arthritis (CIA) was induced in C57BL/6J mice after 5 weeks of mock, γHV68, or ACRTA-γHV68 infection, and mice scored for clinical disease until 56 days post-CIA induction. At 56 days post-CIA induction, spleens and synovial fluid were collected and processed for flow cytometry. A proportion of the CIA and γHV68-CIA data is repeated from Figure 2. (A) Clinical scores (y-axis) of uninfected mice with CIA (filled circles), γHV68-CIA mice (open squares), and ACRTA-γHV68 CIA mice (open triangles); (B–I) comparison of uninfected mice with CIA (filled circles), γHV68-CIA mice (filled squares), and ACRTA-γHV68 CIA mice (filled triangles). (B) Day (y-axis) of CIA onset, considered two consecutive scoring days of a score of at least 1, in mice (x-axis) without (CIA) and with latent γHV68 infection (γHV68-CIA) or ACRTA-γHV68 infection (ACRTA-γHV68 CIA). (C–I) Immune cell subsets determined by flow cytometry, previously gated on lymphocytes, singlets, live cells, and CD45+ cells; (C) %CD3+CD8+ of CD45+ cells in the spleen; (D) %CD3+CD4+ of CD45+ cells in the spleen; (E) %IFNγ+ of CD8+ cells in the spleen; (F) %IFNγ+ of CD4+ cells in the spleen; (G) IL17A+ of CD4+ cells in the spleen; (H) %FoxP3+ of CD4+ cells in the spleen; (I) number of CD3+CD8+ cells in synovial fluid (SF) determined by flow cytometry. (A–H) n = 9–15 mice per group, two experiments, (I) n = 5–9 mice per group, one experiment. (A–G) Each data point represents an individual mouse. Data presented as mean ± SEM, analyzed by (A) two-way ANOVA with multiple comparisons, F-value = 78.46, (B–I) one-way ANOVA with F-values 6.57 (B), 8.44 (C), 0.053 (D), 11.4 (E), 6.80 (F), 0.29 (G), 10.89 (H), and 5.64 (I); ****p<0.0001, ***p<0.001, **p<0.01, *p<0.05.
-
Figure 4—source data 1
Disease progression and immune profile of latency-free ACRTA-γHV68 CIA mice compared toγHV68-CIA and CIA mice.
- https://cdn.elifesciences.org/articles/67024/elife-67024-fig4-data1-v2.xlsx
Figure 5 with 1 supplement
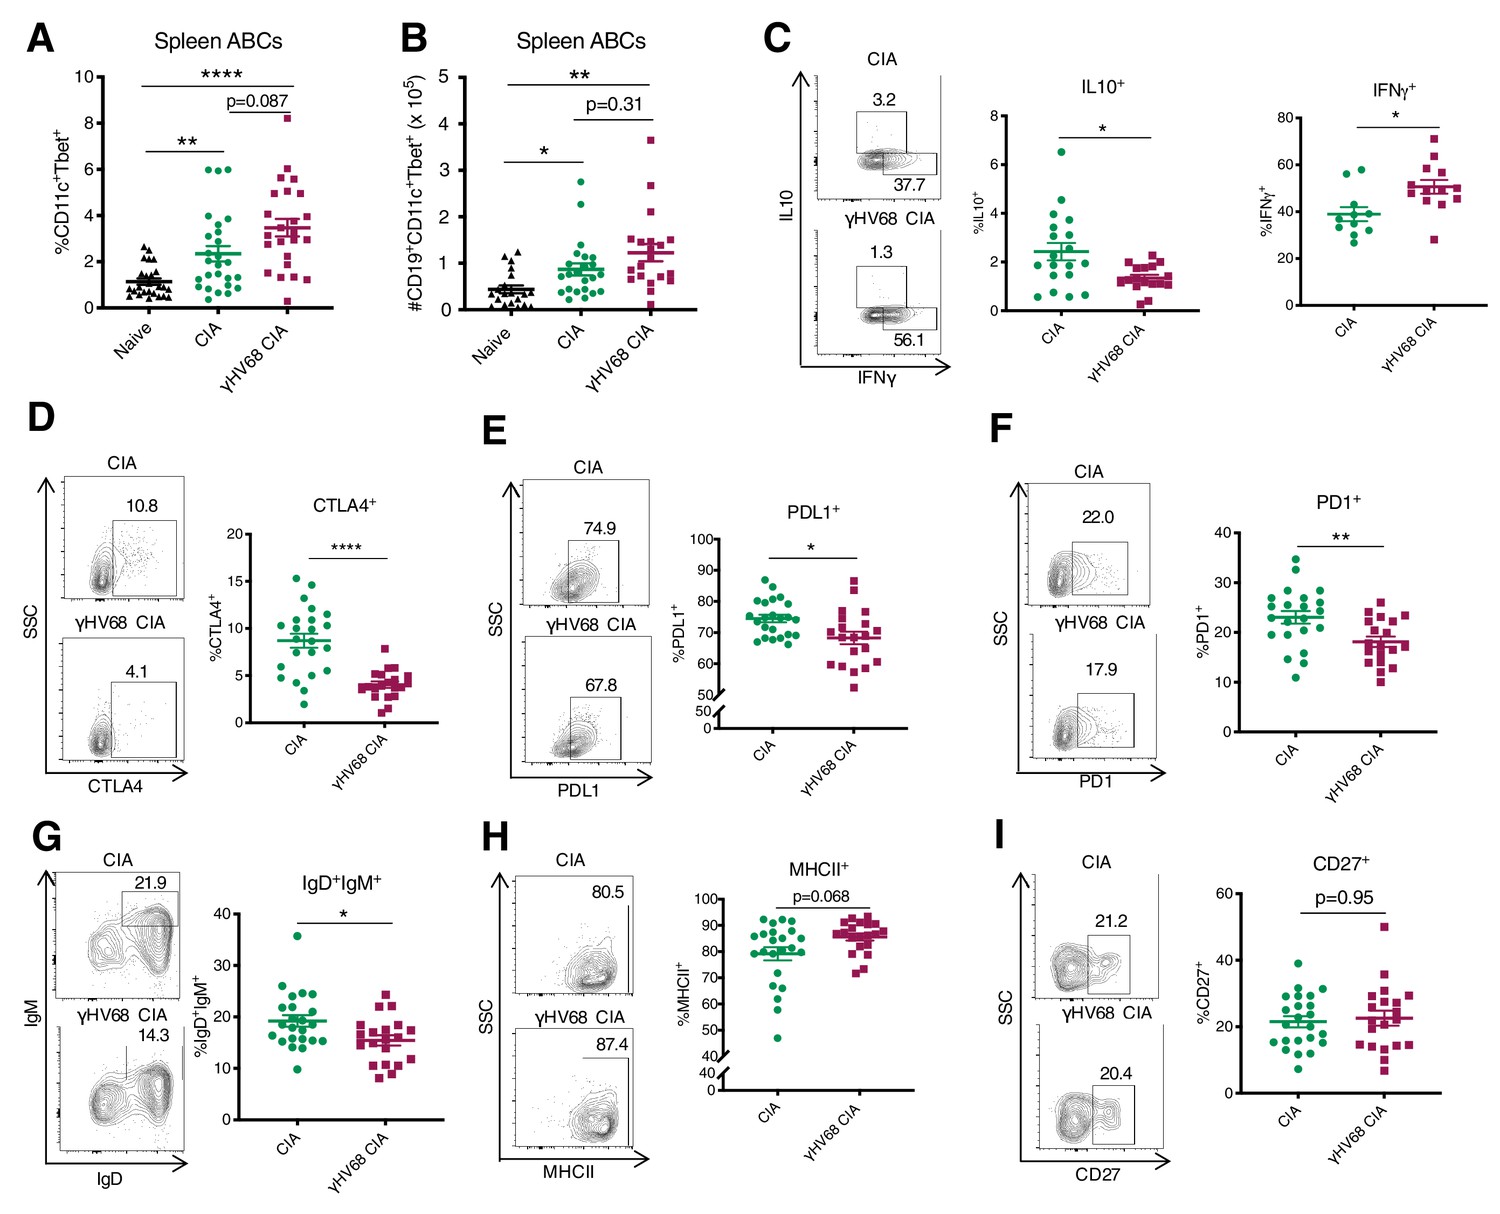
Analysis of ABC amount and phenotype by flow cytometry at 56 days post-CIA induction.
(A) Percentage of age-associated B cells (ABCs) (CD11c+Tbet+) of mature B cells (CD19+IgD-) in the spleen and (B) total numbers of ABCs in the spleen of naive mice (filled triangle), uninfected mice with collagen-induced arthritis (CIA) (filled circles), and γHV68-CIA mice (filled squares). (C–I) Phenotype of ABCs analyzed by flow cytometry. Samples were previously gated on splenic CD19+CD11c+Tbet+ ABCs. Flow plots are representative samples, SSC = side scatter. Proportion of ABCs positive for (C) IL10 and IFNγ, (D) CTLA4, (E) PDL1, (F) PD1, (G) IgD+IgM+, (H) MHCII, and (I) CD27. (A) n = 24–26 mice per group, three experiments, (B) n = 20–23 mice per group, three experiments, (C) n = 16–19 mice per group, two experiments, and (D–I) n = 20–23 mice per group, two experiments. (A–I) Each data point represents an individual mouse. Data presented as mean ± SEM, (A–B) analyzed by Brown-Forsythe and Welch ANOVA tests and (C–I) Mann-Whitney test; ****p<0.0001, ***p<0.001, **p<0.01, *p<0.05.
-
Figure 5—source data 1
Analysis of ABC amount and phenotype by flow cytometry at 56 days post-CIA induction.
- https://cdn.elifesciences.org/articles/67024/elife-67024-fig5-data1-v2.xlsx
Figure 5—figure supplement 1
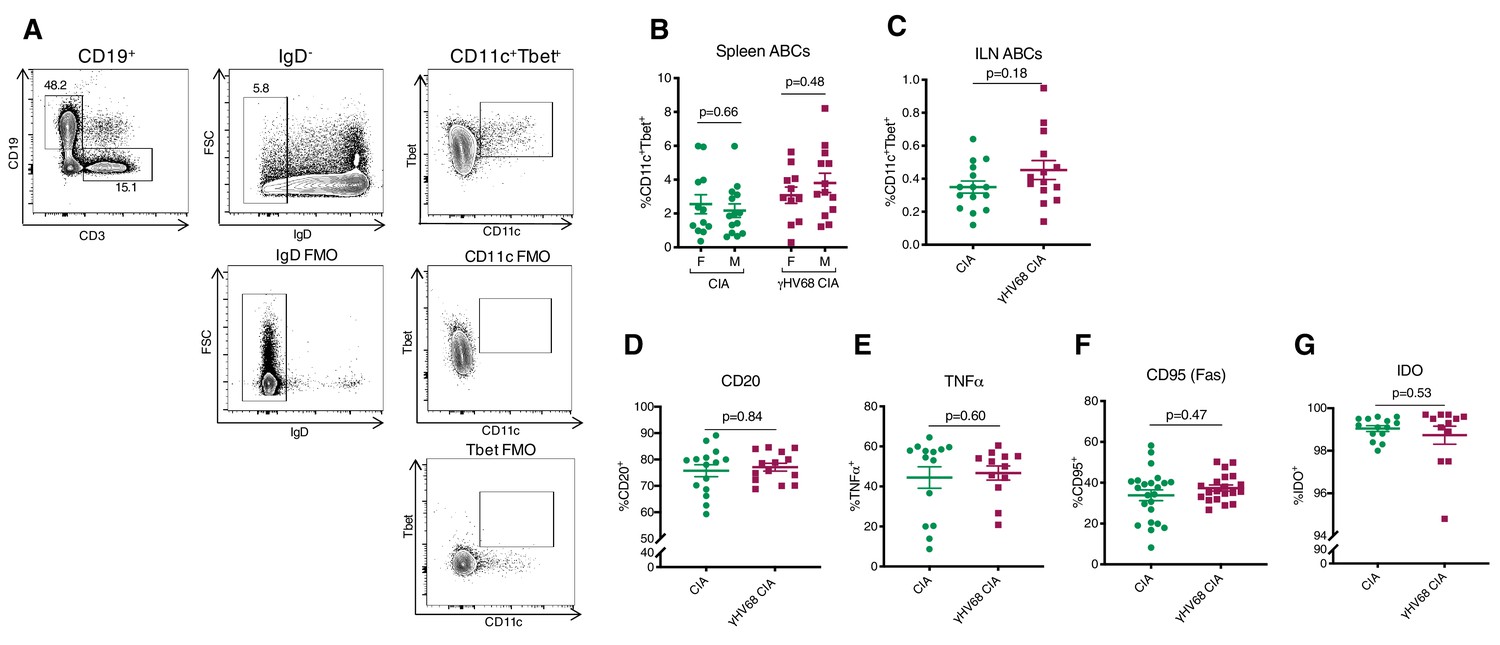
ABCs in the spleen analyzed by flow cytometry at 56 days post-CIA induction.
(A) Representative gating strategy for age-associated B cells (ABCs) in the spleen using full-minus-one (FMO) controls. (B) Proportion of ABCs (CD11c+Tbet+) of mature B cells (CD19+IgD-) in the spleen of female (F) and male (M) mice in uninfected mice with collagen-induced arthritis (CIA) (filled circles) and γHV68-CIA mice (filled squares). Same results as in Figure 5A, separated by sex. (C) Proportion of ABCs (CD19+CD11c+) of mature B cells (CD19+IgD-) in the inguinal lymph nodes (ILNs). (D–F) Proportion of ABCs in the spleen expressing (D) CD20, (E) TNFα, (F) CD95, and (G) IDO, determined by flow cytometry. Samples were previously gated on ABCs (CD19+CD11c+Tbet+). (B) n = 11–14 mice per group, three experiments, (C) n = 14–15 mice per group, two experiments, (D) n = 14–15 mice per group, two experiments, (E, G) n = 12–14 mice per group, two experiments, (F) n = 20–23 mice per group, two experiments. (B–G) Each data point represents an individual mouse. Data presented as mean ± SEM, analyzed by Mann-Whitney test.
-
Figure 5—figure supplement 1—source data 1
ABCs in the spleen analyzed by flow cytometry at 56 days post-CIA induction.
- https://cdn.elifesciences.org/articles/67024/elife-67024-fig5-figsupp1-data1-v2.xlsx
Figure 6 with 1 supplement
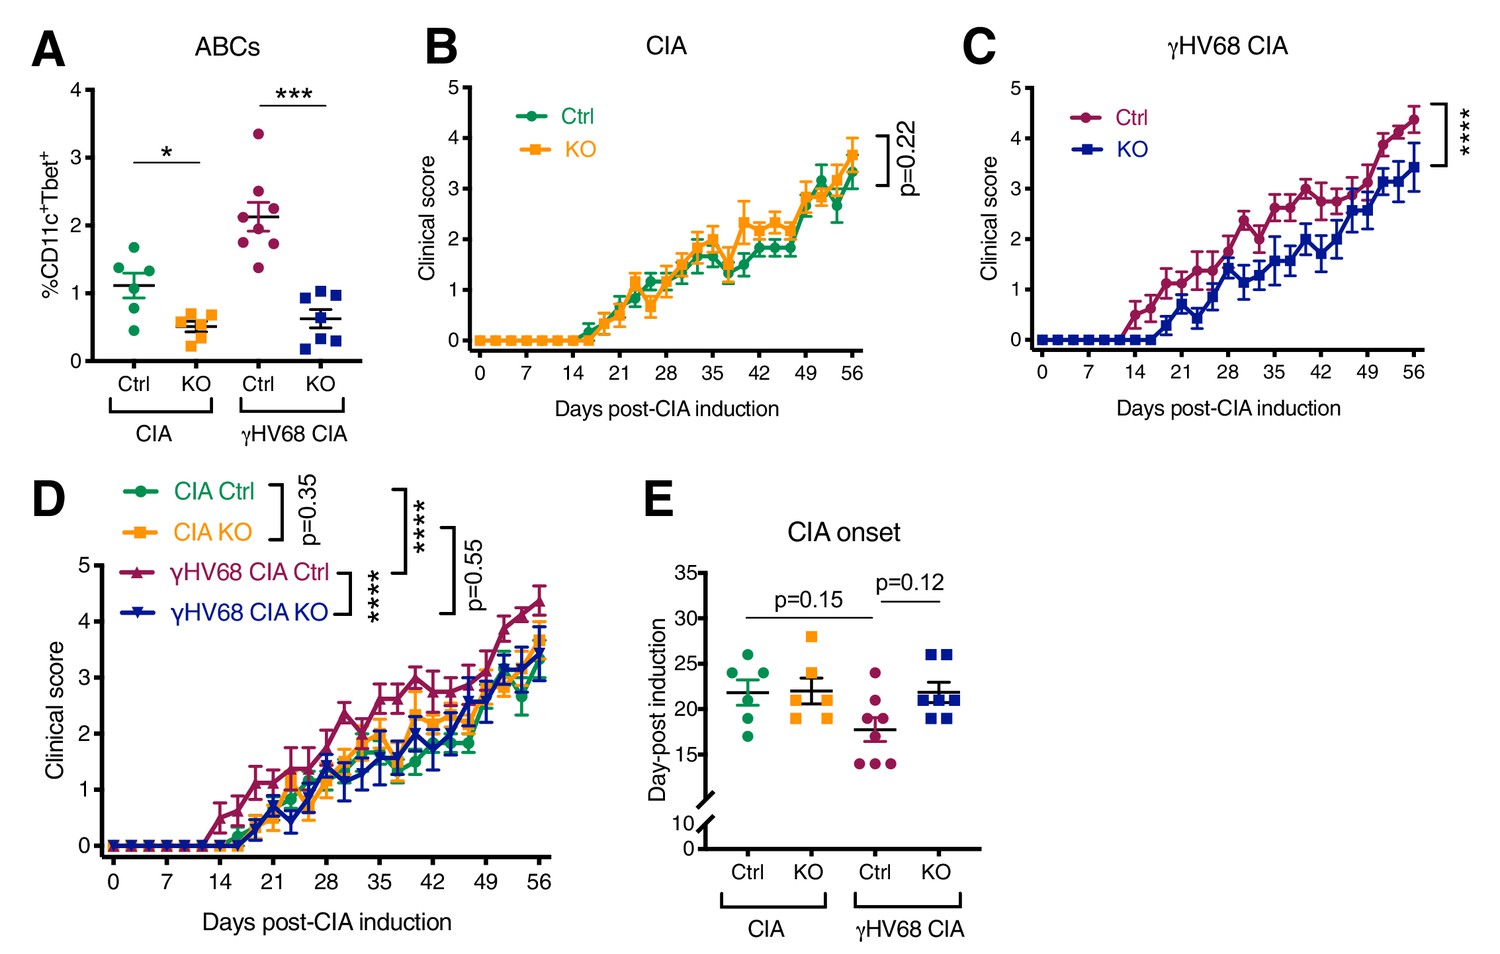
Disease progression and flow cytometric analysis of Tbx21fl/flCd19cre/+ (KO) and Tbx21fl/flCd19+/+ (Ctrl) mice that have been infected with γHV68 or mock-infected and induced for CIA.
(A) Proportion of age-associated B cells (ABCs) (CD11c+Tbet+) of mature B cells (CD19+IgD-) in the spleen as determined by flow cytometry of CIA flox-only control (Ctrl, green circles), CIA KO (KO, orange squares), γHV68-CIA flox-only control (Ctrl, purple circles), and γHV68-CIA KO (KO, blue squares) mice. (B) Clinical score (y-axis) of collagen-induced arthritis (CIA) measured three times weekly for 8 weeks (x-axis; days) post-CIA induction in Ctrl (green circles) and knockout (KO) (orange circles) mice that are uninfected with CIA. (C) Clinical score (y-axis) of CIA measured three times weekly for 8 weeks (x-axis; days) post-CIA induction in Ctrl (purple circles) and KO (blue circles) γHV68-infected CIA mice. (D) Clinical scores, same data as in panels (B, C). (E) Day (y-axis) of CIA onset, considered two consecutive scoring days of a score of at least 1, in Ctrl and KO CIA and γHV68-CIA mice (x-axis). (A–E) n = 6–8 mice per group, two experiments. Data presented as mean ± SEM, analyzed by (A) Mann-Whitney test, (B, C) two-way ANOVA with F-values 1.71 (B) and 62.37 (C), (D) two-way ANOVA with multiple comparisons, with an F-value of 38.14, and (E) one-way ANOVA with an F-value of 2.78; ****p<0.0001, ***p<0.001, **p<0.01, *p<0.05.
-
Figure 6—source data 1
Disease progression and flow cytometric analysis of Tbx21fl/flCd19cre/+(KO) and Tbx21fl/flCd19+/+(Ctrl) mice that have been infected with γHV68 or mock-infected and induced for CIA.
- https://cdn.elifesciences.org/articles/67024/elife-67024-fig6-data1-v2.xlsx
Figure 6—figure supplement 1
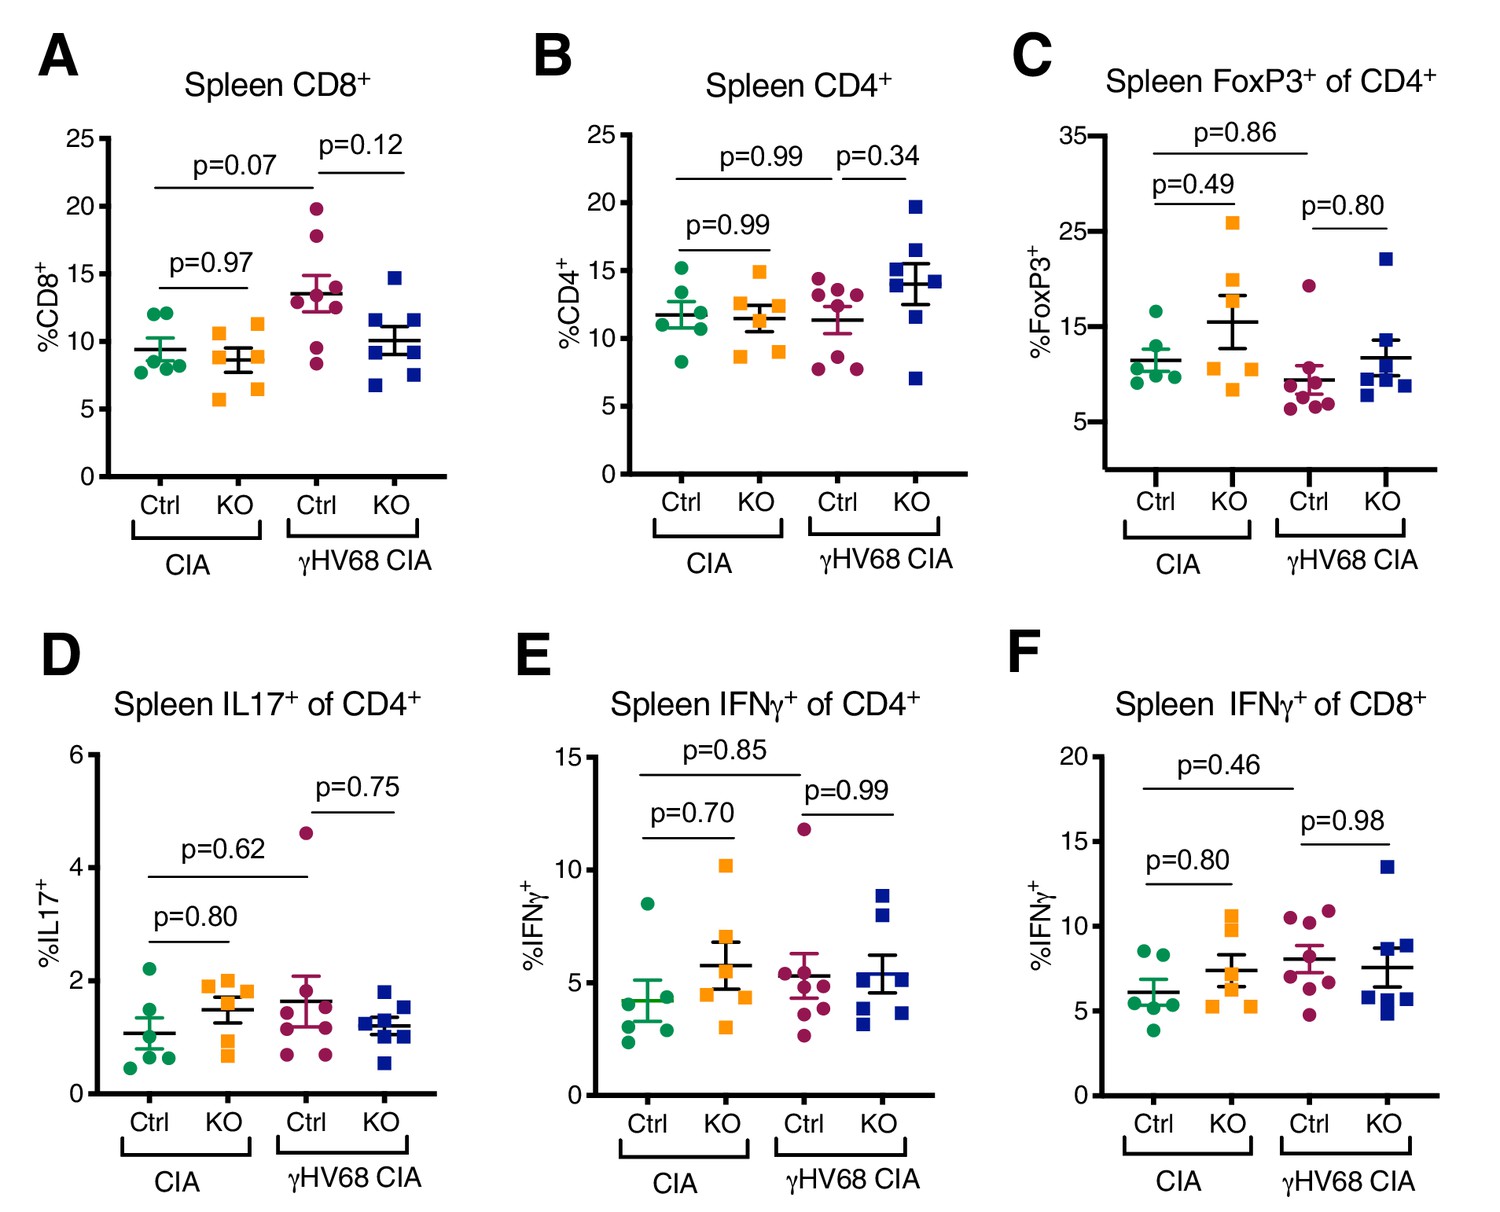
T cell response in the spleen of Ctrl and KO mice at day 56 post-CIA induction.
(A–F) T cells examined in the spleen at day 56 post-induction by flow cytometry, previously gated on lymphocytes, live cells, singlets, and CD45+CD3+ cells. (A) %CD3+CD8+ of CD45+, (B) %CD3+CD4+ of CD45+, and (C) %FoxP3+ of CD4+ cells in the spleen. (D) %IL17A+ of CD4+, (E) %IFNγ+ of CD4+, and (F) %IFNγ+ of CD8+. Each data point represents an individual mouse. Data presented as mean ± SEM, analyzed by one-way ANOVA.
-
Figure 6—figure supplement 1—source data 1
T cell response in the spleen of Ctrl and KO mice at day 56 post-CIA induction.
- https://cdn.elifesciences.org/articles/67024/elife-67024-fig6-figsupp1-data1-v2.xlsx
Additional files
Download links
A two-part list of links to download the article, or parts of the article, in various formats.
Downloads (link to download the article as PDF)
Open citations (links to open the citations from this article in various online reference manager services)
Cite this article (links to download the citations from this article in formats compatible with various reference manager tools)
Latent gammaherpesvirus exacerbates arthritis through modification of age-associated B cells
eLife 10:e67024.
https://doi.org/10.7554/eLife.67024


