The discriminatory power of the T cell receptor
- Sir William Dunn School of Pathology, University of Oxford, United Kingdom
- Radcliffe Department of Medicine, Medical Research Council Human Immunology Unit, Weatherall Institute of Molecular Medicine, University of Oxford, United Kingdom
- Kennedy Institute of Rheumatology, University of Oxford, United Kingdom
- Boston University, Department of Mathematics and Statistics, United States
Figures
Figure 1
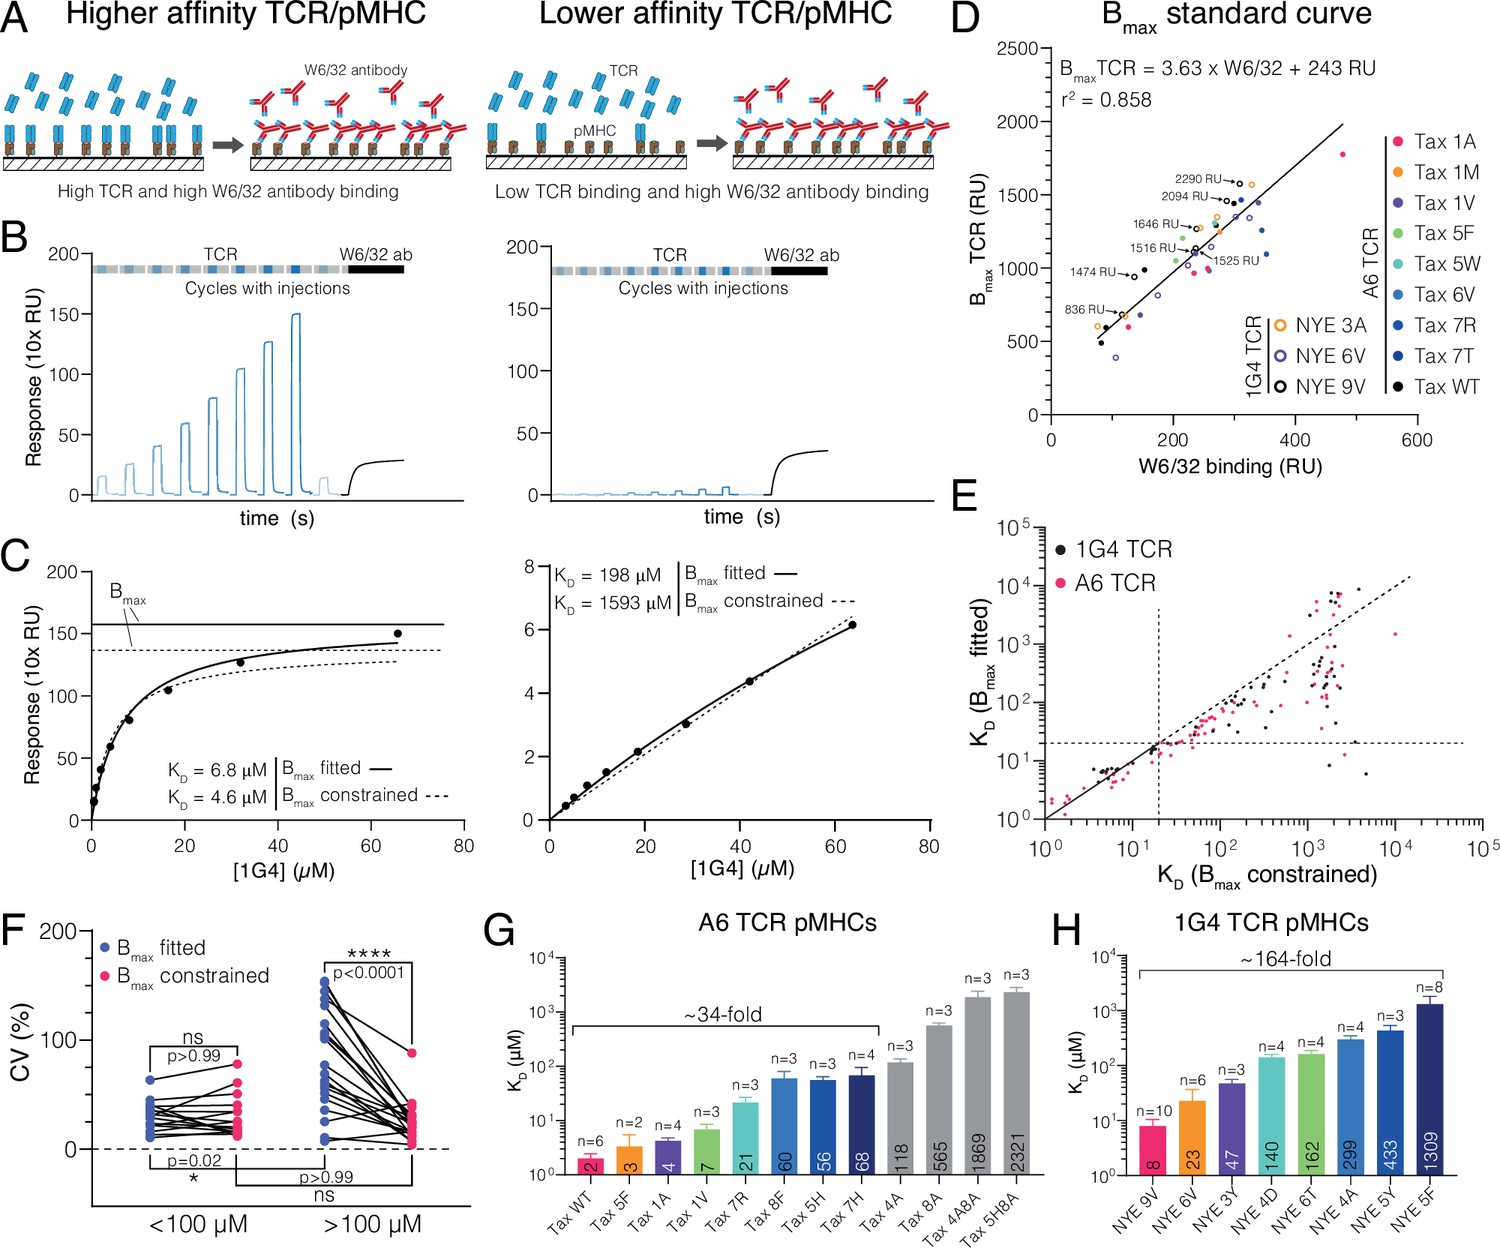
Measuring ultra-low T cell receptor (TCR)/peptides presented on major histocompatibility complex (pMHC) affinities using surface plasmon resonance (SPR) at 37°C using a constrained Bmax method.
(A–C) Comparison of 1G4 TCR binding to a higher (left panels, NYE 9V) and lower (right panels, NYE 5F) affinity pMHC. (A) Schematic comparing TCR and W6/32 binding. (B) Example SPR sensograms showing injections of different TCR concentrations followed by the W6/32 antibody. (C) Steady-state binding response from (B) over the TCR concentration (filled circles) fitted to determine KD when Bmax is either fitted (standard method) or constrained (new method). Bmax obtained from either method is indicated for the high-affinity pMHC. For the low-affinity pMHC, the Bmax is out of the axes range (251 and 1671 RU for Bmax fitted and Bmax constrained, respectively). (D) Empirical standard curve relating W6/32 binding to fitted Bmax obtained using higher-affinity interactions. Immobilisation levels of NYE 9V are indicated showing that both W6/32 binding and fitted Bmax depend on the amount of pMHC immobilised. Although immobilisation levels are related to Bmax, they cannot be used directly because of variations in the fraction of inactive pMHC across different protein preparations (e.g. MHC that binds to the chip surface and hence contributes to immobilisation but is unfolded and cannot bind the TCR). Therefore, W6/32 binding provides an accurate proxy for the amount of active pMHC on the chip surface. (E) Correlation of KDs obtained using the fitted and constrained methods. Each dot represents an individual measurement (n = 132; 61 for 1G4 TCR, 71 for A6 TCR). (F) Coefficient of variation for higher- (<100 μM) or lower-affinity (>100 μM) interactions. (G) Selected pMHC panel for A6 TCR. (H) Selected pMHC panel for 1G4 TCR. Mean values with SDs of KDs are indicated in bars and ligands used for functional experiments in the main text are coloured. Data in (A) and (B) was double-referenced. The high- and low-affinity examples originate from different experiments.
-
Figure 1—source data 1
Double-referenced surface plasmon resonance data for Figure 1.
- https://cdn.elifesciences.org/articles/67092/elife-67092-fig1-data1-v3.zip
-
Figure 1—source data 2
Fitted KDs with the indicated method for the 1G4 TCR in SPR at 37°C.
Includes all peptides used for SPR standard curve and functional experiments.
- https://cdn.elifesciences.org/articles/67092/elife-67092-fig1-data2-v3.csv
-
Figure 1—source data 3
Fitted KDs with the indicated method for the A6 TCR in SPR at 37°C.
Includes all peptides used for SPR standard curve and functional experiments. N/A: not applicable.
- https://cdn.elifesciences.org/articles/67092/elife-67092-fig1-data3-v3.csv
Figure 2 with 3 supplements
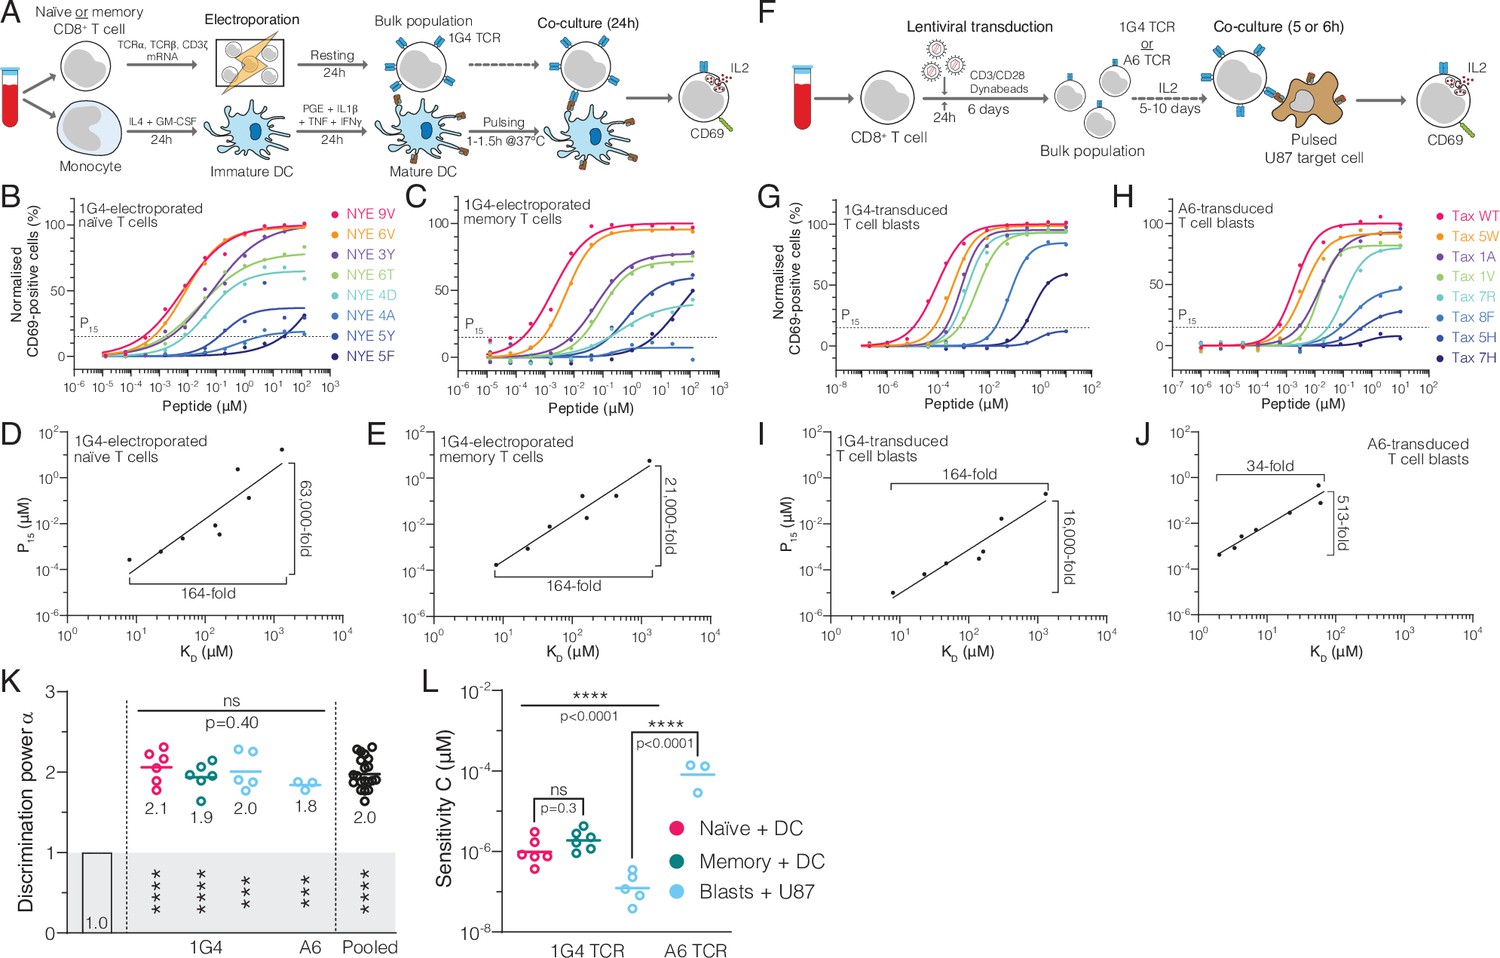
Naïve, memory, and blast human CD8+ T cells exhibit enhanced but imperfect discrimination.
(A) Protocol for producing quiescent primary human naïve and memory CD8+ T cells interacting with autologous monocyte-derived dendritic cells as APCs. (B, C) Example dose-responses for naïve and memory T cells. Potency (P15) is determined by the concentration of peptide eliciting 15% activation. (D, E) Examples of potency vs. KD fitted with a power law. Fold-change in KD and in potency derived from fits is shown. (F) Experimental protocol for producing primary human CD8+ T cell blasts interacting with the glioblastoma cell line U87 as APCs. (G, H) Example dose-responses and (I, J) potency vs. KD plots for T cell blasts expressing the indicated TCR. (KL) Comparison of the fitted discrimination power (α) and fitted sensitivity (). Shown are means with each dot representing an independent experiment (n = 3–6). (K) In grey the result of a statistical test vs. 1 is shown (p<0.0001 for naïve, memory and pooled, p=0.0002 for U87/1G4, p=0.0009 for U87/A6). 95% CI for pooled α in K is 1.9–2.1.
-
Figure 2—source data 1
CD69 dose-response data for Figure 2.
- https://cdn.elifesciences.org/articles/67092/elife-67092-fig2-data1-v3.zip
Figure 2—figure supplement 1
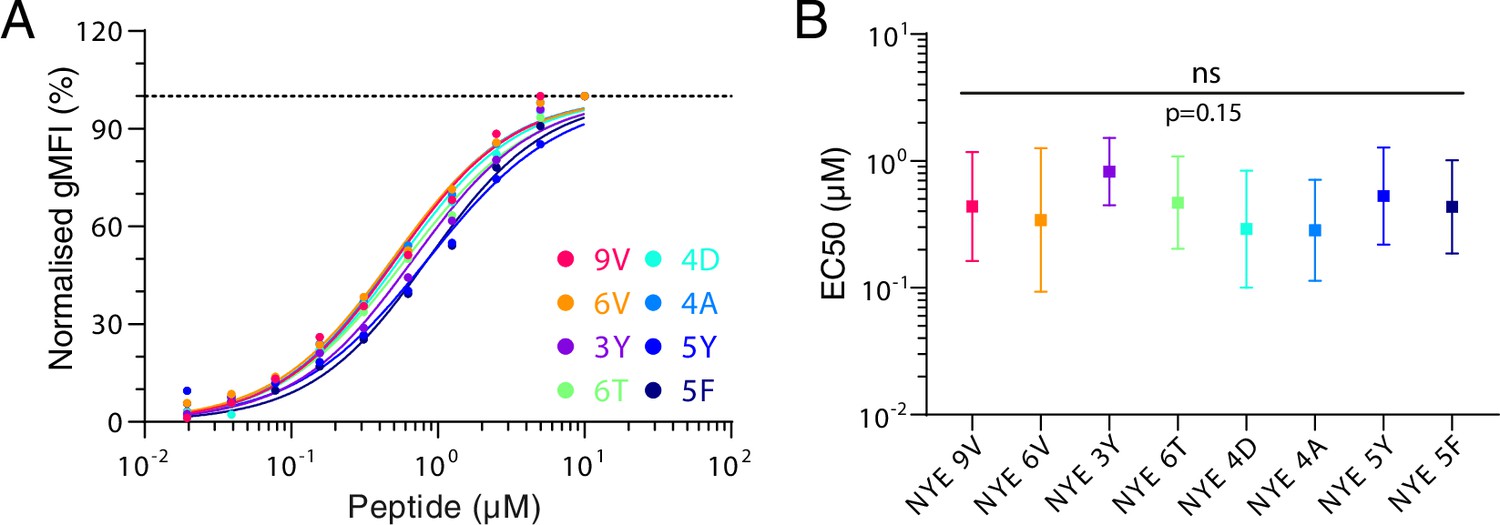
All NYE peptides load similarly on T2 cells.
(A) Example of upregulation of HLA-A2 on T2 cells over different peptides pulsing concentrations. (B) Summary EC50s of loading on T2 cells. Shown are means with standard deviation. Pooled log-transformed data from three independent experiments were compared using a repeated-measure one-way ANOVA with Geisser–Greenhouse correction.
Figure 2—figure supplement 2
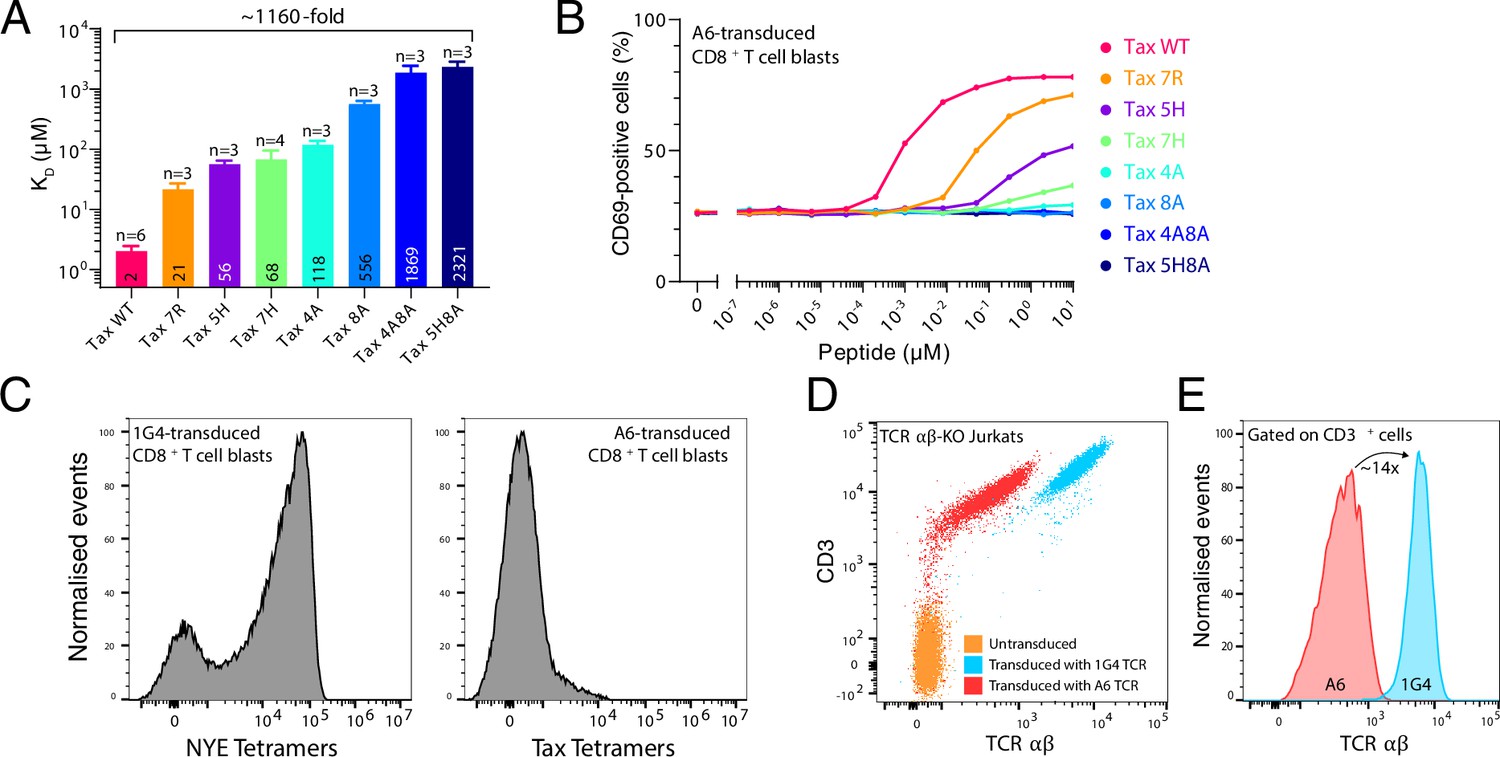
T cells transduced with A6 T cell receptor (TCR) have low expression and do not respond to ultra-low-affinity peptides presented on major histocompatibility complexes (pMHCs).
(A) Affinity of the A6 TCR for the panel of Tax-related peptide, as measured by surface plasmon resonance. Shown are means with SD (the mean is also shown as a number within the bar). (B) Activation of A6-expressing CD8+ T cell blasts by U87 APCs pulsed with the indicated concentration of Tax-related peptides. (C) Binding of the indicated pMHC tetramers to A6- versus 1G4-transduced CD8+ T cell blasts, as measured by flow cytometry. (D) Measurement by flow cytometry of cell surface expression of CD3 and TCR by CD8+ T cell blasts following transduction with the indicated TCR into TCR -KO Jurkats. (E) Relative expression of TCR using the data in (E), gated on CD3+ cells.
Figure 2—figure supplement 3
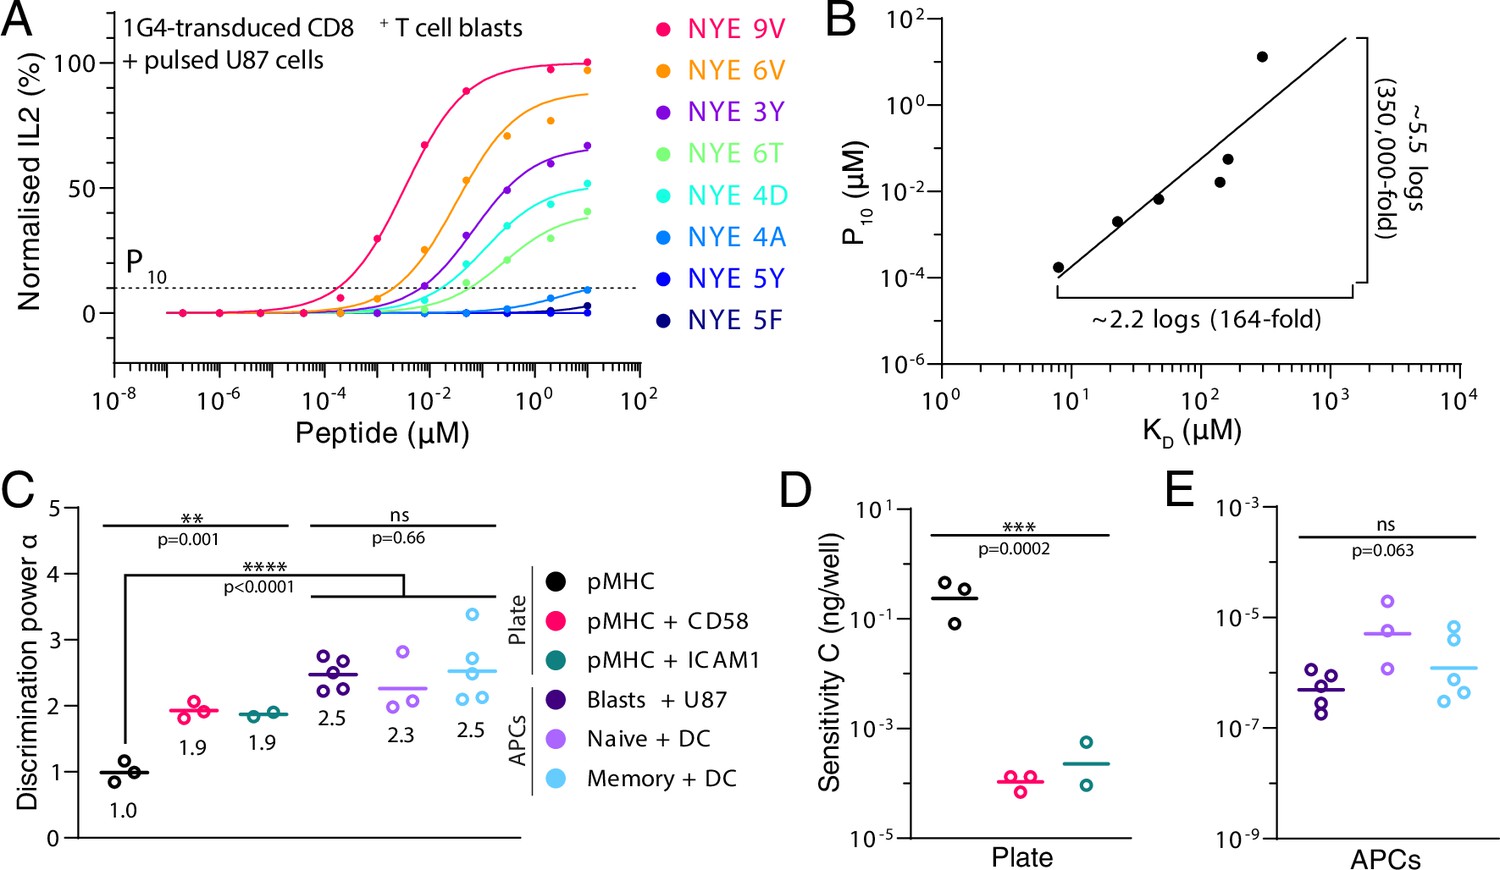
The discriminatory power based on cytokine production.
(A) Dose-response for secretion of IL2 into the supernatant. Dotted line indicates 10% activation threshold (P10). (B) A plot of potency obtained from (A) over affinity showing the power law fit. Lower-affinity antigens that did not induce detectable IL2 (NYE 5Y and 5F) are not included in the plot. (C) Geometric mean of discrimination power (α). Plate data and APC data compared each by an independent ordinary one-way ANOVA. pMHC vs APCs compared by ordinary one-way ANOVA. All tests were performed on log-transformed data. (D, E) Geometric mean sensitivity measure () for stimulation with (D) immobilised ligands or (E) APC co-culture.
-
Figure 2—figure supplement 3—source data 1
IL2 dose response data for Figure 2—figure supplement 3.
- https://cdn.elifesciences.org/articles/67092/elife-67092-fig2-figsupp3-data1-v3.zip
Figure 3 with 3 supplements
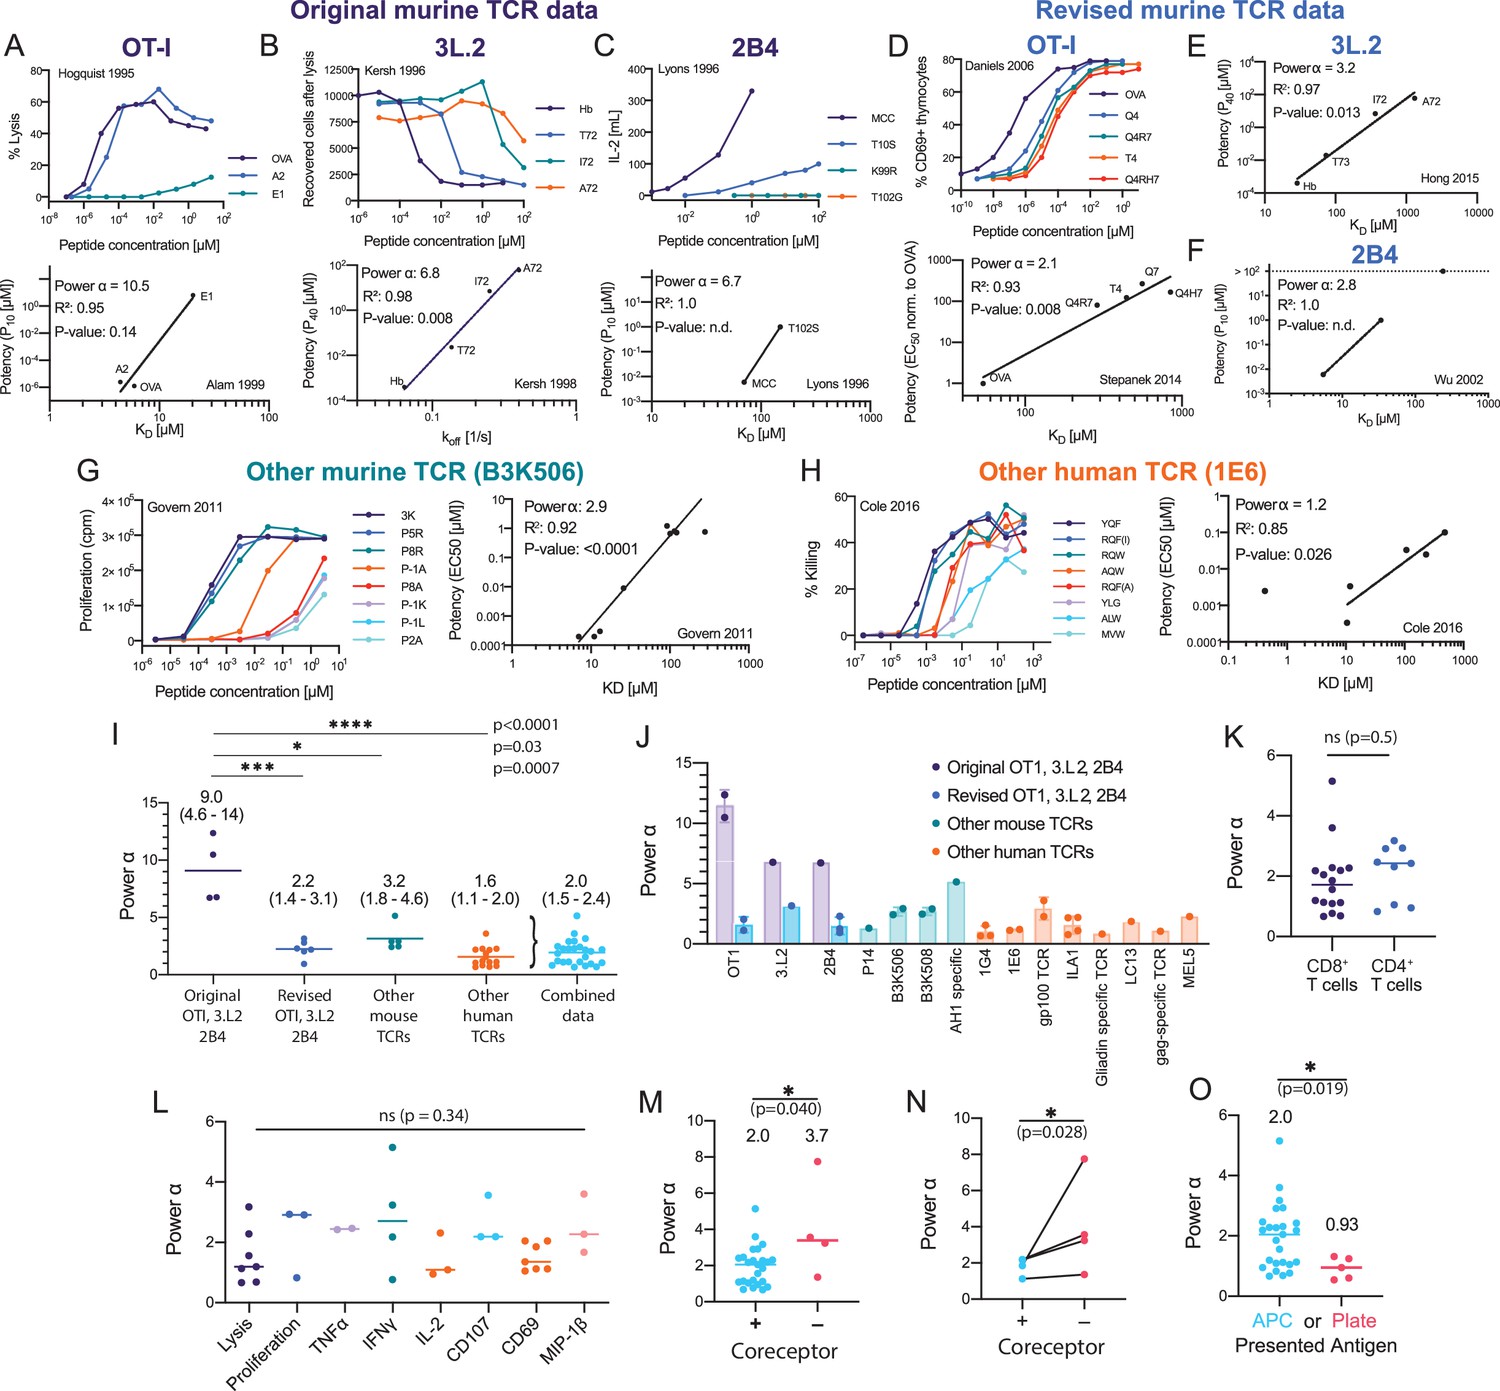
Systematic analyses show enhanced but imperfect discriminatory powers for the T cell receptor (TCR) that depend on the antigen-presenting surface.
(A–H) T cell dose-responses and potency/affinity plots for (A–C) the original murine TCR data, revised analysis of the original murine TCRs using (D) new functional and binding data or (E, F) only new binding data, and examples of other (G) murine and (H) human TCRs. The highest affinity peptide (KD < 1 μM) for the 1E6 TCR was excluded because it saturated the response and would have artificially lowered the fitted α (see Materials and methods for inclusion and exclusion criteria). IDs: 2 [A], 11 [B], 14 [C], 5 [D], 13 [E], 17 [F], 23 [G], and 42 [F]. (I) Comparison of discrimination powers with mean and 95% CI (combined data includes revised OTI, 3.L2, and 2B4 and other mouse and human data). (J) Discrimination powers shown in (I) parsed into each TCR. (K) Comparison between CD4+ and CD8+ T cells. (L) Comparison between different T cell responses. (M) Comparison between conditions with and without the CD4/CD8 co-receptors. (N) Comparison as in (M) but for paired data (where both conditions were present in the same study). (O) Comparison between the use of APCs or artificial plate surfaces to present antigens. Combined data is used in (K, L), (M) (+ co-receptor), and (O) (APC data).
-
Figure 3—source data 1
Overview of discrimination powers for TCRs.
Each row is associated with an experimental ID that is linked to detailed information on how the data was extracted (see Methods & Appendix text) and to potency plots (Figure 3–figure supplement 1–3).
- https://cdn.elifesciences.org/articles/67092/elife-67092-fig3-data1-v3.csv
Figure 3—figure supplement 1
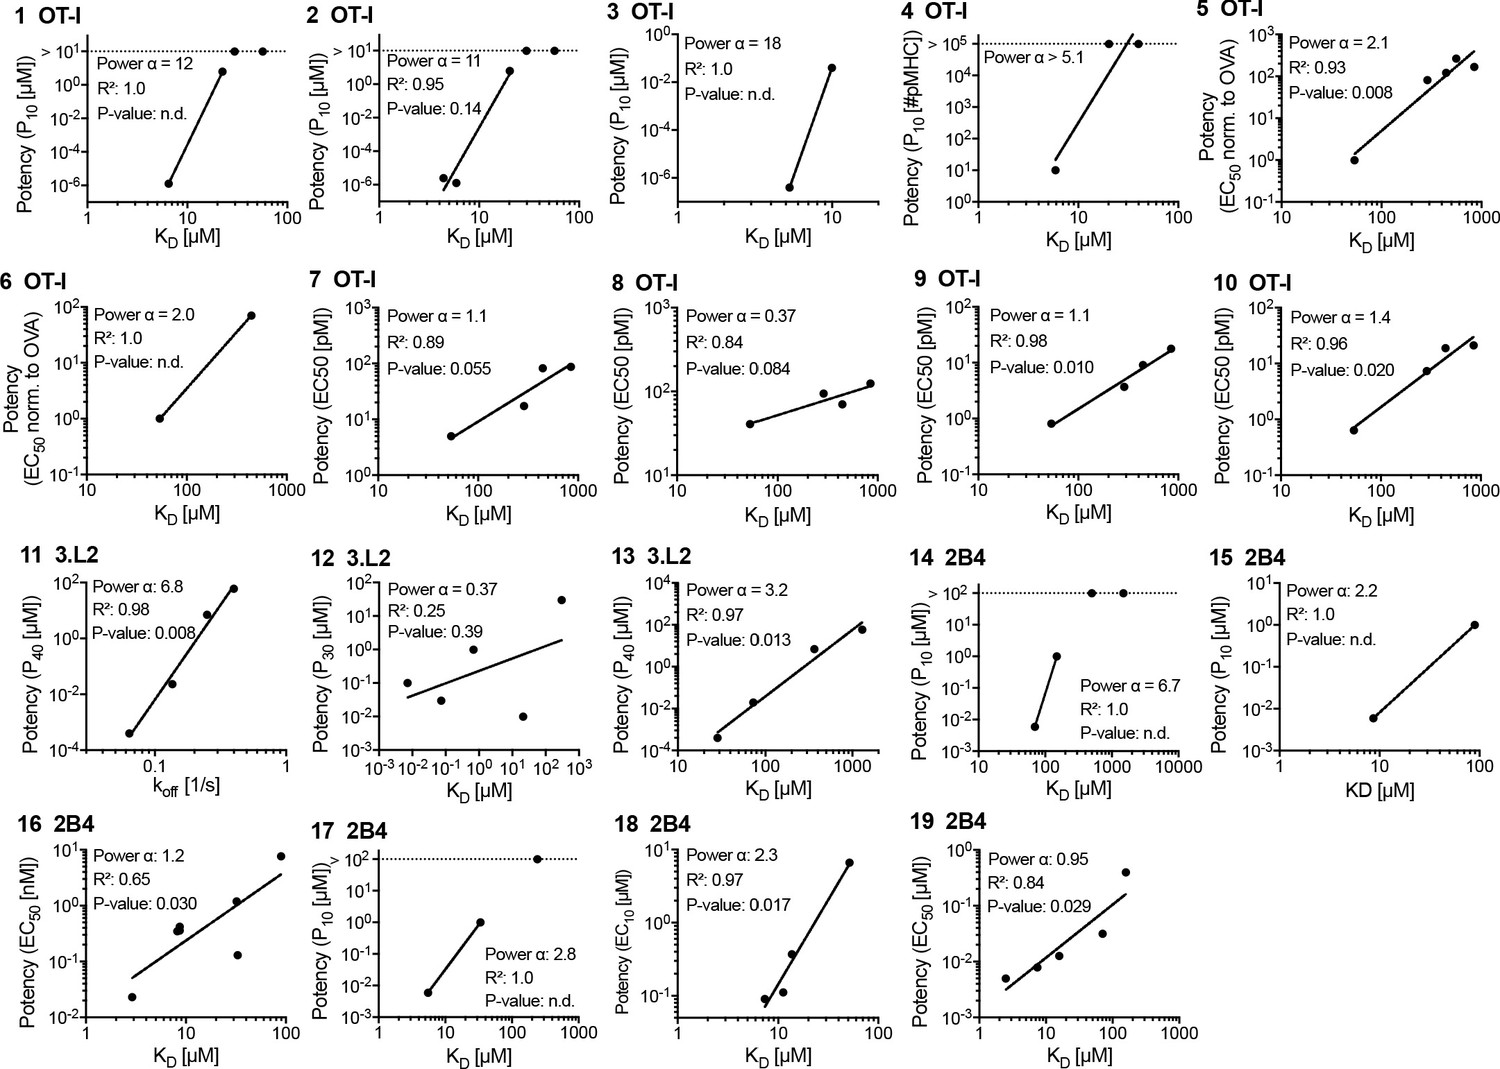
Potency over KD data for the original mouse T cell receptors (TCRs) (OT-I, 3.L2, and 2B4).
Each panel is linked by an ID to an entry in Figure 3—source data 1 and a paragraph in Appendix 1.
Figure 3—figure supplement 2
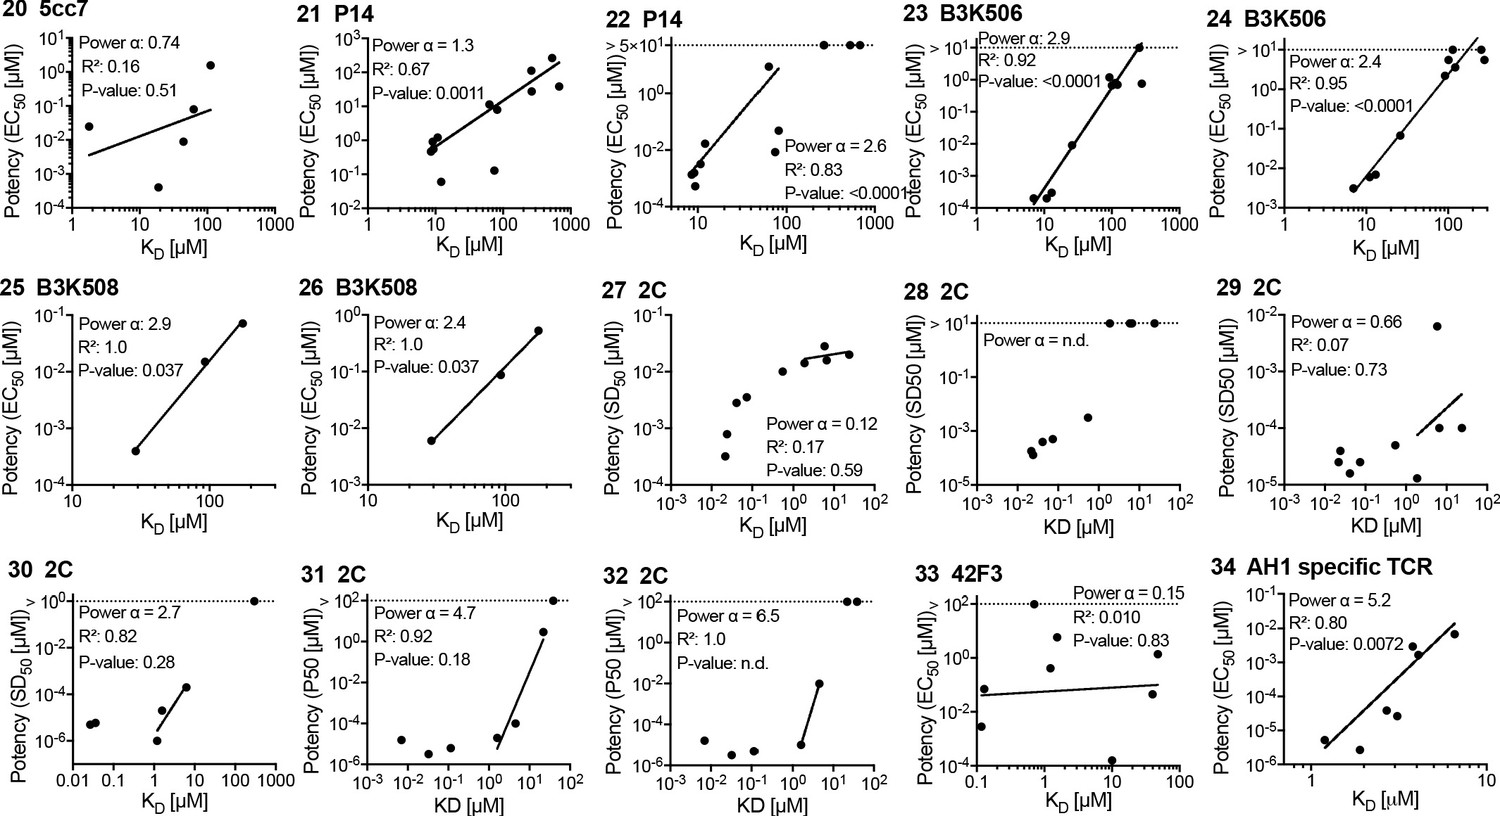
Potency over KD data for other mouse T cell receptors (TCRs).
Each panel is linked by an ID to an entry in Figure 3—source data 1 and a paragraph in Appendix 1.
Figure 3—figure supplement 3
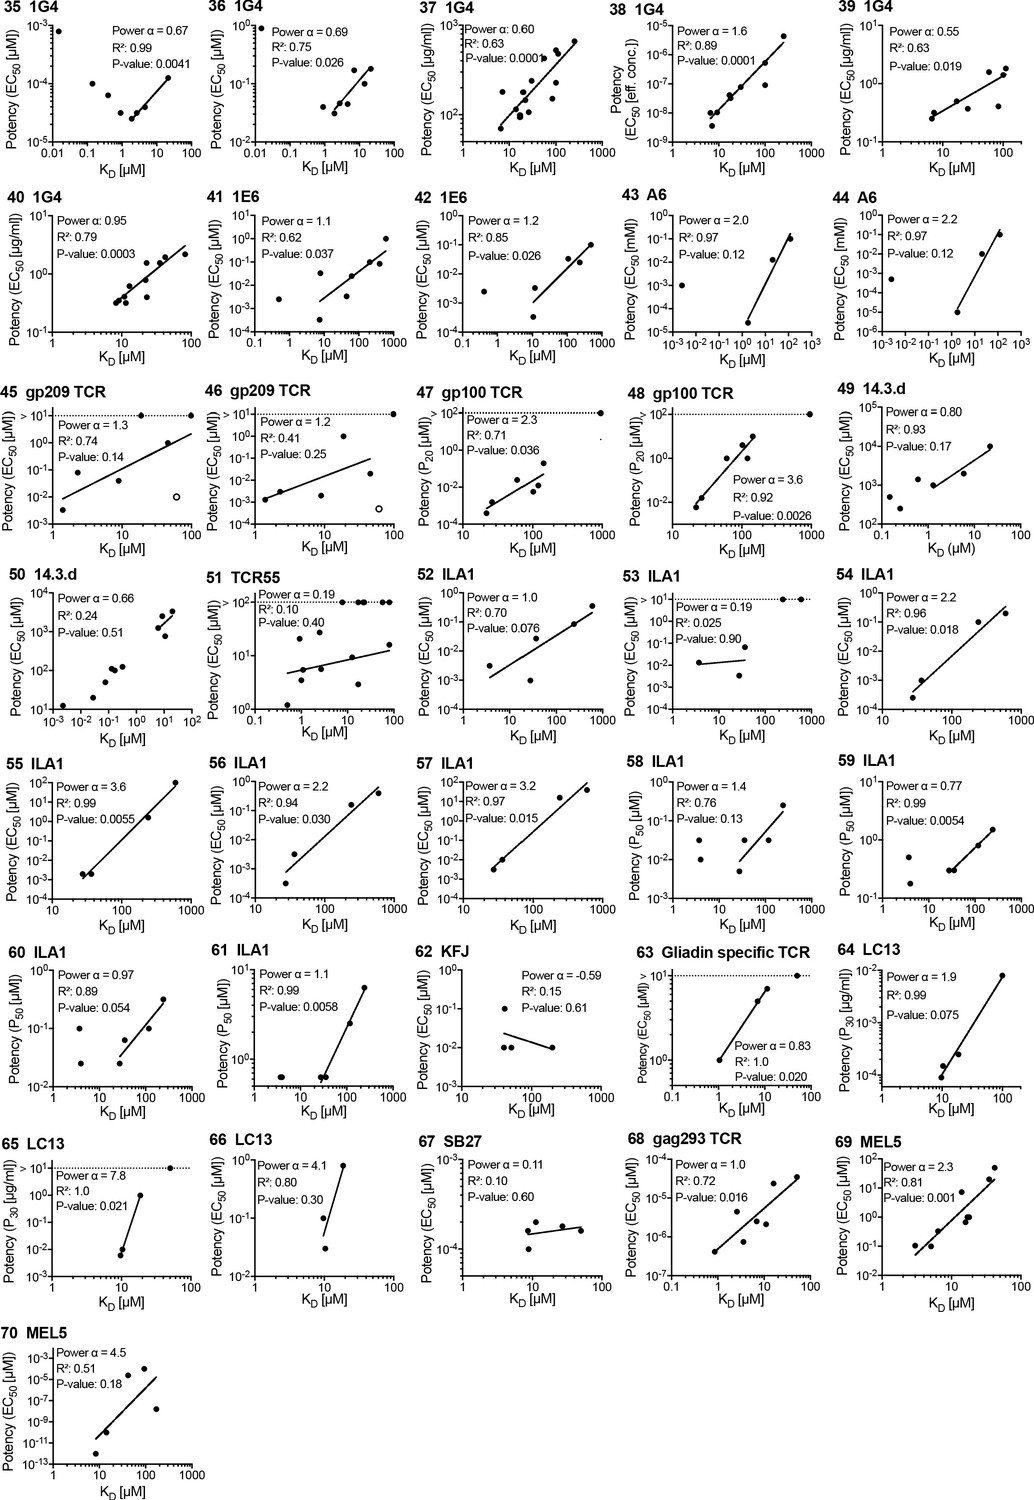
Potency over KD data for other human T cell receptors (TCRs).
Each panel is linked by an ID to an entry in Figure 3—source data 1 and a paragraph in Appendix 1.
Figure 4 with 1 supplement
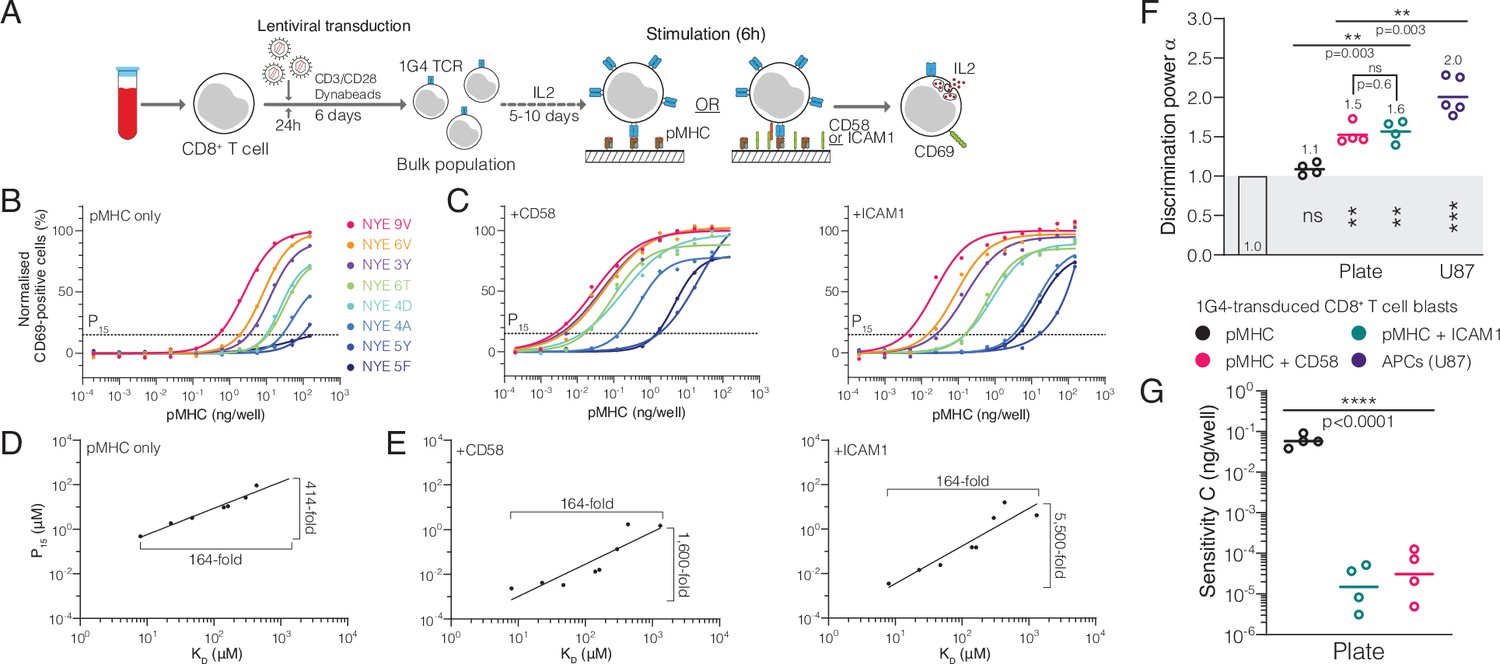
The T cell discriminatory power is enhanced by ligation of the receptors CD2 or LFA-1.
(A) Protocol for stimulation of CD8+ T cell blasts with plate-bound recombinant ligands. (B, C) Example dose-response curve for 1G4 T cell blasts stimulated with (B) peptides presented on major histocompatibility complex (pMHC) alone or (C) in combination with CD58 or ICAM1. (D, E) Potency derived from dose-response curves over KD showing the power function fit (D) with pMHC alone or (E) in combination with CD58 or ICAM1. (F) Comparison of the fitted discrimination power (α) and (G) fitted sensitivity (). Shown are geometric means with each dot representing an independent experiment (n = 4–5). (F) In grey the result of a statistical test vs. 1 is shown (p=0.09 for pMHC, p=0.002 for CD58 and ICAM1, p=0.0002 for U87/1G4).
-
Figure 4—source data 1
CD69 dose-response data for Figure 4.
- https://cdn.elifesciences.org/articles/67092/elife-67092-fig4-data1-v3.zip
Figure 4—figure supplement 1
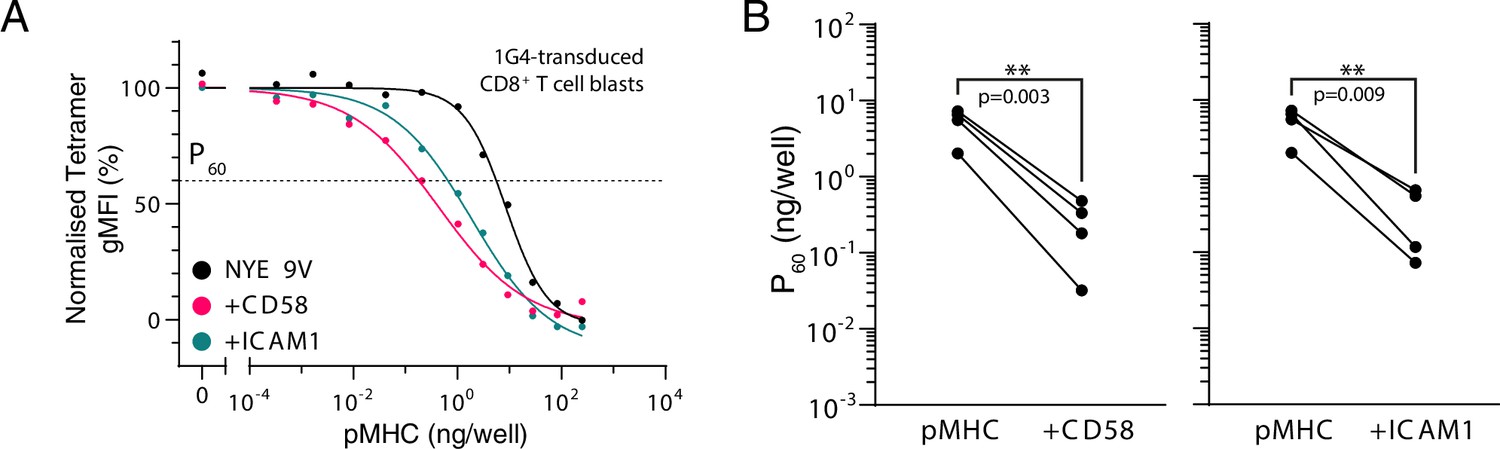
Engagement of CD2 or LFA-1 increases T cell receptor (TCR) downregulation.
(A) Example dose-dependent for downregulation of TCR and its acceleration by engagement of CD2 by CD58 or LFA-1 by ICAM1. P60 is defined as the dose required to induce 40% downregulation. Normalised to pMHC-alone data. (B) Summary effect of CD2 or LFA-1 on TCR downregulation. Each dot represents an individual experiment. Statistics by repeated-measures one-way ANOVA (with Geisser–Greenhouse correction) of log-transformed data (n = 4) with Dunnett’s multiple comparison test.
-
Figure 4—figure supplement 1—source data 1
Tetramer dose response data for Figure 4—figure supplement 1.
- https://cdn.elifesciences.org/articles/67092/elife-67092-fig4-figsupp1-data1-v3.zip
Figure 5 with 1 supplement
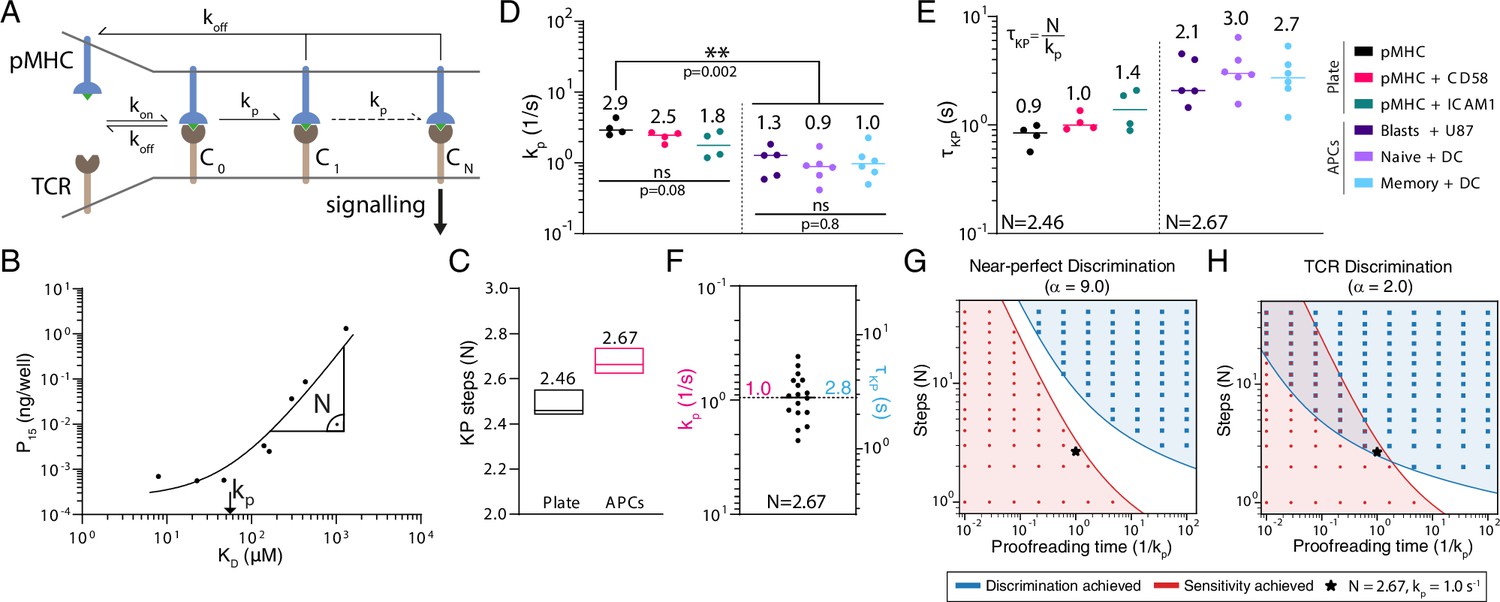
The kinetic proofreading mechanism explains T cell receptor (TCR) discrimination.
(A) Schematic of the KP model. The KP time delay between initial binding (step 0) and signalling (step N) is . (B) Example fit of the KP model to data generated using CD8+ blasts stimulated with peptides presented on major histocompatibility complex (pMHC) + ICAM1 showing that the fitted kp is near the KD threshold where potency saturates and is the slope away from this saturation point. (C) The fitted number of steps (median with min/max) was a global shared parameter for all plate or APC experiments. (D) The fitted KP rate was a local parameter for individual experiments. (E) The KP time delay calculated from N in (C) and individual values in (D). (F) Pooled 1G4 APC data are used to compute means of kp and of 1.0 (95% CI: 0.7–1.2) and 2.8 (95% CI: 2.2–3.6), respectively. (G, H) Binary heatmaps showing when sensitivity (red) and discrimination (blue) are achieved for the indicated discrimination power. Results shown using stochastic simulations (dots) or deterministic calculations (continuous colours).
Figure 5—figure supplement 1
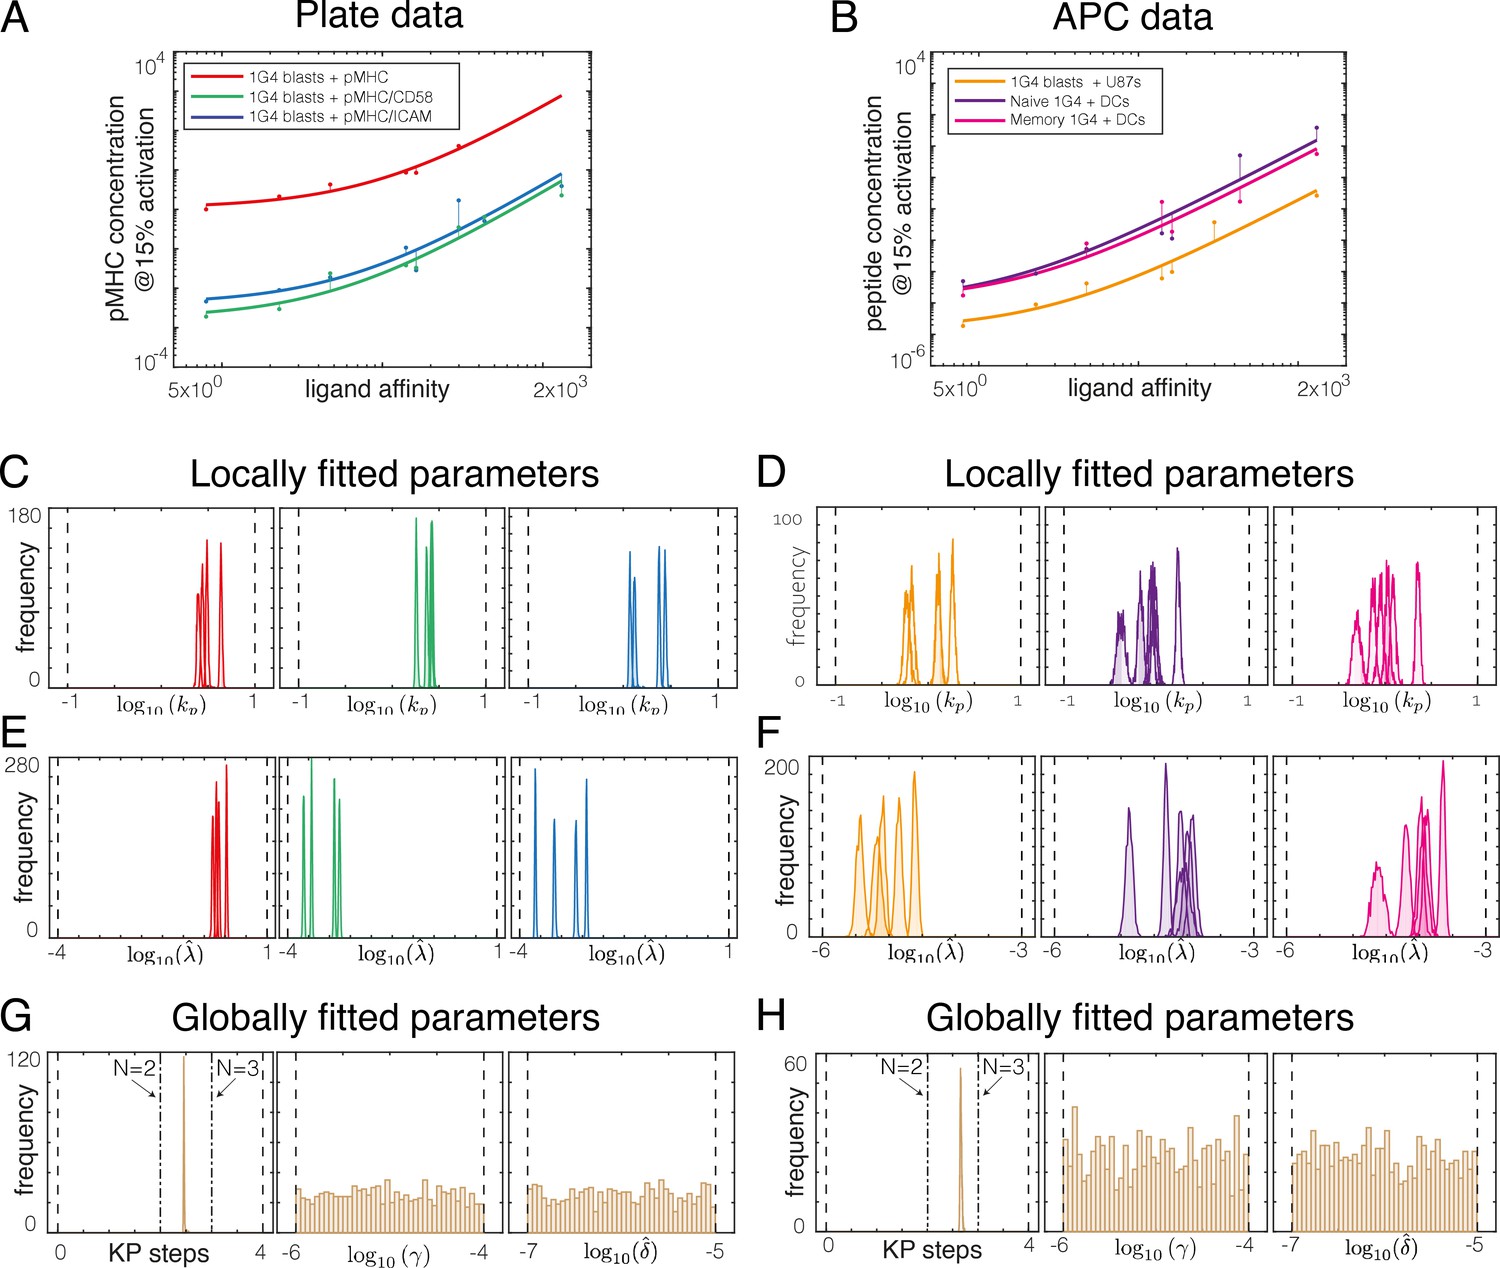
Direct fit of the kinetic proofreading model to potency data using the Approximate Bayesian Computation-Sequential Monte Carlo (ABC-SMC) method.
(A, B) Examples of (A) plate and (B) APC potency data (dots) fitted with the KP model (lines). (C–H) The ABC-SMC method provides a distribution of all parameters that are consistent with the high-quality fits presented in (A) and (B). (C–F) Distribution of locally fitted parameters reveals that the proofreading rate (kp) and the sensitivity parameter () can be uniquely determined for each (C, E) plate experiment and (D, F) APC experiment. (G, H) Distribution of globally fitted parameters reveals that the number of KP steps (N) can be uniquely determined but that two additional parameters (γ, ) cannot be uniquely determined as they do not exhibit peaked distributions for (G) plate experiments and (H) APC experiments.
Figure 6 with 1 supplement
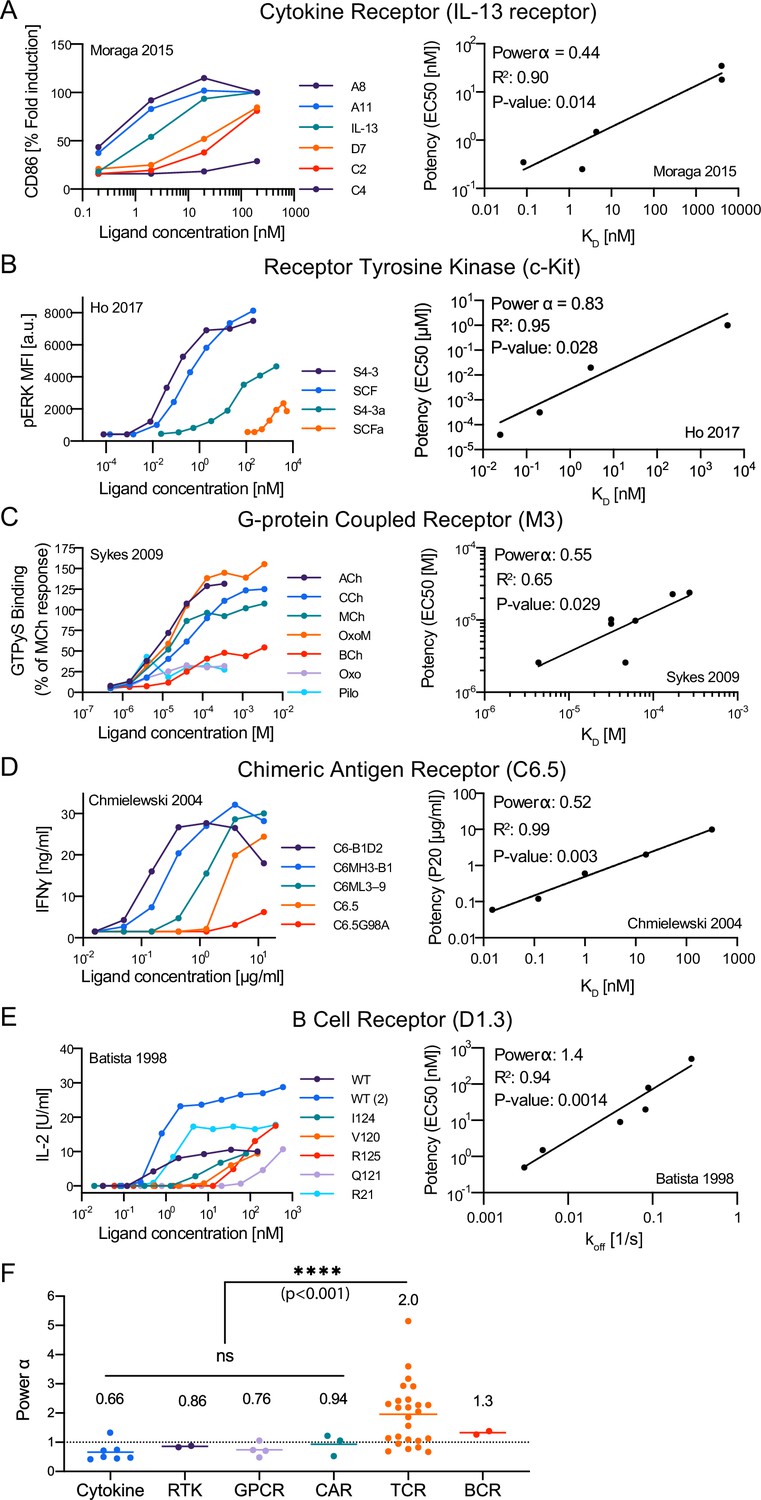
The discriminatory power of the T cell receptor (TCR) is higher than conventional surface receptors.
(A–E) Representative dose-response (left column) and potency over KD or off (right column) for the indicated surface receptor. IDs: 5 [A], 15 [B], 20 [C], 25 [D], 29 [E]. (F) Discrimination powers for the indicated receptor. Data for the TCR as in Figure 3I (combined data).
-
Figure 6—source data 1
Overview of discrimination powers for other (non-TCR) surface receptors.
Each row is associated with an experimental ID that is linked to detailed information on how the data was extracted (see Methods & Appendix text) and to potency plots (Figure 6–figure supplement 1).
- https://cdn.elifesciences.org/articles/67092/elife-67092-fig6-data1-v3.csv
Figure 6—figure supplement 1
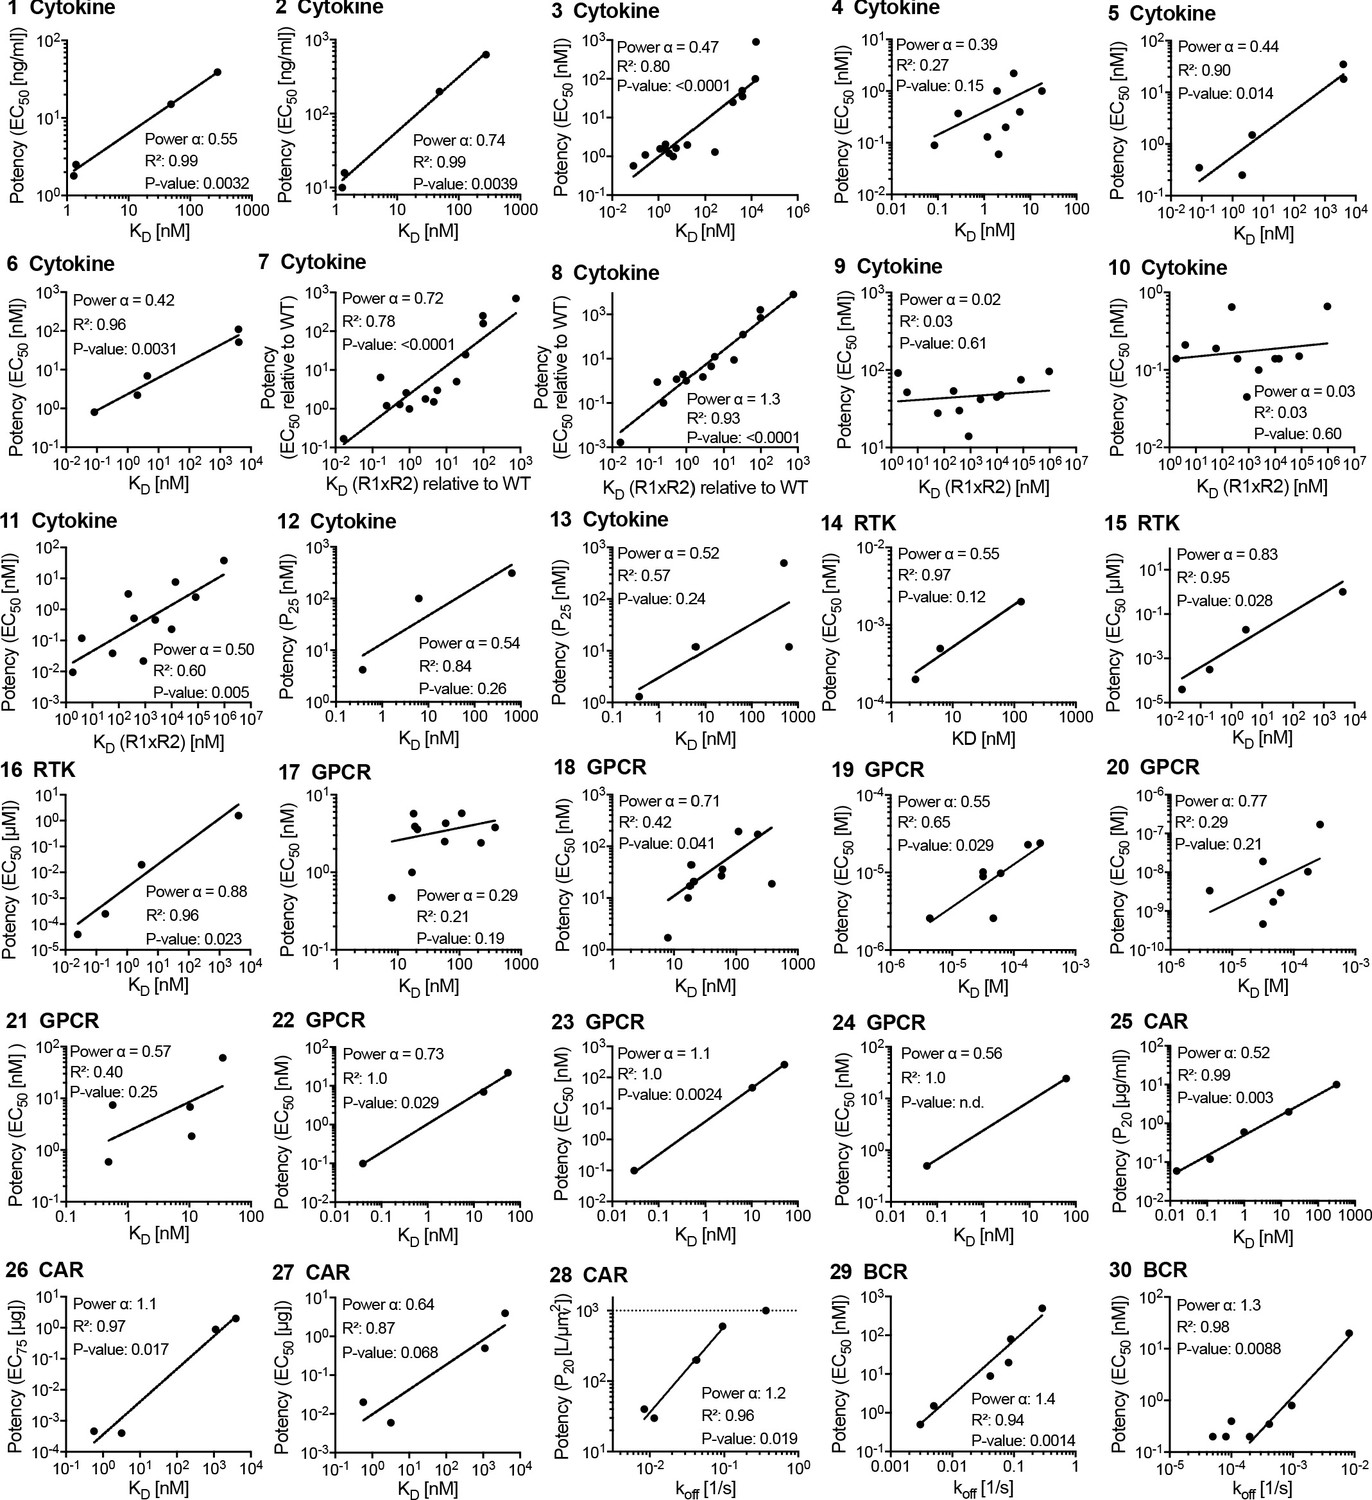
Potency over KD data for other (non-T cell receptor) receptors.
Each panel is linked by an ID to an entry in Figure 6—source data 1 and a paragraph in Appendix 1.
Author response image 1
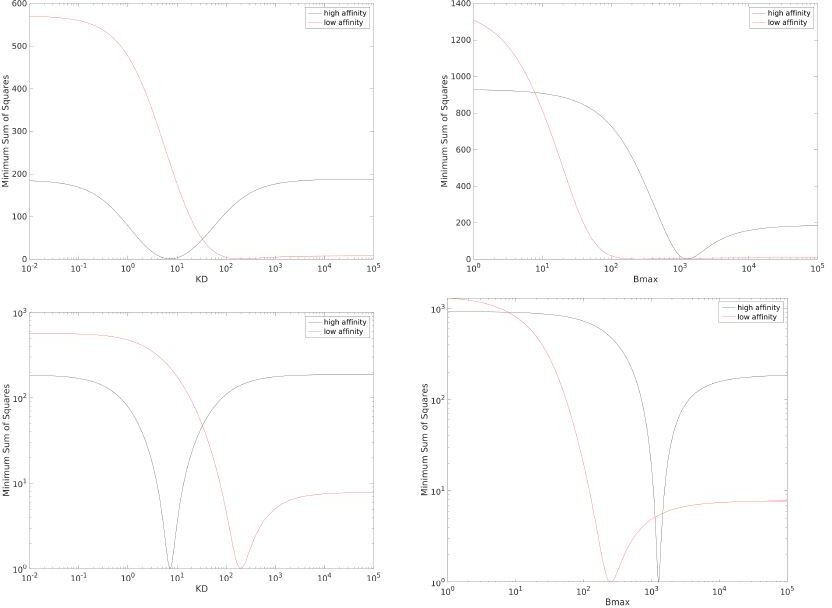
Profiles for the data in main text Fig 1C for KD (left) and Bmax (right) when using a linear y-axis (top row) or log y-axis (bottom row).
The y-axis is scaled such that the minima is at one, this facilitates comparing the profiles between high affinity and low affinity data sets.
Tables
Key resources table
| Reagent type (species) or resource | Designation | Source or reference | Identifiers | Additional information |
|---|---|---|---|---|
| Cell line (human) | U87 | Vincenzo Cerundolo | University of Oxford, UK | |
| Cell line (human) | Freestyle 293 F | Thermo Fisher Scientific | RRID:CVCL_D603 | For protein production by transient transfection. |
| Cell line (human) | Lenti-X 293T | Takara Bio | RRID:CVCL_4401 | For production of lentivirus. |
| Transfected construct (human) | pTT3-ecdCD58 | This paper | Plasmid for production of recombinant, soluble CD58 through transient transfection of mammalian cells. | |
| Transfected construct (human) | pTT3-ecdICAM1 | This paper | Plasmid for production of recombinant, soluble ICAM1 through transient transfection of mammalian cells. | |
| Transfected construct (human) | pTT3-BirA-FLAG | Addgene | RRID:Addgene_64395 | Plasmid for in-flask biotinylation by co-transfection. Bushell et al., 2008. |
| Antibody | Anti-human CD69 (mouse monoclonal) | Biolegend | RRID:AB_314839; RRID:AB_528869; RRID:AB_2561909; RRID:AB_528871 | Colours: FITC, AF488, BV421, AF647; dilution: (1:200); clone: FN50. |
| Antibody | Anti-human CD45 (mouse monoclonal) | Biolegend | RRID:AB_2561357; RRID:AB_2563466 | Colours: BV421, BV711; dilution: (1:200); clone: HI30. |
| Antibody | Anti-HLA-A2 (mouse monoclonal) | Biolegend | RRID:AB_2721523; RRID:AB_1877227 | Colours: BV421, PE; dilution: (1:100–1:200); clone: BB7.2. |
| Antibody | Human TruStain Fc block | Biolegend | RRID:AB_2818986 | Dilution: (1:100). |
| Antibody | W6/32 | Biolegend | RRID:AB_314871 | Unconjugated; for SPR; lot: B233942. |
| Recombinant DNA reagent | pLEX-A6 | This paper | Lentiviral transfer plasmid based on pLEX307. See Supplementary file 1 for insert sequence. | |
| Recombinant DNA reagent | pHR-1G4 | This paper | Lentiviral transfer plasmid with EF1α promoter for transduction of the 1G4 TCR into T cells. See Supplementary file 1 for insert sequence. | |
| Recombinant DNA reagent | A6α | This paper | Soluble A6 alpha chain for production in Escherichia coli and in vitro refolding. See Supplementary file 2 for insert sequence. | |
| Recombinant DNA reagent | A6β-His | This paper | Soluble A6 beta chain for production in E. coli and in vitro refolding. See Supplementary file 2 for insert sequence. | |
| Recombinant DNA reagent | 1G4α | Aleksic et al., 2010 | Soluble 1G4 alpha chain for production in E. coli and in vitro refolding. | |
| Recombinant DNA reagent | 1G4β | Aleksic et al., 2010 | Soluble 1G4 beta chain for production in E. coli and in vitro refolding. | |
| Recombinant DNA reagent | 1G4β | Abu-Shah et al., 2019 | For mRNA electroporation. | |
| Recombinant DNA reagent | 1G4α | Abu-Shah et al., 2019 | For mRNA electroporation. | |
| Recombinant DNA reagent | CD3ζ | Abu-Shah et al., 2019 | For mRNA electroporation. | |
| Recombinant DNA reagent | HLA-A*02:01 heavy chain | Aleksic et al., 2010 | Soluble MHC heavy chain for production in E. coli and in vitro refolding. | |
| Recombinant DNA reagent | β2M | Aleksic et al., 2010 | beta-2 microglobulin for production in E. coli and in vitro refolding. | |
| Peptide, recombinant protein | Retronectin | Takara Bio | T100B | |
| Peptide, recombinant protein | Streptavidin-PE | Biolegend | 405245 | |
| Peptide, recombinant protein | Biotinylated BSA | Thermo Fisher Scientific | 29130 | |
| Peptide, recombinant protein | Streptavidin | Thermo Fisher Scientific | 434301 | |
| Peptide, recombinant protein | Peptide ligands | Peptide Protein Research | See Figure 1—source data for details. | |
| Peptide, recombinant protein | Refolded recombinant pMHCs | This paper | Expressed in E. coli. | |
| Peptide, recombinant protein | IL2 | PeproTech | 200-02 | |
| Peptide, recombinant protein | IL4 | PeproTech | 200-04 | |
| Peptide, recombinant protein | TNF | PeproTech | 300-01A | |
| Peptide, recombinant protein | IFNγ | R&D Systems | 285-IF-100/CF | |
| Peptide, recombinant protein | GM-CSF | Immunotools | 11343127 | |
| Peptide, recombinant protein | IL1β | R&D Systems | 201-LB-025/CF | |
| Commercial assay or kit | RosetteSep Human CD8+ T Cell Enrichment Cocktail | STEMCELL Technologies | 15063 | Isolation kits used to enrich for human immune cells from blood. |
| Commercial assay or kit | RosetteSep Human Monocyte Enrichment Cocktail | STEMCELL Technologies | 15068 | Isolation kits used to enrich for human immune cells from blood. |
| Commercial assay or kit | EasySep Human Memory CD8+ T Cell Enrichment Kit | STEMCELL Technologies | 19159 | Isolation kits used to enrich for human immune cells from blood. |
| Commercial assay or kit | EasySep Human Naïve CD8+ T Cell Isolation Kit II | STEMCELL Technologies | 17968 | Isolation kits used to enrich for human immune cells from blood. |
| Commercial assay or kit | mMESSAGE mMACHINE T7 ULTRA Transcription Kit | Thermo Fisher Scientific | AM1345 | Prepare in vitro RNA transcripts. |
| Commercial assay or kit | MEGAclear Transcription Clean-Up Kit | Thermo Fisher Scientific | AM1908 | Isolate in vitro RNA transcripts. |
| Commercial assay or kit | Amine coupling kit | GE Healthcare Life Sciences | BR100050 | For immobilisation of protein on SPR chip. |
| Commercial assay or kit | IL-2 Human Uncoated ELISA Kit | Thermo Fisher Scientific | 88-7025-77 | |
| Chemical compound, drug | PGE2 | Sigma-Aldrich | P6532 | |
| Chemical compound, drug | Fixable Viability Dye eFluor 780 | Thermo Fisher Scientific | 65-0865-14 | |
| Chemical compound, drug | CD3/CD28 Human T-activator dynabeads | Thermo Fisher Scientific | 11132D | |
| Chemical compound, drug | X-tremeGENE HP | Sigma-Aldrich | 6366546001 | |
| Chemical compound, drug | Zombie Fixable viability kit | Biolegend | 423107; 423105 | Colours: UV, NIR; dilution: 1:1000. |
| Software, algorithm | Prism | GraphPad | Data fitting and statistics. | |
| Software, algorithm | Matlab | Mathworks | Model fitting. | |
| Software, algorithm | FlowJo | BD Biosciences | ||
| Other | 96 Well SensoPlate | Greiner | 655892 | |
| Other | Tetramers | This paper | Made with NYE 9V or Tax WT and commercial streptavidin-PE. | |
| Other | CM5 sensor chips | GE Healthcare Life Sciences |
Additional files
-
Supplementary file 1
Sequences of 1G4 and A6 T cell receptors for lentiviral transduction.
- https://cdn.elifesciences.org/articles/67092/elife-67092-supp1-v3.csv
-
Supplementary file 2
Sequences of soluble A6 T cell receptors for surface plasmon resonance.
- https://cdn.elifesciences.org/articles/67092/elife-67092-supp2-v3.csv
-
Transparent reporting form
- https://cdn.elifesciences.org/articles/67092/elife-67092-transrepform1-v3.docx
Download links
A two-part list of links to download the article, or parts of the article, in various formats.
Downloads (link to download the article as PDF)
Open citations (links to open the citations from this article in various online reference manager services)
Cite this article (links to download the citations from this article in formats compatible with various reference manager tools)
The discriminatory power of the T cell receptor
eLife 10:e67092.
https://doi.org/10.7554/eLife.67092


