Cardiac pathologies in mouse loss of imprinting models are due to misexpression of H19 long noncoding RNA
- Division of Intramural Research, Eunice Kennedy Shriver National Institute of Child Health and Human Development, National Institutes of Health, United States
- Pathology Core, National Heart Lung and Blood Institute, National Institutes of Health, United States
- Laboratory of Vascular and Matrix Genetics, National Heart Lung and Blood Institute, National Institutes of Health, United States
- Murine Phenotyping Core, National Heart Lung and Blood Institute, National Institutes of Health, United States
Figures
Figure 1
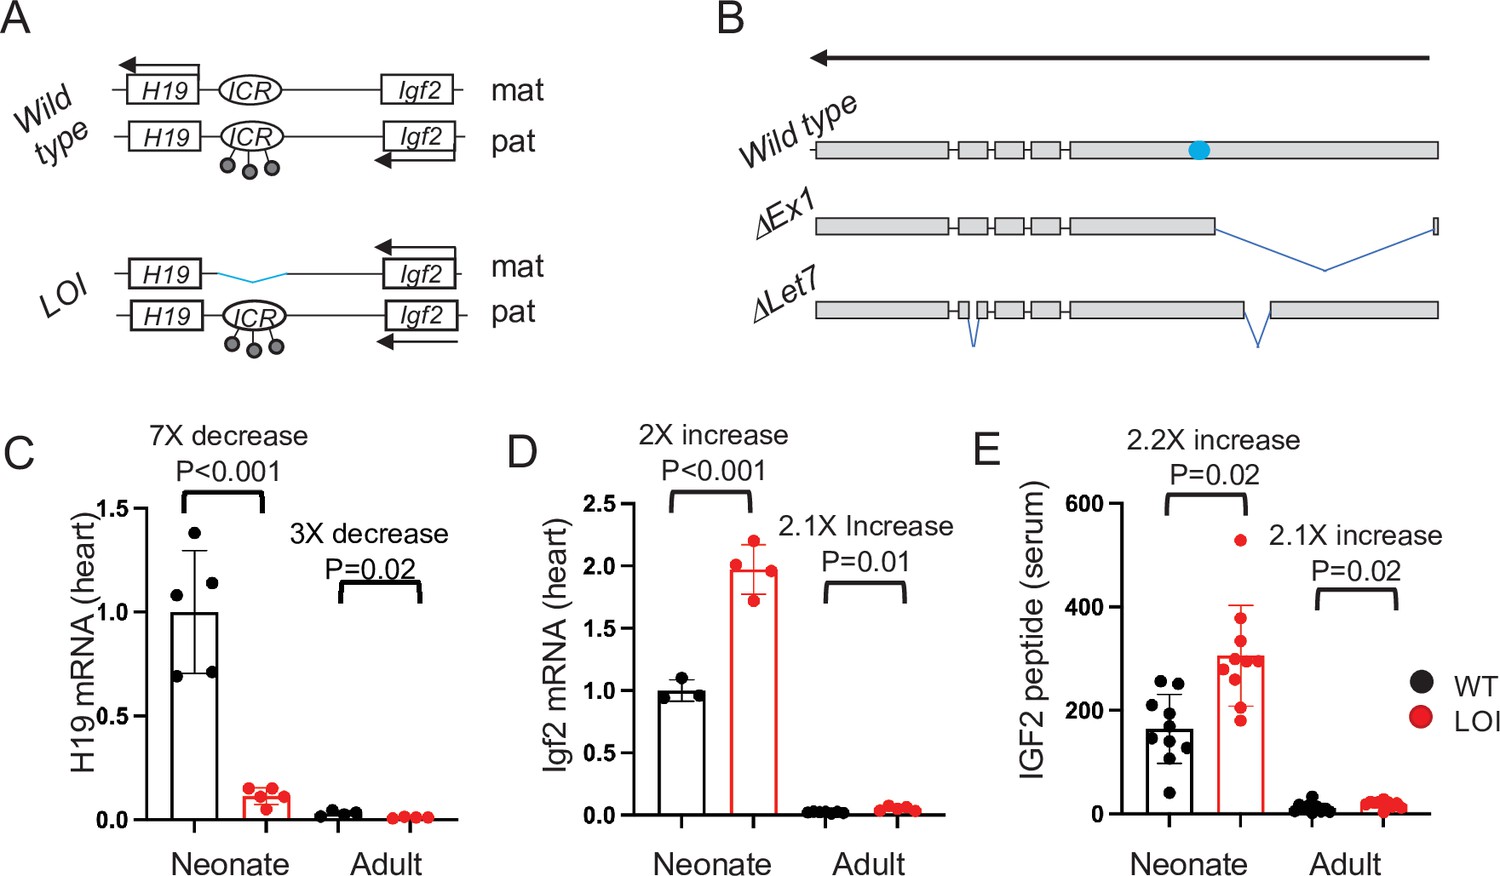
The H19/Igf2 locus.
(A) Schematic of maternal (mat) and paternal (pat) chromosomes in wild-type and in loss of imprinting (LOI) mice. Gene expression is indicated by horizontal arrows. In wild-type mice, the paternal copy of the imprinting control region (ICR) is inactivated by DNA methylation (filled lollipops). In LOI patients, inappropriate inactivation of the maternal ICR typically occurs due to microdeletion or to inappropriate DNA methylation. In the mouse LOI model, the maternal ICR is inactivated by deletion. (B) Schematic of wild-type, ΔEx1, and ΔLet7 H19 alleles. H19 exons 1–5 are shown as filled rectangles. ΔEx1 is a 700 bp deletion at the 5’ end of exon 1. ΔLet7 was constructed for this study by simultaneous deletion of Mirlet7 binding sites in H19 exons 1 and 4. The blue oval identifies coding sequences for Mir675-3p and -5 p. Arrowheads show the direction of transcription. (C–E). Maternal loss of imprinting results in reduced H19 lncRNA and 2× doses of Igf2. (C, D) Hearts were isolated from wild type (WT) or from H19ΔICR/H19+ (LOI) littermates at postnatal day 2 or at 2 months. RNAs were extracted, analyzed by qRT-PCR, normalized to GAPDH, and then normalized to levels observed in wild-type neonates. Despite the dramatic postnatal repression, H19 expression in adults remains substantial as H19 lncRNA is in the top 10-percentile of all RNAs. (C) IGF2 peptide levels in serum were measured by ELISA. Statistical significance was evaluated with Student’s t-test type 2.
-
Figure 1—source data 1
Maternal Loss of Imprinting (LOI) results in decreased Igf2 and increased H19 expression.
- https://cdn.elifesciences.org/articles/67250/elife-67250-fig1-data1-v2.xlsx
Figure 2 with 4 supplements
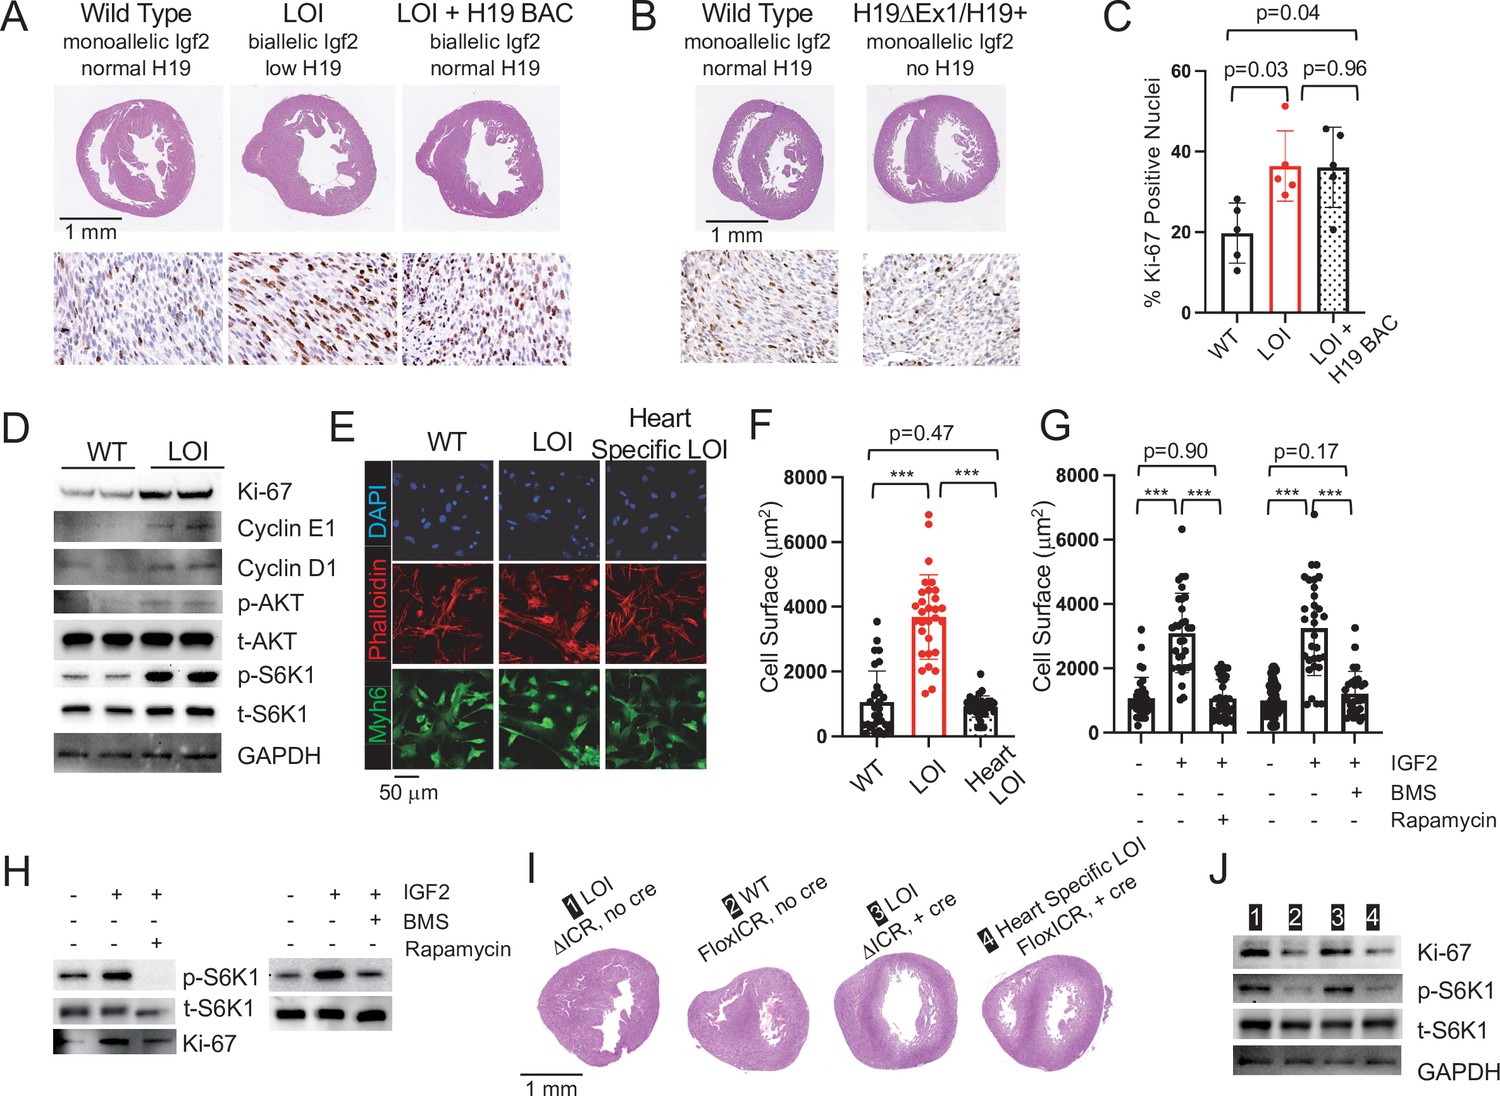
Cardiac hypertrophy in neonatal LOI mice is mediated by circulating IGF2 activation of AKT/mTOR signaling in cardiomyocytes and is independent of H19 gene function.
(A, B) Heart morphology in wild-type, LOI, and LOI+ H19 BAC littermates (A) or in wild-type and H19-deficient littermates (B) Top panels, transverse sections were taken from fixed hearts at 200 mm from the apex. Bottom panels, Ki-67 (brown stain) is a marker for cell proliferation. LOI, H19ΔICR /H19+; LOI+ BAC, H19ΔICR/H19+ that also carry a 140 kb Bacterial Artificial Chromosome transgene that restores normal H19 expression (Figure 2—figure supplement 2). Notice the thickened walls, misshaped right ventricles, and high levels of Ki-67 expression in LOI and in LOI+ BAC transgenic neonates. (C) Quantitation of Ki-67 expression as assayed in panel A. (N = 5). (D) Immunoblot analyses of heart extracts prepared from wild-type and LOI littermates. LOI hearts show increased levels of proliferation markers, Ki-67, Cyclin EI, and Cyclin D1 and also increased levels of phosphorylated AKT and S6K1 (a target of mTORC1). See Figure 2—figure supplement 1A for quantifed results. (E, F) Cardiomyocyte cellular hypertrophy in LOI animals is cell non-autonomous. Primary cardiomyocyte cultures were prepared from wild type, LOI, and from littermates carrying an ICR deletion only in cardiomyocytes (see below). Cells were cultured overnight, stained for MYH6 (to identify cardiomyocytes) and Phalloidin (to facilitate measurement of surface areas). For each culture (N = 5 per genotype), at least 30 cells were measured. (G, H) Exogenous IGF2 peptide induces cellular hypertrophy in wild-type cardiomyocytes through mTOR pathways. Primary cardiomyocytes were prepared from wild-type neonates and cultured overnight with IGF2 before measurement of cell surface area (G) or preparation of protein extracts for immunoblotting. (H) The effect of increased IGF2 is prevented by treatment with BMS 754807 or with Rapamycin. BMS inhibits IgfR1 and Ins2 receptor kinases (Carboni et al., 2009). Rapamcyin blocks a subset of mTOR activities (Li et al., 2014). See Figure 2—figure supplement 1B for quantified results. (I, J) LOI phenotypes in cardiomyocytes are cell non-autonomous. H19ICRflox/H19ΔICR females were crossed with males carrying the Myh6-Cre transgene to generate four kinds of pups: H19ΔICR/H19+ (#1) and H19ΔICR/H19+ Myh6 Cre (#3) will display LOI in all cell types; H19ICRflox/H19+ (#2) will display wild-type expression patterns for Igf2 and H19; and H19ICRflox/H19+ Myh6 Cre mice will show LOI only in cardiomyocytes. Hearts were analyzed for cellular hypertrophy (E), megacardia and hyperplasia (I), and protein expression (J). See Figure 2—figure supplement 1C for quantified results of protein expression. In all assays, H19ICRflox/H19+ Myh6 Cre mice were highly similar to their wild-type littermates and distinct from the congenital LOI littermates. *p<0.05; ***p<0.001 (Student’s t-test). LOI, loss of imprinting (H19ΔICR/H19+).
-
Figure 2—source data 1
Analyses of LOI phenotype in neonatal mice.
- https://cdn.elifesciences.org/articles/67250/elife-67250-fig2-data1-v2.xlsx
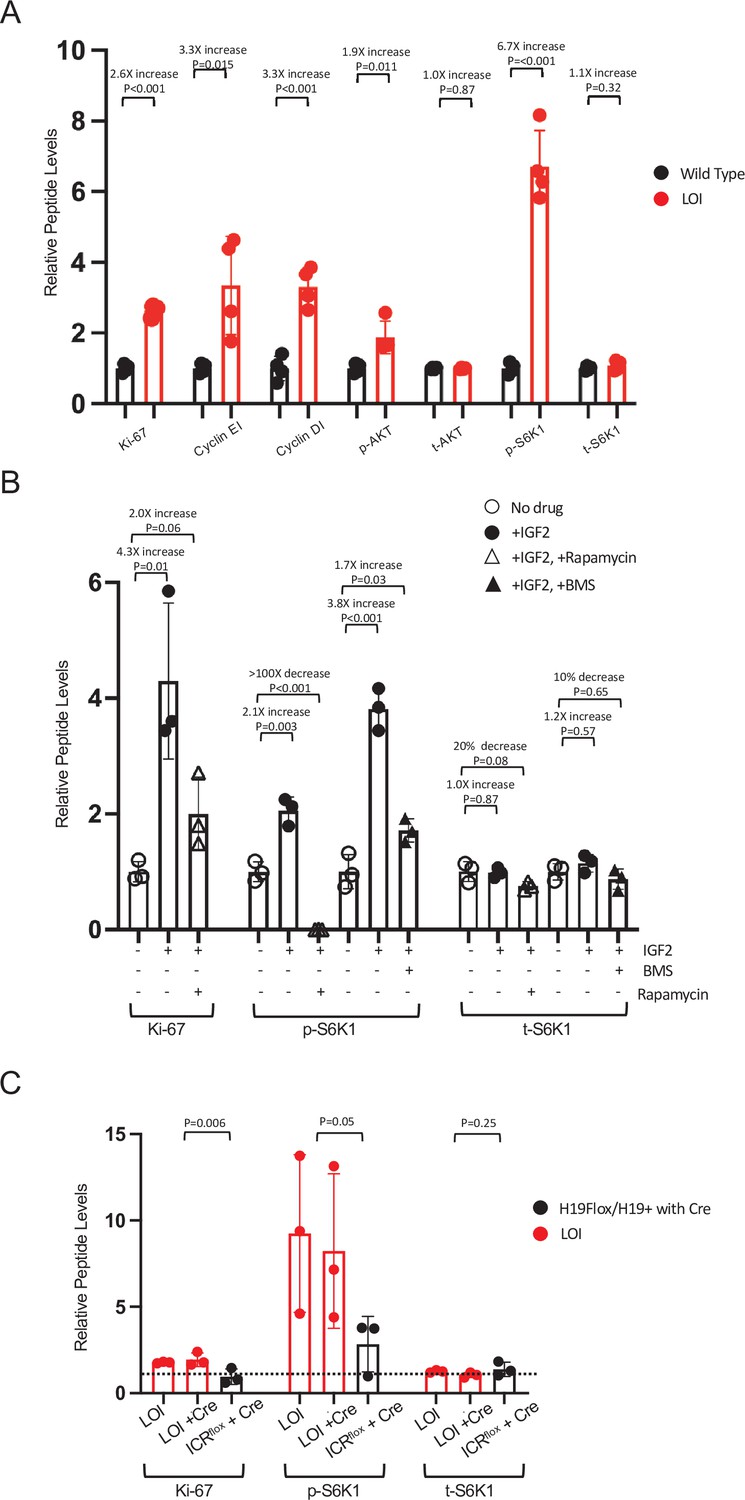
Figure 2—figure supplement 1
LOI-dependent changes in protein expression in neonatal mice – quantitated western blots.
(A) Hyperactivation of AKT/mTOR signaling in LOI neonatal hearts. See Figure 2D for representative blot. For each sample, gel loading was based on total protein concentration. Counts were first normalized to GAPDH and then these values were normalized to the average GAPDH to combine results from two gels. Biological replicates = 4. (B) Hyperactivation of AKT/mTOR in primary cardiomyocytes. See Figure 2H for representative blot. For each sample, counts were normalized to control lanes (no drug treatment). Biological replicates = 4. (C) LOI hypertrophy in neonatal LOI mice is cell non-autonomous. See Figure 2J for representative blot. Samples from littermates were run on separate gels: counts were normalized to GAPDH and then fold-changes relative to WT (H19flox/H19+ with no Cre) were calculated. Results from three gels (three independent litters) are displayed. Statistical significance was evaluated by Student’s t-test type 2. For each panel, quantitation was by NIH Image J.
Figure 2—figure supplement 2
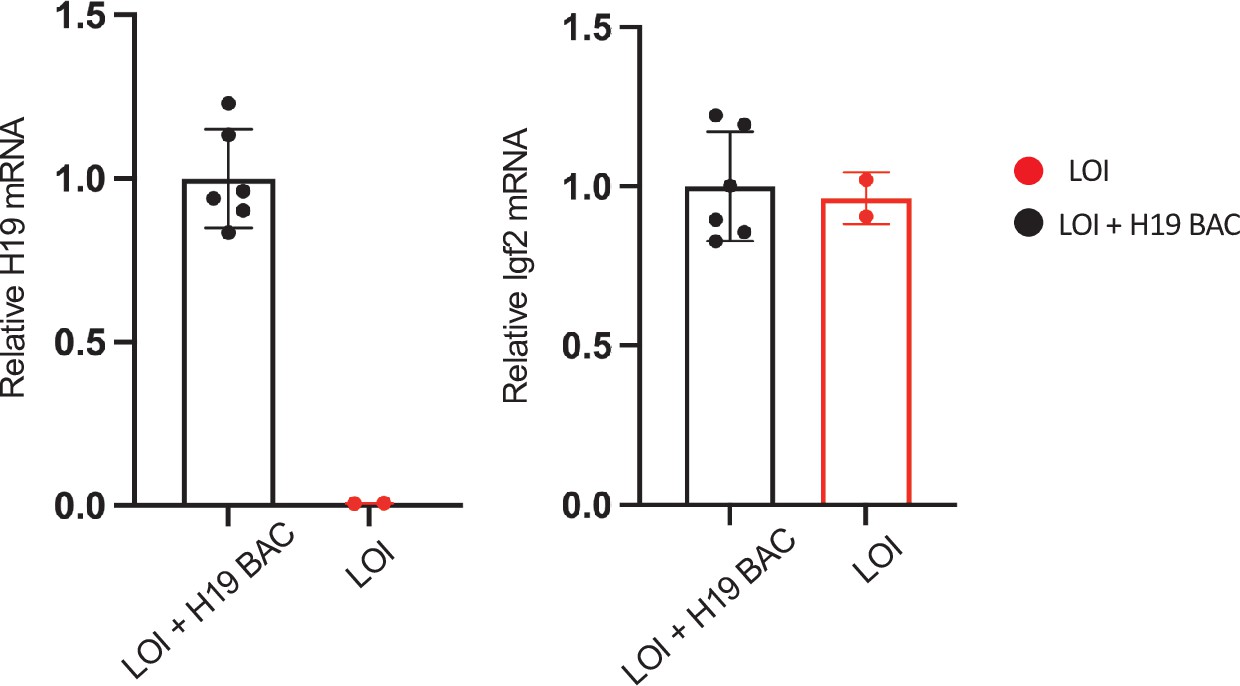
The H19 BAC transgene restores H19 expression in LOI hearts.
Hearts were isolated from LOI or from LOI+ H19 BAC transgenic littermates at postnatal day 2 and at 2 months. RNAs were extracted, analyzed by qRT-PCR, normalized to GAPDH, and then normalized to levels observed in LOI+ BAC animals. LOI+ BAC mice display H19 expression levels that are not distinguishable from wild-type animals of equivalent age.
Figure 2—figure supplement 3
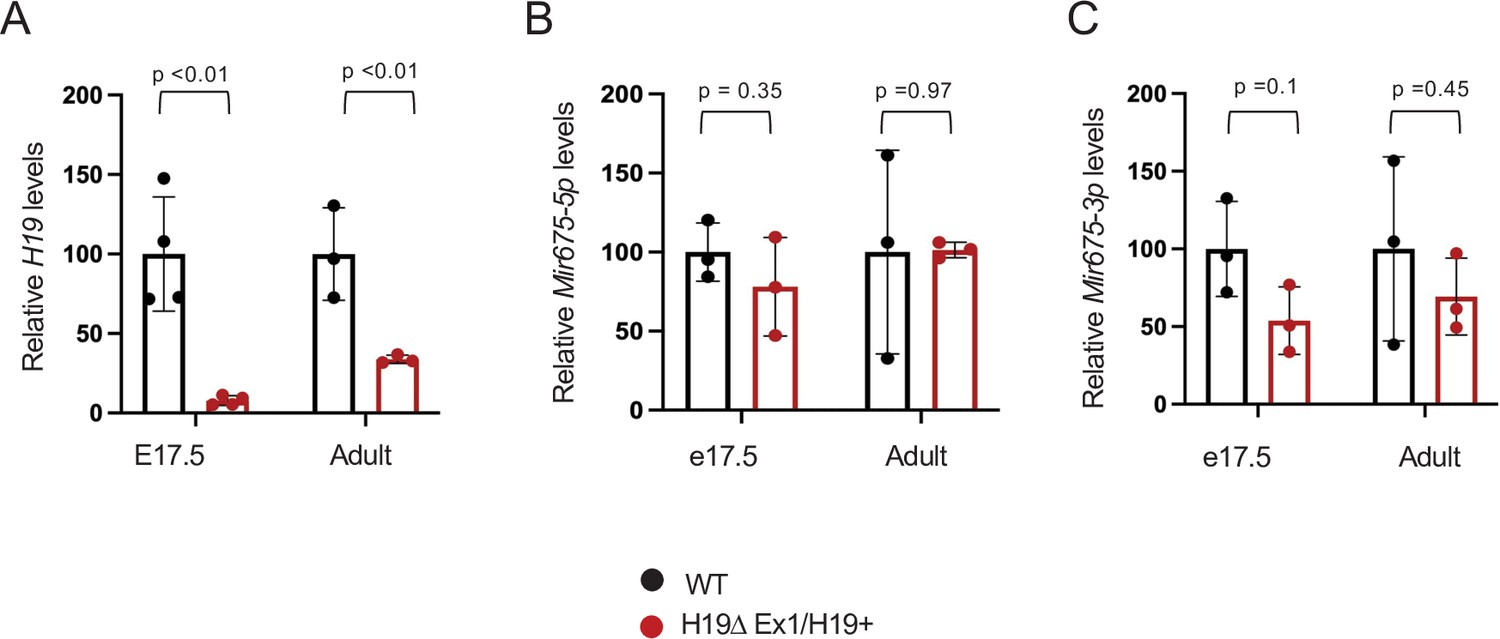
The H19ΔEx1 deletion reduces H19 lncRNA but has only only a small impact on Mir675-3p and -5p accumulation.
RNAs were extracted from whole hearts isolated from wild type and from H19ΔEx1/H19+ + at e17.5 and at 1 year of age. H19 lncRNA levels were normalized to GAPDH. Mir675 levels were normalized to U6 microRNA. In each experiment, expression in H19ΔEx1/H19+ is normalized to the wild-type littermates. Statistical significance was evaluated with Student’s t-test type 2.
Figure 2—figure supplement 4
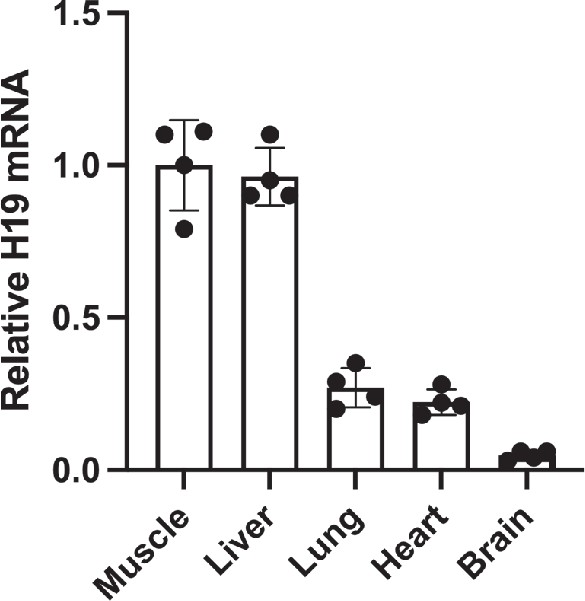
Tissue-specific expression of H19.
Tissues were isolated from wild-type littermates at postnatal day 2. RNAs were extracted, analyzed by qRT-PCR, normalized to GAPDH, and then normalized to levels observed in skeletal muscle. Statistical significance was evaluated with Student’s t-test type 2.
Figure 3 with 4 supplements
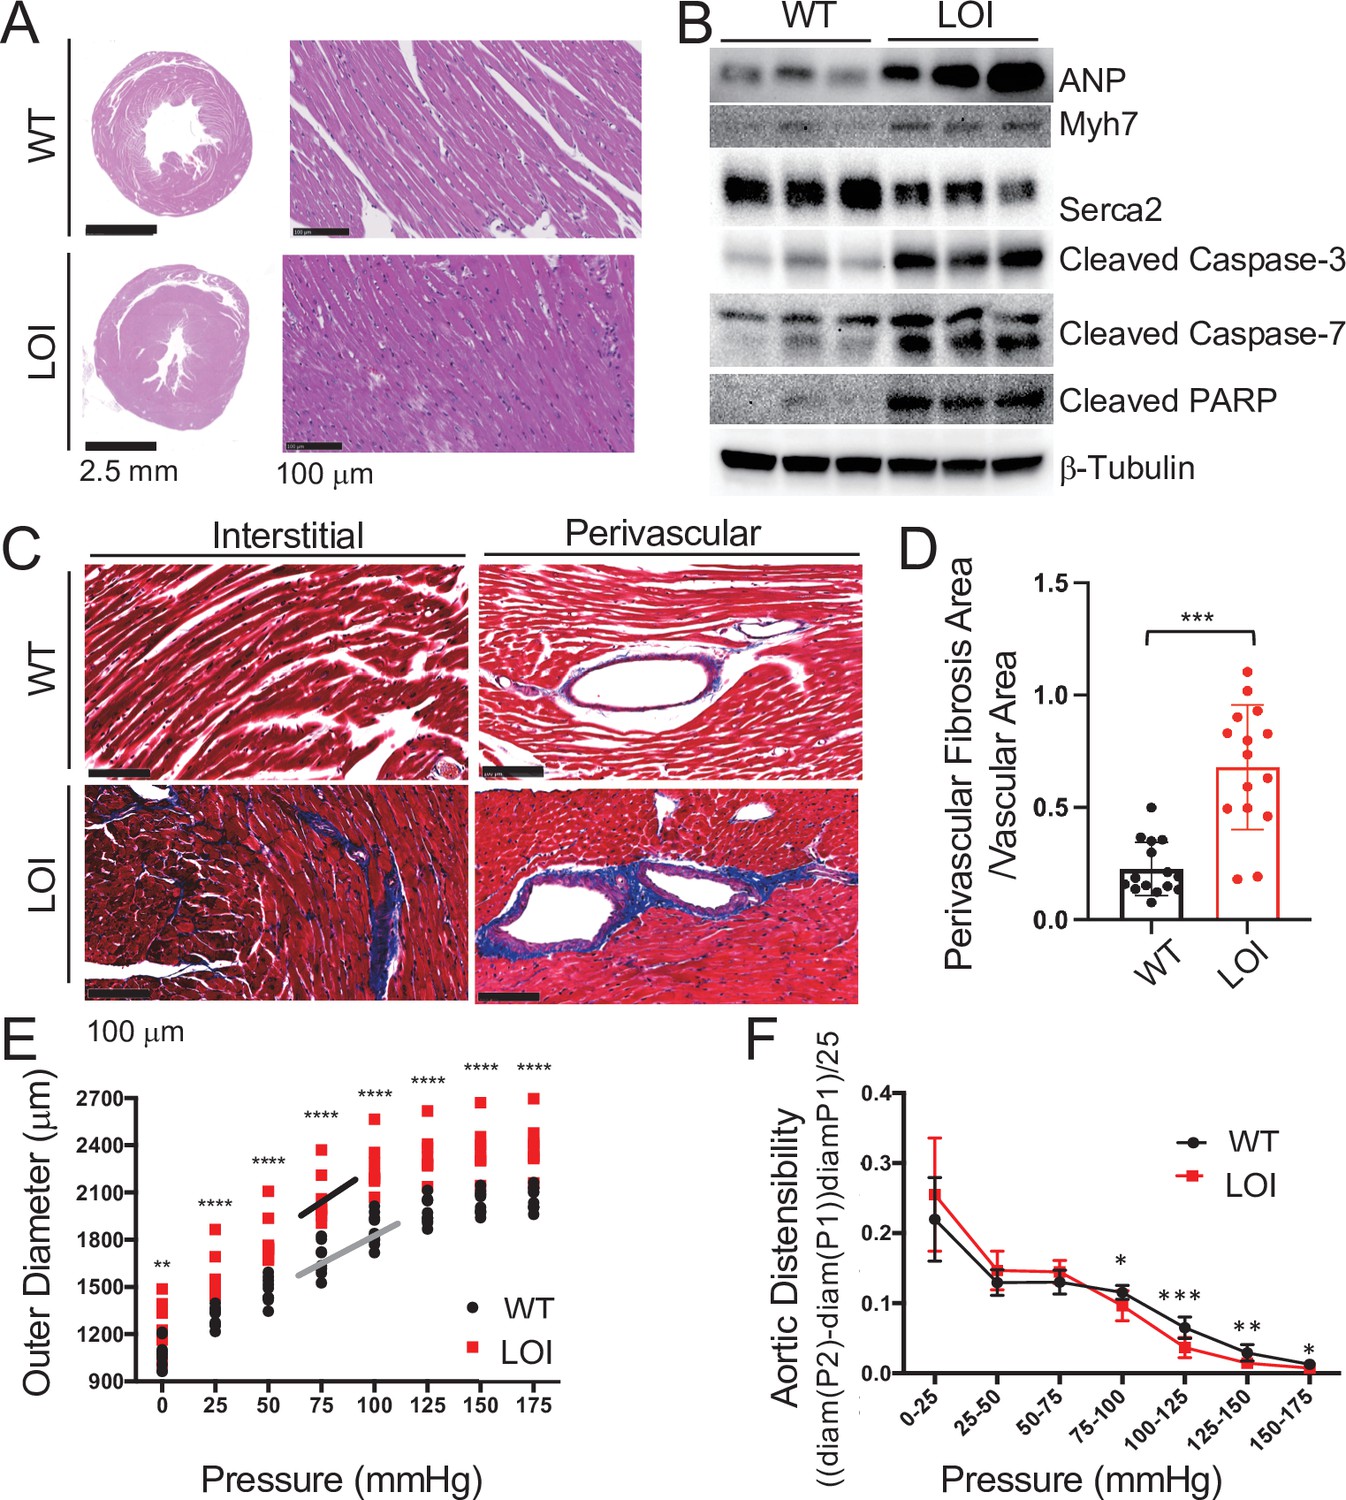
Cardiomyopathies in adult LOI mice.
(A) Transverse sections were collected midway along the longitudinal axis from hearts collected from 6-month-old wild-type (WT) and LOI mice and stained with hematoxylin and eosin. (B) Immunoblot analyses of whole heart extracts prepared from 1 year WT and LOI mice. Note the altered expression of ANP (Atrial Natriuretic Peptide), Myh7 (Myosin Heavy Chain 7), Serca2 (Sarco/endoplasmic reticulum Ca++ ATPase), Cleaved Caspase-3, and Cleaved Poly ADP Ribose Polymerase (PARP). β-Tubulin is a loading control. See Figure 3—figure supplement 1 for quantified data. (C, D) Masson’s trichrome staining of sections described in (A). Red, muscle fibers; blue, collagen. Sections from five wild-type and five LOI animals were used to calculate fibrosis. Statistical significance was evaluated with Student’s t-test type 2. (E, F) Ascending aortas were isolated from 10 wild-type and 8 LOI mice at age 20 months and pressure-diameter curves generated. (E) Increased diameters across a wide range of applied pressures. (F) Increased segmental distensibility across physiologically relevant pressures. Data were analyzed by two-way repeated measure ANOVA. Analyses of carotid arteris are described in Figure 3—figure supplement 4.
-
Figure 3—source data 1
Analyses of cardiomyopathies in adult LOI mice.
- https://cdn.elifesciences.org/articles/67250/elife-67250-fig3-data1-v2.xlsx
Figure 3—figure supplement 1
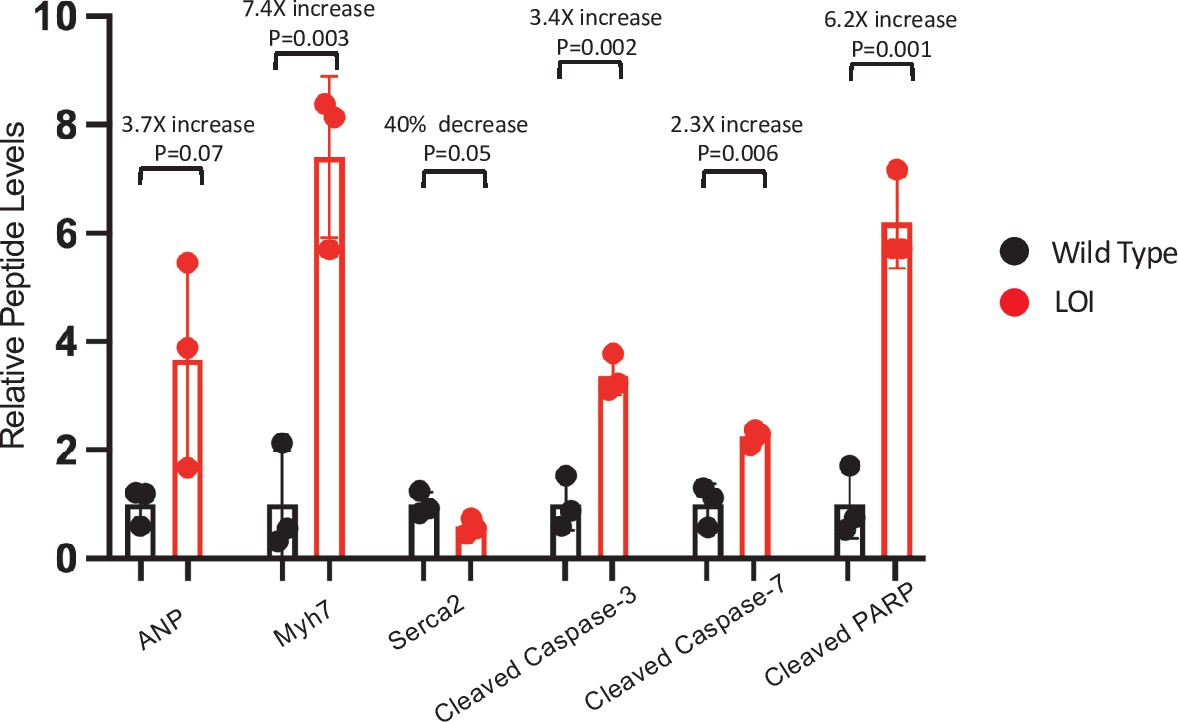
LOI-dependent changes in protein expression in adult mice – quantitated western blots.
Expression of heart failure biomarkers in adult LOI hearts. See Figure 3D for blot. Biological replicates = 3. Statistical significance was evaluated by Student’s t-test type 2.
Figure 3—figure supplement 2
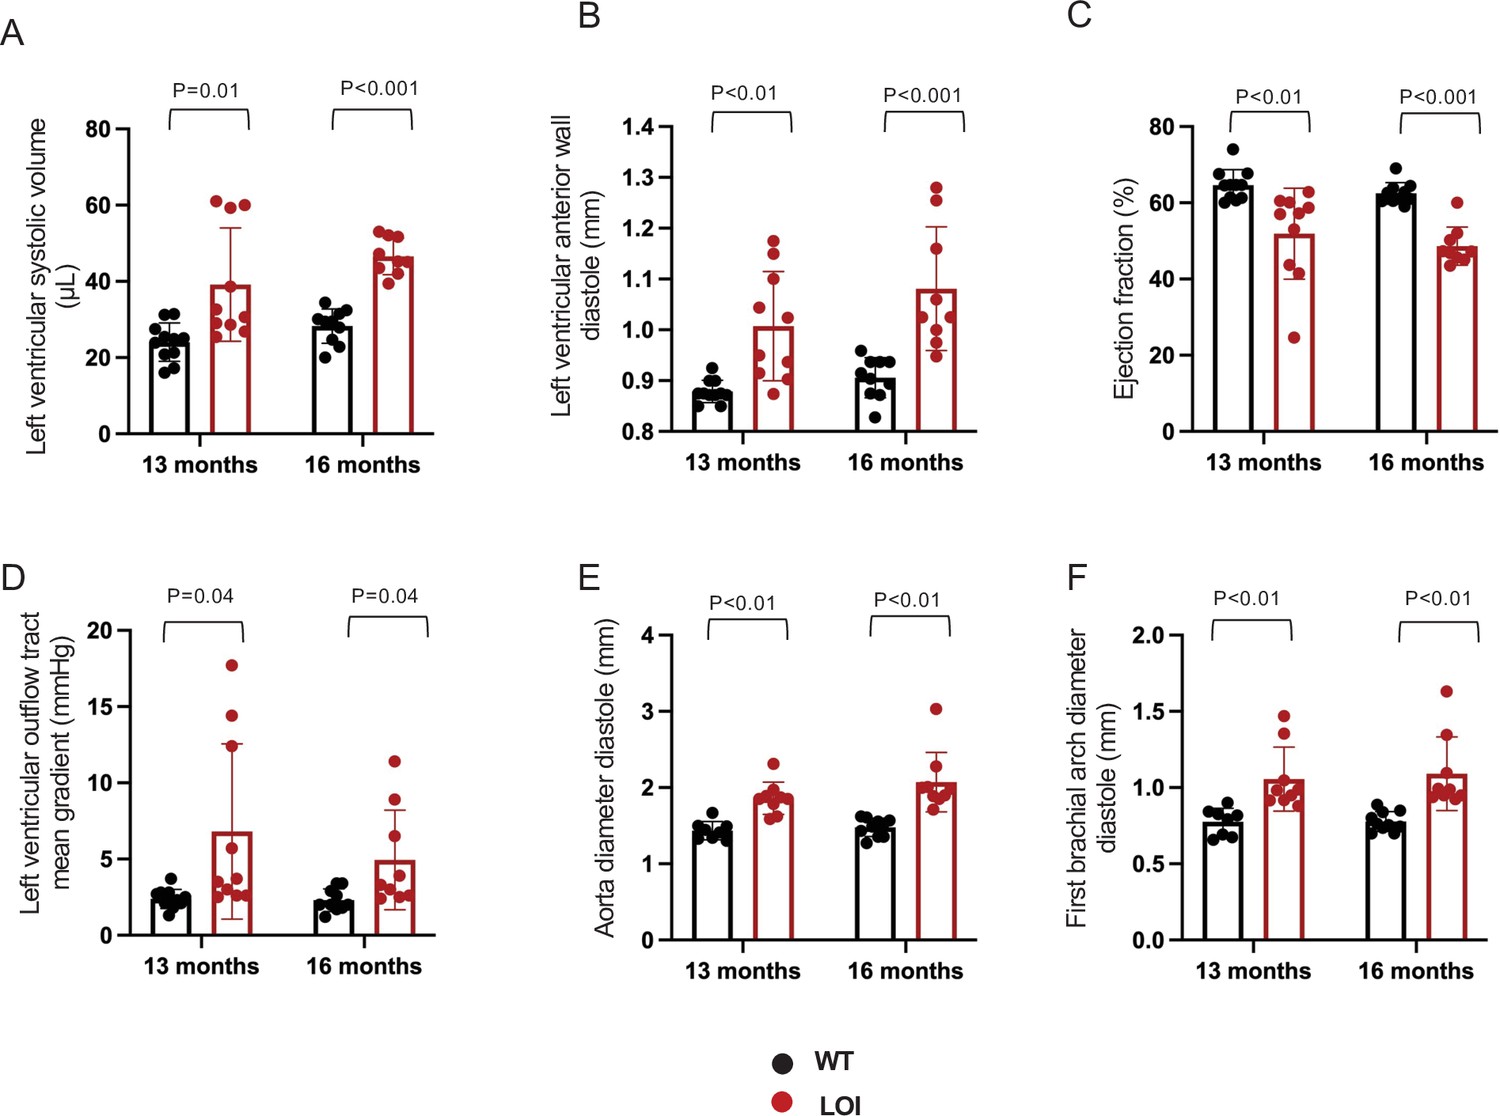
Echocardiography measures from 11 wild-type and 10 LOI mice at 13 months and for 11 wild-type and 9 LOI mice at 16 months.
Loss of imprinting results in ventricular and vascular phenotypes that vary from mouse to mouse. (A–C). Left ventricular phenotypes are progressive and stratify with time. (D–F). Arterial defects, including abnormal outflow and increased artery diameters, do not progress. Arterial diameter phenotypes are already stratified at 13 months. Statistical significance was evaluated with Student’s t-test type 1.
Figure 3—figure supplement 3
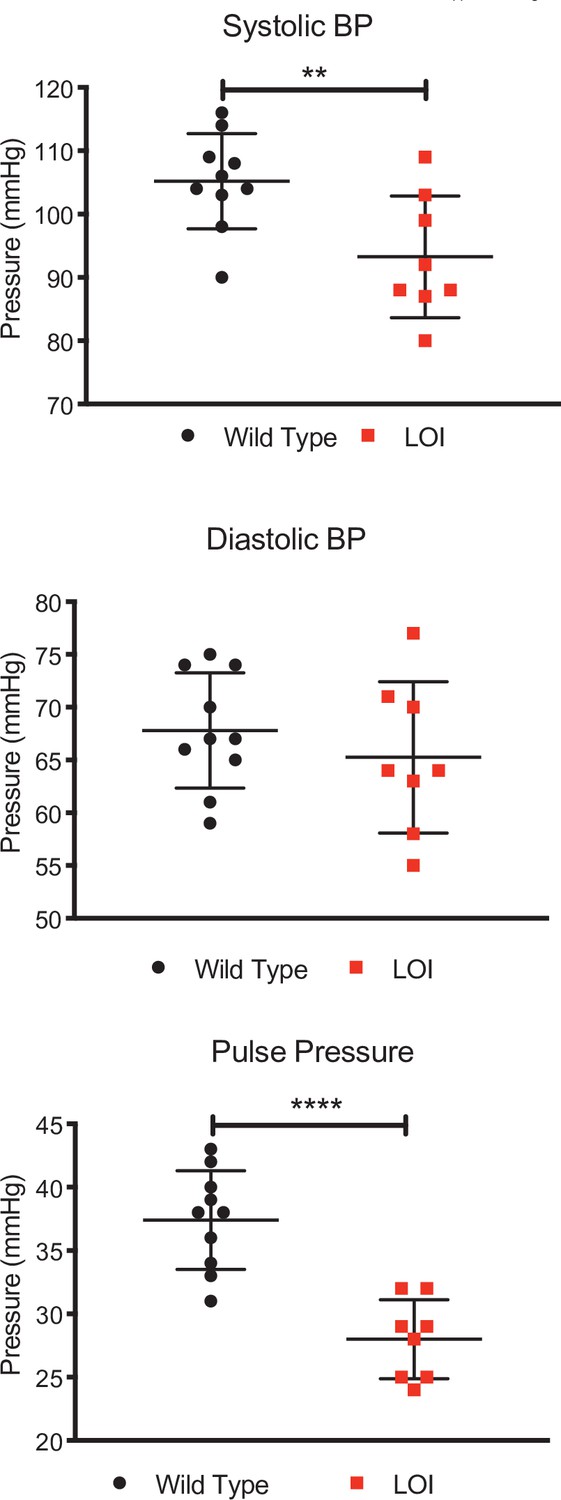
Decreased systolic and pulse pressures in LOI mice.
Blood pressures from 10 wild-type and 8 LOI sedated mice were measured as described in Materials and methods. Means and standard deviation are shown as whiskers underlying the data points. Systolic and diastolic blood pressure data were analyzed by Tukey’s test; pulse pressure data were analyzed using one-way ANOVA. **p<0.01; ****p<0.0001. Diastolic pressures were not significantly different.
Figure 3—figure supplement 4
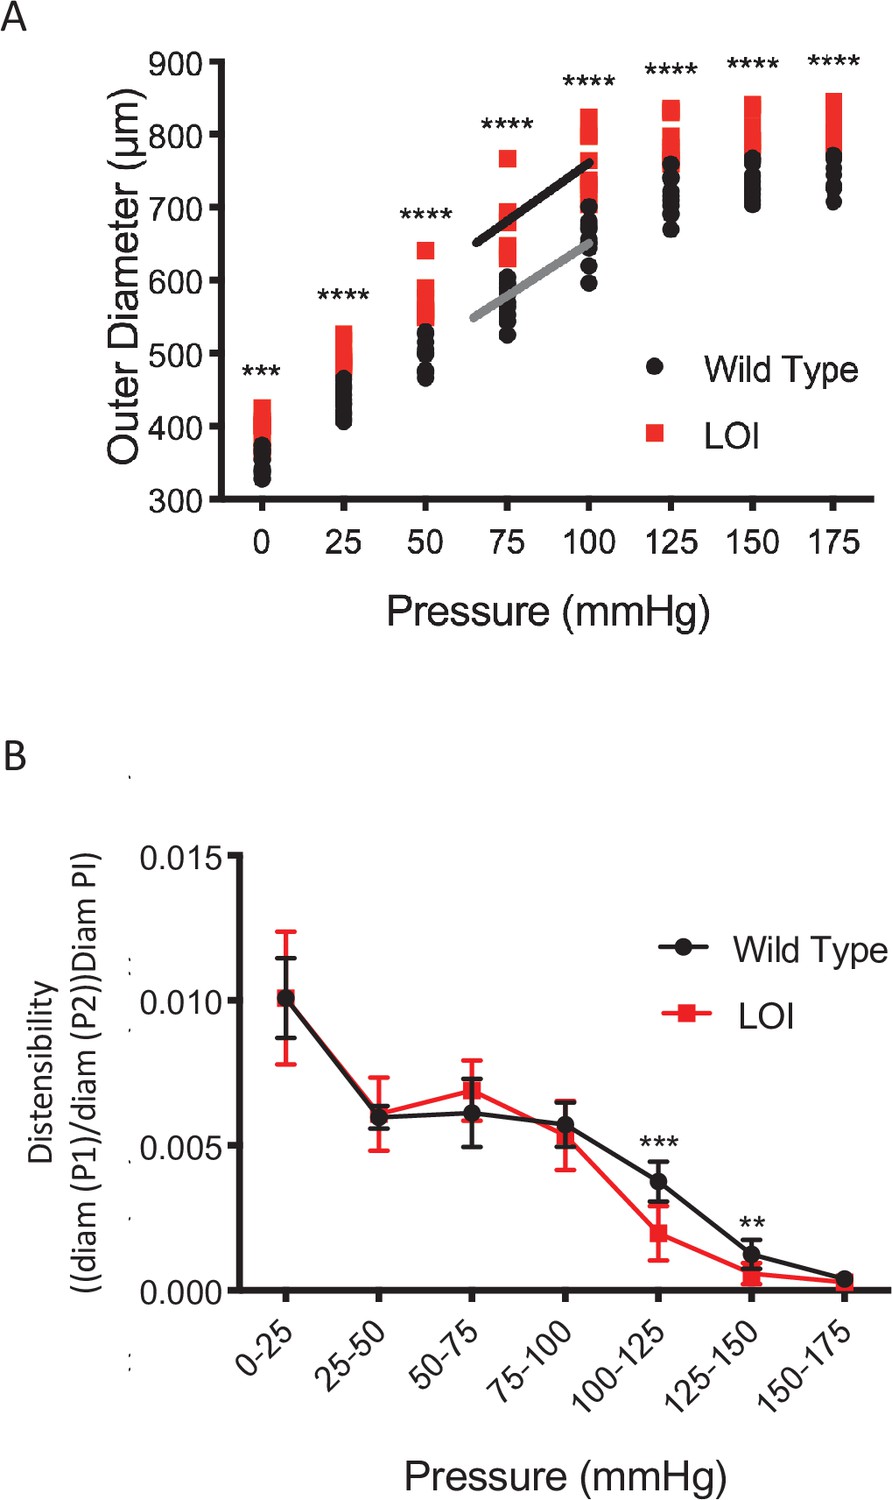
Increased vessel diameter and distensibility in carotid arteries isolated from 10 wild-type and 8 LOI mice at 16 months.
(A) Increased diameters across a wide range of applied pressures. (B) Increased segmental distensibility across physiologically relevant pressures. (A, B) **p<0.01; ***p<0.001; ****p<0.0001 (two-way repeated measure ANOVA).
Figure 4 with 1 supplement
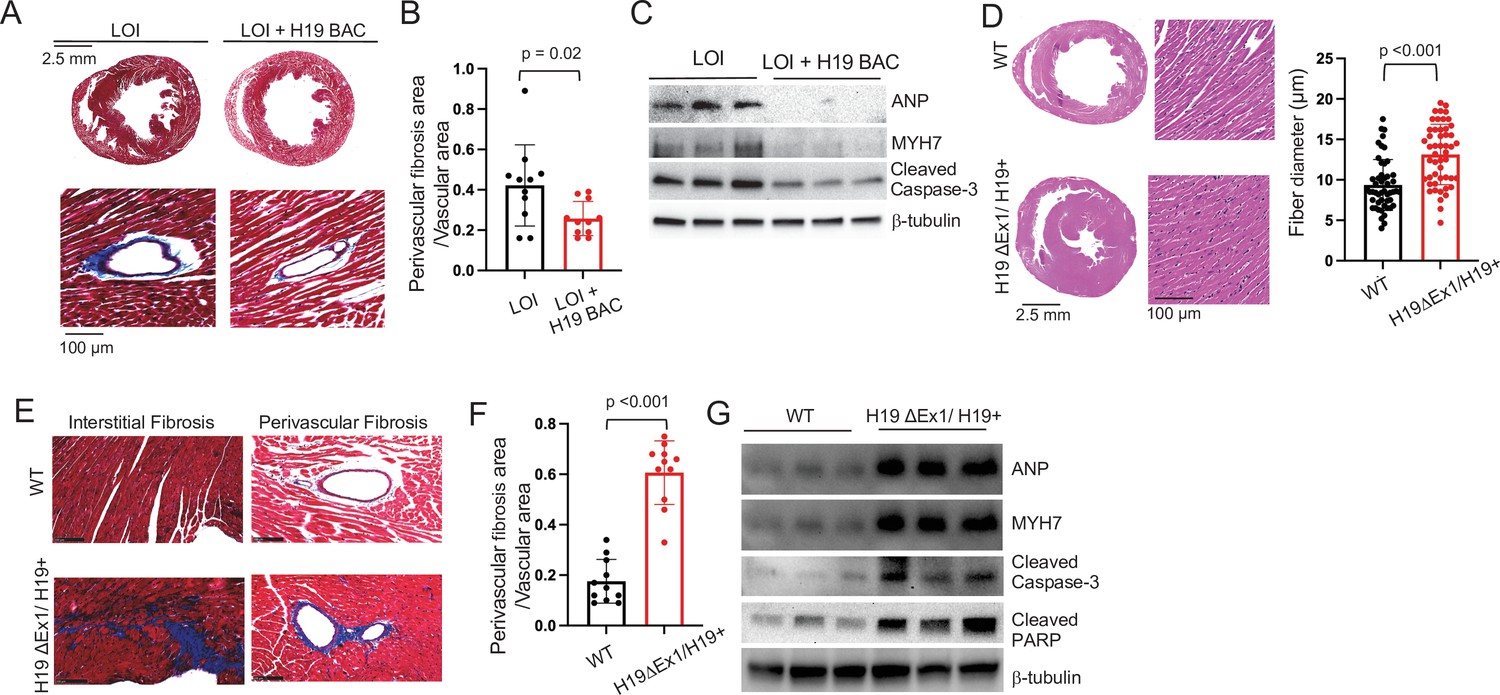
LOI pathologies in adult mice are H19-dependent.
(A–C) An H19 transgene rescues pathologies in LOI mice. Phenotypes of LOI mice or their LOI littermates that also carry an H19 Bacterial Artificial Chromosome transgene that restores wild-type levels of H19 RNA (LOI+ H19 BAC). (D–G) H19 deletion is sufficient to cause cardiac pathologies. Phenotypes in wild-type (WT) mice and in littermates carrying the H19ΔEx1 deletion. For histology (A, B, E, F) hearts were isolated from 6 month old animals and transverse sections collected midway along the longitudinal axes before staining with hematoxylin and eosin (D) or with Masson’s trichrome (A, B, E, F) Statistical significance was analyzed using Student’s t-test type 2. For immunoblotting (C, G), hearts were isolated from 1 year animals and investigated for ANP, Myh7, Serca2, Cleaved Caspase-3, and Cleaved PARP. β-Tubulin is a loading control. See Figure 4—figure supplement 1 for quantified data.
-
Figure 4—source data 1
Pathologies in LOI mice are caused by decreased function of the H19 lncRNA.
- https://cdn.elifesciences.org/articles/67250/elife-67250-fig4-data1-v2.xlsx
Figure 4—figure supplement 1
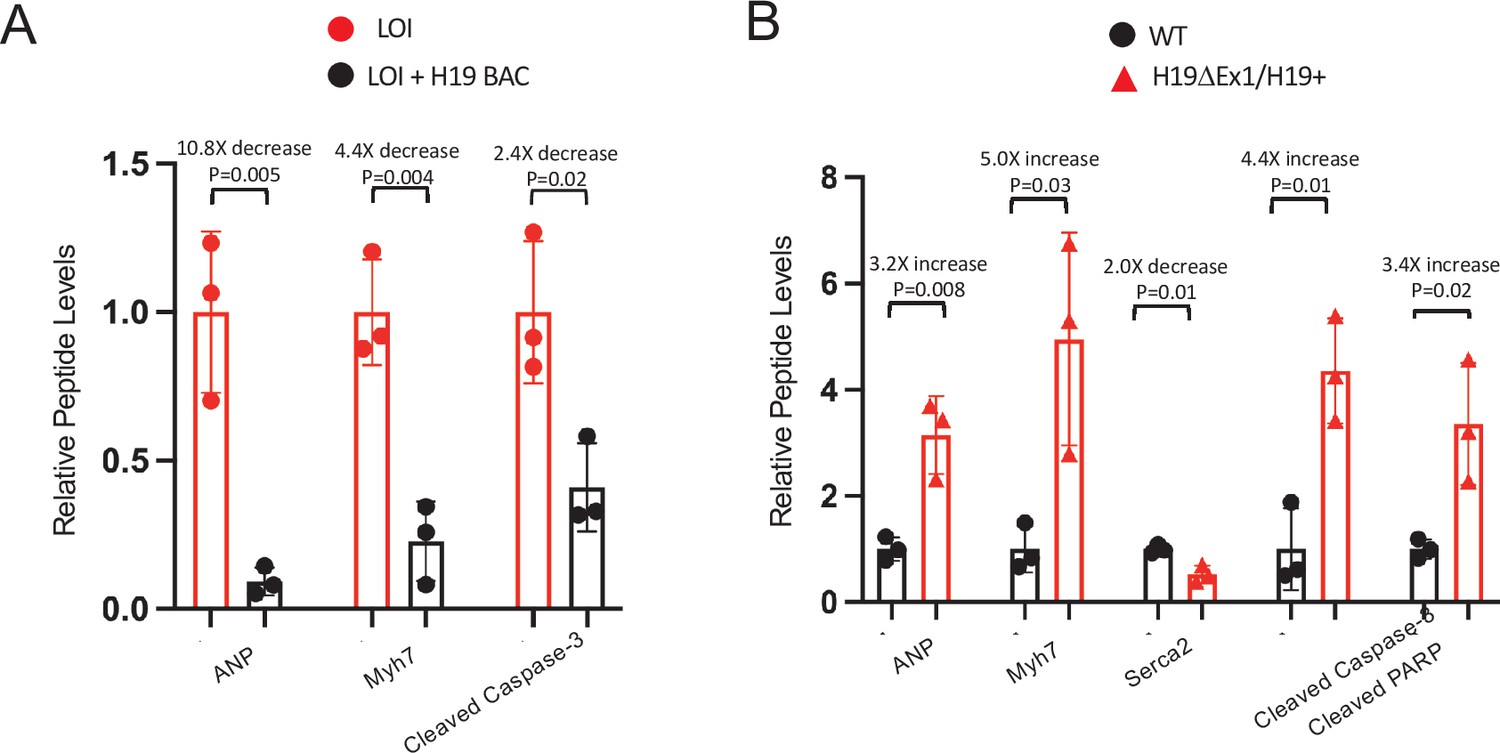
H19 dependent changes in protein expression in adult mice – quantitated Western blots.
( A) Expression of heart failure biomarkers in hearts isolated from adult LOI and in LOI+ H19 BAC transgenic littermates. See Figure 4C for representative blot. Biological replicates = 3. (B) Expression of heart failure biomarkers in hearts isolated from adult wild-type and H19ΔEx1/H19+ littermates. See Figure 4F for blot. Biological replicates = 3. For each panel, quantitation was by NIH Image J. Counts were normalized to β-tubulin and statistical significance was analyzed by Student’s t test type 1.
Figure 5 with 1 supplement

H19 influences gene expression and cell fate in cardiac endothelial cells.
(A) In situ staining for H19 (brown) in hearts from wild-type P1 neonates or 6 month adults. (B) Combined in situ and immunohistochemistry for hearts isolated from wild-type and H19ΔEx1/H19+ littermates at 6 months shows expression of H19 is concentrated in endothelial cells. Sections were stained for H19 lncRNA and then with antibodies to the endothelial marker, vWF (von Willebrand factor), or to the smooth muscle marker, α−SMA (alpha smooth muscle actin). (C) MA blot showing differences in expression of polyadenylated RNAs in H19-deficient endothelial cells. Endothelial cells were isolated from wild-type (N = 4) and H19ΔEx1/H19+ (N = 3) P2 neonatal hearts based on CD31 expression. RNAs were isolated and polyadenylated transcripts were quantitated. Genes marked in red are significantly differentially expressed at FDR < 0.05. Gene ontology analyses are described in Figure 5—figure supplement 1. (D) Transient transfection of H19ΔEx1/H19+ cardiac endothelial cells with an H19-expression vector rescues expression of key EndMT genes. Cardiac endothelial cells were isolated from wild-type and H19-deficient P2 hearts as described in (D) and transfected with empty expression vector (pcDNA3) or with pcDNA3 carrying mouse H19 gDNA (pcDNA3-H19). After + hours in culture, RNA was extracted and cDNAs synthesized and analyzed for H19, SM22α, Snail, or Slug. For each gene, cDNA levels were normalized to GAPDH and then to the levels seen in wild-type cells transfected with pcDNA3 only. (E, F). Increased frequency of EndMT transitioning cells in H19-deficient mice. (E) Hearts from wild type and H19ΔEx1/H19+ were isolated at e14.5, P1, and at 6 months. Sections were probed for endothelial cell markers (CD31 or IB4) and for mesenchymal markers (αSMA or SM22α) to identify cells co-expressing these genes. (F) Frequencies of cells co-expressing endothelial and mesenchymal markers in adult and P1 hearts. The role of H19 was determined by three independent comparisons: wild type vs. Η19ΔEx1/H19+, LOI vs LOI+ H19 BAC, wild type vs LOI. (D, F). Statistical significance was evaluated using Student’s t-test type 2.
-
Figure 5—source data 1
H19 regulates gene expression and cell fate in cardiac endothelial cells.
- https://cdn.elifesciences.org/articles/67250/elife-67250-fig5-data1-v2.xlsx
Figure 5—figure supplement 1
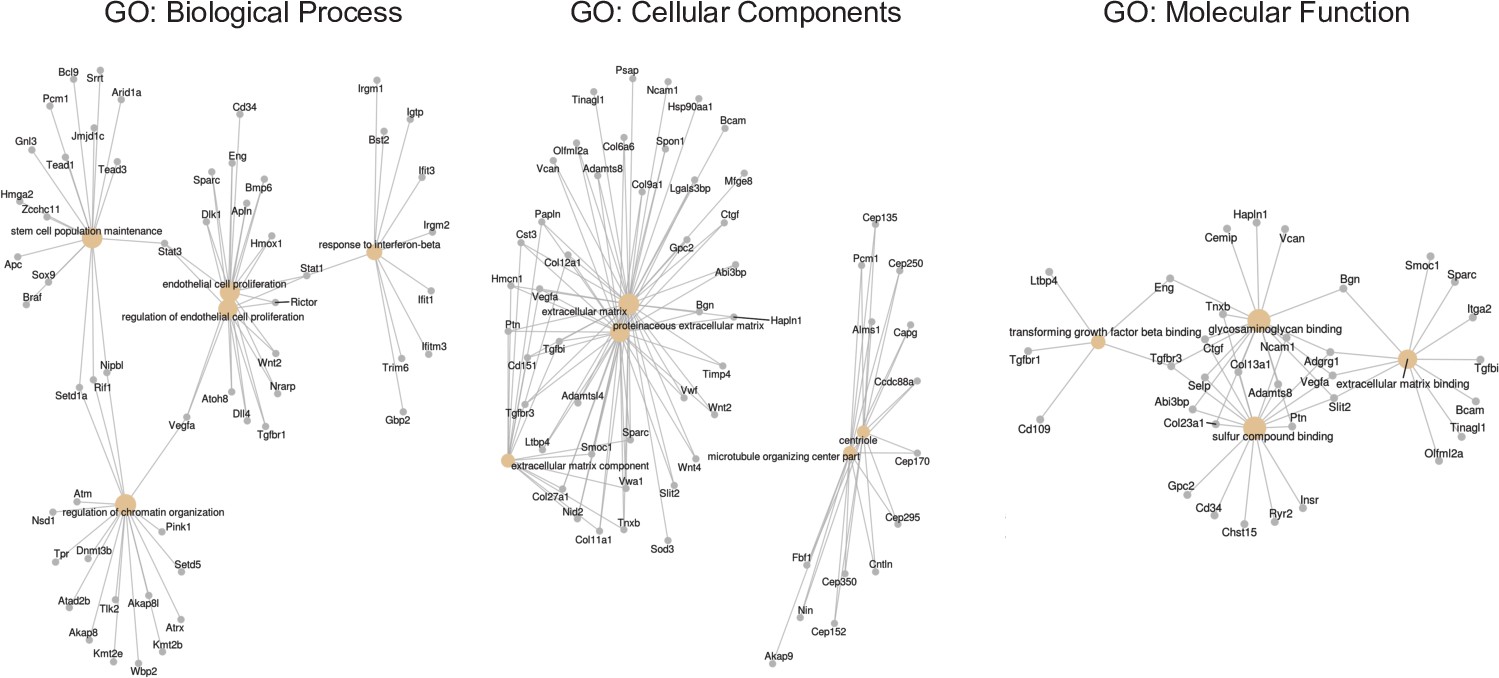
Visual representation of Gene Ontology analysis for endothelial cells isolated from wild-type (N = 4) and H19ΔEx1/H19+ (N = 3) P2 neonatal hearts.
RNAs were isolated and polyadenylated transcripts were quantitated. Cnetplot depicts linkages of genes and biological concepts as a network. Nodes identify complex associations of genes that contribute to a functional term within a pathway. GO: Biological Process indicates enriched mesenchymal biological markers and regulation of endothelial proliferation genes. GO: Cellular Components indicate enrichment in extracellular matrix genes. GO: Molecular function indicates enrichment in extracellular matrix and TGF-beta binding genes.
Figure 6 with 2 supplements

H19’s Mirlet7 binding domains are essential for normal function.
(A) The H19ΔLet7 allele was generated by deleting 25 and 48 bp sequences within exons 1 and 4 to eliminate binding sites for Mirlet7g, Mirlet7i, and Mirlet7e miRNAs. (B) The H19ΔLet7 allele is expressed at wild-type levels. RNAs were isolated from hearts from H19ΔLet7/H19+ and quantitated by qRT-PCR, normalizing first to GAPDH and then to the levels of H19 observed in H19+/H19+. Similarly, Igf2 is expressed at equivalent levels in wild-type and mutant mice. Thus phenotypes associated with the H19Δlet7 allele should be ascribed to changes in H19 function and not to changes in H19 levels or in Igf2 expression. See Figure 6—figure supplement 1 for experiments demonstrating that the H19Δlet7 lncRNA cannot interact with Mirlet7 miRNAs. (C) Transverse sections were collected midway along the longitudinal axis from hearts collected from 12-month-old wild-type (N = 4) and mutant (N = 3) littermates and stained with hematoxylin and eosin. (D) Fiber diameters were quantitated using three sections per mouse. (E, F). Masson’s trichrome staining of sections described in panel (C) Red, muscle fibers; blue, collagen. Sections from three wild-type and four mutant littermates were used to calculate fibrosis. (G) Immunoblot analyses of whole heart extracts prepared from 12 month WT (N = 3) and mutant littermates (N = 3). Altered expression of ANP, Myh7, Cleaved Caspase-3, Cleaved Caspase-7, and Cleaved PARP. β-tubulin is a loading control. Quantified data is presented in Figure 6—figure supplement 2. Statistical significance was evaluated with Student’s t-test type 2.
-
Figure 6—source data 1
Mirlet7 binding sites on the H19lncRNA are essential to prevent cardiomyopathy.
- https://cdn.elifesciences.org/articles/67250/elife-67250-fig6-data1-v2.xlsx
Figure 6—figure supplement 1
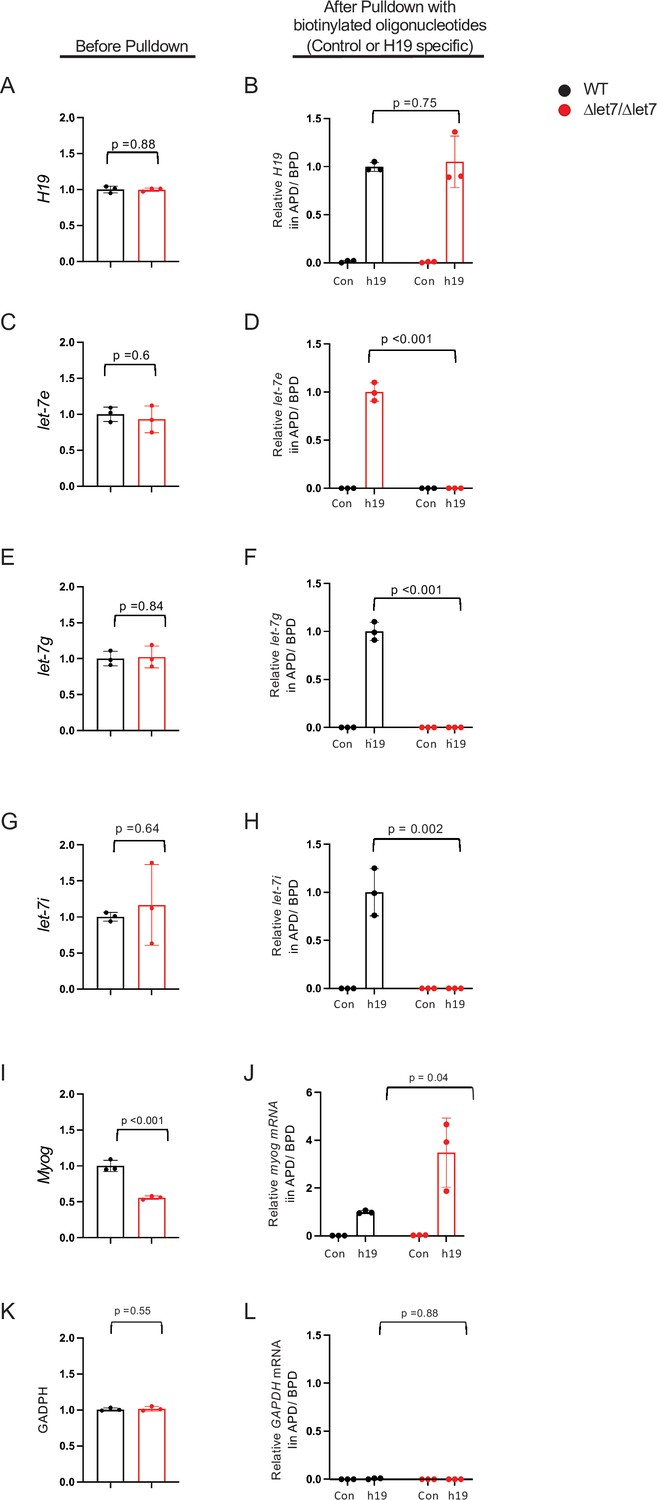
Mirlet7e, -g, and -i miRNAs copurify with wild-type H19 lncRNA, but not with the H19Δlet7 mutant RNA.
Primary myoblasts were prepared from wild-type and from H19Δlet7/H19Δlet7 neonatal littermates. (A, C, E, G, I and K) (Before Pulldown) RNAs in total cell extracts were quantitated by qRT-PCR. H19, MyoG, and Mirlet7 RNAs were normalized first to GAPDH and then to the levels seen in wild-type samples. GAPDH was normalized first to total cellular RNA and then to the levels seen in wild-type samples. Note that expression of H19 lncRNA (A) and of Mirlet7 miRNAs (C, E, G) is equivalent in wild-type and mutant cells. (B, D, F, H, J, and L) (After Pulldown) Purification of H19 was performed as described in Methods. Briefly, cell extracts were crosslinked with paraformaldehyde and then incubated with a set of biotinylated oligonucleotides that are specific to H19 lncRNA (h19). As a control, extracts were alternatively incubated with an oligonucleotide designed to exclude binding to H19 lncRNA (con). After purification with biotin beads, crosslinks were reversed and pelleted RNAs were quantitated by qRT-PCR and normalized to levels in total extracts. (B) Efficient purification of H19 lncRNA from both wild-type and mutant extracts. (D, F, and H) Mirlet7 miRNAs co-purify only with wild-type and not with H19Δlet7 lncRNA. (J) The effect of the Δlet7 deletion on H19 interactions with other RNAs is specific: MyoG RNA copurifies with both wild-type and mutant H19 lncRNAs. (L) GAPDH is a negative control that co-purifies with neither wild type nor mutant H19. Three independently derived cell lines of each genotype were analyzed. Statistical significance was evaluated using a Student’s t-test type 2. APD, after pulldown; BPD, before pulldown.
Figure 6—figure supplement 2
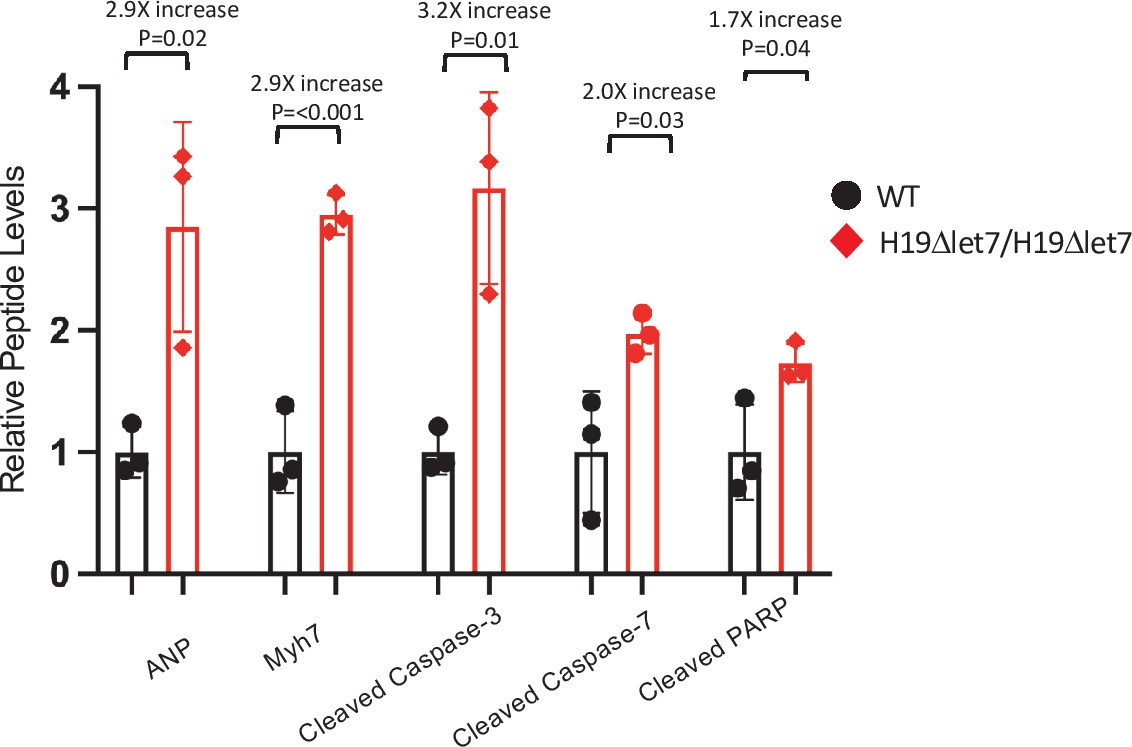
H19-dependent changes in protein expression in adult mice – quantitated western blots.
Expression of heart failure biomarkers in hearts isolated from adult wild-type and H19Δlet7/H19Δlet7 littermates. See Figure 4F for blot. Biological replicates = 3. Gels were loaded based on total protein concentration in each extract and blots were quantified using NIH Image J software. Counts were normalized to β-tubulin, and statistical significance was evaluated by Student’s t-test type 2.
Tables
Table 1
Echocardiograph of wild-type (WT) and loss of imprinting (LOI) mice at 13 and at 16 months.
| Phenotype | 13 months | 16 months | ||||||
|---|---|---|---|---|---|---|---|---|
| Mean ± SEM | p-value | % Change | Mean ± SEM | p-value | % Change | |||
| Wt (N = 11) | Loi (N = 10) | Wt (N = 11) | Loi (N = 9) | |||||
| Heart rate (bpm) | 504 ± 12 | 499 ± 11 | 0.77 | -1 | 529 ± 20 | 540 ± 16 | 0.77 | 2 |
| LV volume systole (μl) | 24.1 ± 1.5 | 39.2 ± 4.7 | 0.01 | 63 | 28.3 ± 1.4 | 46.6 ± 1.6 | <0.001 | 65 |
| LV volume diastole (μl) | 67.9 ± 3.0 | 79.8 ± 4.6 | 0.05 | 17 | 74.2 ± 2.8 | 91.3 ± 3.3 | <0.001 | 23 |
| LV EF (%) | 64.7 ± 1.2 | 51.9 ± 3.8 | <0.01 | –19 | 62.5 ± 0.9 | 48.6 ± 1.7 | <0.001 | –22 |
| LVAW systole (mm) | 1.40 ± 0.01 | 1.44 ± 0.02 | 0.09 | 3 | 1.39 ± 0.01 | 1.52 ± 0.04 | 0.01 | 8 |
| LVAW diastole (mm) | 0.88 ± 0.01 | 1.01 ± 0.03 | <0.01 | 15 | 0.91 ± 0.01 | 1.08 ± 0.04 | < 0.001 | 20 |
| LVPW systole (mm) | 1.35 ± 0.01 | 1.39 ± 0.02 | 0.17 | 3 | 1.34 ± 0.01 | 1.42 ± 0.03 | 0.4 | 6 |
| LVPW diastole (mm) | 0.87 ± 0.02 | 0.98 ± 0.04 | 0.02 | 12 | 0.88 ± 0.02 | 1.08 ± 0.04 | <0.001 | 19 |
| LVOT mean gradient | 2.4 ± 0.2 | 6.8 ± 1.8 | 0.04 | 185 | 2.3 ± 0.2 | 4.9 ± 1.1 | 0.04 | 115 |
| LVOT mean velocity | 768 ± 30 | 1211 ± 162 | 0.02 | 58 | 750 ± 37 | 1066 ± 112 | 0.02 | 42 |
| LVOT peak gradient | 5.8 ± 0.3 | 15.7 ± 3.7 | 0.03 | 170 | 5.5 ± 0.5 | 13.3 ± 3.3 | 0.04 | 143 |
| LVOT peak velocity | 1201 ± 35 | 1870 ± 215 | 0.01 | 56 | 1158 ± 52 | 1732 ± 200 | 0.02 | 50 |
| Aorta systole (mm) | 1.65 ± 0.04 | 2.14 ± 0.10 | <0.01 | 30 | 1.70 ± 0.04 | 2.25 ± 0.12 | 0.002 | 32 |
| Aorta diastole (mm) | 1.44 ± 0.04 | 1.86 ± 0.07 | 0.001 | 30 | 1.48 ± 0.04 | 2.07 ± 0.13 | 0.002 | 40 |
| First brachial arch (mm) | 0.78 ± 0.03 | 1.06 ± 0.07 | 0.003 | 36 | 0.78 ± 0.02 | 1.09 ± 0.08 | 0.004 | 40 |
-
Table 1—source data 1
Analyses of heart function in wild type and LOI adult mice.
- https://cdn.elifesciences.org/articles/67250/elife-67250-table1-data1-v2.xlsx
Key resources table
| Reagent type (species) or resource | Designation | Source or reference | Identifiers | Additional information |
|---|---|---|---|---|
| Gene (Mus musculus) | H19 | GeneBank | NR_130973.1 | |
| Strain, strain background (Mus musculus) | C57BL/6 J (B6) | Jackson Labs | Jax: 000664 | |
| Strain, strain background (Mus musculus) | B6.FVB-Tg (Myh6-cre)2,182Mds/J | Jackson Labs | Jax: 011038 | |
| Strain, strain background (Mus musculus) | H19ΔICR | Previous study from this lab | PMID:10817754 | Maintained by B6 backcross |
| Strain, strain background (mouse) | H19 BAC Transgene | Previous study from this lab | PMID:10921905 | Maintained by B6 backcross |
| Strain, strain background (mouse) | H19ΔEx1 | Previous study from this lab | PMID:12270940 | Maintained by B6 backcross |
| Strain, strain background (mouse) | H19ΔLet7 | This study | See Materials and methods | Maintained by B6 backcross |
| Cell line (Rattus norvegicucs) | H9c2 cells: Rat myocardium (embryo) | ATCC CRL-1446 | RRID:CVCL_0286 | |
| Transfected construct (vector control) | pcDNA3.1+ | Invitrogen | V790-20 | |
| Biological sample (Mus musculus) | Primary myoblasts | This study | See Materials and methods | Isolated from neonates |
| Biological sample (Mus musculus) | Primary cardiac endothelial cells | This study | See Materials and methods | Freshly isolated from neonates |
| Biological sample (Mus musculus) | Primary cardiomycytes | This study | See Materials and methods | Freshly isolated from neonates |
| Antibody | See Supplementary file 3 for list of 23 primary and six secondary antibodies | |||
| Recombinant DNA reagent | pcDNA3-H19 | This study | Mouse EcoRI-SalI fragment cloned into Nhe-XhoI of pcDNA3 | |
| Sequence-based reagent | See Supplementary file 2 for list of oligonucleotides used for PCR | |||
| Peptide, recombinant protein | Human Recombinant IGF2 | Preprotech | Catalog # 100–12 | |
| Commercial assay or kit | Mouse IGF2 ELISA Kit | Abcam | ab100696 | |
| Commercial assay or kit | H19 in situ probe | Advanced Cell Diagnostics | ACD 423751 | |
| Commercial assay or kit | H19 in situ probe | Advanced Cell Diagnostics | ACD 322360 | |
| Chemical compound, drug | BMS 754807 | Active Biochem | A-1013 | |
| Chemical compound, drug | MEK1/2 Inhibitor PD98059 | Cell Signaling Technology | #9900 | |
| Software, algorithm | DESeq2 | RRID:SCR_015687 | ||
| Software, algorithm | Bioconductor | RRID:SCR_006442 | ||
| Software, algorithm | Feature Counts | RRID:SCR_012919 | ||
| Software, algorithm | Debian | RRID:SCR_006638 | ||
| Software, algorithm | STAR | RRID:SCR_004463 |
Additional files
-
Supplementary file 1
Correlations between echocardiography phenotypes in 13 month old mice.
As described in the text, each mouse presents a unique array of phenotypes. LV, left ventricular; AW, anterior wall; OT, outflow tract; sys, systole; dia, diastole.
- https://cdn.elifesciences.org/articles/67250/elife-67250-supp1-v2.xlsx
-
Supplementary file 2
Primers used for qRT-PCR and for genotyping.
- https://cdn.elifesciences.org/articles/67250/elife-67250-supp2-v2.xlsx
-
Supplementary file 3
Antibodies used in this study.
- https://cdn.elifesciences.org/articles/67250/elife-67250-supp3-v2.xlsx
-
Transparent reporting form
- https://cdn.elifesciences.org/articles/67250/elife-67250-transrepform1-v2.pdf
Download links
A two-part list of links to download the article, or parts of the article, in various formats.
Downloads (link to download the article as PDF)
Open citations (links to open the citations from this article in various online reference manager services)
Cite this article (links to download the citations from this article in formats compatible with various reference manager tools)
Cardiac pathologies in mouse loss of imprinting models are due to misexpression of H19 long noncoding RNA
eLife 10:e67250.
https://doi.org/10.7554/eLife.67250


