Local projections of layer Vb-to-Va are more prominent in lateral than in medial entorhinal cortex
- Kavli institute for Systems Neuroscience, Center for Computational Neuroscience, Egil and Pauline Braathen and Fred Kavli Center for Cortical Microcircuits, NTNU Norwegian University of Science and Technology, Norway
- Laboratory of Systems Neuroscience, Tohoku University Graduate School of Life Sciences, Japan
Figures
Figure 1 with 4 supplements
Lateral entorhinal cortex (LEC) and medial entorhinal cortex (MEC) layer Vb (LVb) neurons show distinct morphological features.
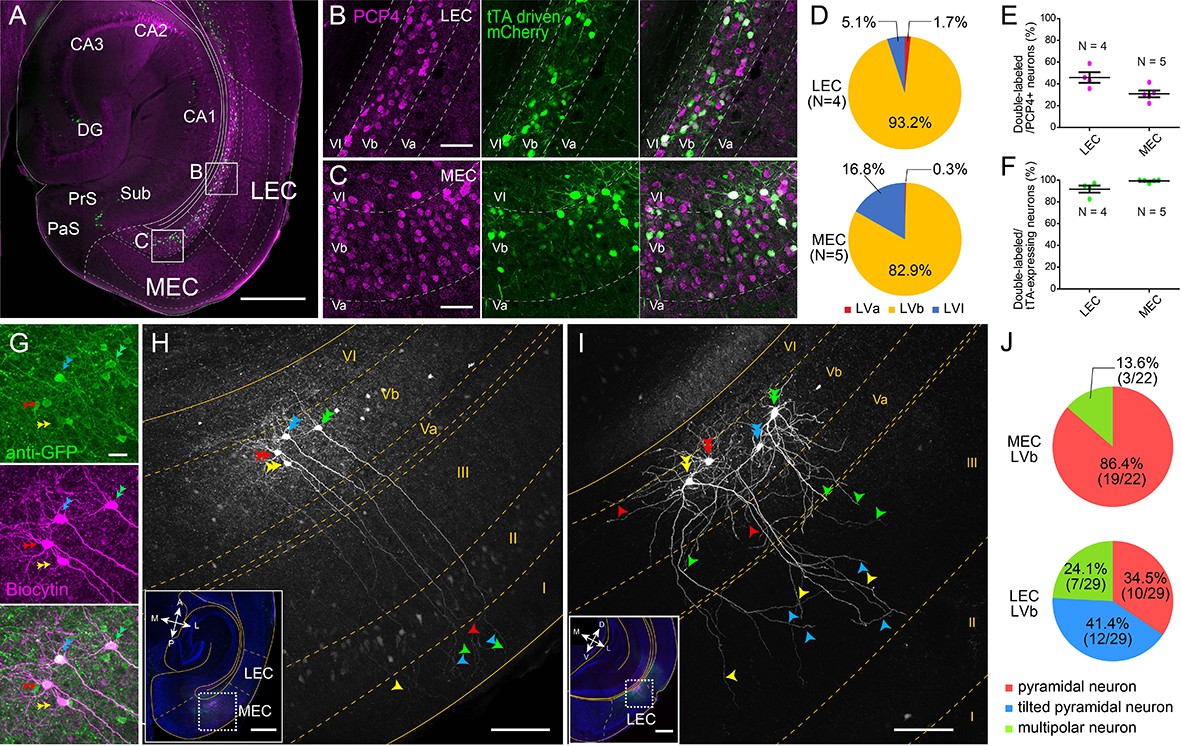
(A–C) Expression of tetracycline-controlled transactivator (tTA) in the enhancer-driven gene expression (EDGE) mouse line (MEC-13-53D), which is visualized with mCherry (green) by crossing to a tTA-dependent mCherry line. A horizontal section was immunostained with an anti-Purkinje cell protein 4 (PCP4) antibody (magenta) to label entorhinal LVb neurons. Images of LEC (B) and MEC (C) correspond with the boxed areas in (A) and show from left to right PCP4 expression, mCherry expression, and a merged image. (D) Percentage of tTA-expressing neurons among layers in LEC and MEC. (E) Percentage of tTA-expressing neurons among the total PCP4-positive neurons in LEC and MEC. (F) Percentage of PCP4-positive neurons among the total tTA-expressing neurons in LEC and MEC. Error bars: mean ± standard errors. The tTA-expressing neurons mainly distributed in LVb of EC and colocalized with PCP4. (G–I) Morphology of LVb neurons targeted in MEC-13-53D in MEC (G, H) and LEC (I). tTA-expressing LVb neurons were first labeled with green fluorescent protein (GFP) (green) by injecting AAV2/1-TRE-Tight-EGFP in MEC-13-53D, and then intracellularly filled with biocytin (magenta, G) Images of MEC (H) and LEC (I) show biocytin labeling, which correspond with the boxed area in each inset. The four neurons shown in (G) correspond to the neurons in (H). Double arrowheads show the cell bodies, the single arrowheads show their dendrites, and different neurons are marked in different colors (green, blue, red, and yellow). The distribution of apical dendrites largely differs between MEC-LVb and LEC-LVb neurons. (J) Proportion of morphologically identified cell types of LVb neurons in LEC and MEC. These data were obtained in 10 animals and 22 slices. Scale bars represent 500 μm for (A) and inset of (H) and (I), 100 μm for (H) and (I), 50 μm for (B) and (C), and 20 μm for (G). Figure 1—source data 1. See also Figure 1—figure supplement 1, Figure 1—figure supplement 2, Figure 1—figure supplement 3, and Figure 1—figure supplement 4.
-
Figure 1—source data 1
Specificity of tetracycline-controlled transactivator expression in MEC-13-53D.
- https://cdn.elifesciences.org/articles/67262/elife-67262-fig1-data1-v2.xlsx
Figure 1—figure supplement 1
Laminar organization of lateral entorhinal cortex (LEC) and medial entorhinal cortex (MEC).
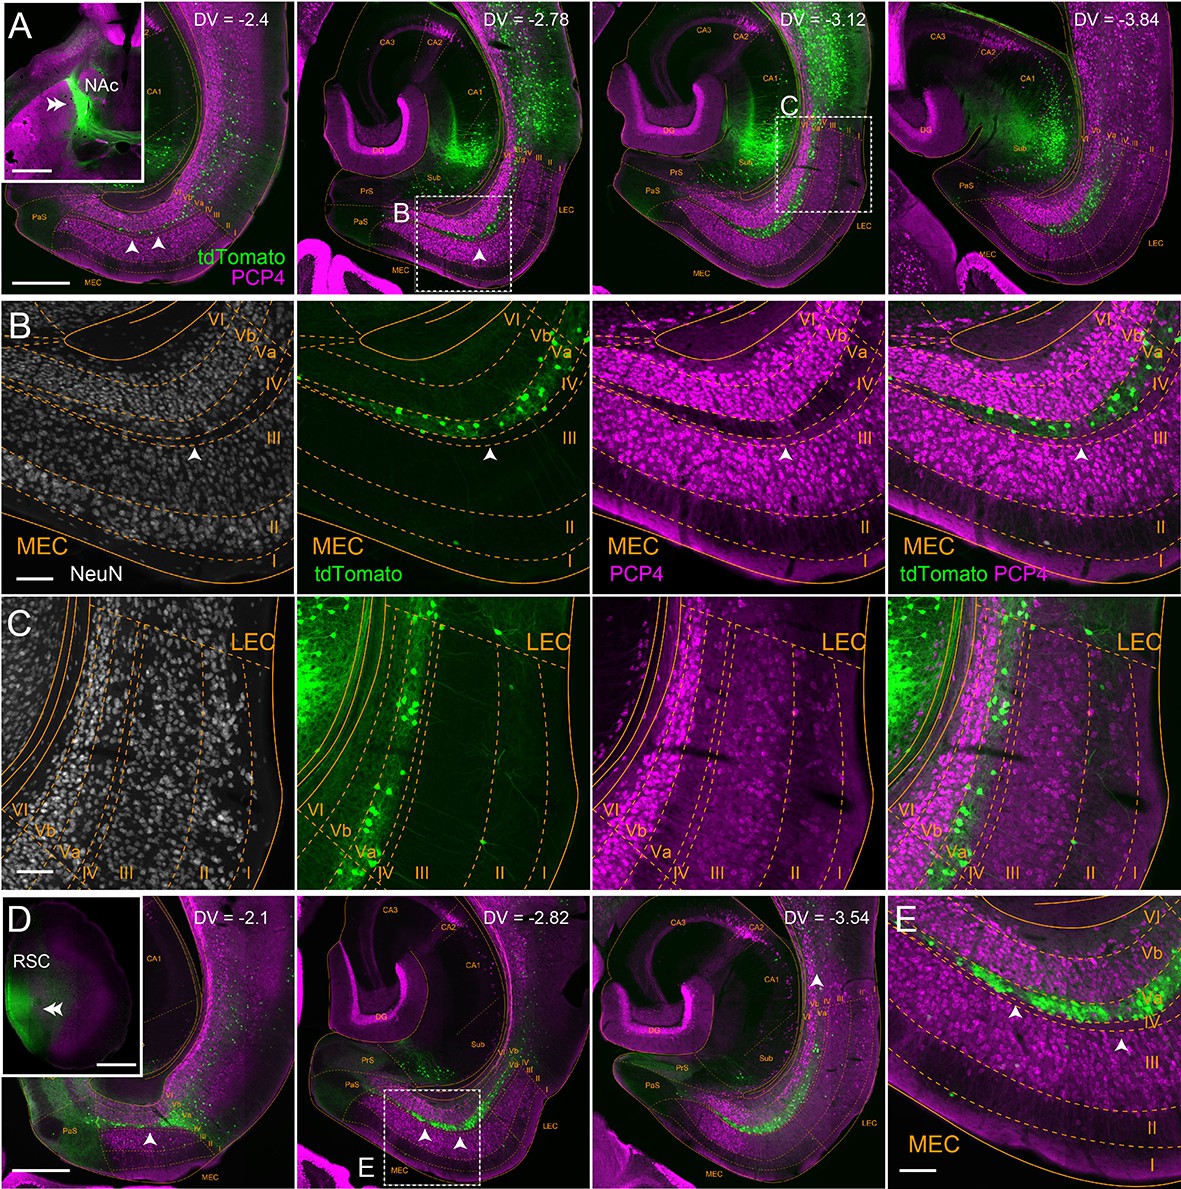
(A) Horizontal sections showing Purkinje cell protein 4 (PCP4) immunolabeling (magenta) and retrograde labeling with tdTomato (green) at different dorsoventral levels, following injection of Cre-expressing retrograde adeno-associated virus (AAV) (AAVrg-pmSyn1-EBFP-cre) into nucleus accumbens (NAc) of Gt(ROSA)26Sortm9(CAG-tdTomato)Hze mice. The injection site is shown by a double arrowhead in the inset. Note that PCP4-positive neurons are localized in layer Vb (LVb), whereas NAc-projecting neurons distribute in layer Va (LVa) of both MEC and LEC. The thickness of EC LVa/LVb varies along the dorsoventral and mediolateral axis, and between LEC and MEC. LVa is especially thin in the medial and dorsal portion of MEC, whereas LVb is relatively thick. LVa gets thicker in lateral and ventral portions, and in the LEC the thickness of LVa and LVb becomes similar. (B, C) Distribution of NeuN-, tdTomato-, and PCP4-positive neurons in MEC (B) and LEC (C) corresponding with the boxed area in (A). White arrowheads show the gaps between the tdTomato-positive retrogradely labeled MEC-LVa neurons, which are also shown in (A) and (D). Note that in MEC these gaps do contain PCP4-positive neurons, as well as PCP4-positive neuropil likely representing apical dendrites of LVb neurons. This patchy pattern of alternating somata of neurons and neuropil was never observed in LVa of LEC. (D, E) Distribution of PCP4-positive neurons and retrogradely labeled neurons in MEC following AAVrg-pmSyn1-EBFP-cre injection into retrosplenial cortex (RSC) of Gt(ROSA)26Sortm9(CAG-tdTomato)Hze mice. Double arrowhead in the inset indicates the injection site. Scale bars represent 1000 μm for insets in (A) and (D), 500 μm for EC images in (A) and (D), and 100 μm for (B), (C), and (E).
Figure 1—figure supplement 2
Purkinje cell protein 4 (PCP4) but not chicken ovalbumin upstream promoter transcription factor interacting protein 2 (Ctip2) is expressed mainly in excitatory layer Vb (LVb) neurons in both lateral entorhinal cortex (LEC) and medial entorhinal cortex (MEC).
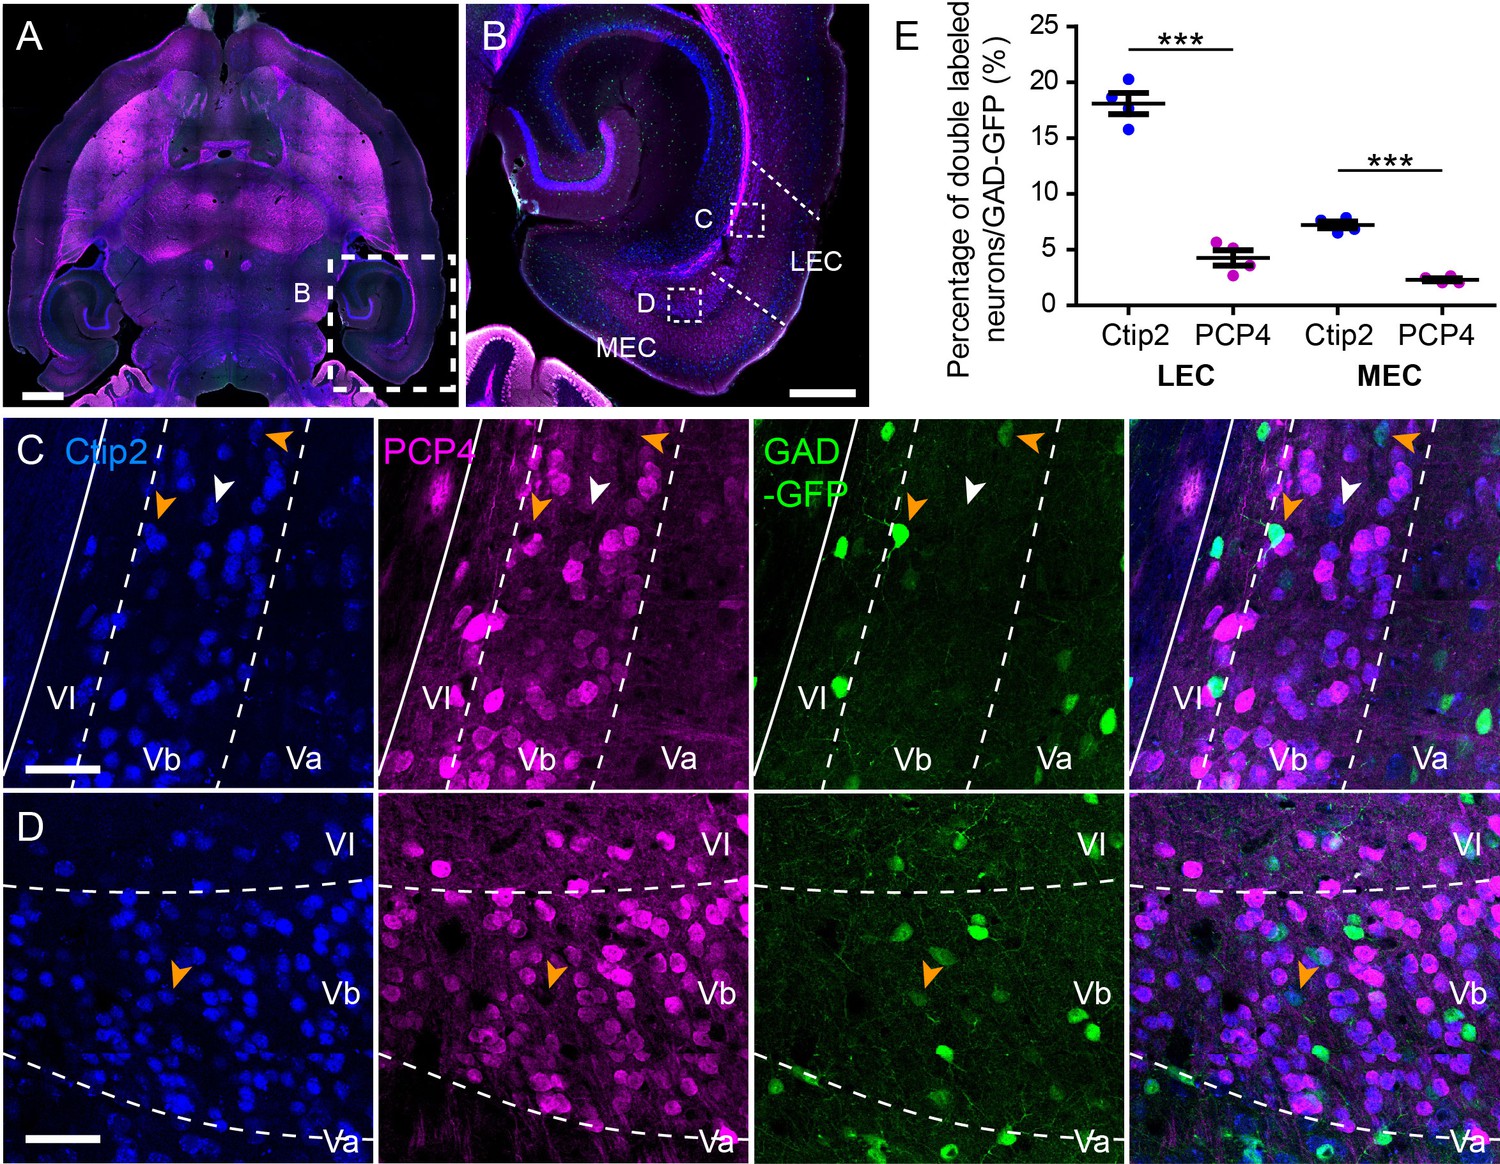
(A, B) Horizontal section showing Ctip2 (blue) and PCP4 immunolabeling (magenta). (C, D) Distribution of Ctip2- (blue), PCP4- (magenta), and GAD67-GFP-positive neurons (green) in LEC (C) and MEC (D) corresponding with the boxed areas in (B). White arrowheads point to Ctip2+/PCP4-/GAD67- neurons, while yellow arrowheads point to Ctip2+/PCP4-/GAD67+ neurons. (E) In both LEC and MEC, the percentage of GAD67-GFP-positive neurons double labeled for Ctip2 (Ctip2+/GAD67+; blue) was significantly higher than the percentage double labeled for PCP4 (PCP4+/GAD67+; magenta) (error bars: mean ± standard errors, N = 5, two-tailed paired t-test for LEC Ctip2 vs. PCP4: t3 = 15.34, ***p=0.0006, MEC Ctip2 vs. PCP4: t3 = 13.74, ***p=0.0008). Scale bars represent 1000 μm for insets in (A), 500 μm for (B), and 50 μm for (C) and (D). Figure 1—figure supplement 2—source data 1.
-
Figure 1—figure supplement 2—source data 1
Specificity of Purkinje cell protein 4 and chicken ovalbumin upstream promoter transcription factor interacting protein 2 expression in entorhinal layer Vb neurons.
- https://cdn.elifesciences.org/articles/67262/elife-67262-fig1-figsupp2-data1-v2.xlsx
Figure 1—figure supplement 3
Dendrites of lateral entorhinal cortex-layer Vb (LEC-LVb) neurons do not reach layer IIa and I.
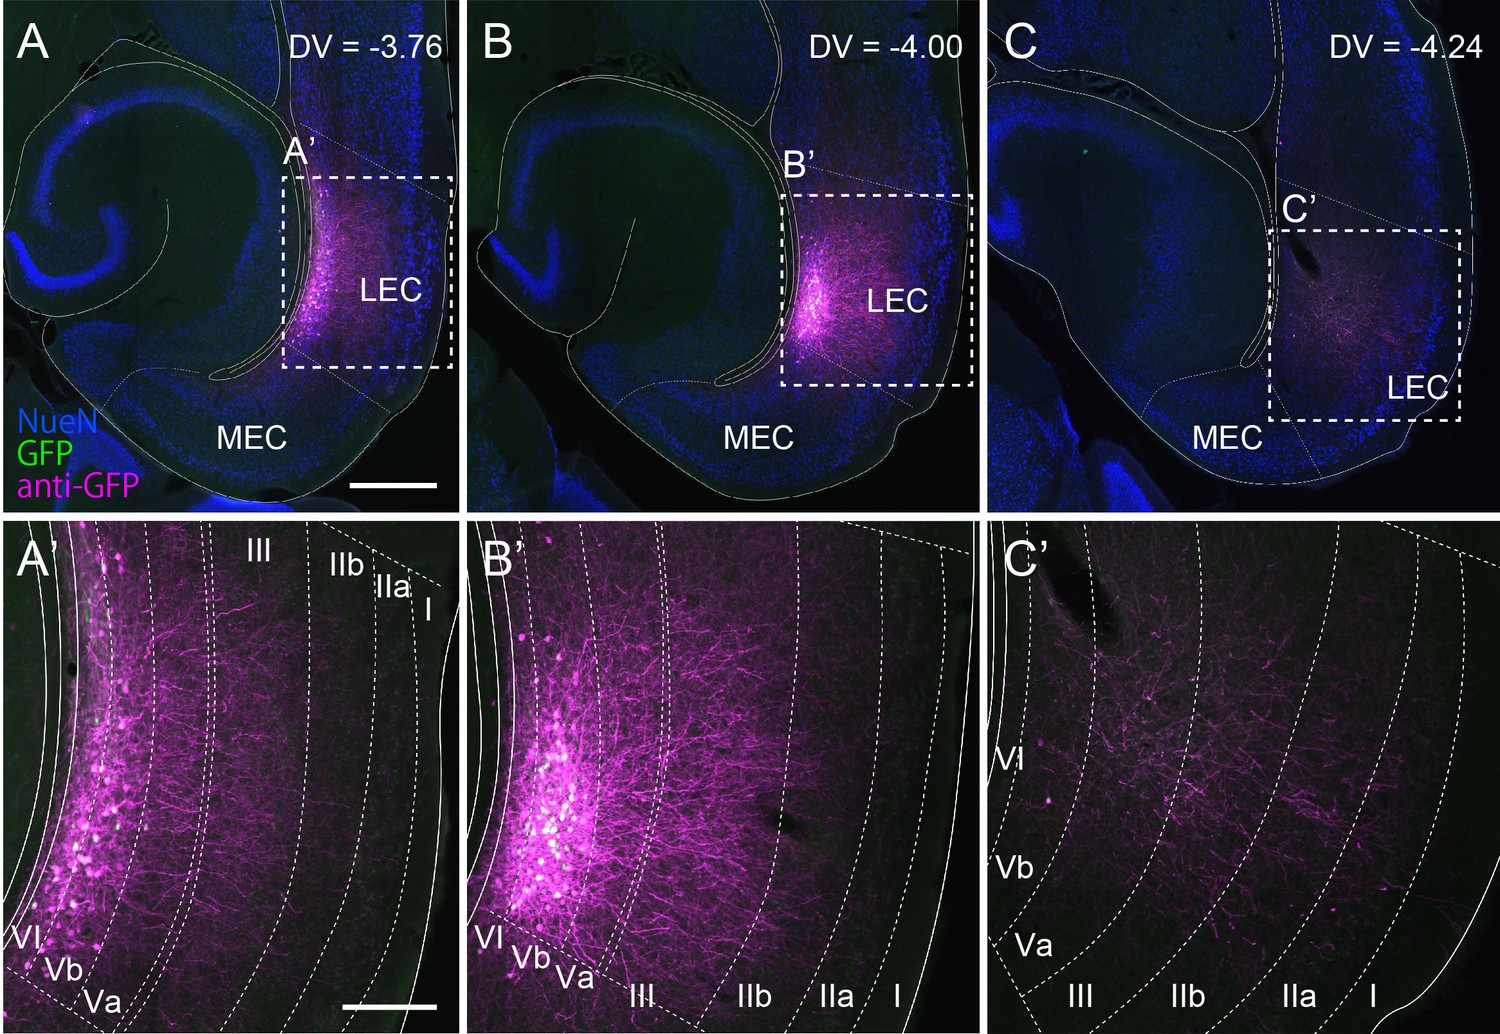
Horizontal sections showing the distribution of green fluorescent protein (GFP)-labeled LEC-LVb neurons at different dorsoventral levels, following injection of AAV2/1-TRE-Tight-GFP into the deep layers of LEC. Neurites of labeled LEC-LVb neurons are visualized with anti-GFP staining shown in magenta. Cell bodies of these infected cells can be seen in white resulting from the overlap of GFP (green) and anti-GFP labeling (magenta). Scale bars represent 500 μm for (A) (also apply to B and C) and 200 μm for (A’) (also apply to B’ and C’).
Figure 1—figure supplement 4
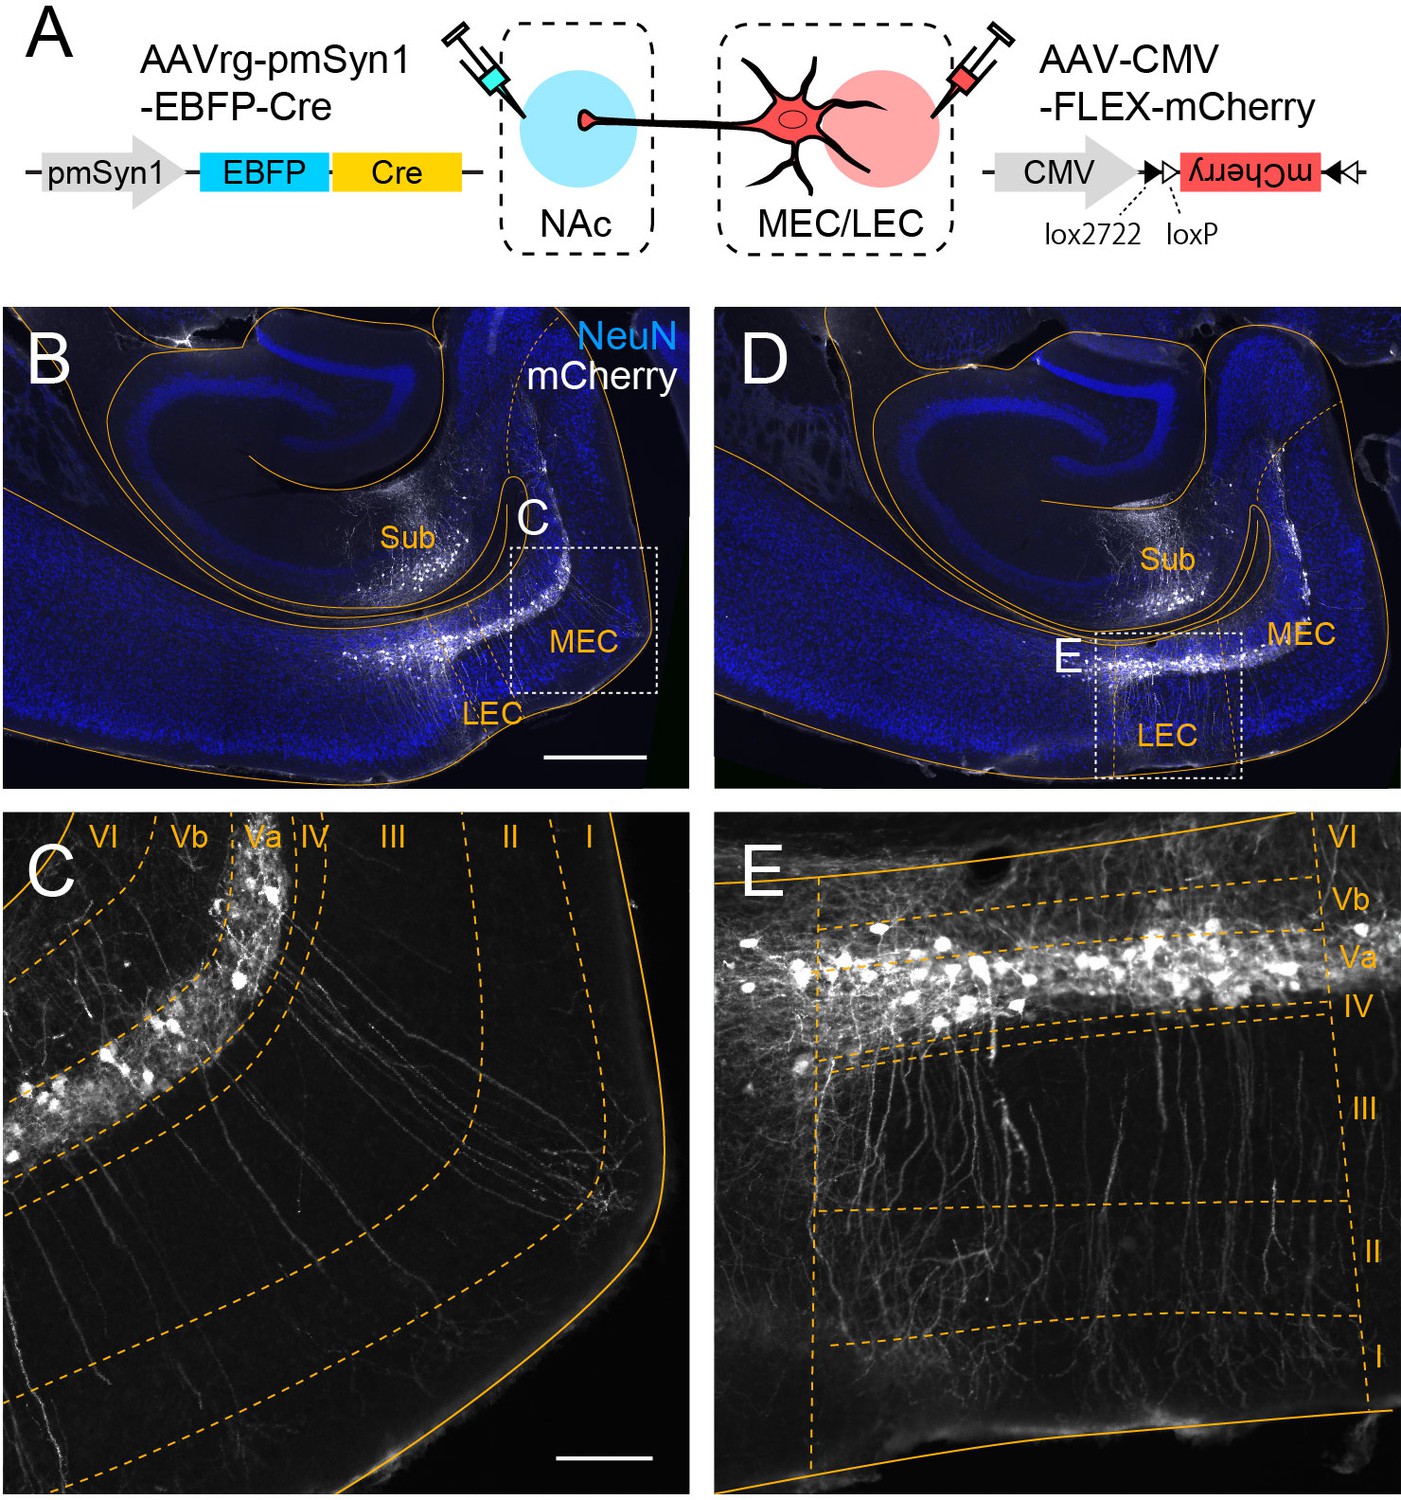
Medial entorhinal cortex (MEC) and lateral entorhinal cortex-layer Va (LEC-LVa) neurons share similar morphological features.
(A) LVa neurons were labeled in C57BL/6N mice by injecting Cre-expressing retrograde adeno-associated virus (AAV) (AAVrg-pmSyn1-EBFP-cre) in nucleus accumbens (NAc) while injecting AAV-CMV-FLEX-mCherry in entorhinal cortex (EC). (B–E) Horizontal sections showing labeled LVa neurons in MEC (C) and LEC (E), corresponding with the boxed area in (B) and (D), respectively. In both regions, the apical dendrites of LVa neurons reach layer I. Labeled neurons in the hippocampus (B, D) are NAc-projecting subicular neurons that were also infected due to the spread of AAV-CMV-FLEX-mCherry from the injection site. Scale bars represent 500 μm for (B) (also apply to D) and 100 μm for (C) (also apply to E).
Figure 2 with 1 supplement
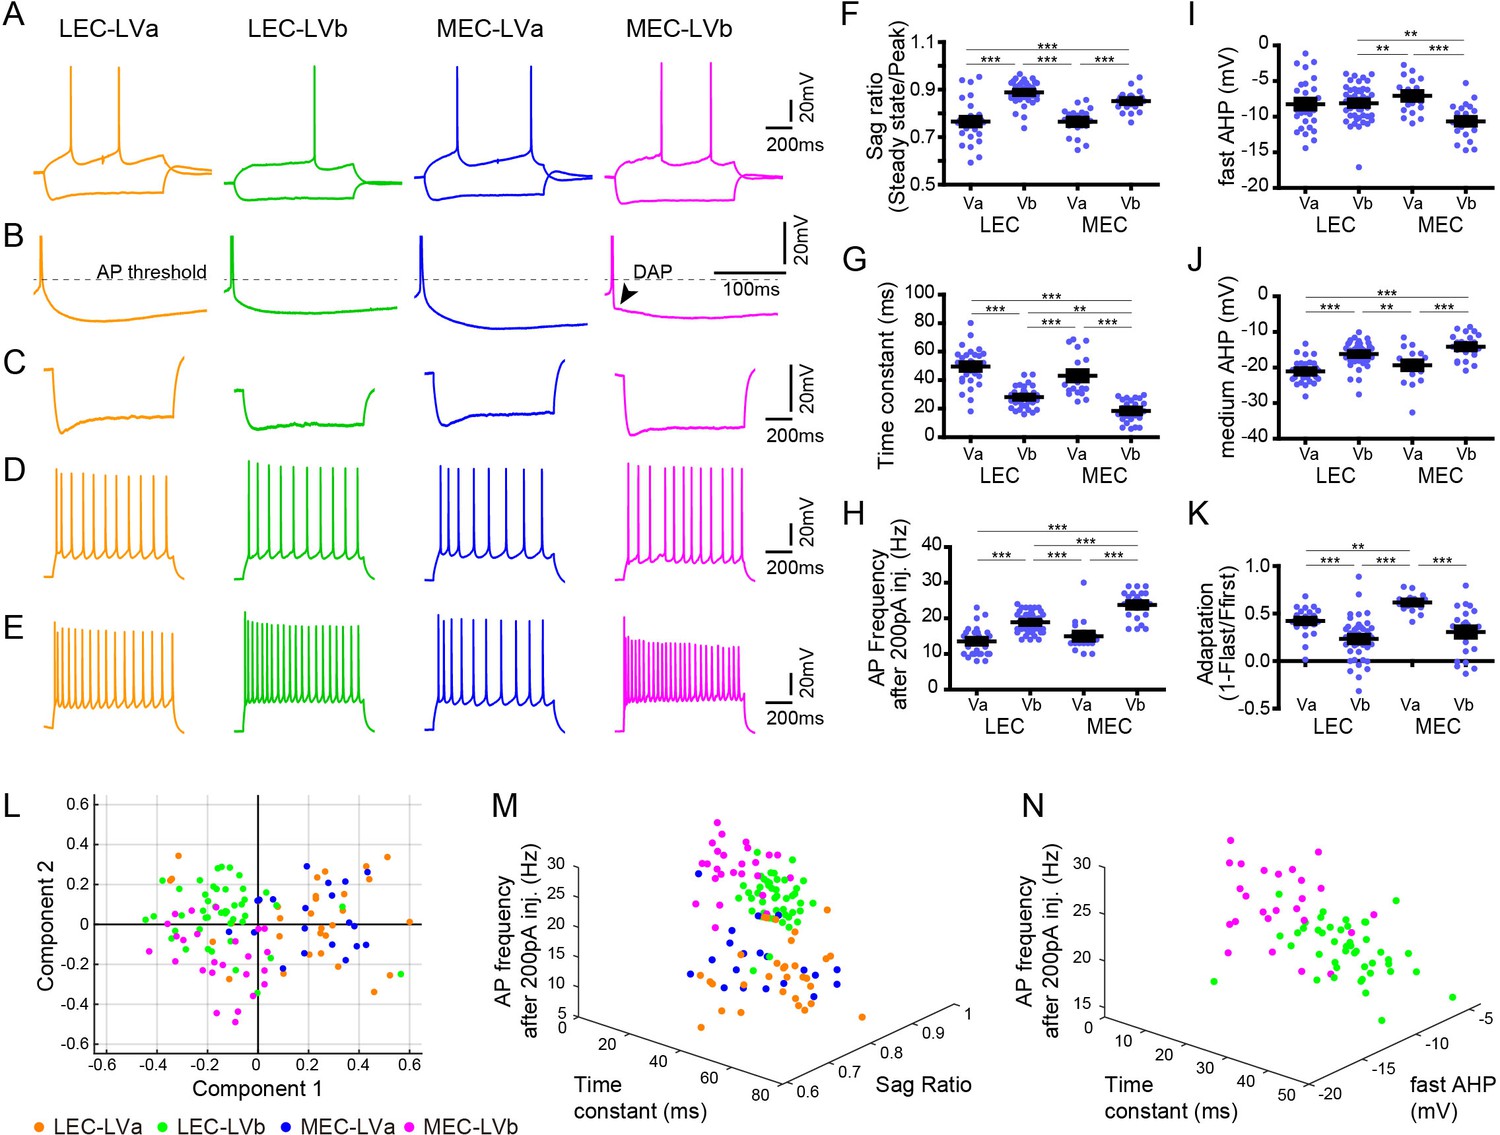
Electrophysiological properties distinguish layer Va/layer Vb (LVa/LVb) neurons in both lateral entorhinal cortex (LEC) and medial entorhinal cortex (MEC).
(A) Representative voltage responses to hyperpolarizing and depolarizing current injection of LEC-LVa (orange), LEC-LVb (green), MEC-LVa (blue), and MEC-LVb (magenta) neurons. (B) Voltage responses at rheobase current injections showing afterhyperpolarization (AHP) wave form and depolarizing afterpotentials (DAP). (C) Voltage responses to hyperpolarizing current injection with peaks at −90 ± 5 mV showing Sag. (D) Voltage responses to depolarizing current injection with 10 ± 1 action potentials (APs) showing adaptation. (E) Voltage responses to +200 pA of 1-s-long current injection showing maximal AP number. (F–K) Differences of sag ratio (F, one-way ANOVA, F3,117 = 36.88, ***p<0.0001, Bonferroni’s multiple comparison test, ***p<0.001), time constant (G, one-way ANOVA, F3,117 = 53.39, ***p<0.0001, Bonferroni’s multiple comparison test, **p<0.01, ***p<0.001), AP frequency after 200 pA injection (H, one-way ANOVA, F3,117 = 44.37, ***p<0.0001, Bonferroni’s multiple comparison test, ***p<0.001), fast AHP (I, one-way ANOVA, F3,117 = 7.536, ***p=0.0001, Bonferroni’s multiple comparison test, **p<0.01, ***p<0.001), medium AHP (J, one-way ANOVA, F3,117 = 21.99, ***p<0.0001, Bonferroni’s multiple comparison test, **p<0.01, ***p<0.001), and adaptation (K, one-way ANOVA, F3,117 = 21.6, ***p<0.0001, Bonferroni’s multiple comparison test, **p<0.01, ***p<0.001) between LEC-LVa (N = 31), LEC-LVb (N = 45), MEC-LVa (N = 20), and MEC-LVb (N = 25) neurons (error bars: mean ± standard errors). (L) Principal component analysis based on the 12 electrophysiological parameters shown in Figure 2—source data 1 show a separation between LVa and LVb neurons as well as a moderate separation between LEC-LVb and MEC-LVb neurons. Data representing 121 neurons from 27 animals (also holds for M and N). (M) Separation of LEC-LVa (orange), LEC-LVb (green), MEC-LVa (blue), and MEC-LVb (magenta) neurons using sag ratio, AP frequency at 200 pA injection, and time constant as distinction criteria. (N) Separation of LEC-LVb (green) and MEC-LVb (magenta) neurons using fast AHP, AP frequency at 200 pA injection, and time constant as distinction criteria.
-
Figure 2—source data 1
Electrophysiological properties of entorhinal layer V neurons.
- https://cdn.elifesciences.org/articles/67262/elife-67262-fig2-data1-v2.xlsx
Figure 2—figure supplement 1
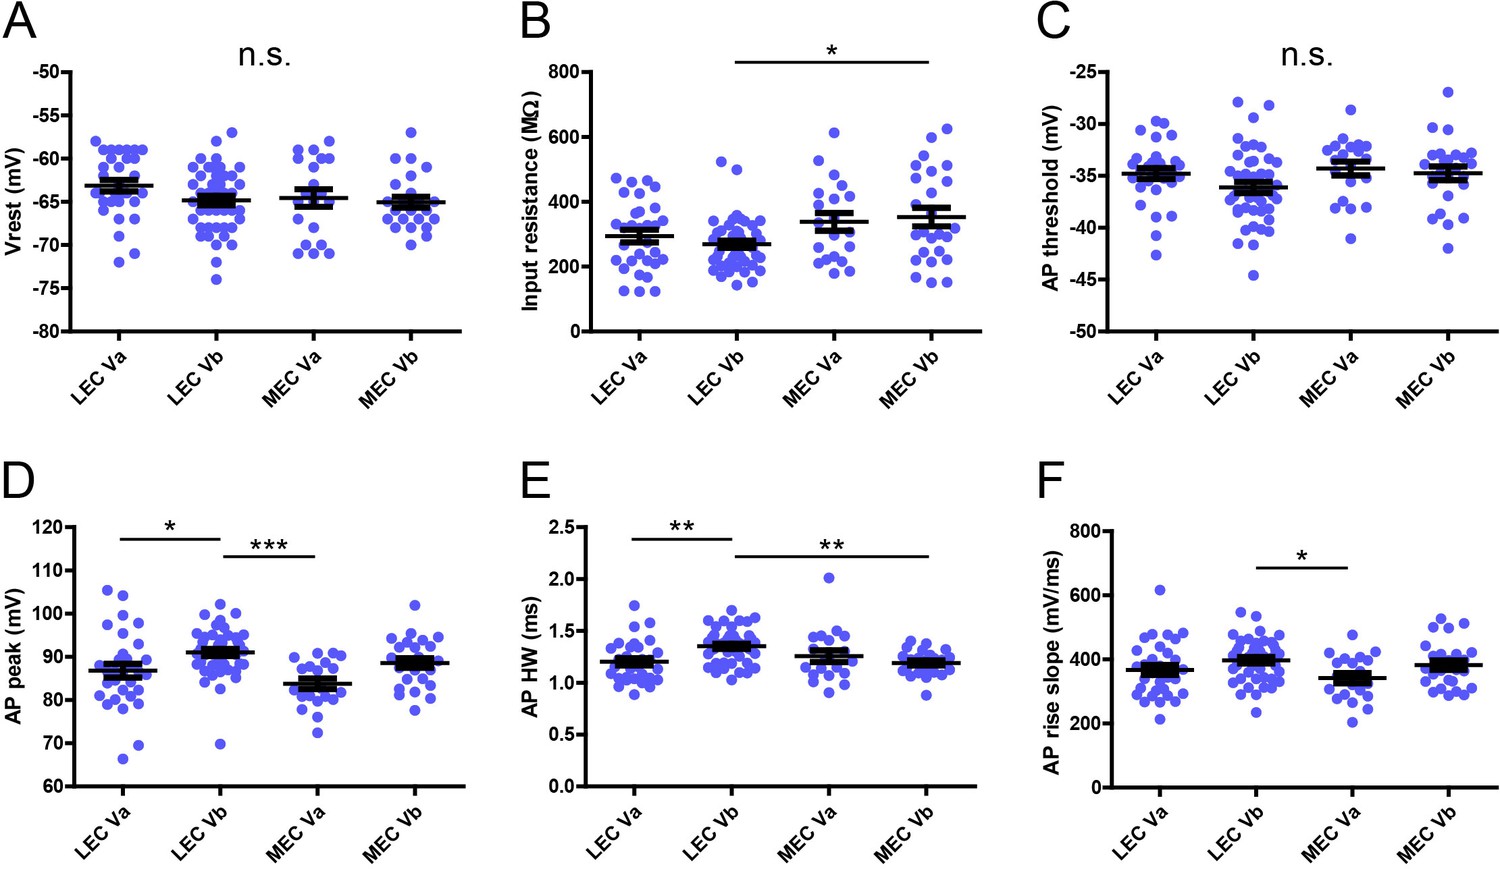
Electrophysiological features of layer Va/layer Vb (LVa/LVb) neurons in lateral entorhinal cortex/medial entorhinal cortex (LEC/MEC).
Differences of Vrest (A, one-way ANOVA, F3,117 = 1.694, p=0.172), input resistance (B, one-way ANOVA, F3,117 = 4.006, **p=0.0094, Bonferroni’s multiple comparison test, *p<0.05), action potential (AP) threshold (C, one-way ANOVA, F3,117 = 2.116, p=0.102), AP peak (D, one-way ANOVA, F3,117 = 6.497, ***p=0.0004, Bonferroni’s multiple comparison test, *p<0.05, ***p<0.001), AP half-width (E, one-way ANOVA, F3,117 = 6.099, ***p=0.0007, Bonferroni’s multiple comparison test, **p<0.01), AP rise slope (F, one-way ANOVA, F3,117 = 2.859, *p=0.04, Bonferroni’s multiple comparison test, *p<0.05) between LEC-LVa (N = 31), LEC-LVb (N = 45), MEC-LVa (N = 20), and MEC-LVb (N = 25) neurons (error bars: mean ± standard errors).
Figure 3 with 1 supplement
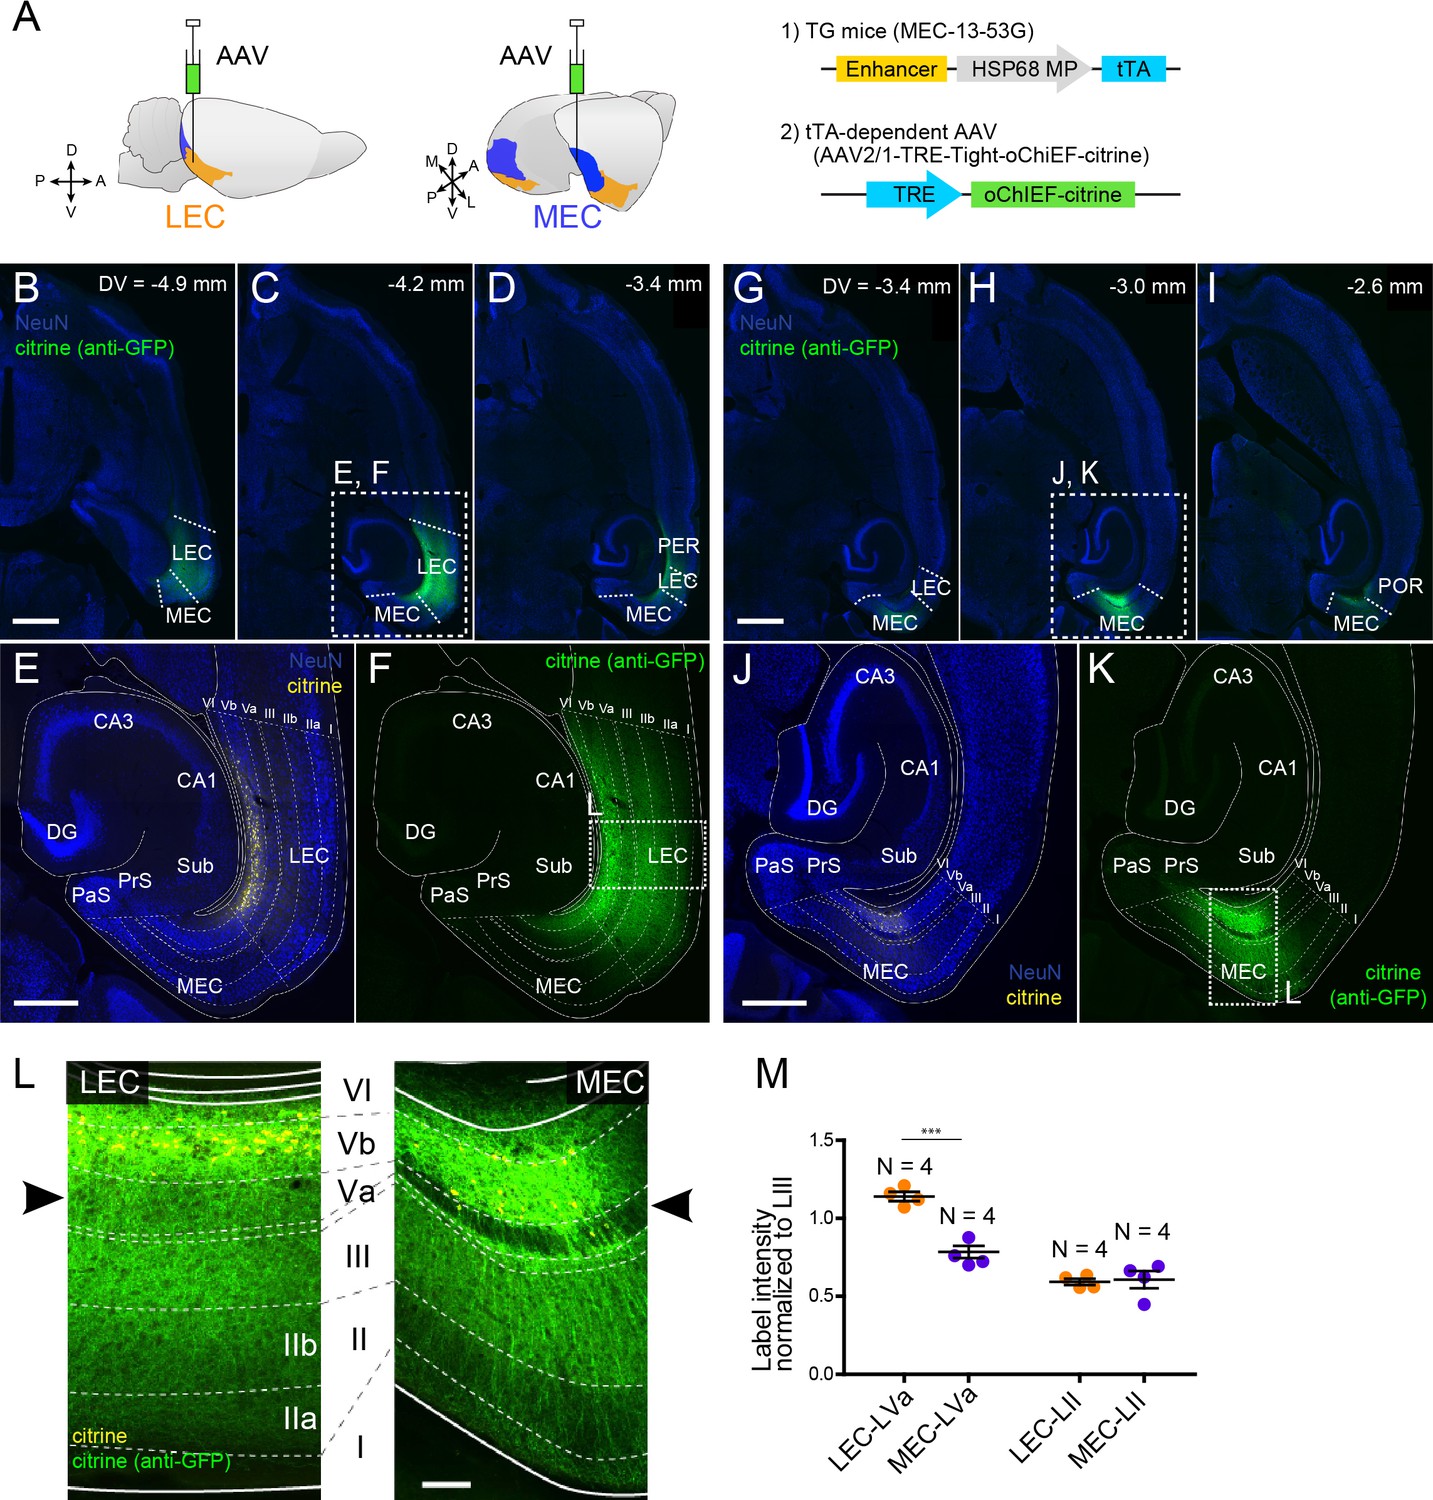
Layer Vb (LVb) neurons project locally, and their projections differ between lateral entorhinal cortex (LEC) and medial entorhinal cortex (MEC).
(A) Tetracycline-controlled transactivator (tTA)-expressing entorhinal LVb neurons were visualized by injecting a tTA-dependent adeno-associated virus (AAV) expressing oChIEF-citrine into either LEC or MEC of MEC-13–53G. (B–F) Horizontal sections showing distribution of labeled neurites originating from LEC-LVb at different dorsoventral levels (B–D). Images of entorhinal cortex (EC) (E, F) correspond to the boxed area in (C). Note that the cell bodies of labeled neurons are located in LVb of LEC (citrine label in yellow, E), and that the labeled neurites mainly distribute within EC (citrine immunolabeling in green, F). The labeling observed in perirhinal cortex (PER; D) originates from the sparse infection of PER neurons due to the leakage of the virus along the injection tract. (G–K) Horizontal sections showing distribution of labeled fibers originating from MEC-LVb at different dorsoventral levels (G–I). Images of EC (J, K) correspond to the boxed area in (H). Note that the cell bodies of labeled neurons are located in LVb of MEC (J), and that the labeled neurites mainly distribute within EC (K). The labeling observed in postrhinal cortex (POR; I) originates from the sparse infection of POR neurons due to the leakage of the virus along the injection tract. (L) Comparison of labeled neurites originating from LEC-LVb and MEC-LVb neurons (green), of which the cell bodies are visualized with citrine (yellow). The left panel corresponds to the boxed area in (F) and is 90° rotated to match the orientation of the right panel, which represents the boxed area in (K). The distribution of the labeled fibers is strikingly different between LEC and MEC in LVa (black arrowhead) with a strong terminal projection in LEC and almost absent projections in LVa of MEC. (M) Intensity of citrine immunolabeling in LVa and LII of LEC and MEC, normalized against the LIII labeling (error bars: mean ± standard errors, N = 4). The normalized labeling was significantly higher in LEC-LVa than in MEC-LVa (two-tailed paired t-test for LEC-LVa vs. MEC-LVa: t6 = 7.68, ***p=0.0003, LEC-LII vs. MEC-LII: t6 = 0.24, p=0.82). Scale bars represent 1000 μm for (B) and (G) (also apply to C, D, H, I), 500 μm for (E) and (J) (also apply to F and K), and 100 μm for (L). Figure 3—source data 1. See also Figure 3—figure supplement 1.
-
Figure 3—source data 1
Distribution of labeled fibers of layer Vb neurons in entorhinal layer V.
- https://cdn.elifesciences.org/articles/67262/elife-67262-fig3-data1-v2.xlsx
Figure 3—figure supplement 1
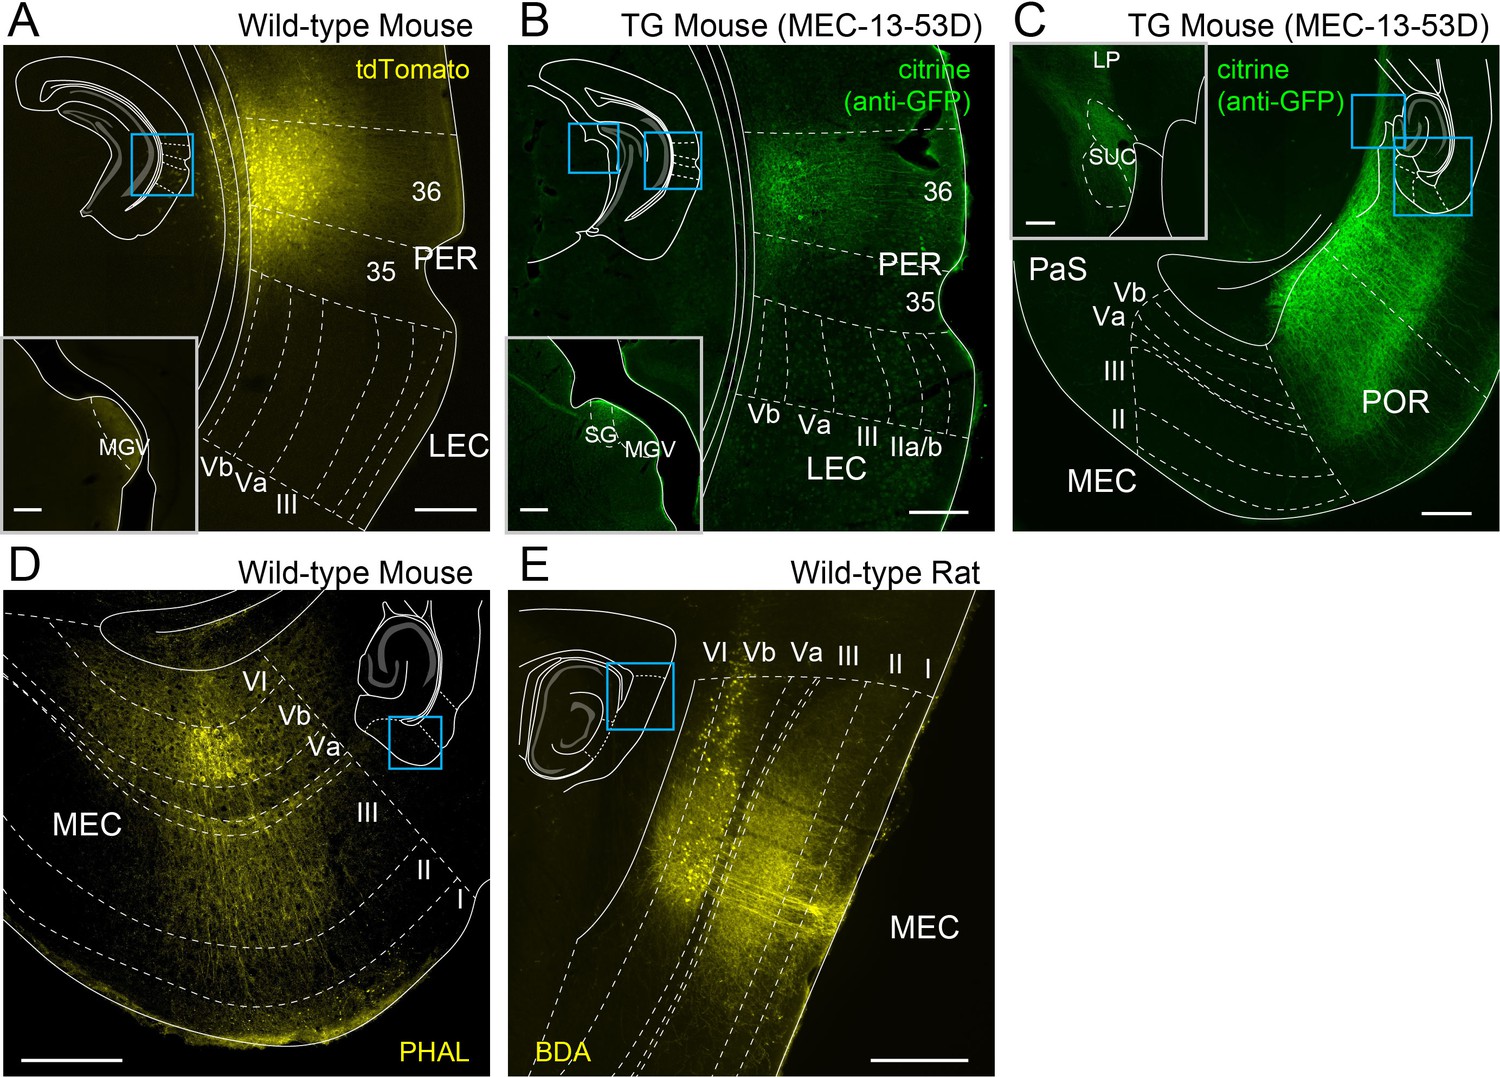
Axonal distribution of perirhinal cortex (PER), postrhinal cortex (POR), and entorhinal layer Vb (LVb) neurons.
(A) Coronal section showing anterograde labeling following injection of adeno-associated virus (AAV) expressing tdTomato (AAV1.CAG.tdTomato.WPRE.SV40) into PER of wild-type mice. Note that labeled axons are hardly observed in lateral entorhinal cortex (LEC), whereas dense labeling is observed in the thalamic ventral medial geniculate nucleus (MGV, inset). (B) Coronal section showing anterograde labeling following injection of AAV expressing oChiEF-citrine (AAV-TRE-tight-oChIEF-citrine) into PER of MEC-13–53G. Similar to (A), labeled axons are hardly observed in LEC, whereas dense labeling is observed in MGV and suprageniculate nucleus (SG), which are both known PER targets (inset). (C) Horizontal section showing anterograde labeling following injection of AAV expressing oChIEF-citrine into POR of MEC-13–53G. Note that labeled axons are hardly observed in medial entorhinal cortex (MEC), whereas dense labeling is observed in the lateralposterior nucleus (LP) and the superior colliculus (SUC), which are both known POR targets (inset). (D) Horizontal section showing anterograde labeling of MEC-LVb neurons in wild-type mice. (E) Sagittal section showing anterograde labeling of MEC-LVb neurons in wild-type rats. Note that, in both (D) and (E), labeled axons are observed densely in LIII but sparsely in LVa. Schematics in the images give the location of each image. 35, perirhinal area 35; 36, perirhinal area 36.
Figure 4 with 2 supplements

Medial entorhinal cortex-layer Vb (MEC-LVb) neurons preferentially target LII/III pyramidal neurons.
(A) Image of a representative horizontal slice showing expression of oChIEF-citrine in LVb neurons (green) and recorded neurons labeled with biocytin (magenta) in MEC. Inset shows a low-power image of the section indicating the position of the higher power image. Scale bars represent 500 μm (inset) and 100 μm. (B) Voltage responses to injected current steps recorded from neurons shown in (A): i, pyramidal cell in layer Va (LVa); ii, pyramidal cell in LIII; iii, pyramidal cell in LII; iv, stellate cell in LII. Inset in (iii) and (iv) shows the depolarizing afterpotential (DAP) in expanded voltage- and time scale. Note that LII stellate cells (iv) show a clear sag potential and DAP compared to LII pyramidal cells (iii). (C) Voltage responses to light stimulation (light blue line) recorded from neurons shown in (A). Average traces (blue) are superimposed on the individual traces (gray). (D–G) The proportion of responding cells (D), excitatory postsynaptic potential (EPSP) amplitude (E), the normalized EPSP based on LIII response (F, one-way ANOVA, F3,47 = 33.29, ***p<0.0001, Bonferroni’s multiple comparison test, **p<0.01, ***p<0.001), and the input resistance (G, one-way ANOVA, F3,82 = 21.99, ***p<0.0001, Bonferroni’s multiple comparison test, ***p<0.001) was examined for each cell type (error bars: mean ± standard errors). (H) Latency of EPSP onset for MEC neurons to optical activation (F, one-way ANOVA, F3,47 = 11.65, ***p<0.0001, Bonferroni’s multiple comparison test, *p<0.05, ***p<0.001). LIIs: LII stellate cell; LIIp: LII pyramidal cell. Figure 4—source data 1. See also Figure 4—figure supplement 1, Figure 4—figure supplement 2.
-
Figure 4—source data 1
Patch-clamp recording data in medial entorhinal cortex.
- https://cdn.elifesciences.org/articles/67262/elife-67262-fig4-data1-v2.xlsx
Figure 4—figure supplement 1
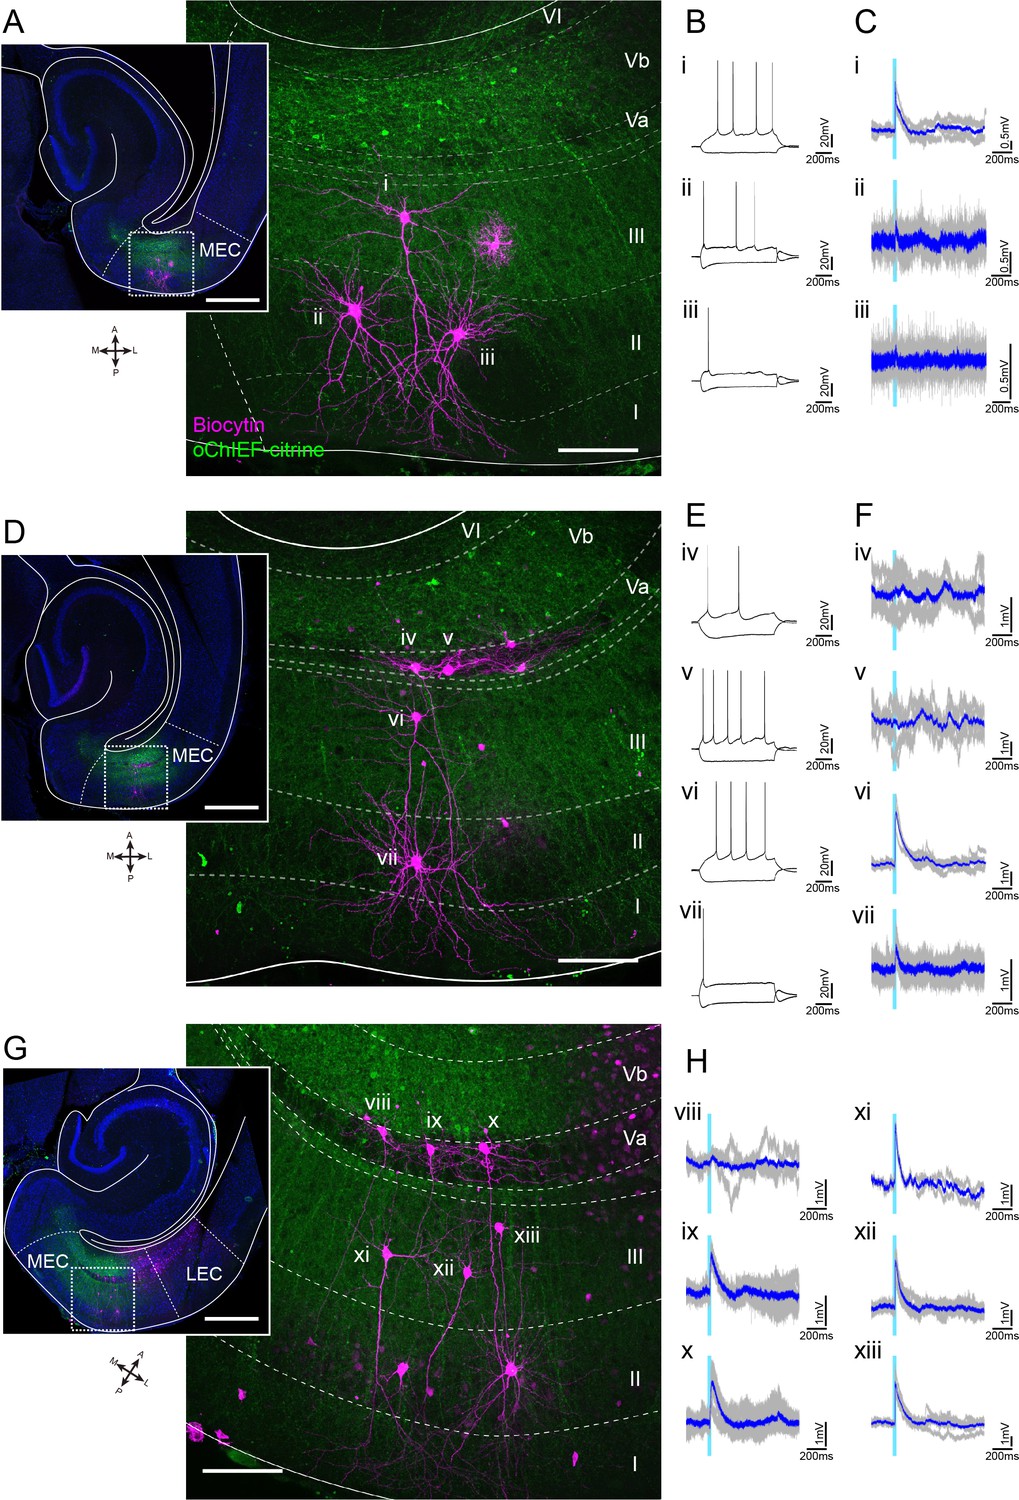
Representative patch-clamp recordings after optical stimulation of layer Vb (LVb) fibers in medial entorhinal cortex (MEC).
(A–C) Horizontal MEC slice showing expression of oChIEF-citrine in LVb neurons (green) and biocytin-filled recorded layer II/III neurons (magenta, A). Voltage responses to injected current steps (B) and to light stimulation (light blue line, C) are shown for all three neurons (i, pyramidal neuron in LIII; ii, iii, stellate cells in LII). Average traces (blue) are superimposed on the individual traces (gray). (D–F) Images of recorded MEC neurons (D) and their voltage responses (E, F; iv, v pyramidal cells in LVa; vi, pyramidal cell in LIII; vii, stellate cell in LII). (G, H) Images of recorded MEC neurons (G) in LVa (Viii–x) and LIII (xi–xiii), and their voltage responses (H). This slice is from the animal shown in Figure 4, but it is more ventral than the one shown in Figure 4. Scale bars represent 500 μm for insets and 100 μm for higher-power images.
Figure 4—figure supplement 2
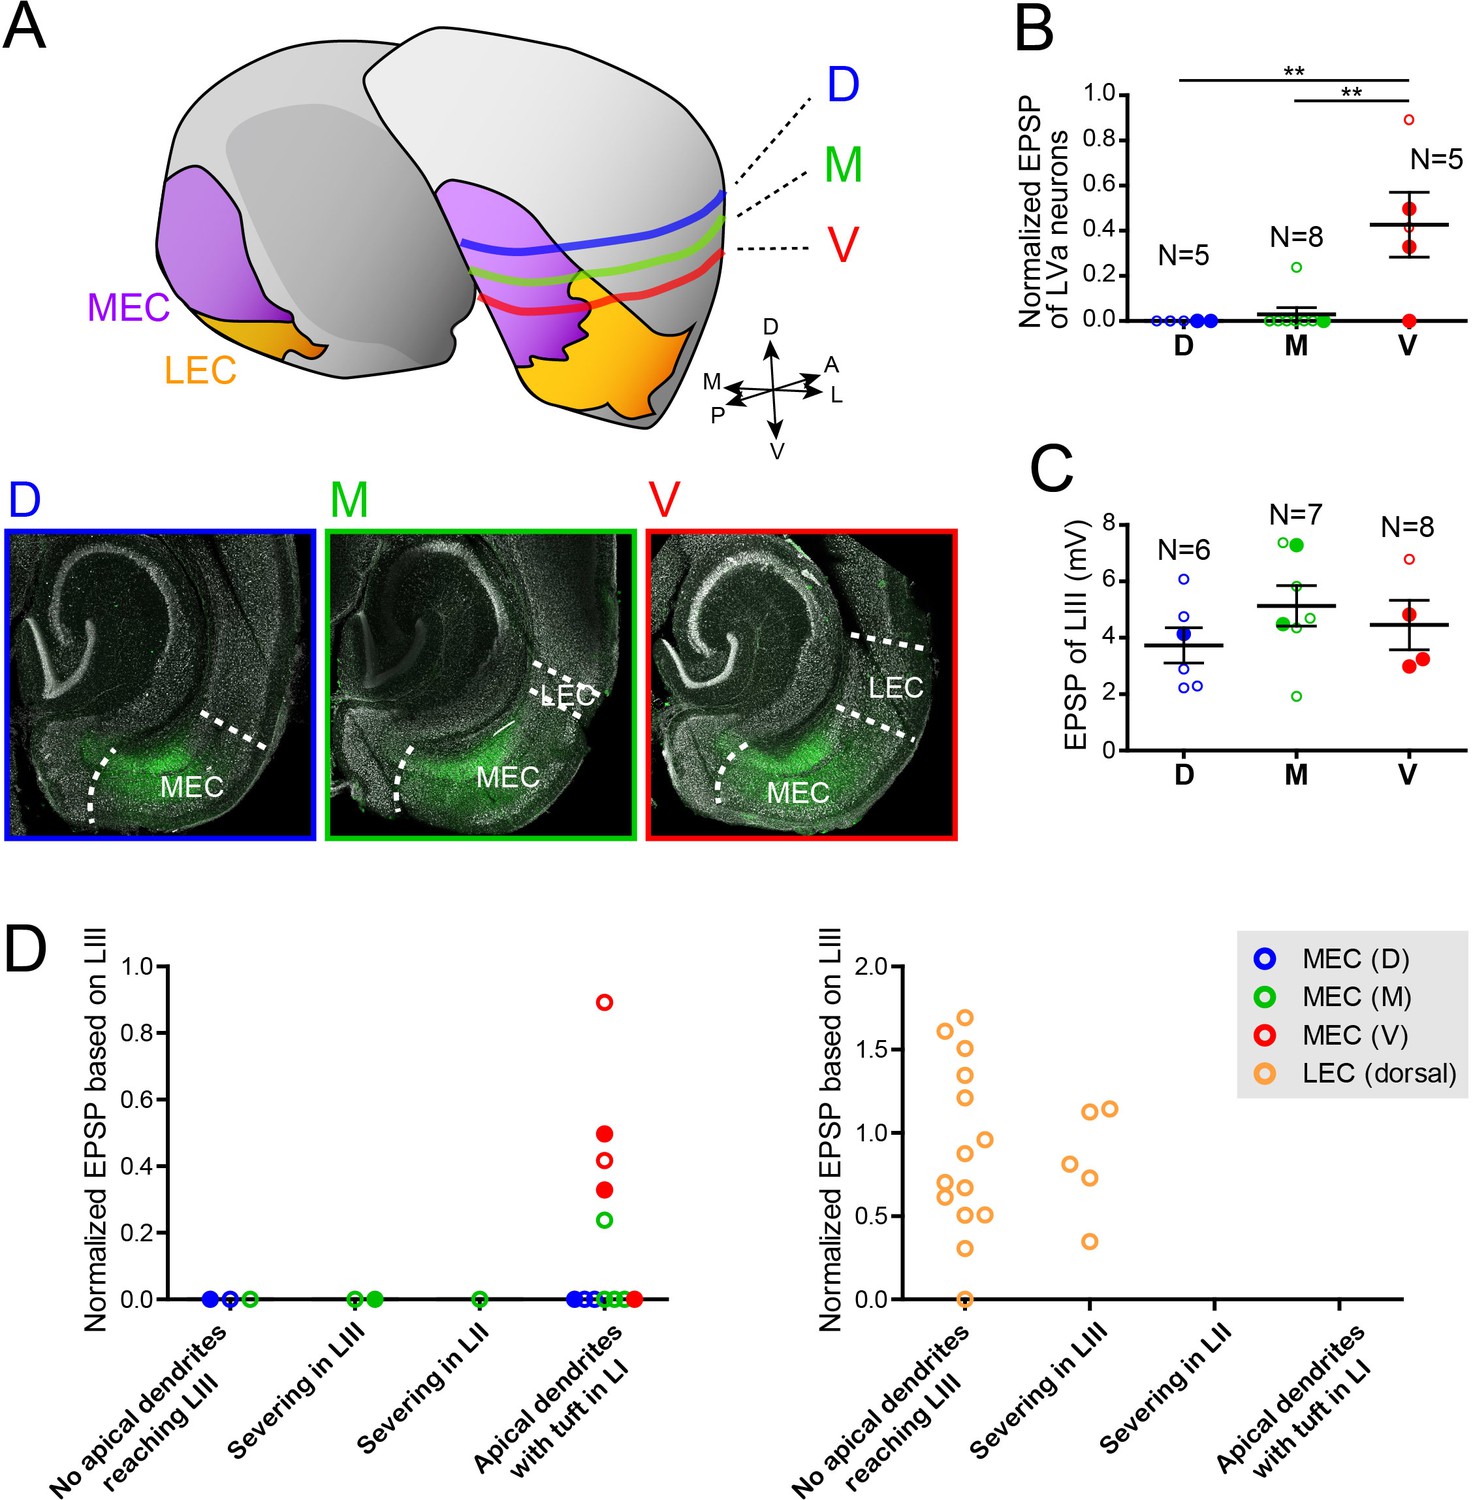
Responses of medial entorhinal cortex-layer Va (MEC-LVa) neurons at different dorsoventral levels.
(A) Schematic drawing and representative images showing three dorsoventral levels of slices in which the LVa neurons were recorded (D, dorsal level; M, medial level; V, ventral level). D (blue) corresponds to the sample shown in Figure 4—figure supplement 1D-F, and M (green) and V (red), which are taken from the same animal, correspond to the sample shown in Figure 4 and Figure 4—figure supplement 1G, H, respectively. (B, C) Normalized excitatory postsynaptic potentials (EPSPs) of LVa neurons (B) are significantly larger in more ventral slices (one-way ANOVA, F2,15 = 9.82, ***p=0.0019, Bonferroni’s multiple comparison test, **p<0.01), whereas EPSPs of LIII neurons recorded at different dorsoventral level are indifferent (C) (error bars: mean ± standard errors, one-way ANOVA, F2,14 = 1.045, p=0.3777). (D) Normalized EPSPs of LVa neurons in MEC (left panel) and lateral entorhinal cortex (LEC) (right panel) are shown against the maintained length of their apical dendrites. Note that severing the dendrites does not impact the presence or absence of responses in dorsal MEC, and that LEC LVa neurons respond even with having severed apical dendrites. Voltage responses recorded from the slice in (A) are shown in (BD) as filled-color dots (filled-blue dots in D, filled-green dots in M, and filled-red dots in V). Figure 4—figure supplement 2—source data 1.
-
Figure 4—figure supplement 2—source data 1
Responses of medial entorhinal cortex-layer Va neurons at different dorsoventral levels.
- https://cdn.elifesciences.org/articles/67262/elife-67262-fig4-figsupp2-data1-v2.xlsx
Figure 5 with 1 supplement

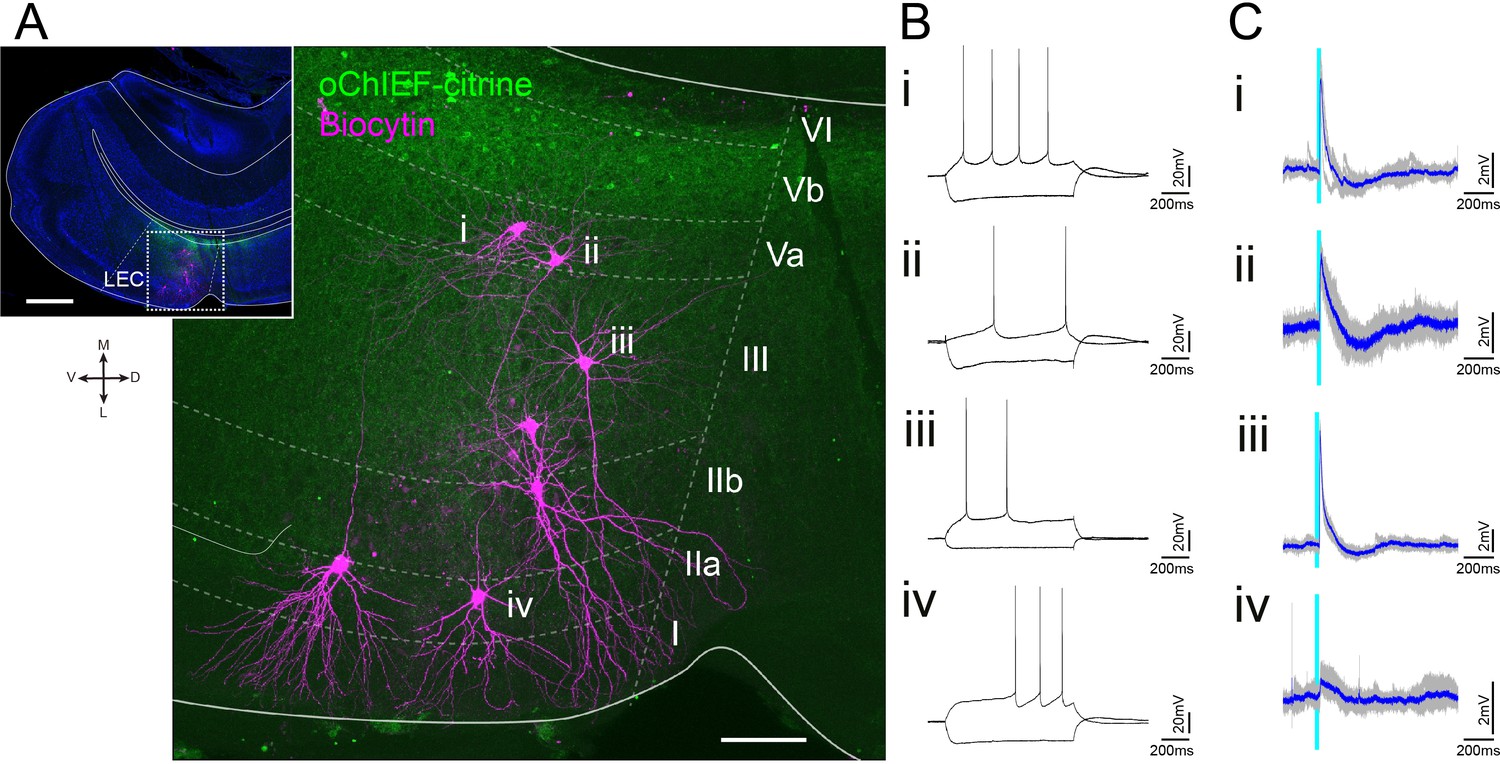
Lateral entorhinal cortex-layer Vb (LEC-LVb) neurons target layer Va (LVa) pyramidal neurons as well as LII/III pyramidal neurons.
(A) Representative image of semicoronal slice showing expression of oChIEF-citrine in LVb neurons (green) and recorded neurons labeled with biocytin (magenta) in LEC. Inset shows a low-power image of the section indicating the position of the higher-power image. Scale bars represent 500 μm (inset) and 100 μm. (B) Voltage responses to injected current steps recorded from neurons shown in (A): i, pyramidal cell in LVa; ii, pyramidal cell in LIII; iii, pyramidal cell in LII; iv, fan cell in LII. (C) Voltage responses to light stimulation (light blue line) recorded from neurons shown in (A). Average traces (blue) are superimposed on the individual traces (gray). (D–G) The proportion of responding cells (D), excitatory postsynaptic potential (EPSP) amplitude (E), the normalized EPSP based on LIII response (F, one-way ANOVA, F3,75 = 7.675, ***p=0.0002, Bonferroni’s multiple comparison test, **p<0.01, ***p<0.001), and the input resistance (G, one-way ANOVA, F3,101 = 11.75, ***p<0.0001, Bonferroni’s multiple comparison test, *p<0.05, ***p<0.001) was examined for each cell type (error bars: mean ± standard errors). (H) Latency of EPSP onset for LEC neurons to optical activation (one-way ANOVA, F3,47 = 11.65). (I, J) Comparison of the proportion of responding cells (I) and the normalized EPSP based on LIII response (J) between medial entorhinal cortex (MEC) and LEC (error bars: mean ± standard errors; two-tailed unpaired t-test, t21 = 2.239, *p=0.0361). Figure 5—source data 1. See also Figure 5—figure supplement 1.
-
Figure 5—source data 1
Patch-clamp recording data in lateral entorhinal cortex.
- https://cdn.elifesciences.org/articles/67262/elife-67262-fig5-data1-v2.xlsx
Figure 5—figure supplement 1
Representative patch-clamp recording after optical stimulation of layer Vb (LVb) fibers in lateral entorhinal cortex (LEC).
(A) Semicoronal LEC slice showing expression of oChIEF-citrine in LVb neurons (green) and biocytin-filled recorded layer II/III neurons (magenta). The inset indicates the position of the higher-power image. Scale bars represent 500 μm for inset and 100 μm for high-power image. (B, C) Voltage responses to injected current steps (B) and to light stimulation (light blue line, C) recorded from neurons shown in (A) (i, ii, pyramidal cell in LVa; iii, pyramidal cell in LIII; iv, fan cell in LII). Average traces (blue) are superimposed on the individual traces (gray).
Figure 6
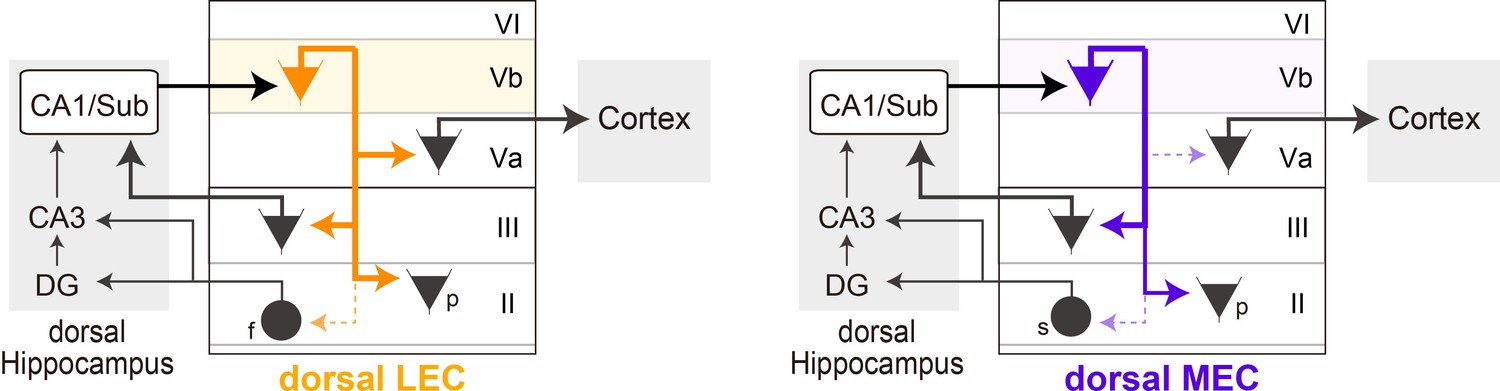
Schematic diagram of the different local circuits in lateral entorhinal cortex (LEC) and medial entorhinal cortex (MEC) used by layer Vb (LVb) neurons to transfer dorsal hippocampal output.
Local connectivity of LVb neurons in LEC (left, orange) and MEC (right, purple). In both LEC and MEC, LVb neurons are the primary recipients of dorsal hippocampal output, but the transfer to LVa neurons through direct LVb-to-LVa projections is only prominent in LEC. Such projections are sparse and weak in MEC. Neurons in LVa are the output neurons of EC, projecting to the neocortex and other telencephalic subcortical structures. In contrast, in both LEC and MEC we find projections from LVb that target pyramidal cells in LIII, including neurons projecting to CA1 and subiculum, and pyramidal cells in LII. Projections to stellate (MEC) and fan (LEC) cells, which project to the dentate gyrus and CA3, are sparse and weak. The output projections of LII pyramidal neurons are not indicated in the figure, they project to ipsilateral-EC, contralateral-EC, CA1, or other telencephalic structures (Ohara et al., 2019). For clarity reasons, all these projections are indicated schematically as originating from a single LVb neuron, but this is not yet known. f: fan cell; s: stellate cell; p: pyramidal cell.
Tables
Key resources table
| Reagent type (species) or resource | Designation | Source or reference | Identifiers | Additional information |
|---|---|---|---|---|
| Strain, strain background (Mus musculus) | MEC13-53D | Blankvoort et al., 2018 | Not commercially available, but upon request we can send the mouse line. Send email to Dr. Stefan Blankvoort; stefan.blankvoort@ntnu.no. | |
| Strain, strain background (Mus musculus) | tetOGCaMP6-mCherry | Blankvoort et al., 2018 | Not commercially available, but upon request we can send the mouse line. Contact see above. | |
| Strain, strain background (Mus musculus) | GAD1GFP | Tamamaki et al., 2003 | The animals are bred in house after obtaining breeding pairs from Dr Yuchio Yanagawa;yanagawa@med.gunma-u.ac.jp. | |
| Strain, strain background (Mus musculus) | Gt(ROSA)26Sortm9(CAG-tdTomato)Hze | The Jackson Laboratory | 007909 RRID:IMSR_JAX:007909 | |
| Genetic reagent (virus) | AAV-TRE-tight-GFP (serotype 2/1) | Nilssen et al., 2018 | Viral Vector Core at Kavli Institute for Systems Neuroscience; contact Dr Rajeevkumar Nair Raveendranrajeevkumar.r.nair@ntnu.no. | |
| Genetic reagent (virus) | AAV-TRE-tight-oChIEF-citrine (serotype 2/1) | Nilssen et al., 2018 | Viral Vector Core at Kavli Institute for Systems Neuroscience; contact see above. | |
| Genetic reagent (virus) | AAV-CMV-FLEX-mCherry (serotype 2/1) | This paper | Viral Vector Core at Kavli Institute for Systems Neuroscience; contact see above. | |
| Genetic reagent (virus) | AAVrg-pmSyn1-EBFP-cre | Addgene | 51507 | |
| Genetic reagent (virus) | AAV1.CAG.tdTomato.WPRE.SV40 | Upenn viral core | AV-1-PV3365 | |
| Antibody | Anti-GFP (chicken polyclonal) | Abcam | ab13970 RRID:AB_300798 | (1:500) |
| Antibody | Anti-GFP (rabbit polyclonal) | Thermo Fisher Scientific | A11122 RRID:AB_221569 | (1:2000) |
| Antibody | Anti-PCP4 (rabbit polyclonal) | Sigma Aldrich | HPA005792 RRID:AB_1855086 | (1:300) |
| Antibody | Anti-Ctip2 (rat monoclonal) | Abcam | ab18465 RRID:AB_2064130 | (1:3000) |
| Antibody | Anti-NeuN (guinea pig polyclonal) | Millipore | ABN90P RRID:AB_2341095 | (1:1000) |
| Antibody | Anti-NeuN (mouse monoclonal) | Millipore | MAB377 RRID:AB_2298772 | (1:1000) |
| Antibody | Anti-PHA-L (rabbit) | Vector Laboratories | AS-2300 RRID:AB_2313686 | (1:1000) |
| Antibody | Goat anti-chicken IgG (AF 488) | Thermo Fisher Scientific | A11039 RRID:AB_2534096 | (1:400) |
| Antibody | Goat anti-rabbit IgG (AF 546) | Thermo Fisher Scientific | A11010 RRID:AB_2534077 | (1:400) |
| Antibody | Goat anti-rabbit IgG (AF 635) | Thermo Fisher Scientific | A31576 RRID:AB_10374303 | (1:400) |
| Antibody | Goat anti-rat IgG (AF 633) | Thermo Fisher Scientific | A21094 RRID:AB_2535749 | (1:400) |
| Antibody | Goat anti-guinea pig IgG (AF 647) | Thermo Fisher Scientific | A21450 RRID:AB_2735091 | (1:400) |
| Antibody | Goat anti-guinea pig IgG (AF 488) | Thermo Fisher Scientific | A11073 RRID:AB_2534117 | (1:400) |
| Antibody | Goat anti-mouse IgG (AF 488) | Thermo Fisher Scientific | A11001 RRID:AB_2534069 | (1:400) |
| Antibody | Streptavidin, Alexa Fluor 546 conjugate | Thermo Fisher Scientific | S11225 RRID:AB_2532130 | (1:600) |
| Antibody | Cy3 streptavidin | Jackson Immuno Research | 016-160-084 RRID:AB_2337244 | (1:400) |
| Antibody | Neurotrace 640/660 deep-red fluorescent Nissl stain | Thermo Fisher Scientific | N21483 RRID:AB_2572212 | (1:200) |
| Chemical compound, drug | Biotinylated dextran amine | Invitrogen | D1956 | |
| Chemical compound, drug | Phaseolus vulgaris leucoagglutinin | Vector Laboratories | L-1110 | |
| Software, algorithm | Patchmaster | Heka Eletronik | ||
| Software, algorithm | Clampfit | Molecular Devices | ||
| Software, algorithm | MATLAB, 2018a | MathWorks | ||
| Software, algorithm | Image J | http://rsb.info.nih.gov/ij | ||
| Software, algorithm | GraphPad Prism, version 5 | GraphPad software |
Additional files
Download links
A two-part list of links to download the article, or parts of the article, in various formats.
Downloads (link to download the article as PDF)
Open citations (links to open the citations from this article in various online reference manager services)
Cite this article (links to download the citations from this article in formats compatible with various reference manager tools)
Local projections of layer Vb-to-Va are more prominent in lateral than in medial entorhinal cortex
eLife 10:e67262.
https://doi.org/10.7554/eLife.67262


