SSNA1 stabilizes dynamic microtubules and detects microtubule damage
- Department of Cell and Developmental Biology, Vanderbilt University, United States
- Department of Chemical and Biomolecular Engineering, Vanderbilt University, United States
- Department of Biochemistry, Vanderbilt University, United States
Figures
Figure 1 with 2 supplements
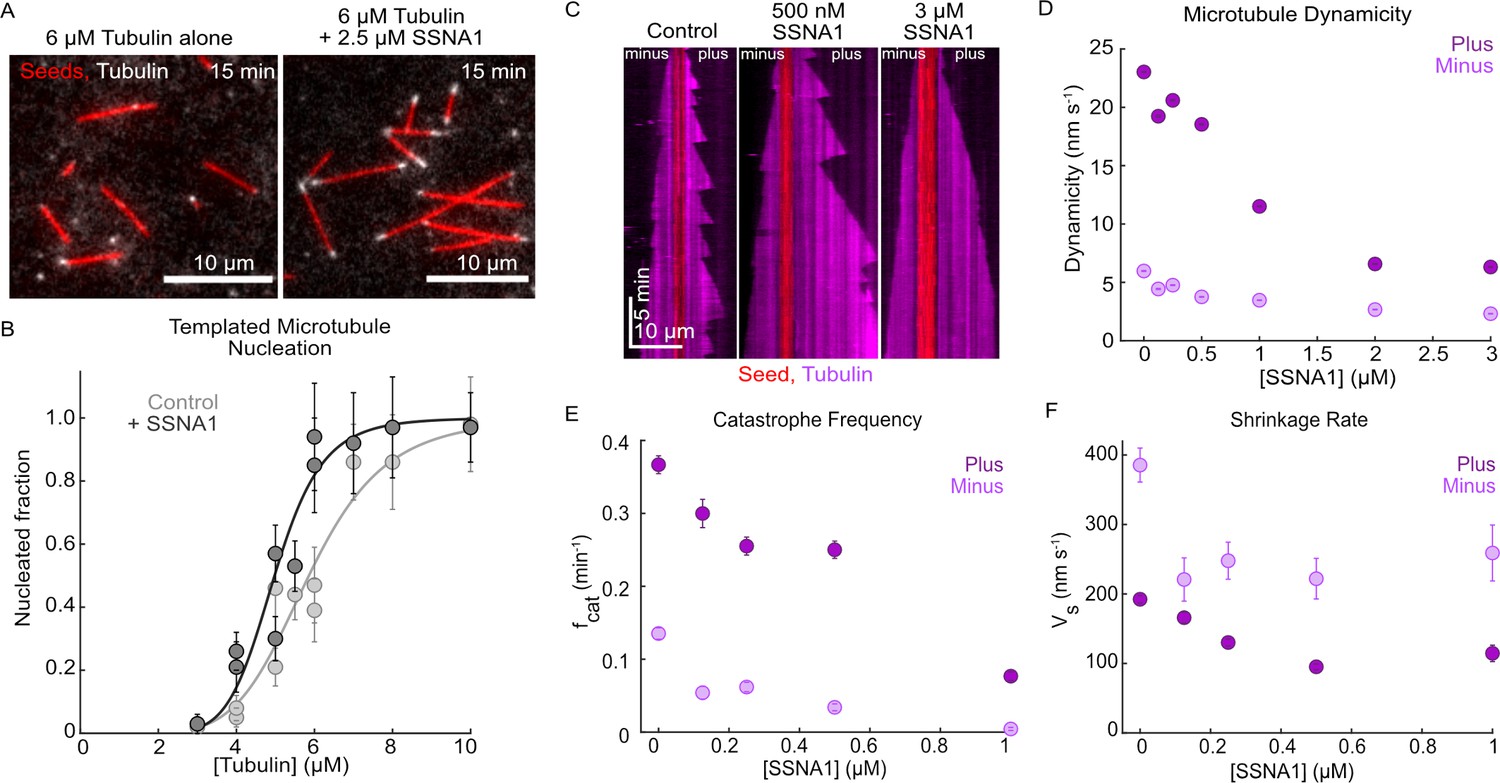
Human SSNA1 promotes microtubule nucleation and suppresses microtubule dynamicity.
(A) Representative images of a templated microtubule nucleation assay in which microtubule extensions (gray) were nucleated from GMPCPP-stabilized seeds (red) in the presence and absence of SSNA1. Images shown are for the 6 µM tubulin condition with and without 2.5 µM 488-SSNA1 at 15 min after the introduction of the nucleation reaction. (B) Quantification of the fraction of seeds that nucleated in 15 min with tubulin alone (control, light gray) and 2.5 µM 488-SSNA1 (dark gray) as a function of tubulin concentration. Data are individual experimental replicates ±SE from six experimental days (N=30–68 microtubules for each concentration tested in the tubulin-alone control condition, N=33–77 microtubules for each concentration tested in the SSNA1 condition). The data were fitted to a sigmoidal curve of the form y(x)=xs/(C+xs) (solid lines). For tubulin alone, C=5.9 µM (95% CI: 5.5–6.2) and s=6.0 (95% CI: 3.4–8.6). For the SSNA1 condition, C=5.0 µM (95% CI: 4.7–5.3) and s=8.0 (95% CI: 4.3–11.9). (C) Representative kymographs of microtubules grown from GMPCPP-stabilized seeds with 9 µM Alexa-647 tubulin alone (control) and in the presence of 500 nM and 3 µM SSNA1. The microtubule plus ends are shown on the right and the minus ends are shown on the left. (D) Quantification of microtubule dynamicity as a function of the SSNA1 concentration. Dynamicity is calculated as the total length of growth and shrinkage over the observation time. (E) Quantification of the microtubule catastrophe frequency at the plus and minus ends of microtubules grown with 9 µM tubulin and concentrations of SSNA1 from 0 µM to 1 µM. (F) Quantification of the microtubule shrinkage rate at the plus and minus ends of microtubules grown with 9 µM tubulin and concentrations of SSNA1 from 0 µM to 1 µM. For the quantifications in panels (D–F), data are weighted means ± SE obtained from four independent experimental days (N=43–485 growth events for each concentration tested at microtubule plus ends; N=30–120 growth events for each concentration tested at microtubule minus ends). Plus end data are in dark purple; minus end data are in light purple.
-
Figure 1—source data 1
An Excel sheet containing numerical data for the quantification of microtubule nucleation and microtubule dynamics presented in Figure 1 and Figure 1—figure supplement 2.
- https://cdn.elifesciences.org/articles/67282/elife-67282-fig1-data1-v2.xlsx
Figure 1—figure supplement 1
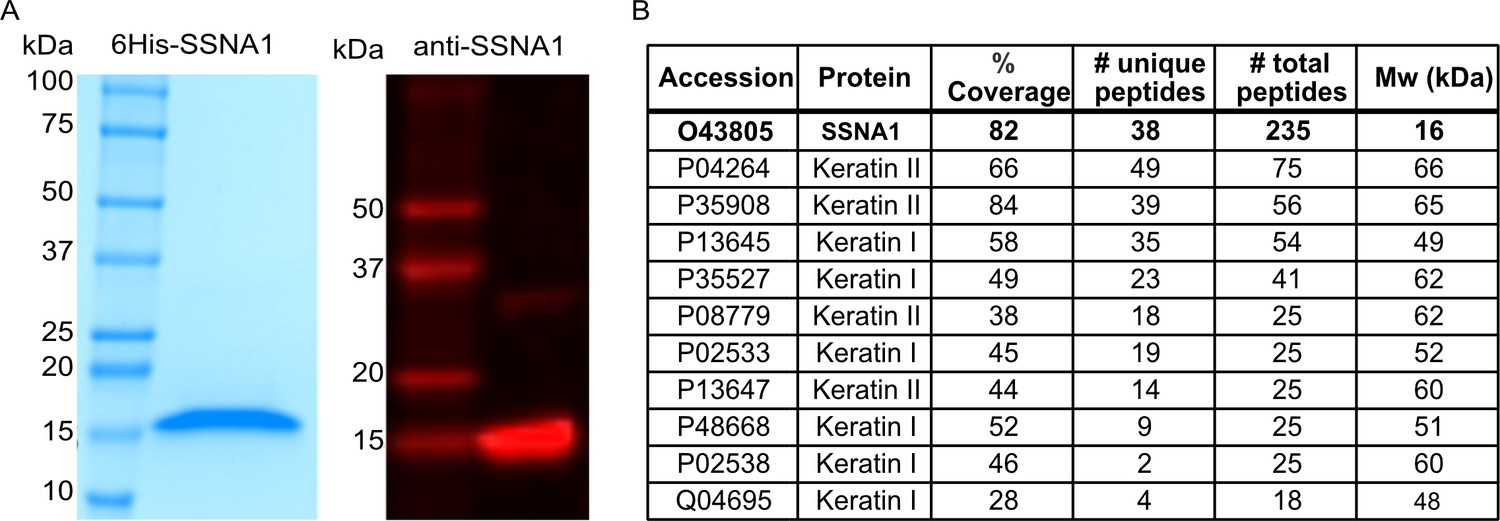
Human SSNA1 protein purification.
(A) SDS-page gel showing purified His-SSNA1 protein (left) and a Western blot of purified SSNA1 protein probed with anti-SSNA1 Rabbit Polyclonal Antibody (ProteinTech; cat# 11797-1-AP) (right). (B) Mass spectrometry analysis of His-SSNA1 purified from Escherichia coli cells. The hits with more than 10 total peptides are listed.
Figure 1—figure supplement 2
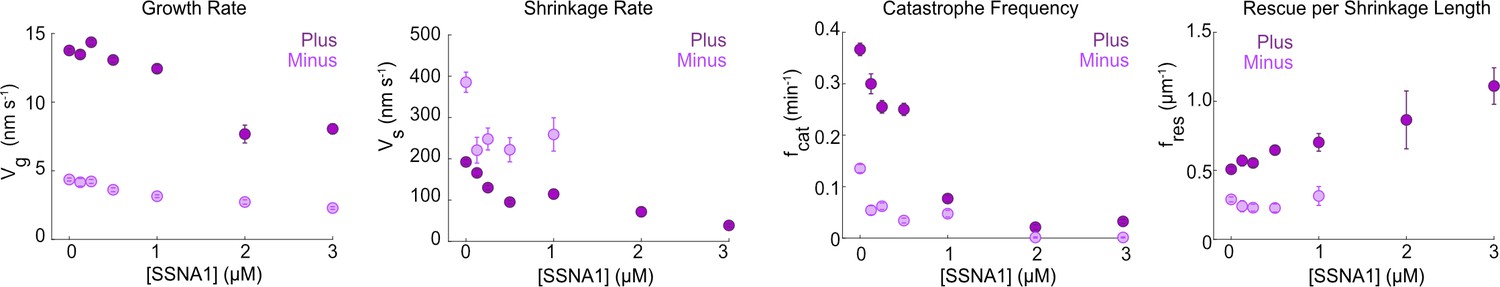
SSNA1 modulates all parameters of microtubule dynamics.
Quantification of the growth rate, shrinkage rate, catastrophe frequency, and rescue per shrinkage length at the plus ends (dark purple) and minus (light purple) ends of microtubules grown with 9 µM tubulin and concentrations of SSNA1 from 0 µM to 3 µM. Data are weighted means ± SE obtained from four independent experimental days (N=43–485 growth events for each concentration tested at microtubule plus ends; N=30–120 growth events for each concentration tested at microtubule minus ends). Note that no catastrophes were detected at the minus ends with SSNA1 concentrations greater than 1 µM; therefore, the shrinkage rate and rescue per shrinkage length could not be measured in those conditions.
Figure 2 with 2 supplements
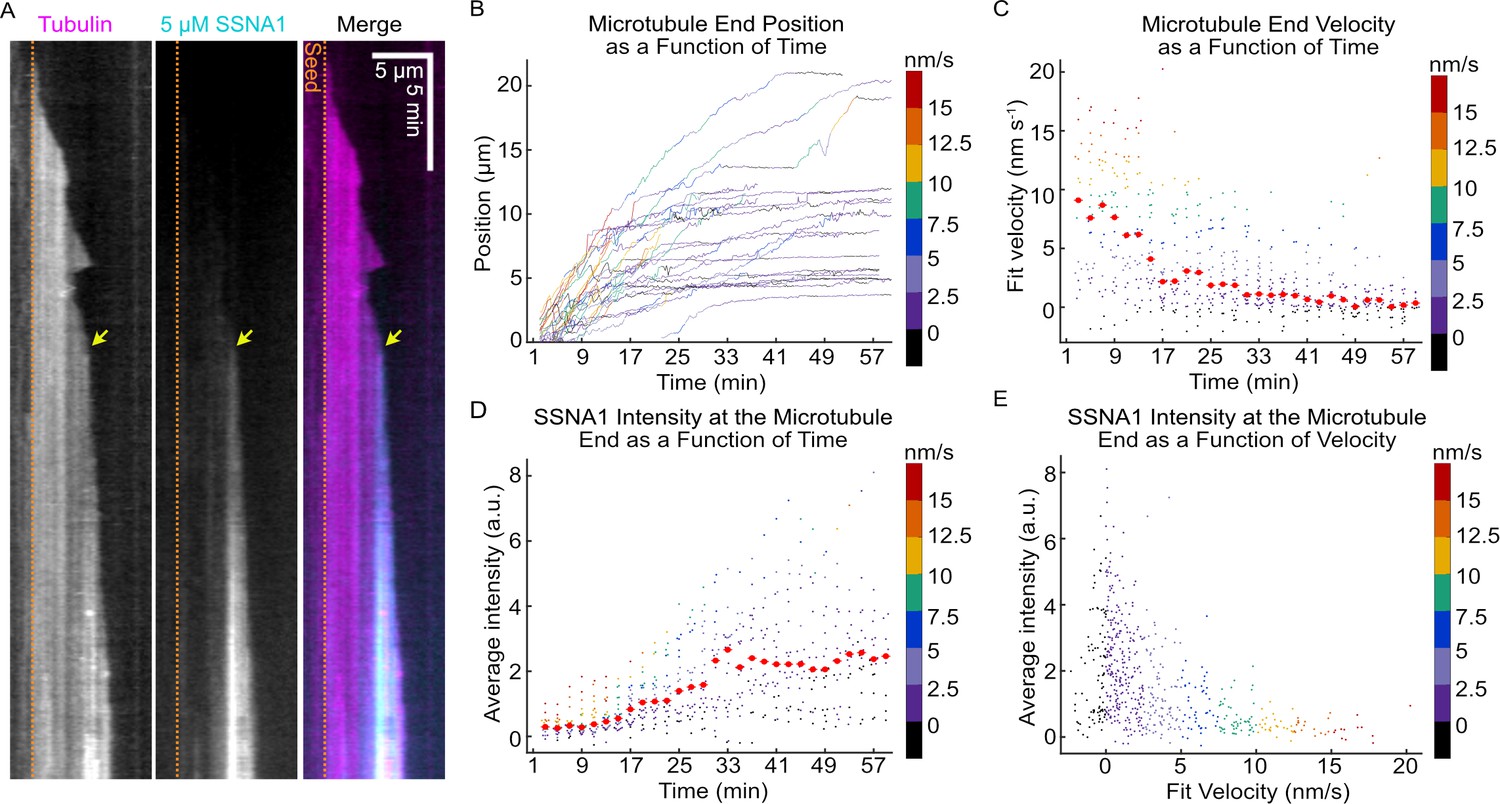
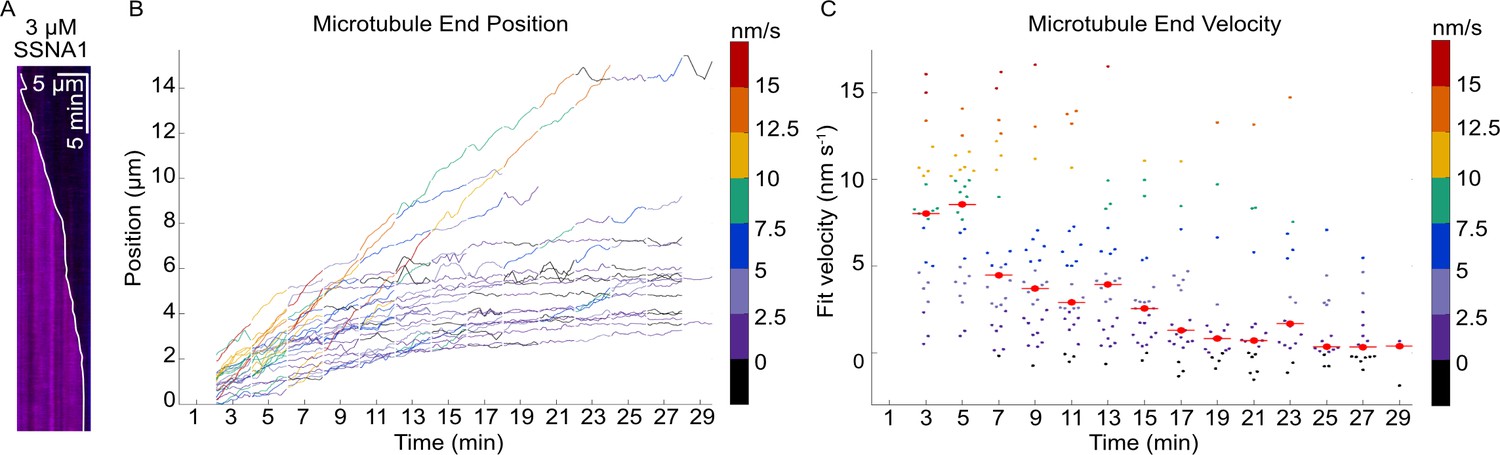
The progressive slowdown in microtubule growth correlates with SSNA1 accumulation on microtubule ends.
(A) A representative kymograph of a microtubule grown with 9 µM Alexa-647-labeled tubulin and 5 µM Alexa-488-labeled SSNA1 (7% labeled) showing the progressive localization of 488-SSNA1 to the microtubule end region over time. The yellow arrow indicates SSNA1 enrichment at the microtubule end at the onset of growth slowdown. The dotted orange lines demarcate the position of the microtubule seed (not shown). (B) Microtubule end positions as a function of time for microtubules grown with 9 µM tubulin and 5 µM Alexa-488-labeled SSNA1, color-coded with 2-min segment velocity. (C) Microtubule end velocities over a 2-min segment as a function of time calculated from the end positions in (B) and color-coded with velocity for consistency. Plots of microtubule end velocities and corresponding SSNA1 fluorescence intensities at microtubule ends (D) as a function of time and (E) as a function of 2-min segment velocity. A total of 26 microtubules were analyzed. For the plots in (D) and (E), the median for each bin is shown as a bright red point with horizontal line.
-
Figure 2—source data 1
An Excel sheet containing numerical data for the quantification of microtubule end position and velocity over time, and SSNA1 intensity as a function of both time and microtubule end velocity, as presented in Figure 2 and Figure 2—figure supplement 1.
- https://cdn.elifesciences.org/articles/67282/elife-67282-fig2-data1-v2.xlsx
Figure 2—figure supplement 1
Microtubule growth rate slows down over time in the presence of SSNA1.
(A) A representative kymograph of a microtubule grown with 9 µM tubulin and 3 µM SSNA1 showing that microtubule growth rate slows down over time; the position of the microtubule tip over time is represented by the overlaid track (white line). (B) Microtubule end positions as a function of time for microtubules grown with 9 µM tubulin and 3 µM SSNA1, color-coded with 2-min segment velocity. A total of 27 microtubules were analyzed. (C) Microtubule end velocity in a 2-min segment as a function of time calculated from the end positions in (B) and color-coded with velocity for consistency. For each bin, the median is shown as a bright red point with horizontal line.
Figure 2—figure supplement 2
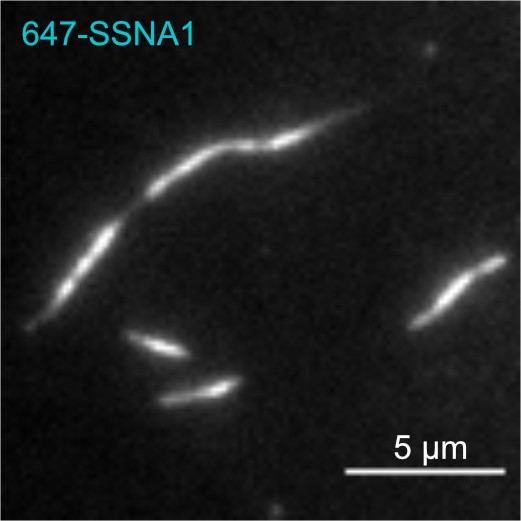
Labeled SSNA1 forms fibrils.
647-SSNA1 fibrils were grown by incubating 58 µM 647-His-SSNA1 at 35°C for 4 hr. The reaction was then flowed onto coverslips coated with anti-His-antibody and imaged by TIRF microscopy.
Figure 3 with 1 supplement
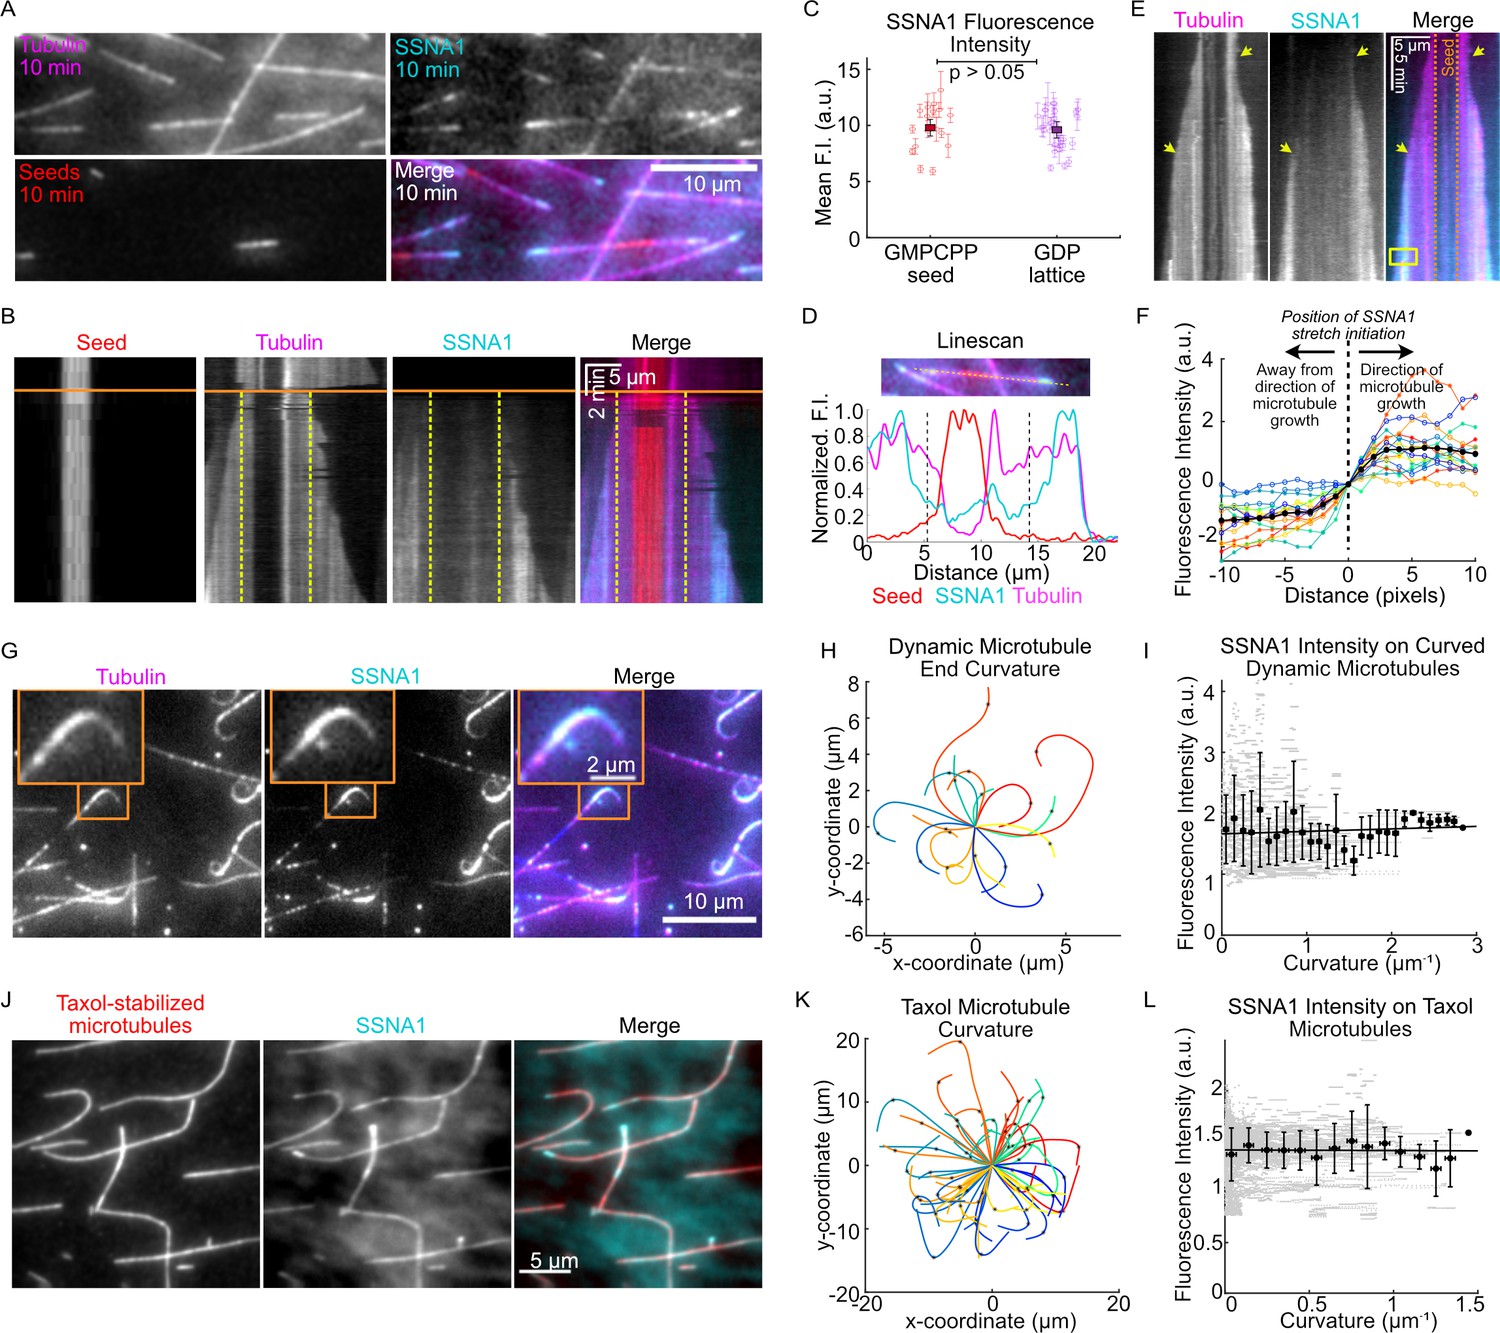
SSNA1 forms stretches on growing microtubule ends.
(A) A representative field of view of microtubules at 10 min post-SSNA1 wash-in. Microtubule extensions were pre-grown with 15 µM 647-tubulin and then 15 µM tubulin and 2.5 µM 488-SSNA1 (15% labeled) were introduced into the channel. (B) A kymograph of a microtubule from a wash-in experiment. The solid orange line indicates the time of SSNA1 introduction. The dashed vertical lines mark the boundary between the pre-existing lattice and the new lattice. (C) Quantification of the mean SSNA1 fluorescence intensity on the GMPCPP-stabilized microtubule seeds and pre-existing GDP microtubule lattices. A total of 17 microtubules were analyzed. Statistical significance was determined by Welch’s t-test. (D) Linescans showing the normalized fluorescence intensities of the microtubule seed (red), dynamic microtubule extension (magenta), and SSNA1 (cyan). The two dashed vertical lines mark the boundary between the pre-existing and new microtubule lattice, as indicated on the kymograph in (B). (E) An example kymograph showing stretches of SSNA1 forming at both microtubule ends. (F) Quantification of the SSNA1 fluorescence intensity toward and away from the direction of microtubule growth. The vertical dotted line indicates the position on the lattice at which the SSNA1 stretch initiated. N=16 SSNA1 stretches were analyzed. (G) Representative images of curved microtubules that were grown with 9 µM tubulin and 5 µM 488-labeled SSNA1 (7% labeled) for 60 min. The orange box indicates the zoomed region shown in inset. (H) Plots of curved microtubule extensions of microtubules grown in the conditions described for (G). A total of 17 curls were analyzed. (I) Corresponding quantification of SSNA1 intensity as a function of microtubule curvature on dynamic microtubules. Individual data points are in gray and the means and SD of binned data (0.1 µm–1 bin width) are in black. The solid line is a linear fit to the means and the slope is not significantly different from zero (slope= 0.04 [95% CI: –0.05 to 0.13] a.u. × µm, p-value=0.4). (J) Taxol-stabilized microtubules were incubated with 5 µM 488-SSNA1 and imaged for 60 min. Sum projection images of a representative field of view are shown. (K) Plots of curved Taxol-stabilized microtubules. A total of 59 microtubules were analyzed. (L) Corresponding quantification of SSNA1 intensity as a function of microtubule curvature on Taxol-stabilized microtubules. Individual data points are in gray and the means and SD of binned data (0.1 µm–1 bin width) are in black. The solid line is a linear fit to the means and the slope is not significantly different from zero (slope = −0.006 [95% CI: –0.118 to 0.105] a.u. × µm, p-value=0.9).
-
Figure 3—source data 1
An Excel sheet containing numerical data for the quantifications presented in Figure 3.
- https://cdn.elifesciences.org/articles/67282/elife-67282-fig3-data1-v2.xlsx
Figure 3—figure supplement 1
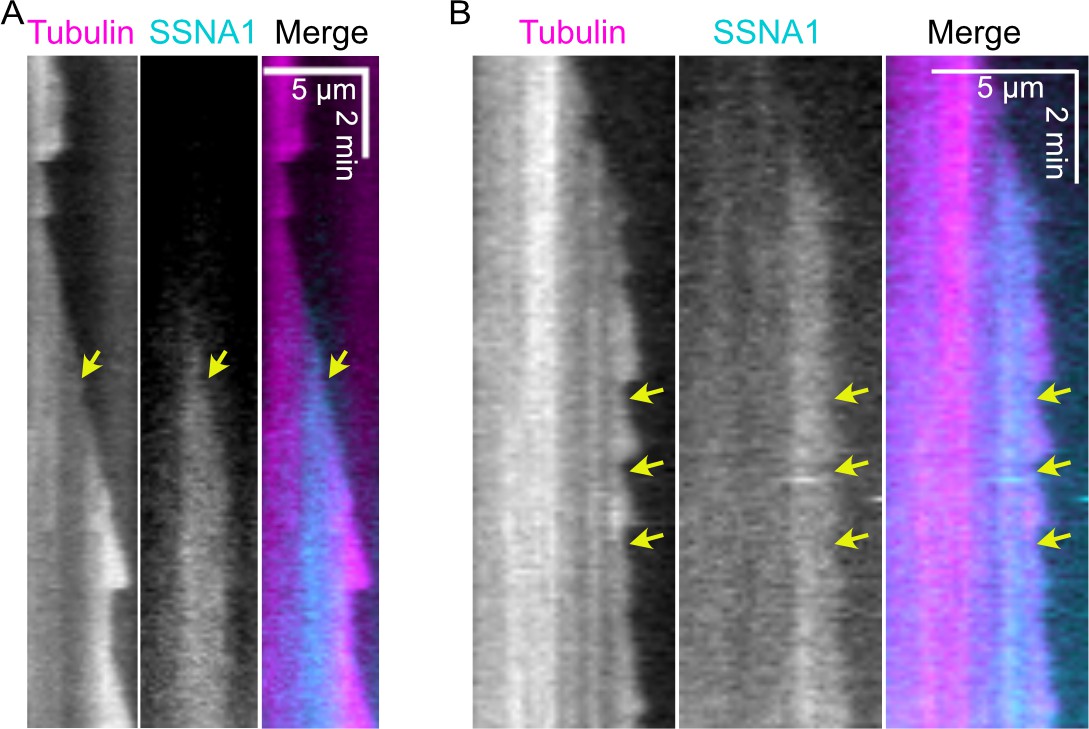
SSNA1 stretches can resolve and serve as stable rescue sites.
(A) A stretch of SSNA1 that initiates at the microtubule tip (yellow arrow) and subsequently resolves allowing the microtubule tip continues to grow. (B) A stretch of SSNA1 that serves as a stable rescue point (yellow arrow).
Figure 4 with 2 supplements
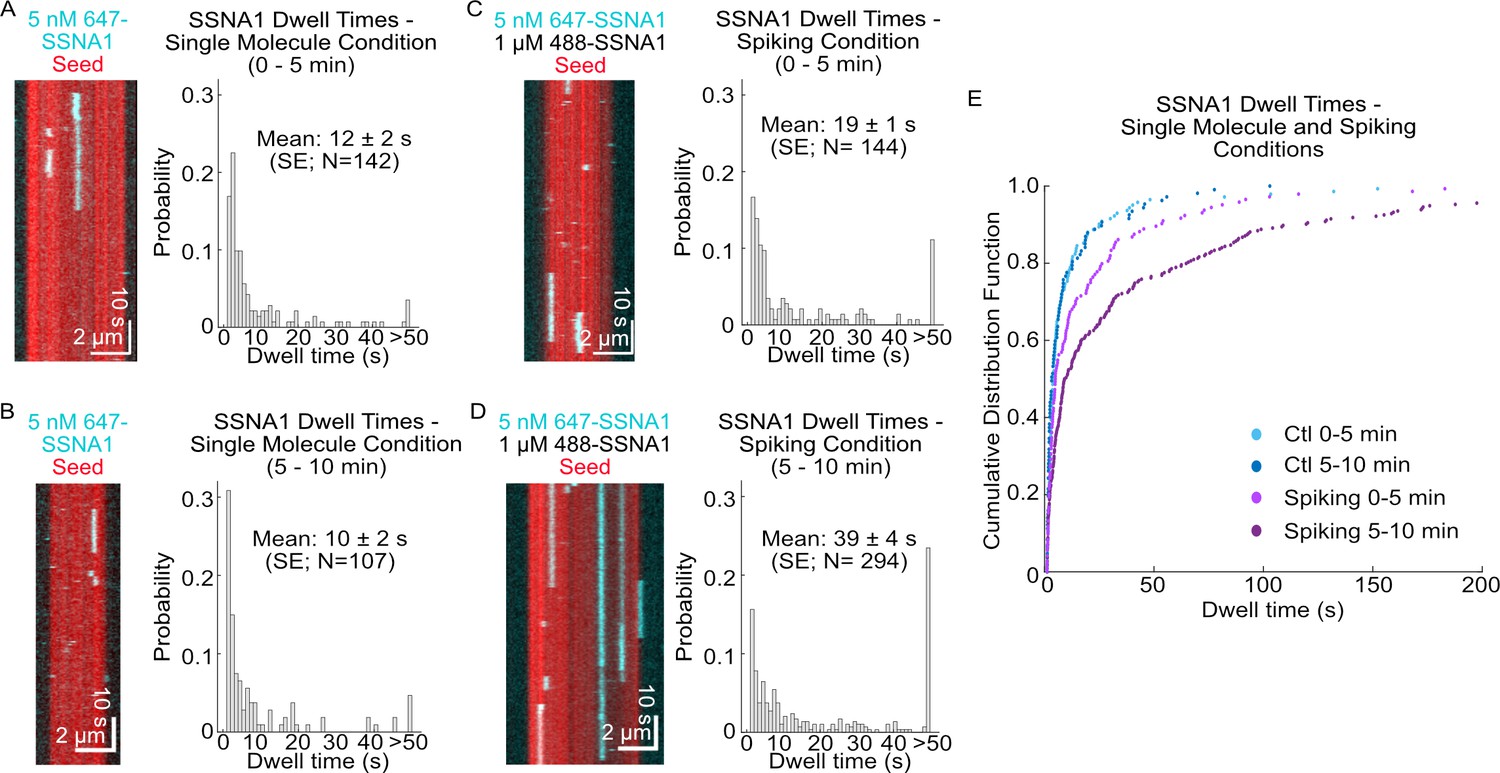
SSNA1 binds cooperatively to microtubules.
Representative kymographs of single-molecule SSNA1 binding events on GMPCPP-stabilized microtubules and corresponding quantification of the single-molecule dwell times (A) 0–5 min and (B) 5–10 min after SSNA1 addition. Representative kymographs of single-molecule SSNA1 binding events in the presence of excess SSNA1 (‘spiking’ condition) on GMPCPP-stabilized microtubules and corresponding quantification of the single-molecule dwell times (C) 0–5 min and (D) 5–10 min after SSNA1 addition. (E) Cumulative distribution plots of SSNA1 single-molecule dwell times at 0–5 min and 5–10 min post-addition of SSNA1 for both the single-molecule control (blue dots) and spiking (purple dots) conditions.
-
Figure 4—source data 1
An Excel sheet containing numerical data for the quantification of single-molecule SSNA1 dwell times and SSNA1 fluorescence intensity, as presented in Figure 4 and Figure 4—figure supplement 1.
- https://cdn.elifesciences.org/articles/67282/elife-67282-fig4-data1-v2.xlsx
Figure 4—figure supplement 1
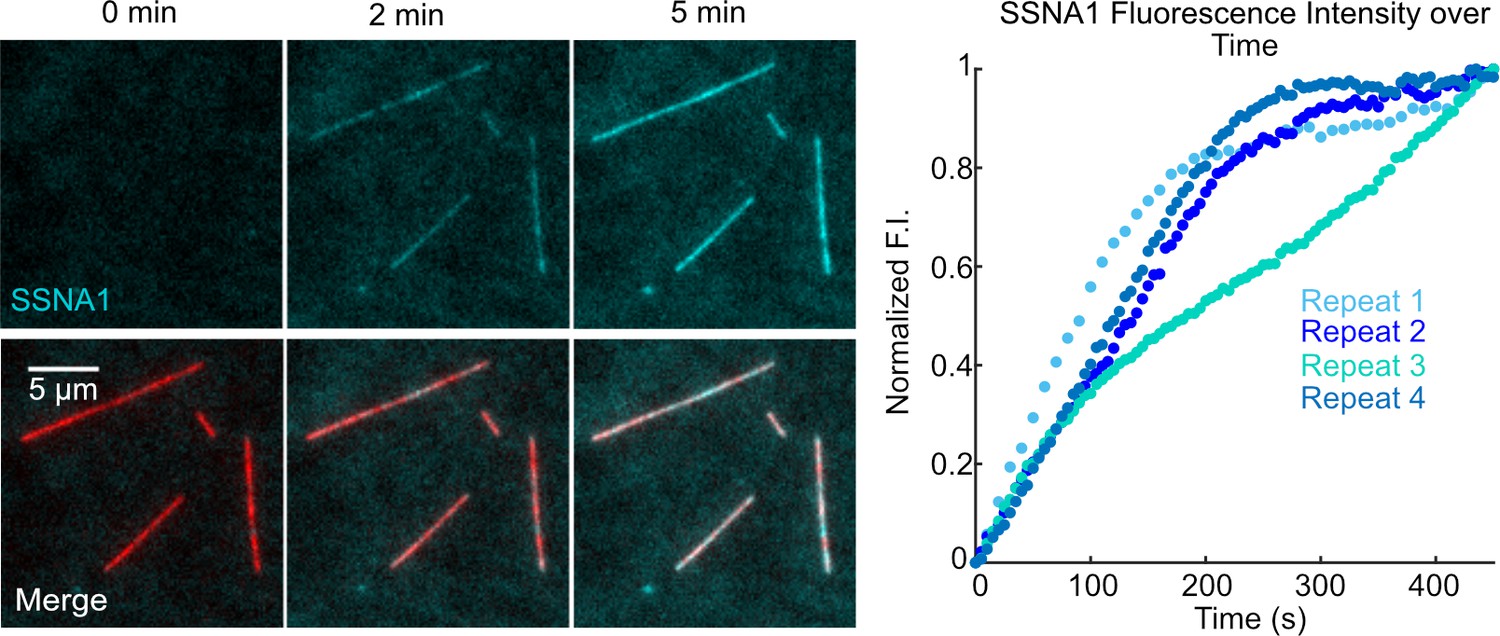
SSNA1 coats GMPCPP-stabilized microtubules.
Representative images showing GMPCPP-stabilized microtubules incubated with 2 µM Alexa-488-SSNA1 at 0, 2, and 5 min after SSNA1 addition. The total SSNA1 fluorescence intensity along the total length of microtubule lattice in the microscope field of view excluding the background was measured over time for four independent experimental repeats.
Figure 4—video 1
SSNA1 coats GMPCPP-stabilized microtubules.
GMPCPP-stabilized microtubules (red) were incubated with 2 µM 488-SSNA1 (cyan). Time is in min:s. Scale, 10 µm, Playback, 10 fps.
Figure 5 with 2 supplements
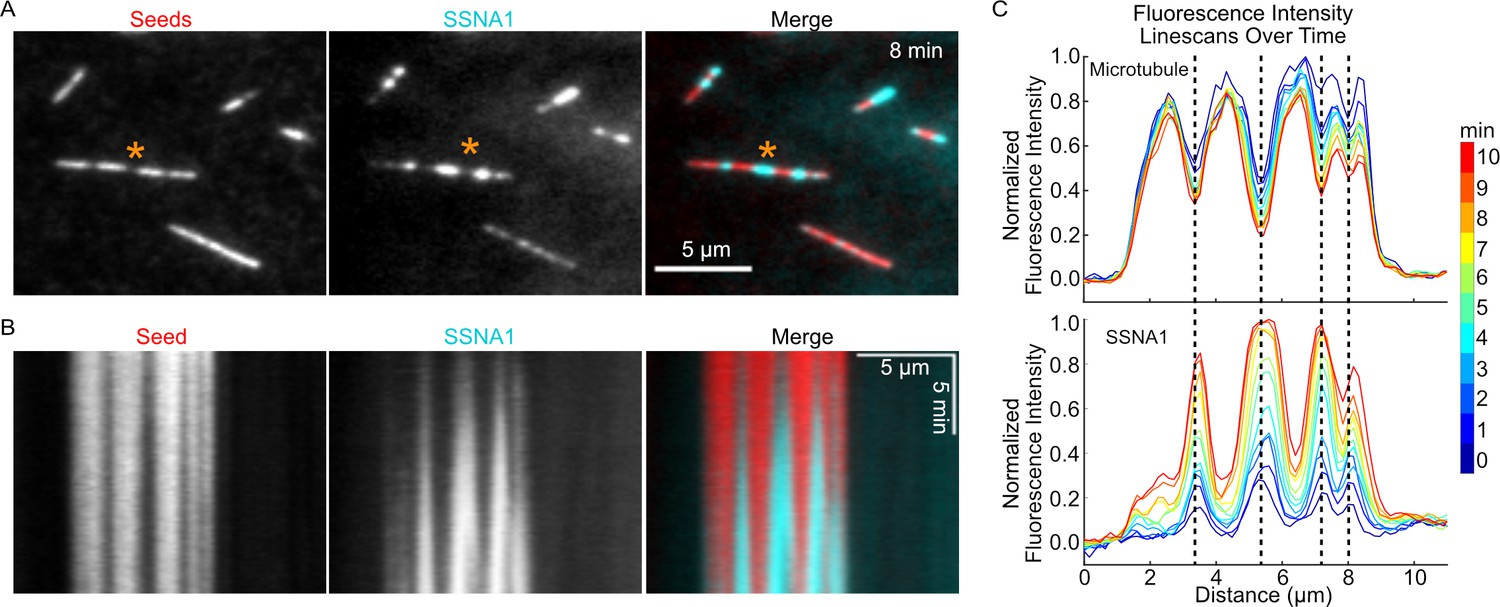
SSNA1 detects microtubule lattice damage.
(A) Representative images of GMPCPP-stabilized microtubules (red) that were pre-incubated for 5 min with 100 nM spastin and 1 mM ATP and then subsequently incubated with 5 µM 647-SSNA1 (cyan). The images shown are from 8 min after SSNA1 addition. The orange asterisks indicate the microtubule used for kymograph and linescan analysis. (B) Kymographs showing SSNA1 localization to sites of spastin-induced microtubule damage. (C) Corresponding linescan analysis of the microtubule and SSNA1 intensities every minute from 0 min to 10 min after the introduction of SSNA1.
-
Figure 5—source data 1
An Excel sheet containing numerical data for the quantification of the SSNA1 and seed fluorescence intensity linescans as presented in Figure 5 and Figure 5—figure supplement 1.
- https://cdn.elifesciences.org/articles/67282/elife-67282-fig5-data1-v2.xlsx
Figure 5—figure supplement 1
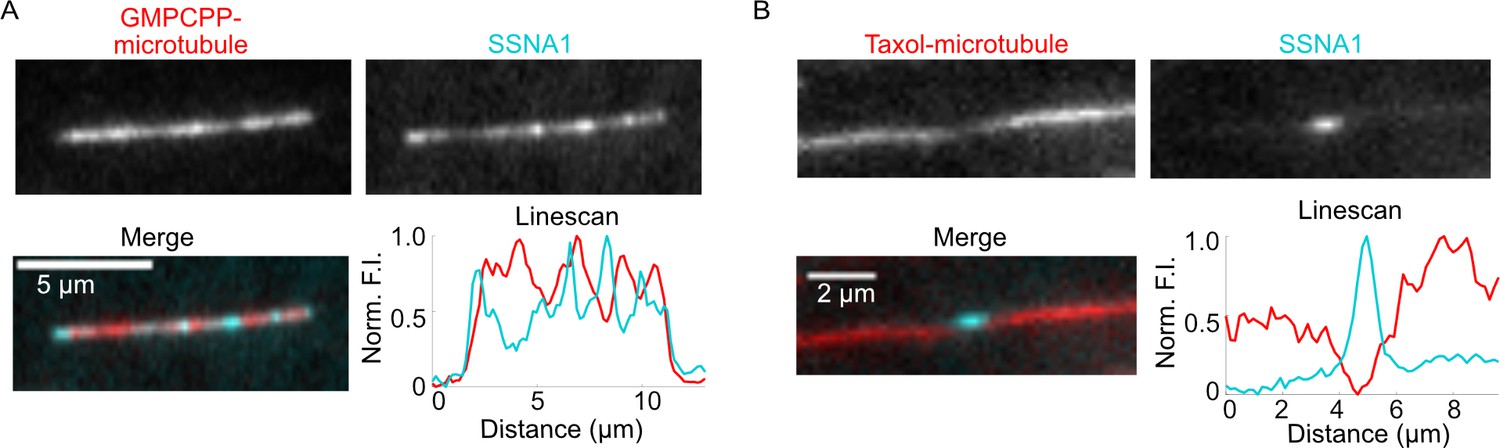
SSNA1 detects sites of microtubule lattice damage on GMPCPP-stabilized and Taxol-stabilized microtubules.
(A) An image of a GMPCPP-stabilized microtubule that was incubated with 2 µM 488-SSNA1 and corresponding fluorescence intensity linescan. (B) An image of a Taxol-stabilized microtubule that was incubated with 5 µM 488-SSNA1 and corresponding fluorescence intensity linescan.
Figure 5—figure supplement 2
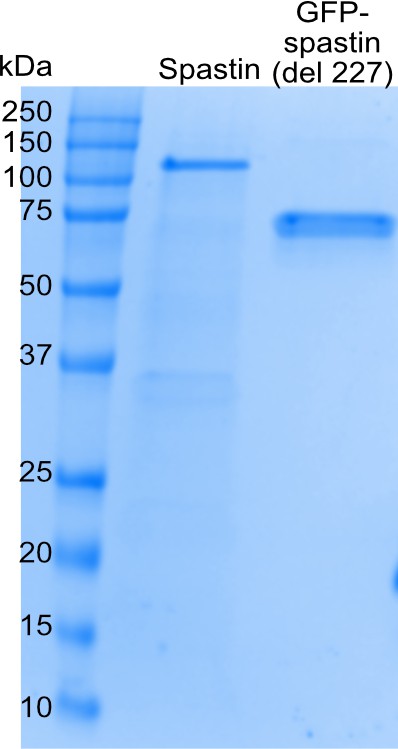
Spastin protein purification.
SDS-Page gel of purified 6His-MBP-spastin and His-strep-sfGFP-spastin (del227) proteins used in this study.
Figure 6 with 1 supplement
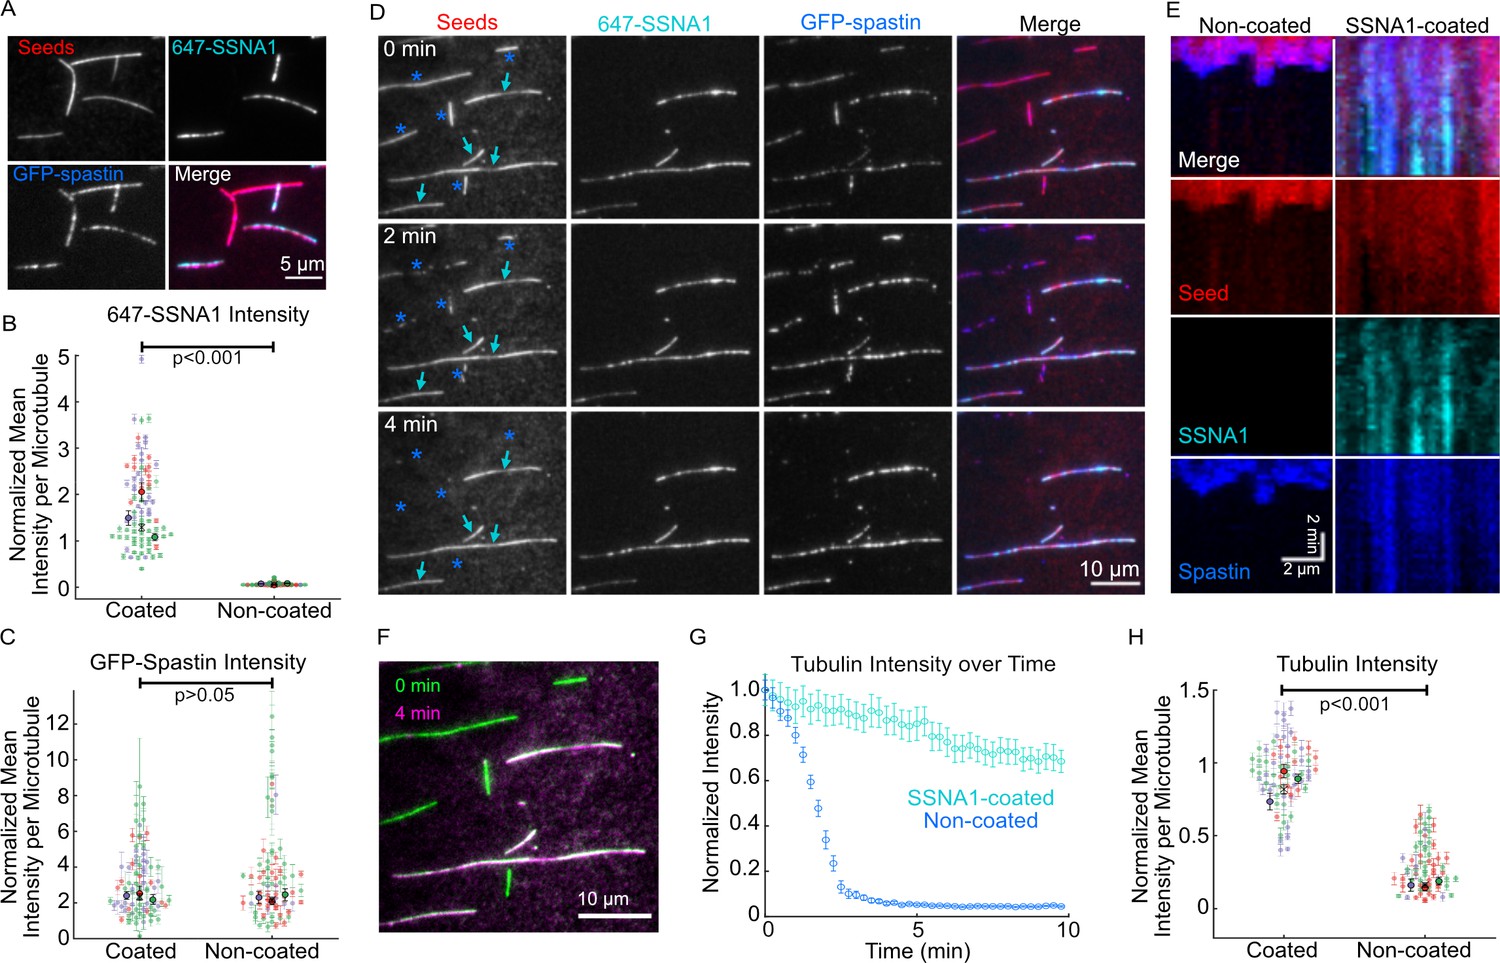
SSNA1 protects microtubules against severing by spastin.
(A) Representative images of a mixed population of Taxol-stabilized microtubules that were either coated or not coated with 647-SSNA1 and treated with 25 nM GFP-spastin in the presence of 1 mM AMPPNP. (B) Quantification of the SSNA1 fluorescence intensities on SSNA1-coated (N=79) and non-coated (N=72) microtubules, p<0.001, unpaired t-test. (C) Quantification of the spastin fluorescence intensities on SSNA1-coated (N=79) and non-coated (N=72) microtubules, p=0.4, unpaired t-test. The colors in (B) and (C) represent different experimental repeats, the larger markers are mean ± SD for each experimental day. X marks the overall mean. (D) Representative images of a mixed population of microtubules (red) that were either coated or not coated with 2 µM 647-SSNA1 (cyan) prior to the introduction of 25 nM GFP-spastin (blue). The images are from 0 min, 2 min, and 4 min post-addition of spastin and 1 mM ATP. The cyan arrows indicate microtubules that were coated with SSNA1 and the blue asterisks were non-coated. (E) Representative kymographs of a non-coated (left) and SSNA1-coated (right) microtubules. (F) Overlay of the tubulin signal for the field of view in (D) at 0 min (green) versus 4 min (magenta), showing the loss of non-SSNA1-coated microtubules. (G) An example trace of tubulin fluorescence intensity over time for non-coated (blue) and SSNA1-coated (gray) microtubules in one field of view. Error bars represent SE. (H) Tubulin intensity for a time point where control (non-coated) microtubules reach an average of 20% of initial intensity. p<0.001, unpaired t-test. The colors represent different experimental repeats, the larger markers are mean ± SE for each experimental day. X marks the overall mean. N=66 microtubules per condition. Data are from three independent experimental repeats.
-
Figure 6—source data 1
An Excel sheet containing numerical data for the quantification of the SSNA1, GFP-spastin and tubulin fluorescence intensities as presented in Figure 6.
- https://cdn.elifesciences.org/articles/67282/elife-67282-fig6-data1-v2.xlsx
Figure 6—figure supplement 1
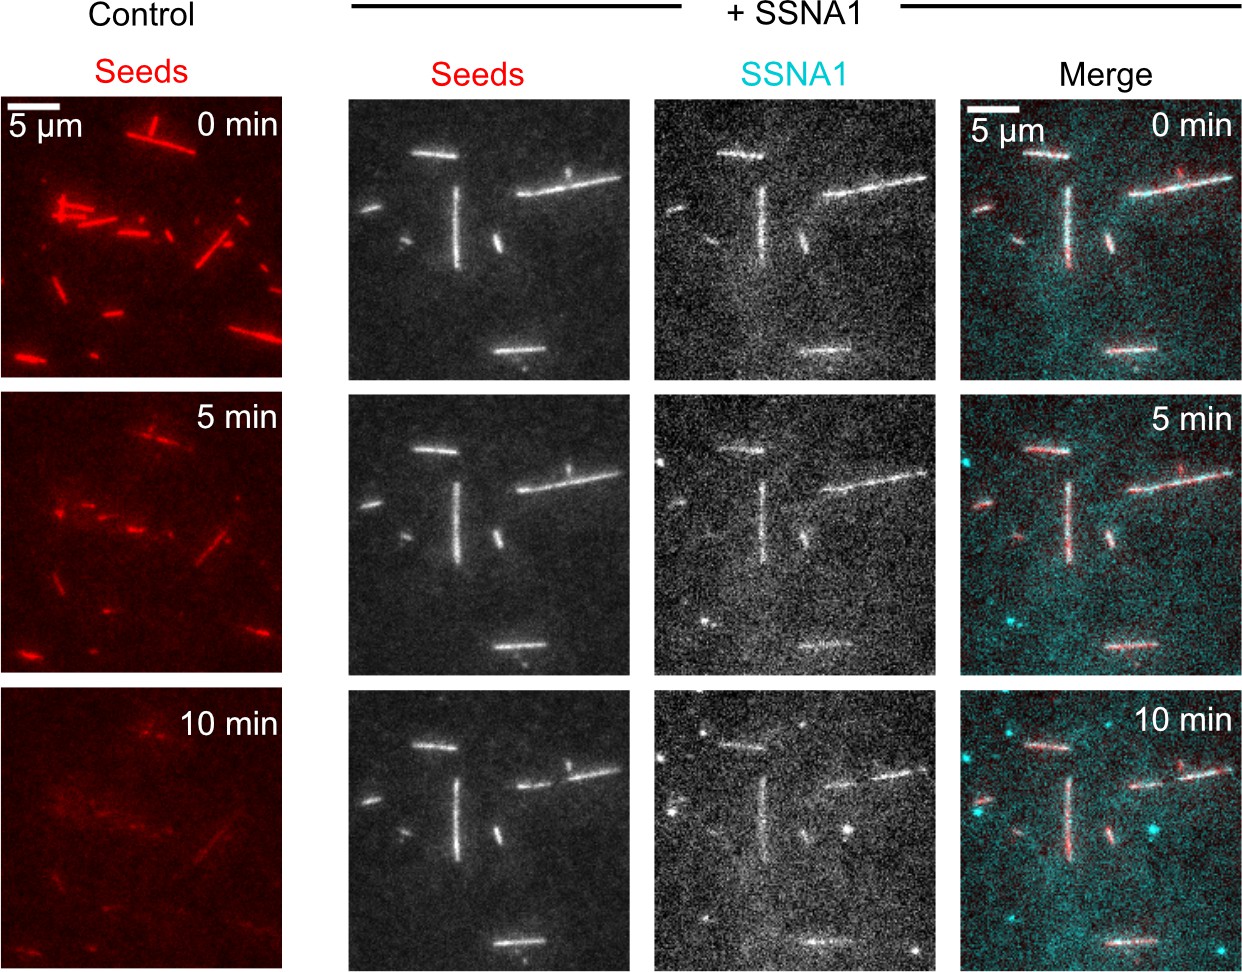
SSNA1 protects microtubules against full-length human spastin-mediated severing.
Representative images of control (left) and SSNA1-coated (right) microtubules incubated with 200 nM full-length human 6His-MBP-spastin. Microtubules were pre-incubated with either SSNA1 storage buffer (control) or 1 µM 488-SSNA1 for 10 min prior to the addition of spastin. Spastin was introduced at t=0 min.
Videos
Video 1
SSNA1 stabilizes dynamic microtubules.
Dynamic microtubules were grown from GMPCPP-stabilized seeds with 9 µM Alexa-647 tubulin alone (control, left) and in the presence of 5 µM SSNA1 (right). The seeds are shown in red and the dynamic extensions are in magenta. Time is min:s. Scale, 10 µm. Playback, 30 fps.
Video 2
SSNA1 progressively localizes to dynamic microtubule extensions.
Dynamic microtubule extensions (magenta) were grown from GMPCPP-stabilized microtubule seeds (red) with 9 µM tubulin and 5 µM 488-SSNA1 (cyan). Time is in min:s. Scale, 10 µm. Playback, 30 fps.
Video 3
SSNA1 forms stretches on growing microtubule ends.
A field of view of microtubules in a wash-in experiment in which dynamic microtubule extensions (magenta) were initially grown from GMPCPP-stabilized microtubule seeds (red) with 15 µM tubulin alone and subsequently, at t=2 min, the reaction was exchanged to 15 µM tubulin and 2.5 µM 488-SSNA1 (cyan). Time is in min:s. Scale, 10 µm. Playback, 30 fps.
Video 4
SSNA1 detects spastin-induced microtubule lattice damage.
GMPCPP-stabilized microtubules were pre-incubated with 100nM spastin to generate damage sites on the microtubule lattice and 5µM 647-SSNA1 was introduced at t=0min. Seeds are in red, SSNA1 is in cyan. Time is in min:s. Scale, 5µm. Playback, 20 fps.SSNA1 protects microtubules against spastin-mediated microtubule severing.
Video 5
SSNA1 protects microtubules against spastin-mediated microtubule severing.
Control (left) and SSNA1-coated (right) microtubules were incubated with 200nM full-length human 6His-MBP-spastin. Microtubules were pre-incubated with either SSNA1 storage buffer (control) or 1µM 488-SSNA1 for 10min prior to the addition of spastin. Spastin was introduced at t=0min. Scale, 5µm.
Video 6
SSNA1 prevents spastin severing but not binding.
A mixed population of Taxol-stabilized microtubules (red) were either coated or not coated with 647-SSNA1 (cyan) and treated with 25 nM GFP-spastin (blue) in the presence of 1 mM ATP. Time is in min:s. Scale, 10 µm. Playback, 10 fps.
Additional files
Download links
A two-part list of links to download the article, or parts of the article, in various formats.
Downloads (link to download the article as PDF)
Open citations (links to open the citations from this article in various online reference manager services)
Cite this article (links to download the citations from this article in formats compatible with various reference manager tools)
SSNA1 stabilizes dynamic microtubules and detects microtubule damage
eLife 10:e67282.
https://doi.org/10.7554/eLife.67282


