Intestinal goblet cells sample and deliver lumenal antigens by regulated endocytic uptake and transcytosis
- Department of Neuroscience and Physiology, University of Gothenburg, Sweden
- Department of Internal Medicine, Washington University School of Medicine, United States
- Center for Cellular Imaging, Washington University School of Medicine, United States
- Mary H. Weiser Food Allergy Center, University of Michigan School of Medicine,, United States
- Department of Cell Biology &Physiology, Washington University School of Medicine, United States
- Department of Neuroscience, Washington University School of Medicine, United States
- Department of Biomedical Engineering, Washington University in St. Louis, United States
- Department of Pediatrics, Harvard Medical School, United States
- Division of Gastroenterology, Nutrition and Hepatology, Boston Children’s Hospital, United States
- Harvard Digestive Disease Center, Harvard Medical School, United States
Figures
Figure 1 with 1 supplement
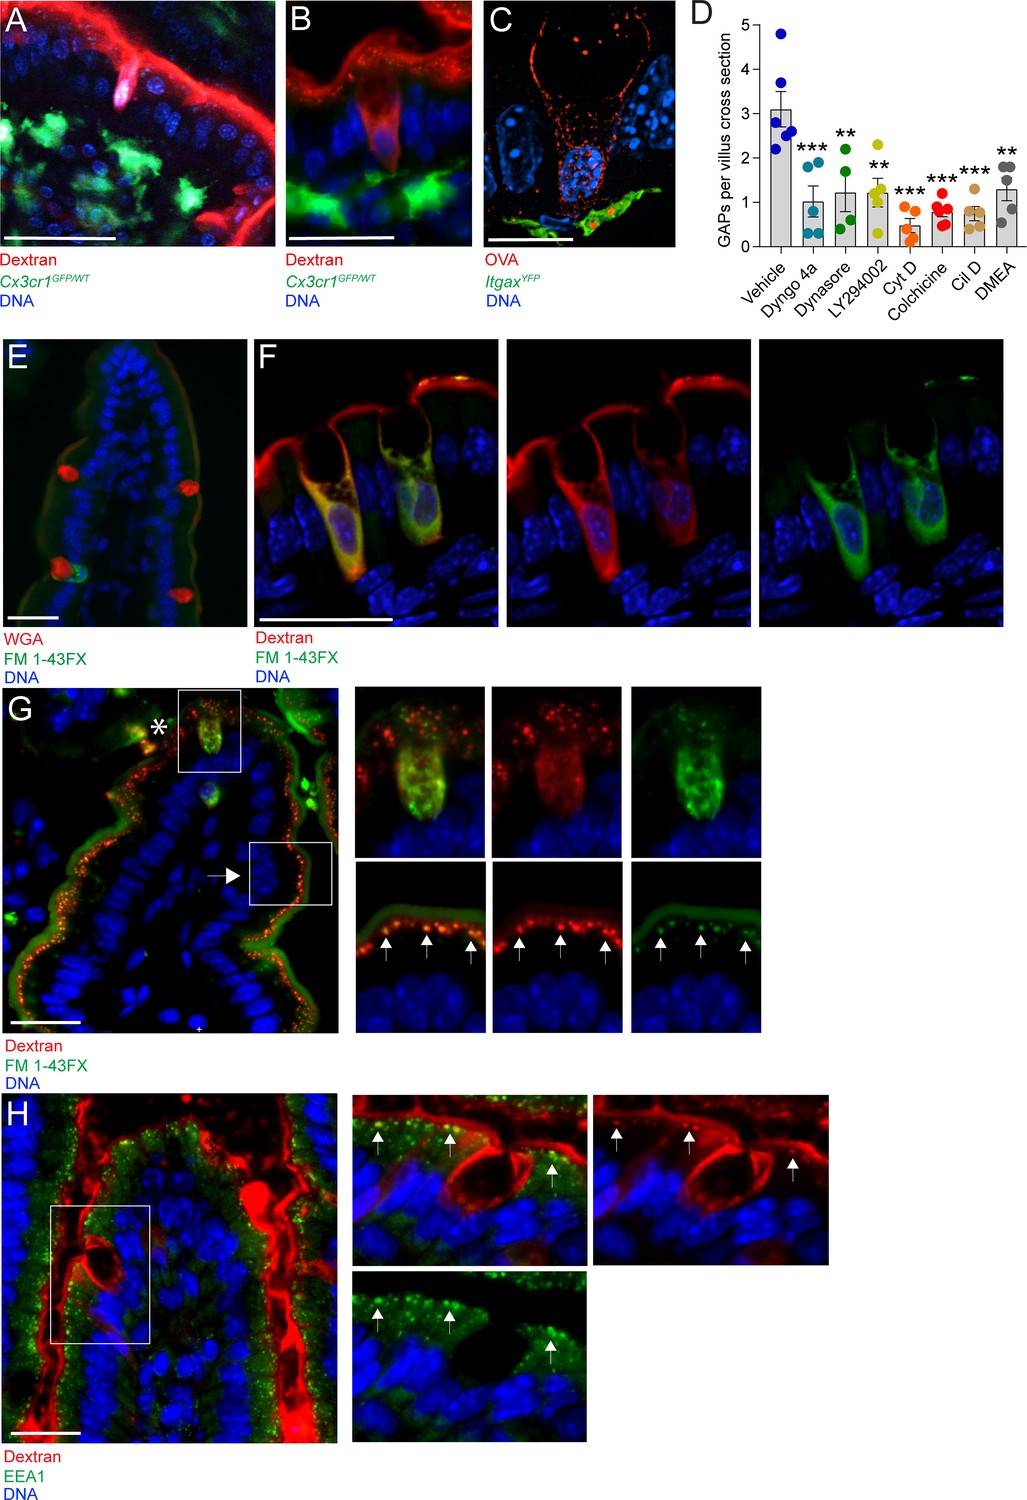
Goblet cell associated antigen passage (GAP) formation is an active endocytic process dependent on actin polymerization, microtubule transport, and phosphoinositide three kinase (PI3K).
(A) Intravital two-photon imaging, (B) wide-field fluorescent imaging, and (C) super-resolution structured illumination microscopy (SIM) imaging of the small intestine (SI) of CX3CR1GFP (green) or ItgaxYFP (green) reporter mice following luminal administration of 10 kDa tetramethylrodamine (TRITC)-dextran (red) or Texas Red-Ovalbumin (OVA; red). (D) Quantification of GAPs per SI villus cross section in mice treated with vehicle (n = 6), Dyngo 4a (n = 5), dynasore (n = 4), LY294002 (n = 5), cytochalasin D (Cyt D, n = 5), colchicine (n = 6), ciliobrevin D (Cil D, n = 5), or dimethylenastron (DMEA, n = 5) followed by intraluminal administration of 10 kDa TRITC-dextran. (E) Wide-field fluorescent imaging of the SI following intraluminal administration of FM 1–43FX (green) for 1 hr. Goblet cells are visualized by wheat germ agglutinin (WGA-Texas Red) (red). (F) Confocal fluorescent imaging of the SI following intraluminal administration of FM 1–43FX (green) and dextran-Alexa647 (red). (G) Wide-field fluorescent imaging of the SI following intraluminal administration of FM 1–43FX (green) and dextran-Alexa647 (red). Asterisk denotes goblet cell, arrow denotes enterocyte, arrows in zoomed in pictures denotes endosomal structures double positive for FM 1–43FX and dextran-Alexa647 in enterocytes. (H) Wide-field fluorescent imaging of the SI following intraluminal administration of TRITC-dextran (red) stained for early endosome protein 1 (EEA1) (green). Arrows denote endosomal structures double positive for TRITC-dextran and EEA1 in enterocytes. Data are presented as mean ± SEM. **p < 0.01, ***p < 0.001 as compared to vehicle treated mice. Scale bar: (A) 50 µm, (B) 25 µm, (C) 10 µm, (E–H) 25 µm. (C and F) represent 3D projections of obtained z-stacks. Statistical analysis was performed using a one-way ANOVA followed by Dunnet’s post-hoc test. A–B, E, G–H n = 6, C, F n = 4. Each point in panel D represents the average number of GAPs from 25 villi in one mouse.
Figure 1—figure supplement 1
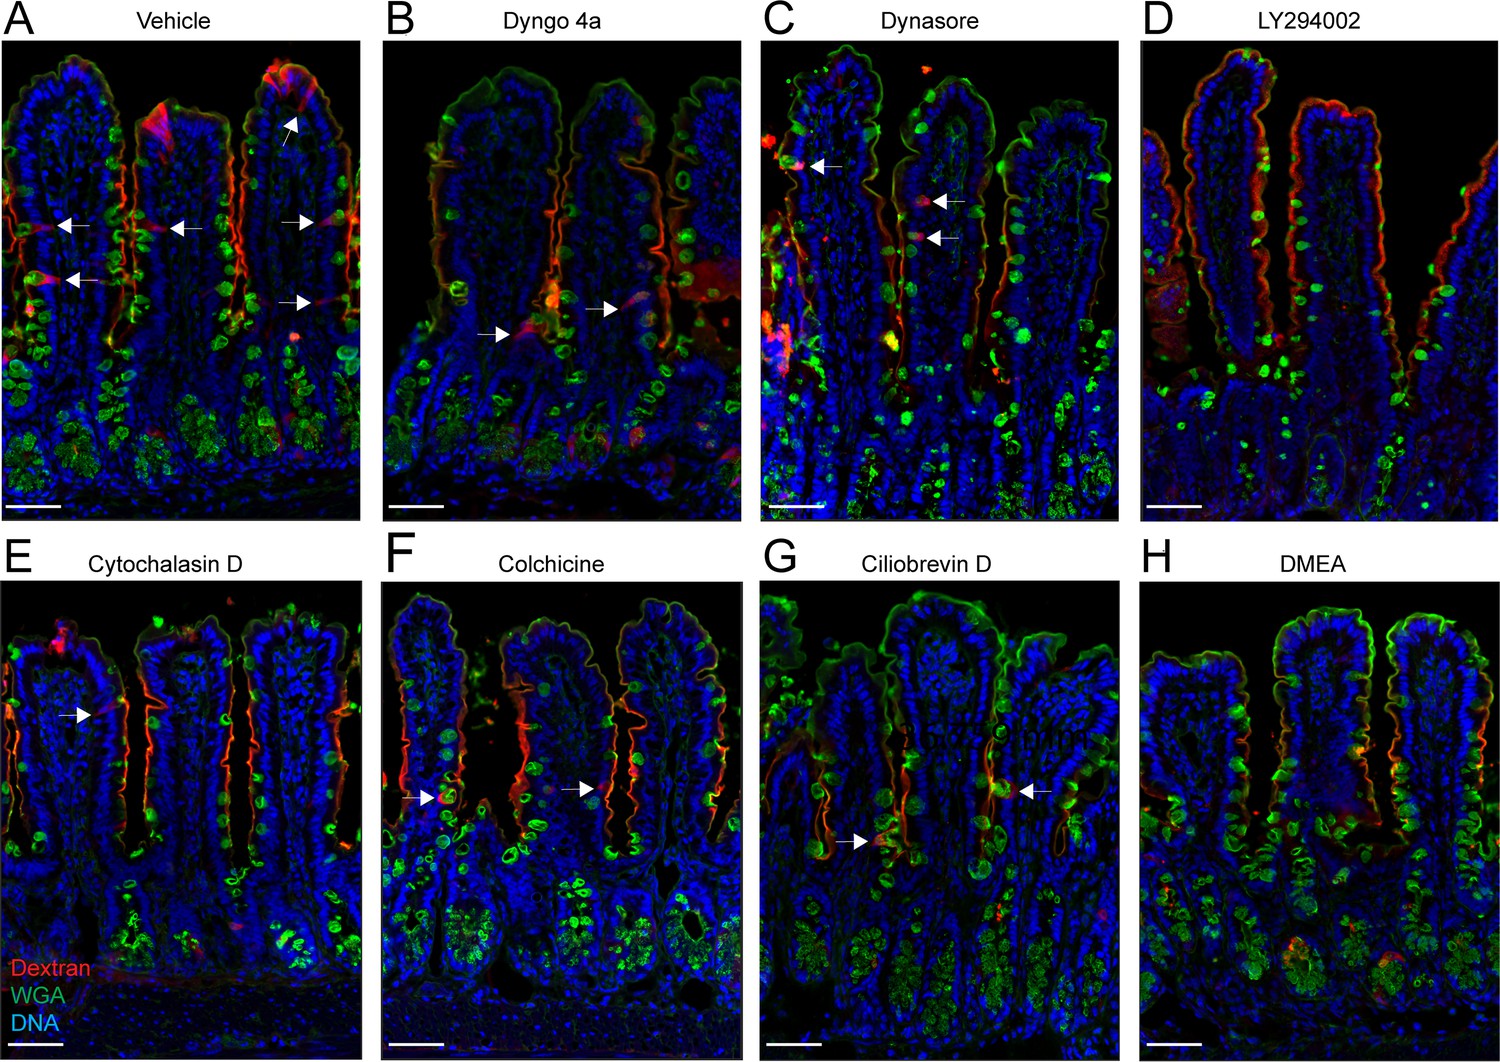
Effect of goblet cell-associated antigen passage (GAP) inhibition on tissue integrity.
Wide-field fluorescent imaging of small intestine tissues treated with (A) vehicle, (B) Dyngo 4a, (C) dynasore, (D) LY294002, (E) cytochalasin D, (F) colchicine, (G) ciliobrevin D, (H) dimethylenastron (DMEA) followed by intraluminal injection of 10 kDa tetramethylrodamine (TRITC)-dextran. Scale bar 50 µm. n = 6 in A and F, n = 5 in B, D, E, G, n = 4 in C. Arrows denote GAPs.
Figure 2 with 1 supplement

An ultrastructural model of goblet cell (GC)-associated antigen passage (GAP) formation.
(A) 3D model of the compiled focused ion beam scanning electron microscopy (FIB-SEM) data demonstrating the fates of luminal cargo in a GAP. Green: mucin granules, purple: dextran in the trans-Golgi network (TGN), dark blue: dextran in multi-vesicular bodies (MVBs) and lysosomes, red: dextran in vesicles/endosomes, light blue: nucleus. (B) Representative FIB-SEM images showing dextran localizing to TGN, MVBs, lysosomes, and endosomes/vesicles. (C and D) Wide-field fluorescent imaging of the small intestine (SI) following intraluminal administration of tetramethylrodamine (TRITC)-dextran (red) and stained for Rab3D (green), and 4',6-diamidino-2-phenylindole (DAPI) blue (DNA). (C) Goblet cells (GCs) forming GAPs show redistribution of Rab3D (green) with uptake of lumenal dextran. (D) GCs not forming GAPs show Rab3D localized to secretory granules in the theca. (E) Confocal fluorescent imaging of SI following intraluminal injection of TRITC-dextran (red) stained with wheat germ agglutinin (WGA) (green) and DAPI (blue). Arrows denote vesicular structures double positive for dextran and WGA. (F and G) Transmission electron micrographs of the basolateral area of a GC following administration of intraluminal dextran. The dashed line outlines a GC and the solid outlines an adjacent underlying cell. Arrow denote a dextran-containing structure located at the fusion point of the GC and the adjacent cell. Scale bar: (B and F) 2 µm, (C–D) 10 µm, (E) 5 µm, (G) 500 nm. n = 4 in panel B, n = 5 in panel C, D, E, n = 3 in panel E, F.
Figure 2—figure supplement 1
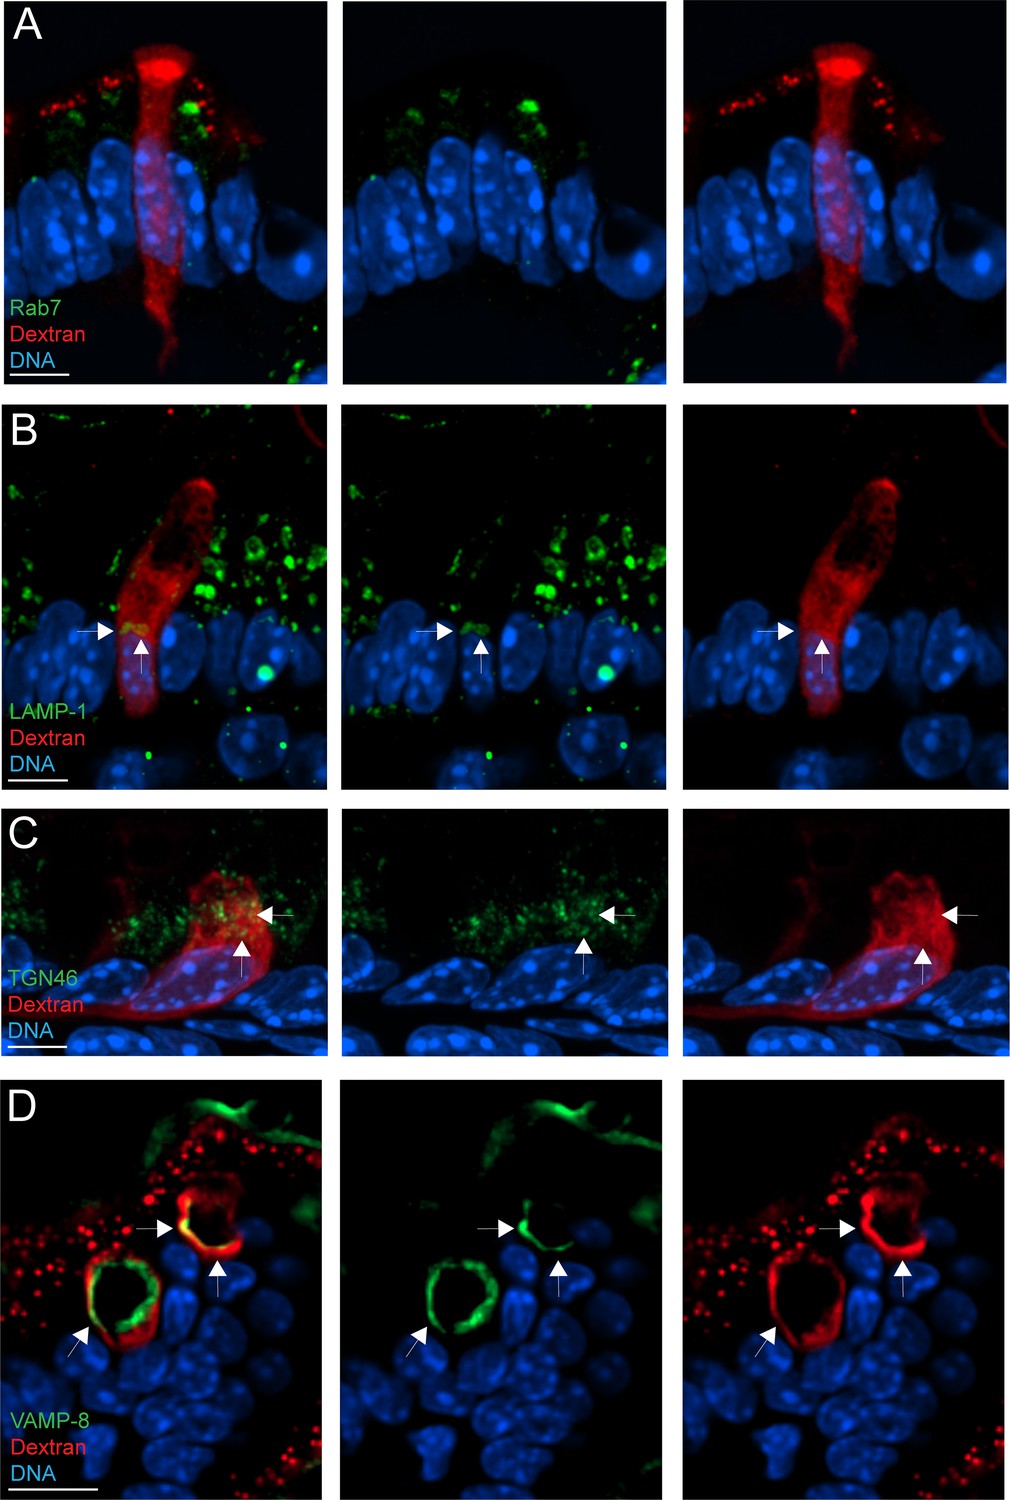
Goblet cell-associated antigen passage (GAP) formation is associated with transport of cargo to the lysosome and the trans-Golgi network (TGN).
Confocal fluorescent imaging of intestinal tissue specimens following intraluminal injection of tetramethylrodamine (TRITC)-dextran (red) stained for 4',6-diamidino-2-phenylindole (DAPI) (blue) and (A) the late endosome marker Rab7 (green), (B) the lysosome marker LAMP-1 (green), (C) the TGN marker TGN46 (green) and in (D) the secretory granule marker VAMP-8. Scale bar: A–C = 5 µm, D = 10 µm. Arrows denote areas with overlapping staining patterns of dextran and the respective organelle markers.
Figure 3
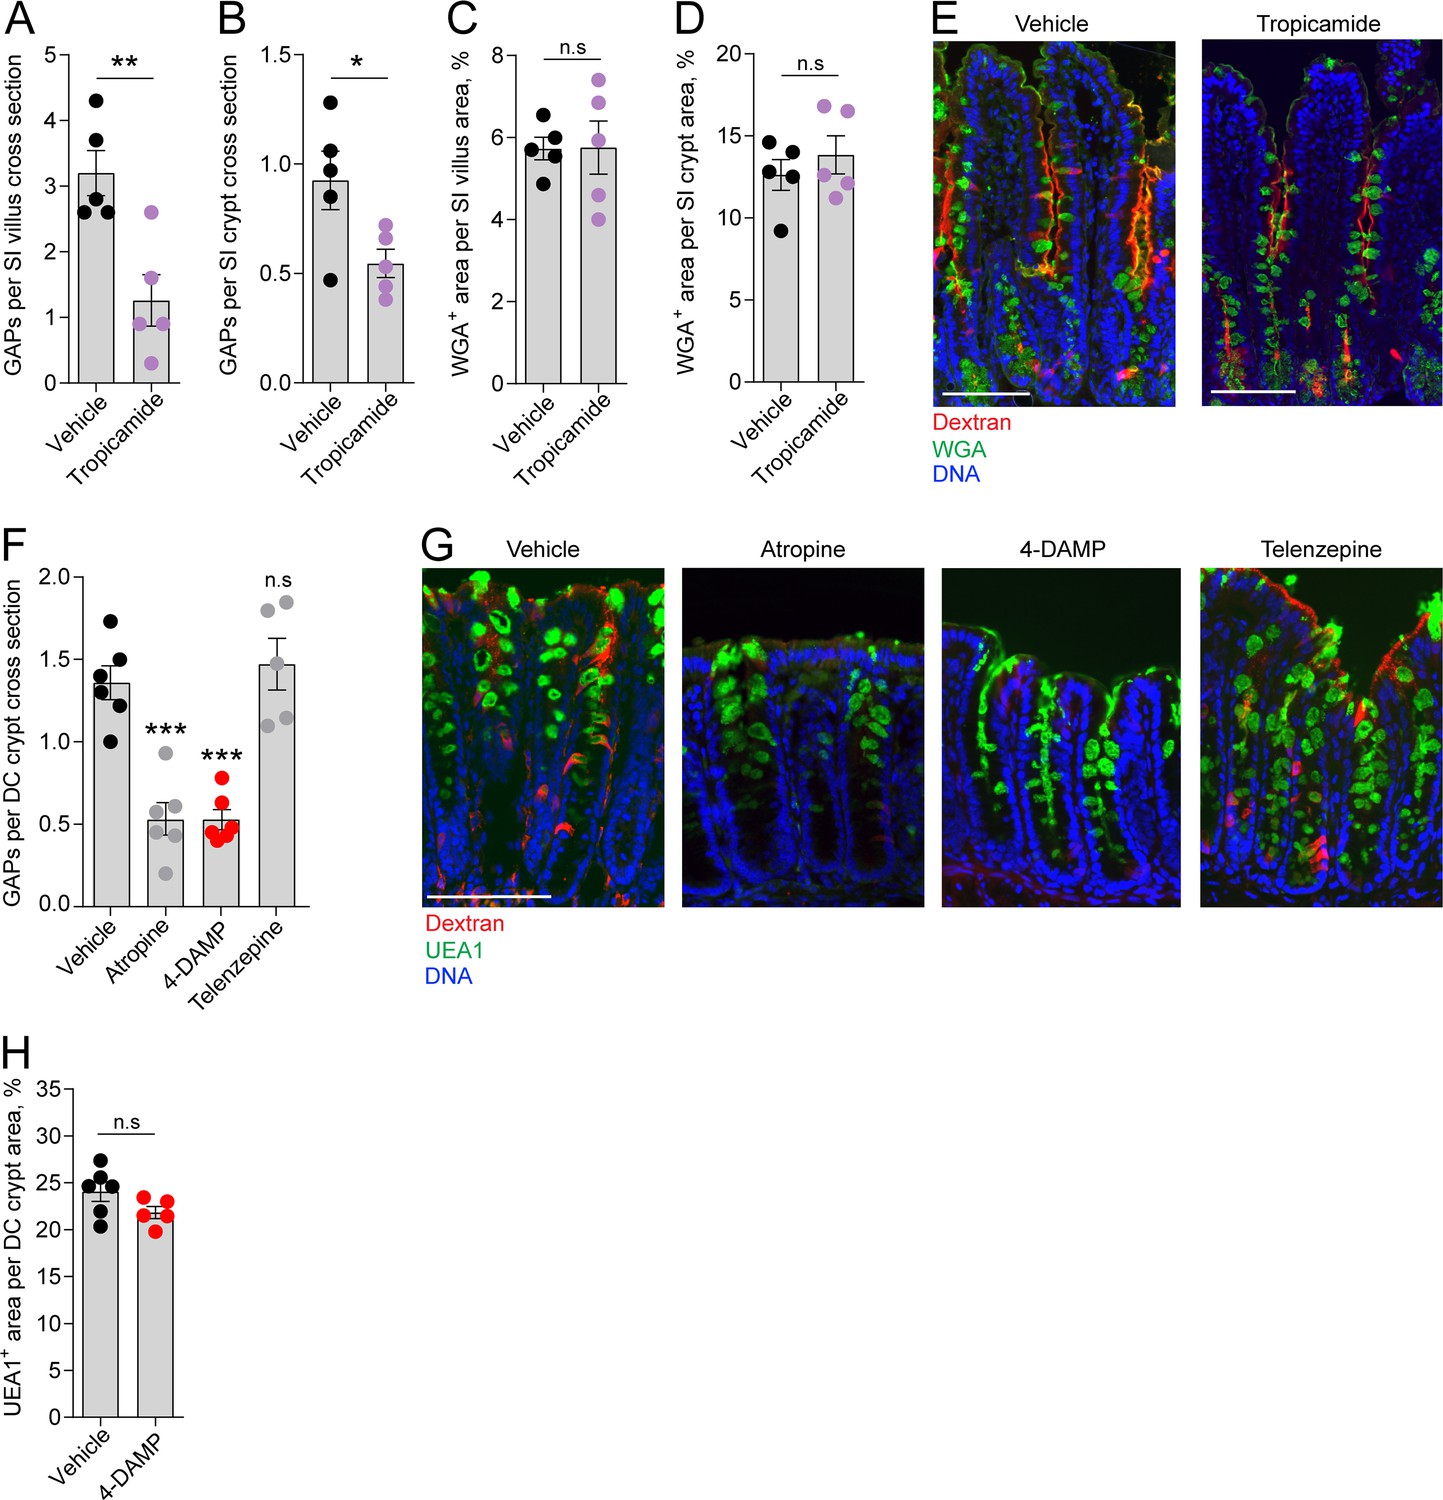
Role of muscarinic acetylcholine receptors (mAChRs) in steady-state goblet cell-associated antigen passage (GAP) formation and mucus secretion in the small intestine (SI) and distal colon.
GAP numbers per (A) SI villus and (B) SI crypt in mice treated with vehicle or the mAChR4 antagonist tropicamide. Mucus content of the (C) SI villus and (D) SI crypt quantified as percentage of wheat germ agglutinin-positive (WGA+) area per villus/crypt area in mice treated with vehicle or tropicamide. (E) Representative wide-field fluorescent image of the SI of mice treated with vehicle or tropicamide following intraluminal administration of tetramethylrodamine (TRITC)-dextran (red) and WGA staining of mucus (green). (F) GAP numbers per distal colon (DC) crypt in mice treated with vehicle, pan muscarinic receptor antagonist atropine, mAChR3 antagonist 1,1-dimethyl-4-diphenylacetoxypiperidinium iodide (4-DAMP), or mAChR1 antagonist telenzepine. (G) Representative wide-field fluorescent imaging of distal colon crypts of mice treated with vehicle, atropine, 4-DAMP, or telenzepine following intraluminal administration of TRITC-dextran (red) and Ulex europaeus agglutinin 1 (UEA1) staining of mucus. (H) Mucus content of the distal colon crypt of mice treated with vehicle or 4-DAMP, quantified as percentage of UEA1+ area per distal colon crypt area. Data are presented as mean ± SEM. *p<0.05, **p<0.01, ***p<0.001 as compared to vehicle. n.s. = non-significant as compared to vehicle. n = 5 in panels A–D, n = 6 in panel F (telenzepine n = 5). Each data point in A–D, F, H represents the average of 25 villi or 40 crypts from one mouse. Statistical analysis was performed using an unpaired two-sided Student’s t-test in panel A–D, H. A one-way ANOVA followed by Dunnet’s post hoc test was performed in panel F.
Figure 4
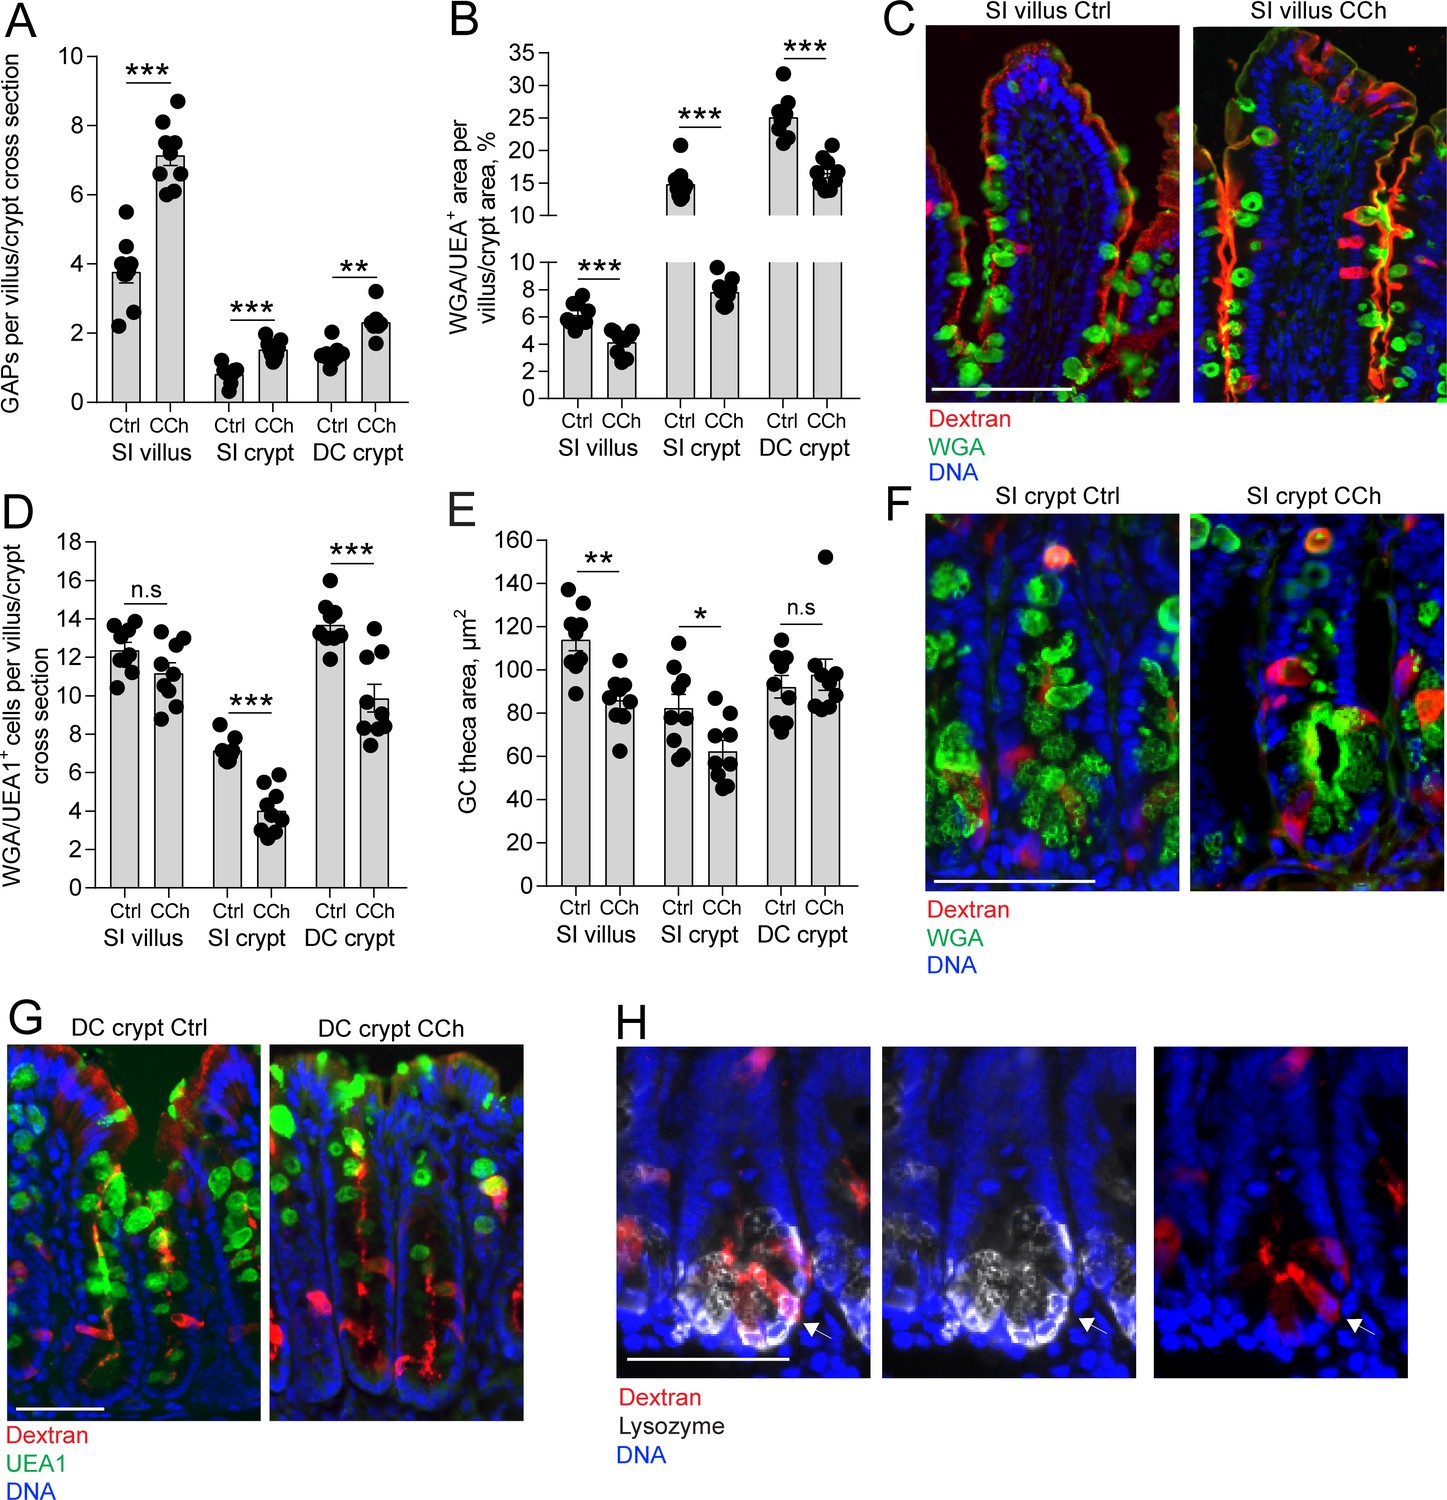
Carbamylcholine (CCh)-induced goblet cell (GC)-associated antigen passage (GAP) formation and mucus secretion in the small intestine (SI) and distal colon.
(A) GAP numbers, (B) total wheat germ agglutinin-positive (WGA+) (SI) or Ulex europaeus agglutinin 1 (UEA1+) (distal colon) mucus area per villus/crypt area, (C) representative wide-field fluorescent image of SI villus, (D) quantification of the number of WGA+ (SI) or UEA1+ (distal colon) GCs per villus or crypt cross section, (E) quantification of GC theca area, (F) representative wide-field fluorescent image of SI crypts in vehicle and CCh treated tissue. (G) Representative wide-field fluorescent image of distal colon crypts and (H) representative wide-field fluorescent image of an SI crypt following intraluminal tetramethylrodamine (TRITC)-dextran (red) administration stained for Lysozyme (white). Arrows denote a Paneth cell containing TRITC-dextran. Scale bar: (C) 100 µm, (F, J, K) 50 µm. Data are presented as mean ± SEM, *p < 0.05, **p < 0.01, ***p < 0.001, n.s = non-significant, n = 9 in all groups. Statistical analysis was performed using an unpaired two-sided Student’s t-test. Each data point in A–B, D–E represents the average of 25 villi or 40 crypts from one mouse.
Figure 5 with 2 supplements
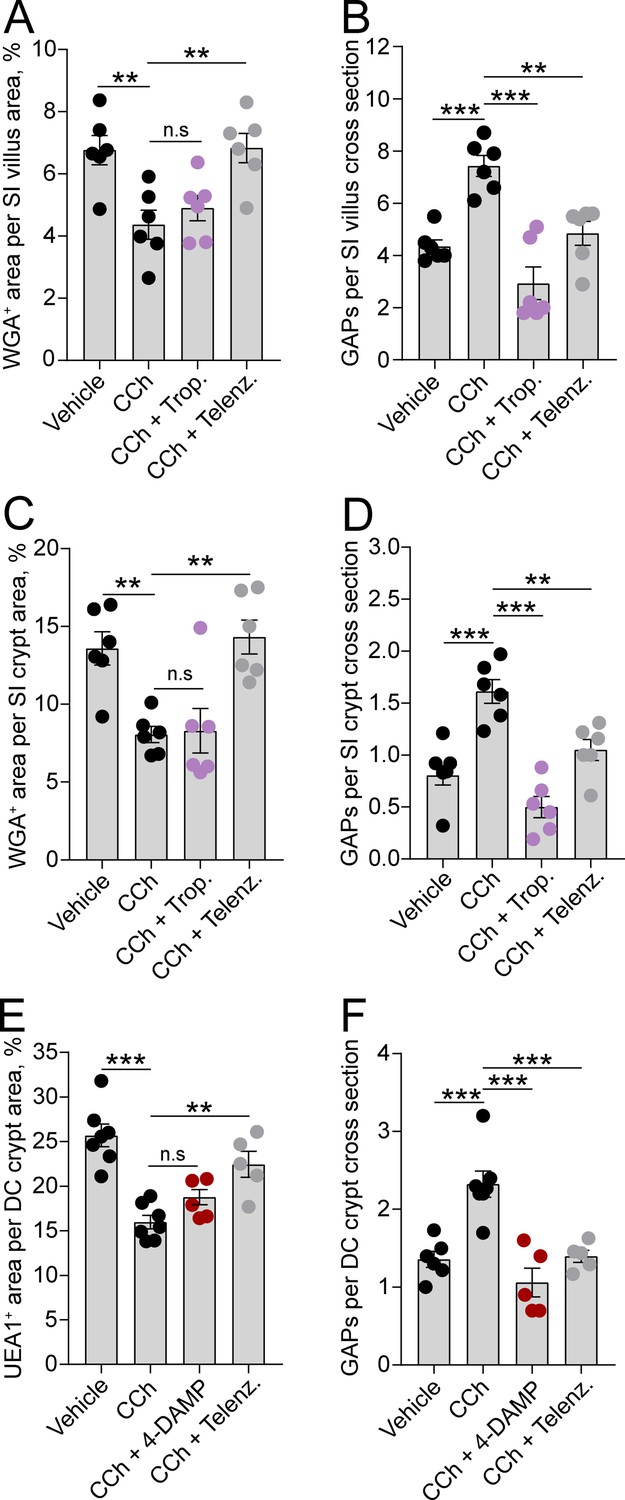
Carbamylcholine (CCh)-induced goblet cell-associated antigen passage (GAP) formation and mucus secretion use different muscarinic acetylcholine (ACh) receptors.
Effect of the muscarinic ACh receptor 4 (mAChR4) antagonist tropicamide (Trop.), the mAChR1 antagonist telenzepine (Telenz.), or the preferential mAChR3 antagonist 1,1-dimethyl-4-diphenylacetoxypiperidinium iodide (4-DAMP) on CCh-induced mucus secretion and GAP formation in the small intestine (SI) villus (A–B), the SI crypt (C–D), and the distal colon crypt (E–F). Data are presented as mean ± SEM. **p < 0.01, ***p < 0.001, n.s = non-significant, as compared to CCh. A–B, D–E, n = 6 in all groups. (C and F) Vehicle and CCh n = 7, CCh + 4 DAMP and CCh + Telenz. n = 5. Statistical analysis was performed using a one-way ANOVA followed by Dunnet’s post hoc test. Each data point represents the average of 25 villi or 40 crypts from one mouse.
Figure 5—figure supplement 1
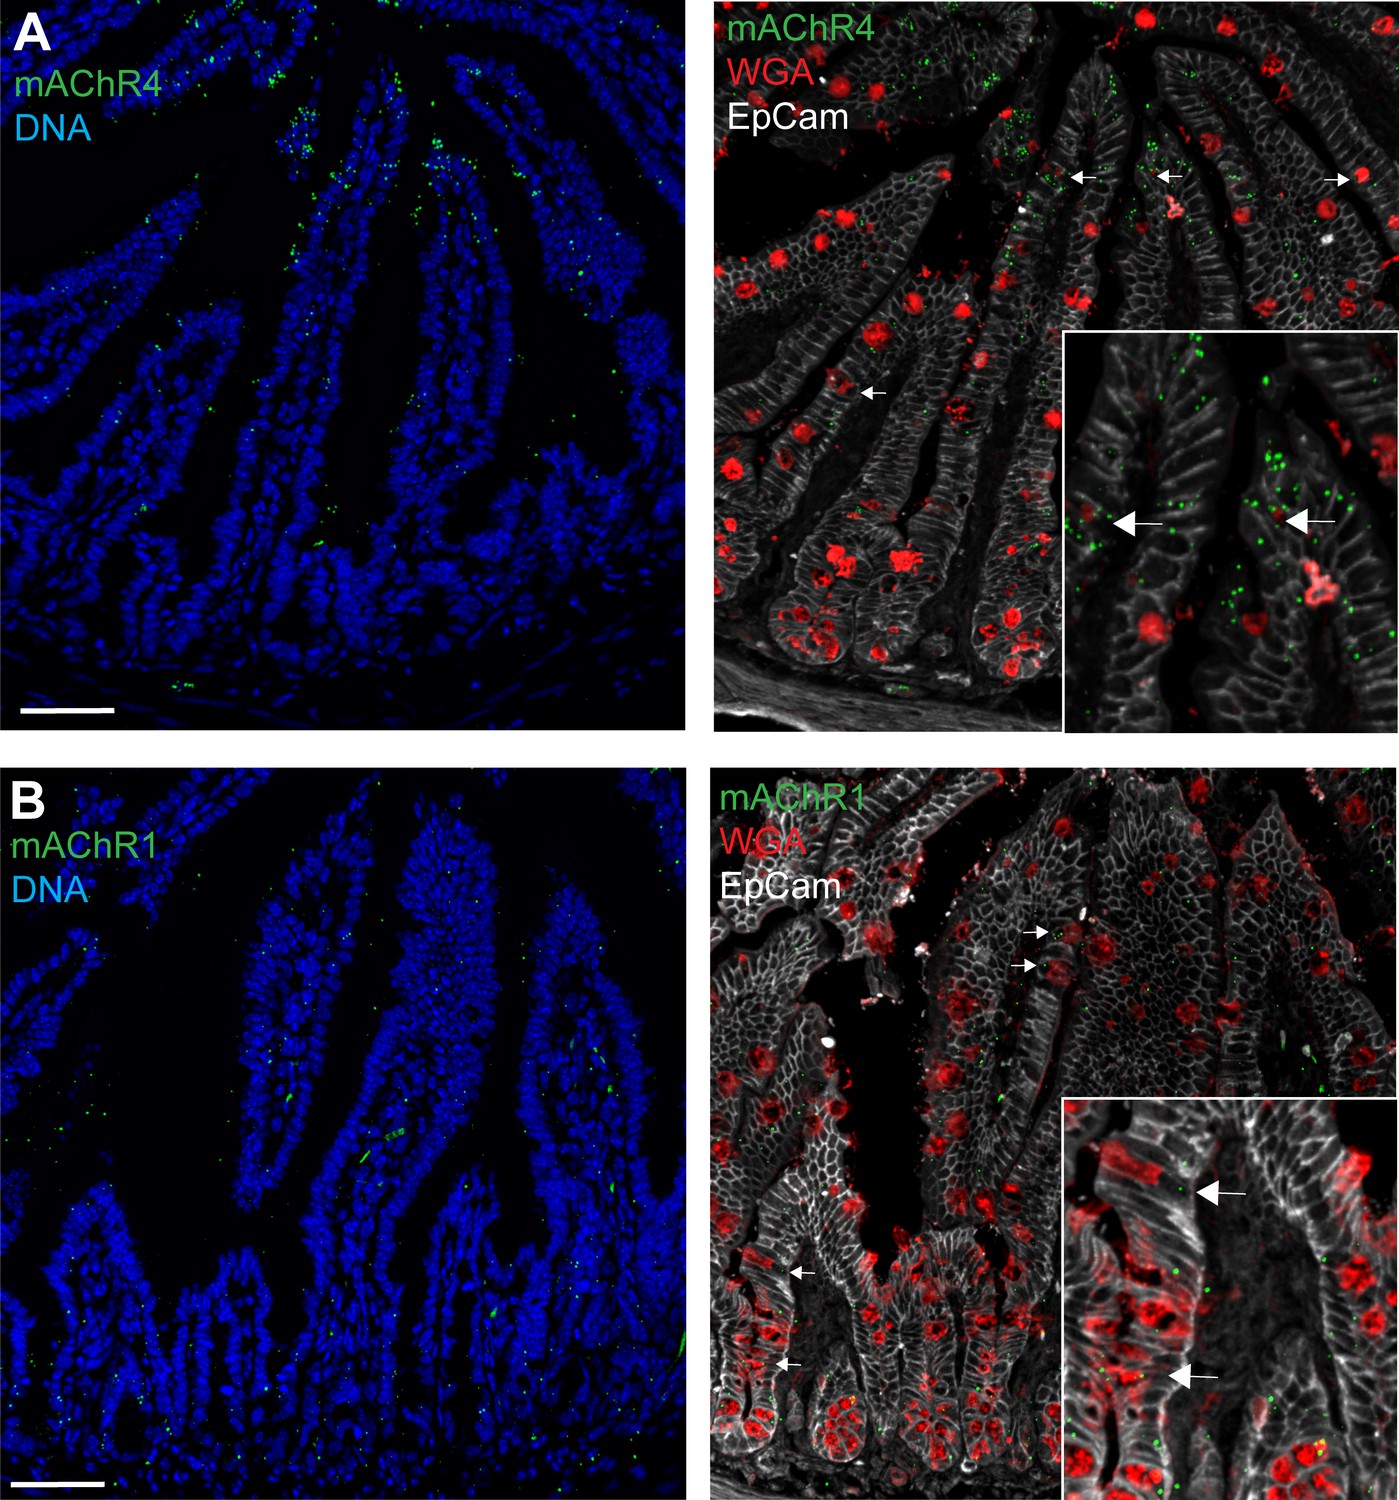
Small intestine expression of muscarinic ACh receptor 4 (mAChR4) and mAchR1.
Confocal fluorescent imaging of (A) mAChR4 and (B) mAChR1 expression in the small intestine using RNAscope. Arrows denote goblet cells staining positive for the mAChR1/4 probes. Scale bar 50 µm. n = 5.
Figure 5—figure supplement 2

Distal colon expression of muscarinic ACh receptor 3 (mAChR3) and mAChR1.
Confocal fluorescent imaging of (A) mAChR3 and (B) mAChR1 expression in the distal colon using RNAscope. Arrows denote goblet cells staining positive for the mAChR1/3 probes. Scale bar 50 µm. n = 5.
Figure 6 with 1 supplement
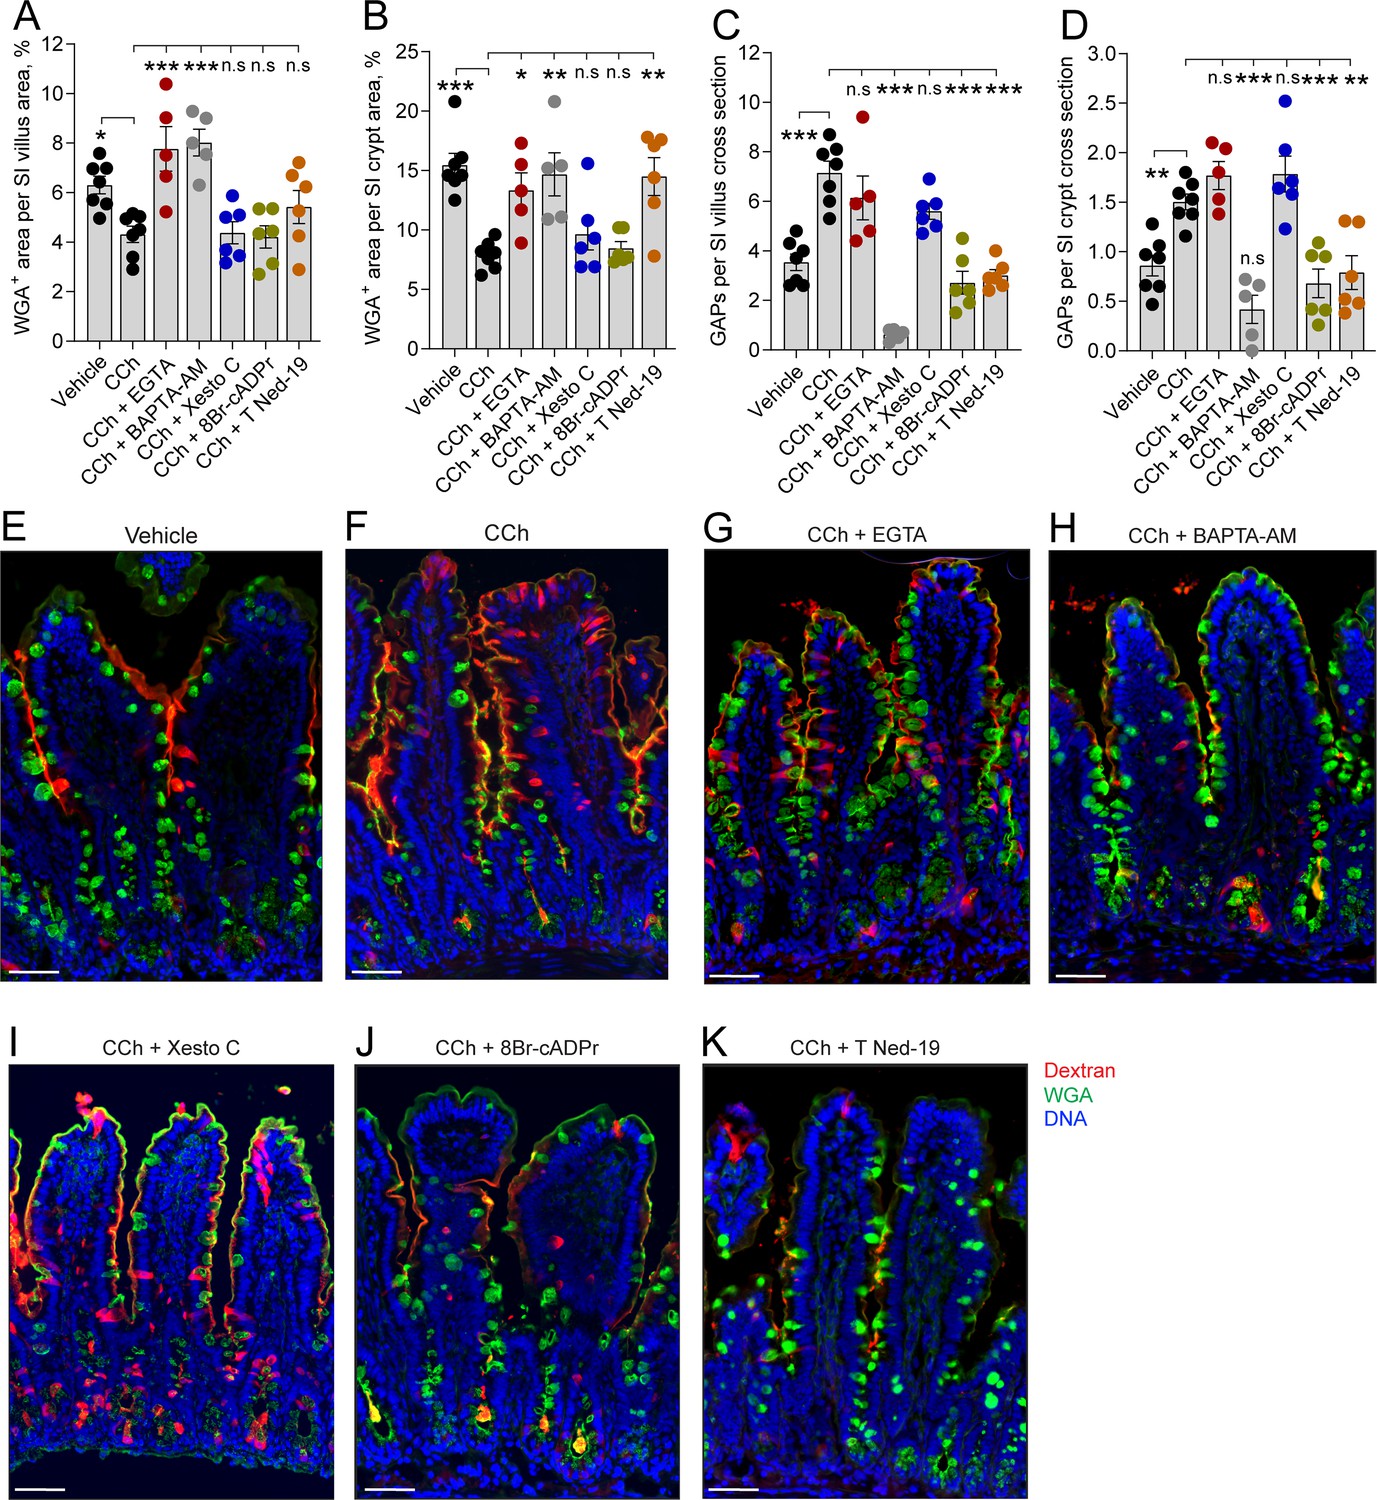
In the small intestine (SI), carbamylcholine (CCh)-induced goblet cell-associated antigen passage (GAP) formation and mucus secretion use different calcium pools and signaling pathways.
Effect of the extracellular Ca2+ chelator EGTA, intracellular Ca2+ chelator BAPTA-AM, IP3R inhibitor Xestospongin C (Xesto C), cADPr inhibitor 8-Br-cADPr, and NAADP inhibitor Trans-Ned-19 (T Ned-19) on CCh-induced mucus secretion in (A) the SI villus, (B) the SI crypt. Effect of Ca2+ signaling inhibitors on CCh-induced GAP formation in (C) the SI villus, (D) the SI crypt. (E–K) Representative images of the effect of the respective treatments on CCh-induced mucus secretion and GAP formation. Scale bar: E–K = 50 µm. Data are presented as mean ± SEM. *p < 0.05, **p < 0.01, ***p < 0.001, n.s = non-significant as compared to CCh. Vehicle and CCh, n = 7, EGTA and BAPTA-AM n = 5, Xesto C, T-Ned-19, and 8-Br-cADPr n = 6. Statistical analysis was performed using a one-way ANOVA followed by Dunnet’s post hoc test. Each data point in (A–D) represents the average of 25 villi or 40 crypts from one mouse.
Figure 6—figure supplement 1

Endoplasmatic reticulum (ER) staining in intestinal goblet cell-associated antigen passage (GAPs).
Confocal fluorescent imaging of intestinal tissues following intraluminal injection of tetramethylrodamine (TRITC)-dextran (red) stained with the ER marker calnexin (green). Scale bar 5 µm.
Figure 7
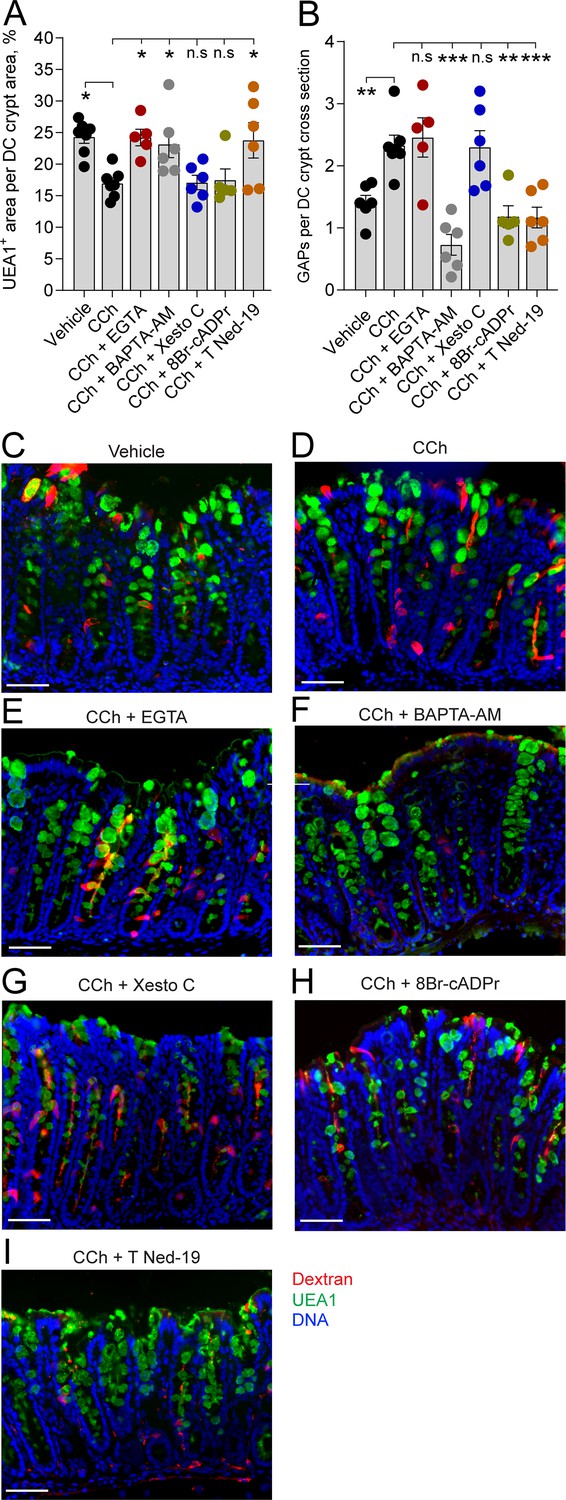
In the distal colon, carbamylcholine (CCh)-induced goblet cell-associated antigen passage (GAP) formation and mucus secretion use different calcium pools and signaling pathways.
Effect of the extracellular Ca2+ chelator EGTA, intracellular Ca2+ chelator BAPTA-AM, IP3R inhibitor Xestospongin C (Xesto C), cADPr inhibitor 8-Br-cADPr, and NAADP inhibitor Trans-Ned-19 (T Ned-19) on (A) CCh-induced mucus secretion and (B) GAP formation in the distal colon. (C–I) Representative images of the effect of the respective treatments on CCh-induced mucus secretion and GAP formation. Data are presented as mean ± SEM. *p < 0.05, **p < 0.01, ***p < 0.001, n.s = non-significant as compared to CCh. Vehicle and CCh, n = 7, EGTA and 8-Br-cADPr n = 5, BAPTA-AM, Xesto C, and T-Ned-19 n = 6. Scale bar: C–I = 50 µm Statistical analysis was performed using a one-way ANOVA followed by Dunnet’s post hoc test. Each data point in (A–B) represents the average of 40 crypts from one mouse.
Figure 8
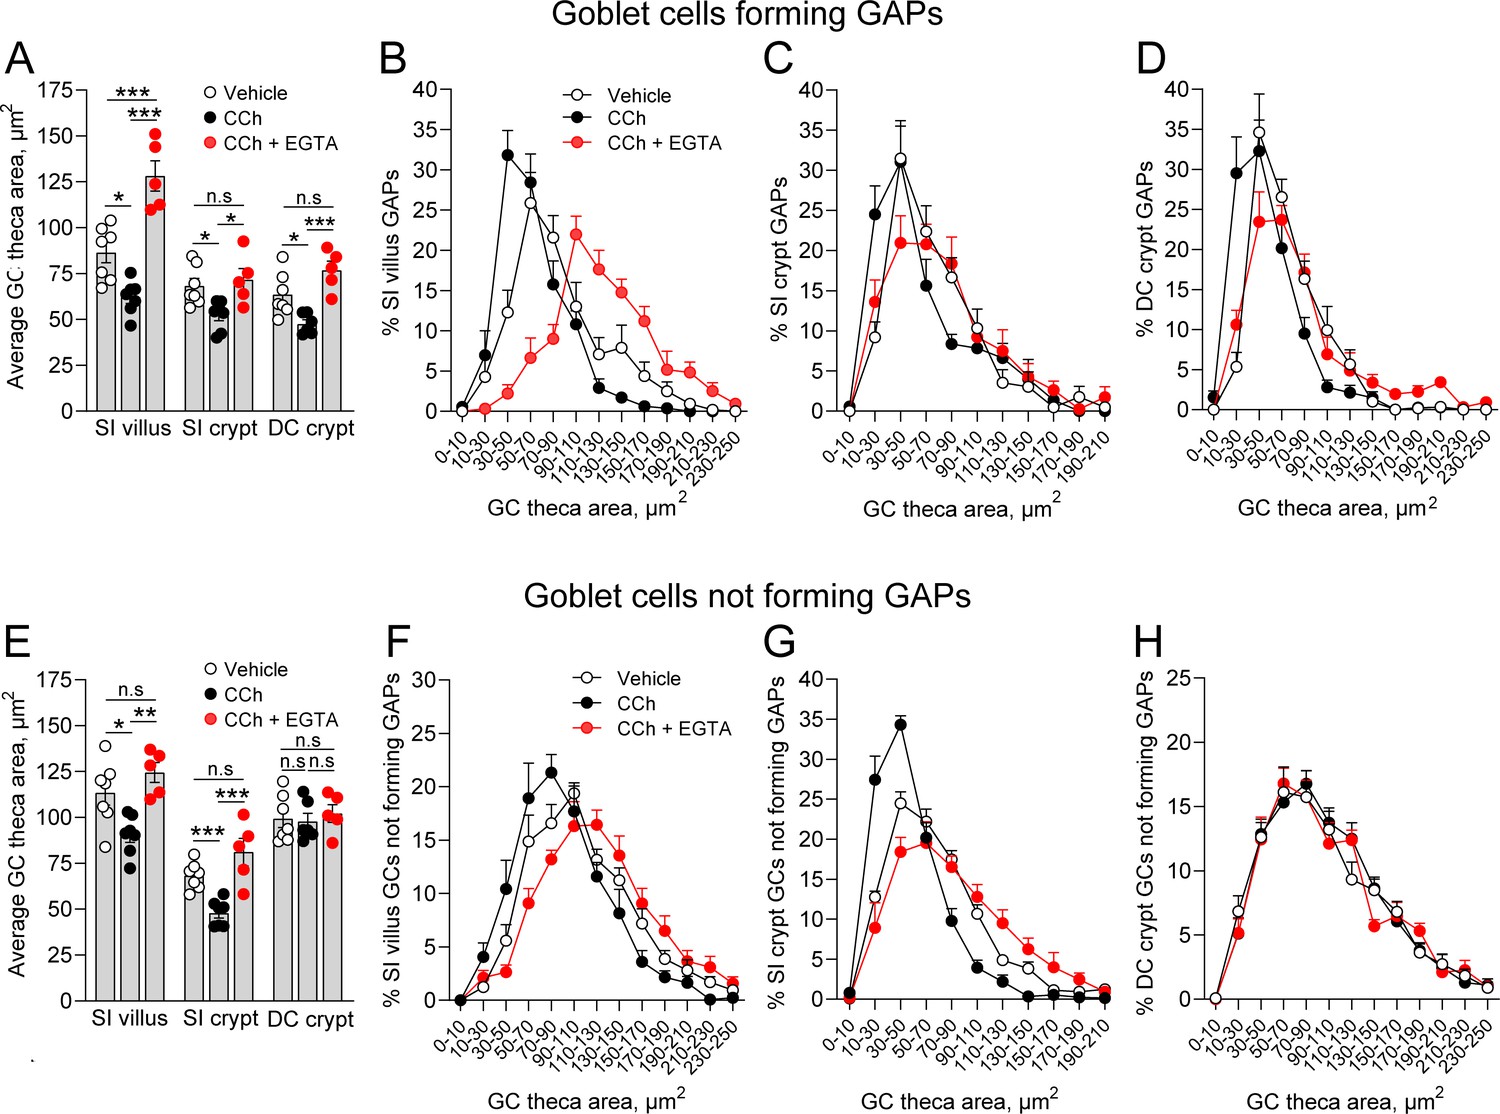
Carbamylcholine (CCh) induced mucus secretion and goblet cell (GC)-associated antigen passage (GAP) formation can occur in parallel within the same GC.
(A) Average theca area of GCs forming GAPs in vehicle, CCh, and CCh + EGTA treated mice. Size distribution of the theca area of GCs forming GAPs in vehicle, CCh, and CCh + EGTA treated mice in (B) small intestine (SI) villus, (C) SI crypt, and (D) DC crypt. (E) Average theca area of GCs not forming GAPs in vehicle, CCh, and CCh + EGTA treated mice. Size distribution of GCs not forming GAPs in vehicle, CCh, and CCh + EGTA treated mice in (F) SI villus, (G) SI crypt, and (H) DC crypt. Data are presented as mean ± SEM. Vehicle n = 7, CCh n = 7, CCh + EGTA n = 5. Statistical analysis was performed using a one-way ANOVA with Tukey’s post hoc test for multiple comparisons. In panels B–D and F–H, the data represent the percentage of GCs within the respective area bins as part of the total population of GCs forming GAPs, or the total population of GCs not forming GAPs (100%).
-
Figure 8—source data 1
Tables of raw data for Figure 8B–D and F–H.
- https://cdn.elifesciences.org/articles/67292/elife-67292-fig8-data1-v2.xlsx
Figure 9
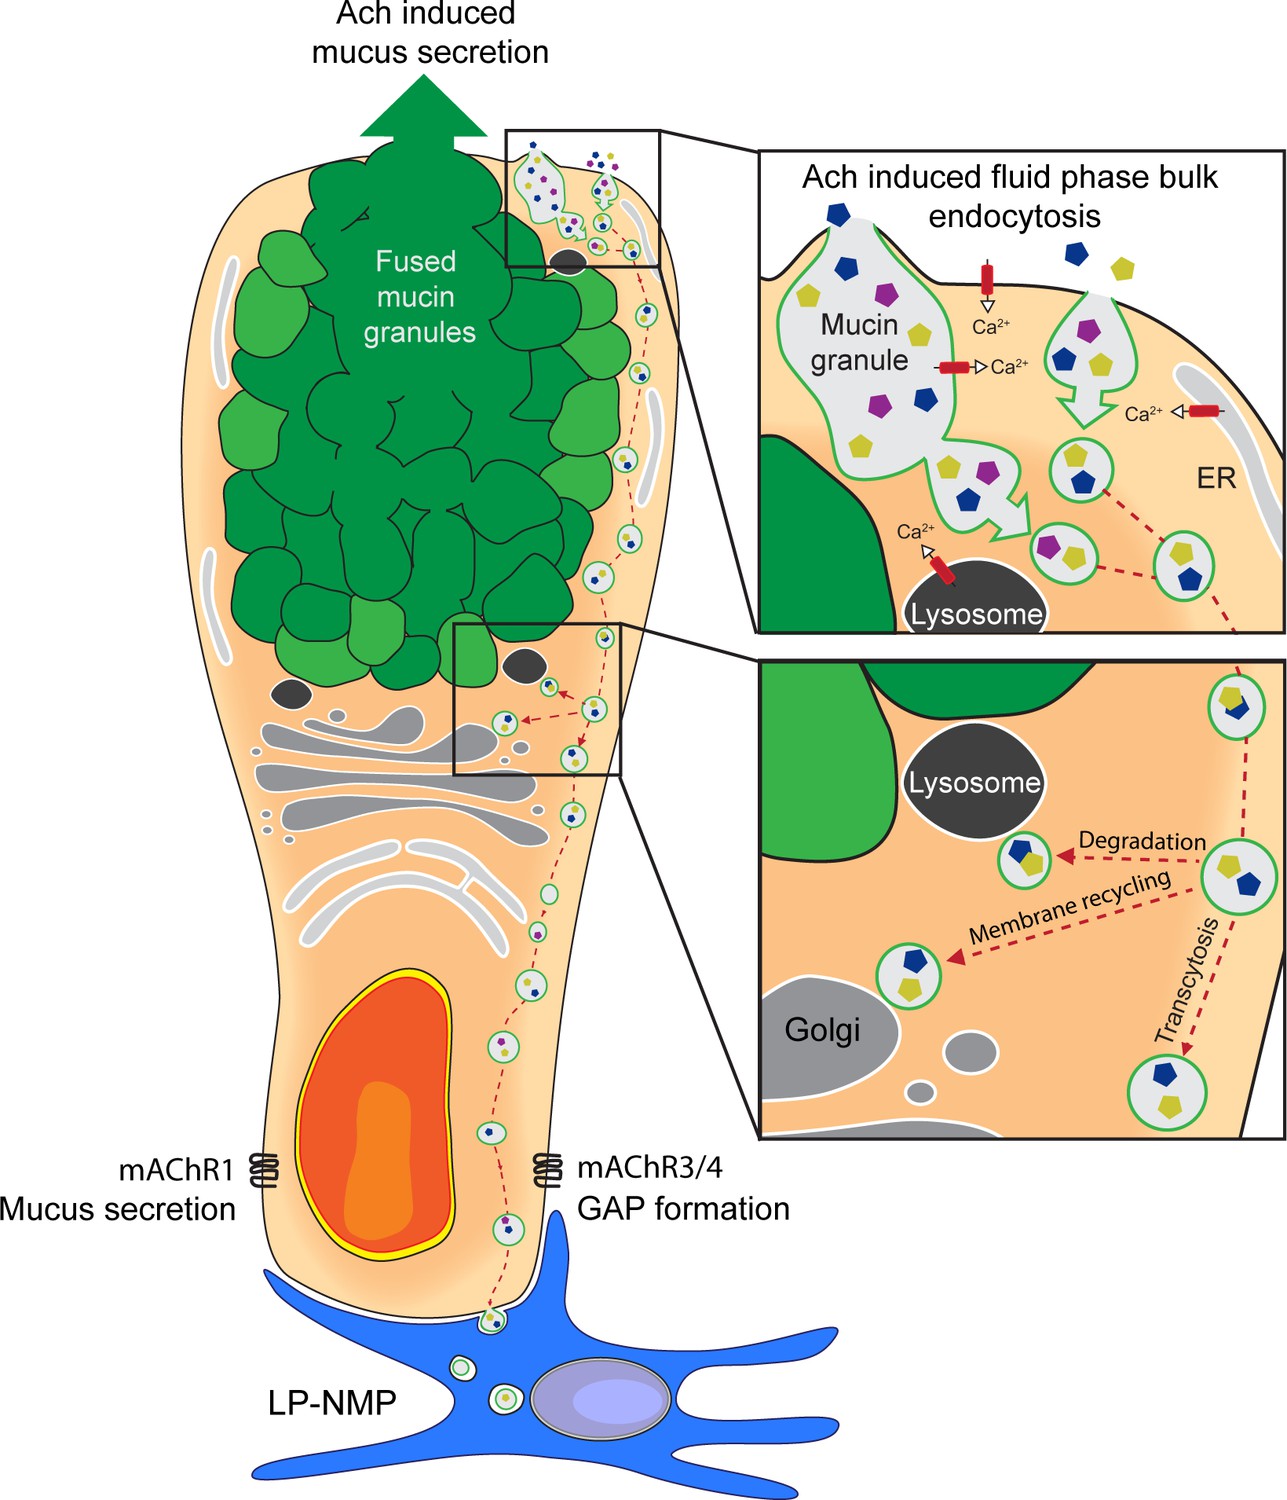
Schematic representation of acetylcholine (ACh)-induced mucus secretion and goblet cell-associated antigen passage (GAP) formation in intestinal goblet cells.
In response to exogenous ACh, intestinal goblet cells respond with an accelerated mucus secretory response mediated by muscarinic ACh receptor 1 (mAChR1), and/or induction of fluid-phase bulk endocytosis of secretory granule membrane (GAP formation) mediated by mAChR4 in the small intestine (SI) and mAChR3 in the distal colon. The endocytic vesicles containing luminal fluid-phase cargo are shuttled through the cell for degradation, membrane recycling, and transcytosis to be acquired by lamina proporia mononuclear phagocytes (LP-MNPs). Using separate mAChRs, Ca2+ pools and signaling pathways for the processes of ACh-induced GAP formation and ACh-induced mucus secretion allow these processes to occur independently or in parallel within the same goblet cell forming the basis of how goblet cells can differentially regulate when to maintain the mucus barrier and when to deliver luminal substances to the immune system.
Videos
Video 1
Animation of the 3D model of the focused ion beam scanning electron microscopy (FIB-SEM) data.
Green: Mucin granules, light blue: nucleus, red: dextran in vesicular and endosomal structures, dark blue: dextran in lysosomes and multi-vesicular bodies (MVBs) and purple: dextran in the trans-Golgi network (TGN).
Video 2
Animation of the focused ion beam scanning electron microscopy (FIB-SEM) pictures and the corresponding segmentation that the model is based on.
Upper left panel: FIB-SEM pictures, upper right panel: segmentation of the nucleus (blue), mucin granuels (green), dextran in endosomes/vesicles (red), dextran in MVBs and lysosomes (orange). Lower left panel: segmentation of dextran in the trans-Golgi network (TGN) (blue).
Tables
Key resources table
| Reagent type (species) or resource | Designation | Source or reference | Identifiers | Additional information |
|---|---|---|---|---|
| Antibody | EEA1 (rabbit monoclonal) | Cell Signaling Technology | Cat#3288 S, RRID:AB_2096811 | IF (1:100) |
| Antibody | Lysozyme (rabbit polyclonal) | Thermo Fisher Scientific | Cat#PA5-16668, RRID:AB_10984852 | IF (1:100) |
| Antibody | Rab3D (rabbit polyclonal) | Synaptic systems | Cat#107 303, RRID:AB_2253547 | IF (1:100) |
| Antibody | Rab7 (rabbit monoclonal) | Cell Signaling Technology | Cat#9367T, RRID:AB_1904103 | IF (1:100) |
| Antibody | LAMP-1 (rabbit polyclonal) | Abcam | Cat#ab62562RRID:AB_2134489 | IF (1:100) |
| Antibody | TGN46 (rabbit monoclonal) | Thermo Fisher | Cat#MA5-32532RRID:AB_2809809 | IF (1:100) |
| Antibody | VAMP8 (chicken polyclonal) | University of Texas | Prof Burton Dickey | IF (1:500) |
| Antibody | Calnexin (rabbit polyclonal) | Abcam | Cat#ab22595RRID:AB_2069006 | IF (1:100) |
| Antibody | Goat anti-Chicken IgY Alexa Fluor 555(goat polyclonal) | Thermo Fisher Scientific | Cat#A32932RRID:AB_2762844 | IF (1:1000) |
| Antibody | Goat anti-Rabbit IgG Alexa Fluor 488 (goat polyclonal) | Thermo Fisher Scientific | Cat#A-11008, RRID:AB_143165 | IF (1:1000) |
| Antibody | Goat anti-Rabbit IgG Alexa Fluor 647 (goat polyclonal) | Thermo Fisher Scientific | Cat#A-21244RRID:AB_2535812 | IF (1:1000) |
| Chemical compound, drug | Atropine | Sigma-Aldrich | Cat#A0257 | 550 µg/kg i.p. |
| Chemical compound, drug | Telenzepine | Sigma-Aldrich | Cat#T122 | 550 µg/kg i.p. |
| Chemical compound, drug | 4-DAMP | Sigma-Aldrich | Cat#SML0255 | 550 µg/kg i.p. |
| Chemical compound, drug | Tropicamide | Tocris | Cat#0909 | 100 µg/kg s.c. |
| Chemical compound, drug | Carbamylcholine | Sigma-Aldrich | Cat#C4382 | 125 µg/kg s.c. |
| Chemical compound, drug | FM 1–43FX | Thermo Fisher Scientific | Cat#F35355 | 50 µg/ml |
| Chemical compound, drug | EGTA | Sigma-Aldrich | Cat#E3889 | 2 mM |
| Chemical compound, drug | BAPTA-AM | Sigma-Aldrich | Cat#A1076 | 200 µM |
| Chemical compound, drug | Xestospongin C | Sigma-Aldrich | Cat#X2628 | 22 µM |
| Chemical compound, drug | Dynasore | Sigma-Aldrich | Cat#D7693 | 150 µM |
| Chemical compound, drug | Dyngo 4a | Selleck Chemicals | Cat#S7163 | 120 µM |
| Chemical compound, drug | Colchicine | Tocris | Cat#1364 | 100 µM |
| Chemical compound, drug | Cytochalasin D | Tocris | Cat#1233 | 4 µM |
| Chemical compound, drug | Ciliobrevin D | Sigma-Aldrich | Cat#250401 | 100 µM |
| Chemical compound, drug | Dimethylenastron (DMEA) | Tocris | Cat#5261 | 10 µM |
| Chemical compound, drug | 8-Br-cADPr | Sigma-Aldrich | Cat#B5416 | 0.2 mg/kg i.p. |
| Chemical compound, drug | Trans-Ned19 | Tocris | Cat#3954 | 5 mg/kg i.p |
| Chemical compound, drug | LY294002 | Sigma-Aldrich | Cat#L9908 | 4 mg/kg i.p |
| Chemical compound, drug | Diamidino-2-phenylindole (DAPI) | Sigma-Aldrich | Cat#D9542 | 1 µg/ml |
| Chemical compound, drug | UEA1 Fluorescein | Vector Laboratories | Cat#FL-1061–2 | 10 µg/ml |
| Chemical compound, drug | WGA Fluorescein | Vector Laboratories | Cat#FL-1021 | 10 µg/ml |
| Chemical compound, drug | WGA Texas Red | Sigma-Aldrich | Cat#W21405 | 10 µg/ml |
| Chemical compound, drug | Dextran tetramethylrodamine conjugate, lysine fixable, MW 10,000 | Thermo Fisher Scientific | Cat#D1817 | 12.5 mg/ml |
| Chemical compound, drug | Dextran biotin conjugate, lysine fixable, MW 10,000 | Thermo Fisher Scientific | Cat#D1956 | 12.5 mg/ml |
| Chemical compound, drug | Dextran Alexa 647 conjugate lysine fixable, MW 10,000 | Thermo Fisher Scientific | Cat#D22914 | 12.5 mg/ml |
| Chemical compound, drug | Ovalbumin Texas Red conjugate | Thermo Fisher Scientific | Cat#O23021 | 12.5 mg/ml |
| Chemical compound, drug | Ni DAB | Vector Laboratories | Cat#SK-4100, RRID:AB_2336382 | |
| Commercial assay or kit | ABC Elite kit | Vector Laboratories | Cat#PK-6100, RRID:AB_2336819 | |
| Commercial assay or kit | RNAscope fluorescent reagent kit v2 | ACD, Bio-Techne | Cat# 323100 | |
| Sequence-based reagent | Mm-Chrm1-O1-C2 | ACD, Bio-Techne | Cat#483441-C2 | |
| Sequence-based reagent | Mm-Chrm3 | ACD, Bio-Techne | Cat#437701 | |
| Sequence-based reagent | Mm-Chrm4-C2Chrm4 | ACD, Bio-Techne | Cat#410581-C2 | |
| Species, species background (Mus musculus) | Mouse: C57 Bl/6 J | Jackson Laboratories | Stock No: 000664, RRID:IMSR_JAX:000664 | |
| Species, species background (Mus musculus) | Mouse: Itgax YFP | Jackson Laboratories | Stock No: 008829RRID: IMSR_JAX:008829 | |
| Species, species background (Mus musculus) | Mouse: Cx3cr1 GFP | Jackson Laboratories | Stock No: 005582RRID: IMSR_JAX:005582 | |
| Software, algorithm | GraphPad Prism 7 | GraphPad | https://www.graphpad.com, RRID:SCR_002798 | |
| Software, algorithm | Amira | Thermofisher | http://www.fei.com/software/amira-3d-for-life-sciences/, RRID:SCR_007353 | |
| Software, algorithm | Zen | Zeiss | http://www.zeiss.com/microscopy/en_us/products/microscope-software/zen.html#introduction, RRID:SCR_013672 | |
| Software, algorithm | Fiji | Schindelin et al., 2012 | https://fiji.sc/, RRID:SCR_002285 | |
| Software, algorithm | AxioVision | Zeiss | http://www.zeiss.com/microscopy/en_de/products/microscope-software/axiovision-for-biology.html, RRID:SCR_002677 | |
| Software, algorithm | Imaris | Bitplane | http://www.bitplane.com/imaris/imaris RRID:SCR_007370 | |
| Software, algorithm | ImageWarp | A&B Software | http://www.imagewarp.com/ |
Additional files
Download links
A two-part list of links to download the article, or parts of the article, in various formats.
Downloads (link to download the article as PDF)
Open citations (links to open the citations from this article in various online reference manager services)
Cite this article (links to download the citations from this article in formats compatible with various reference manager tools)
Intestinal goblet cells sample and deliver lumenal antigens by regulated endocytic uptake and transcytosis
eLife 10:e67292.
https://doi.org/10.7554/eLife.67292


