YAP and TAZ are transcriptional co-activators of AP-1 proteins and STAT3 during breast cellular transformation
- Department of Biological Chemistry and Molecular Pharmacology, Harvard Medical School, United States
- Program in Bioinformatics and Integrative Biology, University of Massachusetts Medical School, United States
- Genetics Laboratory, Shenzhen Longgang District Maternity and Child Healthcare Hospital, China
Figures
Figure 1

YAP and TAZ facilitate transformation.
(A) Western blot for YAP, TAZ, and actin levels in the indicated CRISPR-mediated knockout (KO) strains and the parental cell line (CTRL). (B) Relative growth in low attachment conditions of the indicated cell lines in non-transformed (ETH; ethanol) and transformed conditions (TAM; tamoxifen). Measurements are relative to transformed cells with the CRISPR control, which is defined as 1.0. (C) Relative growth in soft agar in the indicated cell lines. (D) Relative growth of the indicated cell lines in standard high attachment conditions. (E) Relative growth in low attachment conditions, (F) YAP and TAZ protein levels, and (G) relative growth in high attachment conditions of cells subjected to siRNA-mediated knockdown of YAP and/or TAZ (YAPi and/or TAZi) of cells induced by TAM addition for the indicated times. Error bars indicate ± SD of 3 replicates.
Figure 2 with 1 supplement
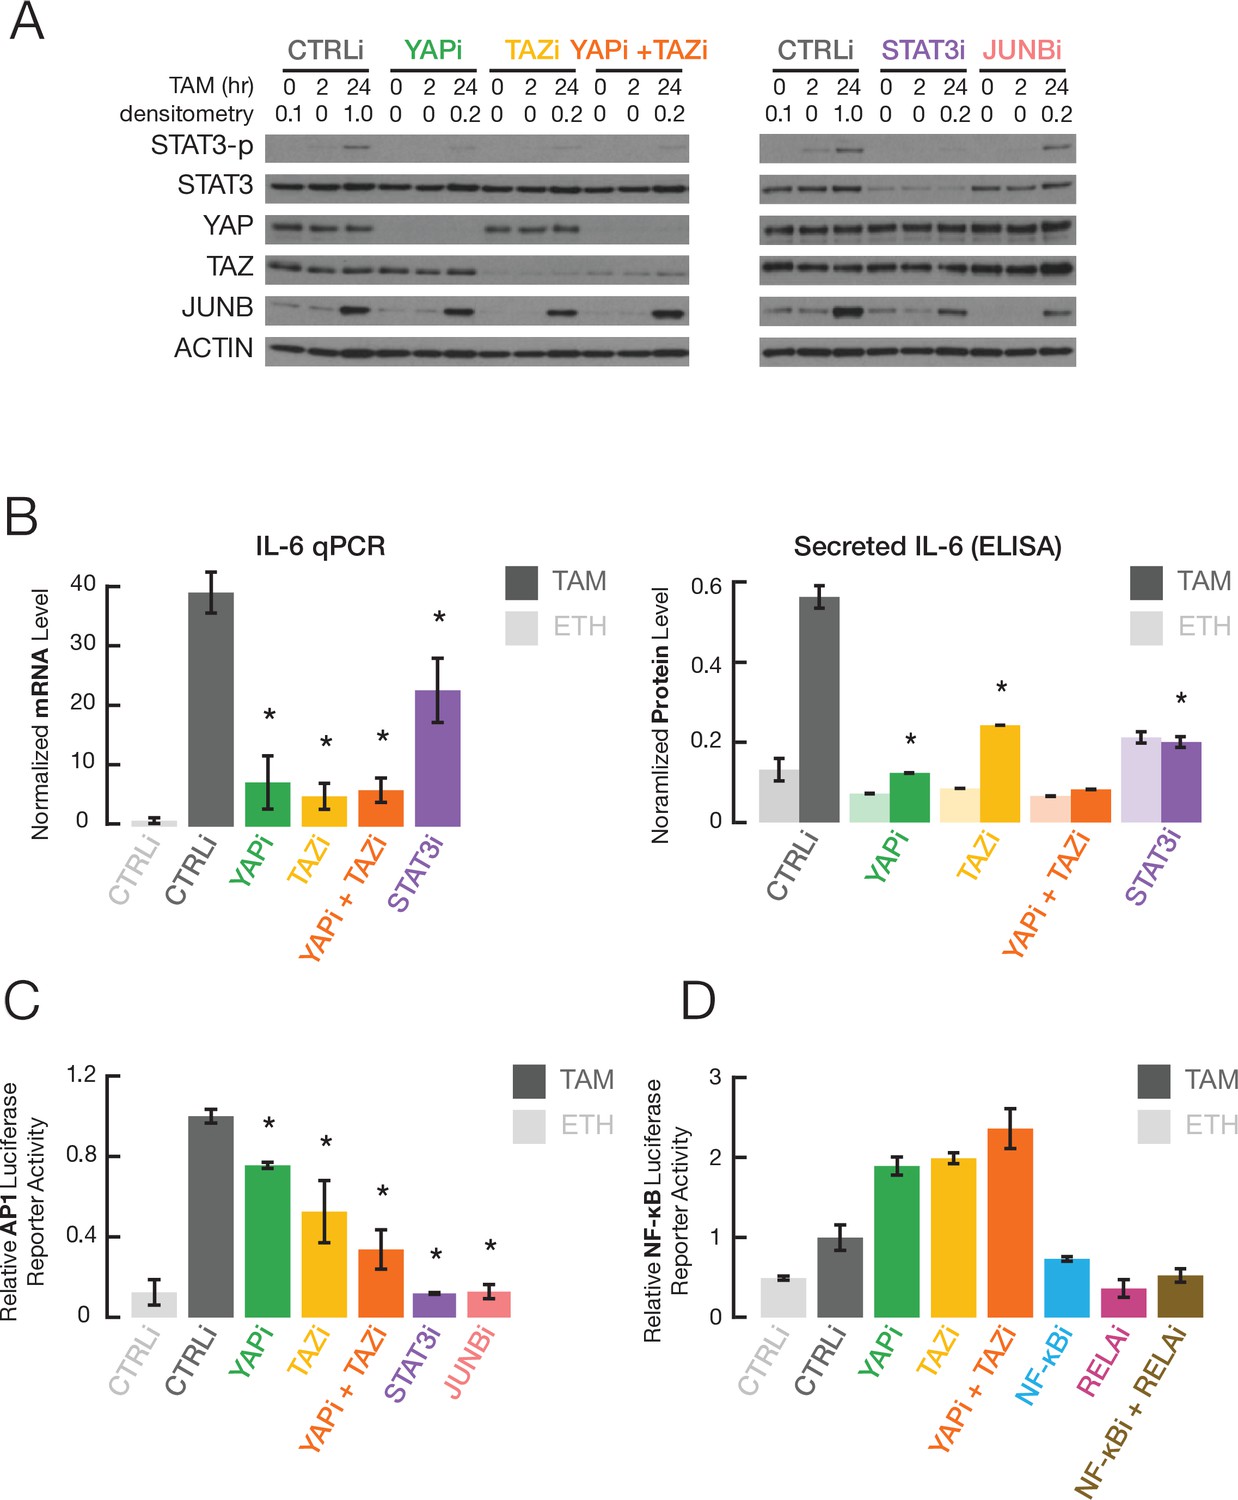
YAP and TAZ regulate STAT3 and JUNB activities during transformation.
(A) Western blot for the indicated proteins (STAT3-p, a form phosphorylated at Tyr705) in cells treated with the indicated siRNAs for 24 hr and then with TAM for the indicated times. (B) Normalized IL-6 mRNA (left) and secreted IL-6 (right) levels in the indicated cells and conditions. (C) Relative AP-1-dependent transcriptional activity in the indicated cells and conditions. (D) Relative NF-κB-dependent transcriptional activity. Error bars indicate ± SD of 3 replicates.
Figure 2—figure supplement 1

Gene expression in siRNA knockdowns.
RNA levels of YAP, TAZ, STAT3, and NF-κB1 in non-transformed (ETH) or transformed (TAM) cells knocked down by siRNA (i) of the indicated factors.
Figure 3 with 1 supplement
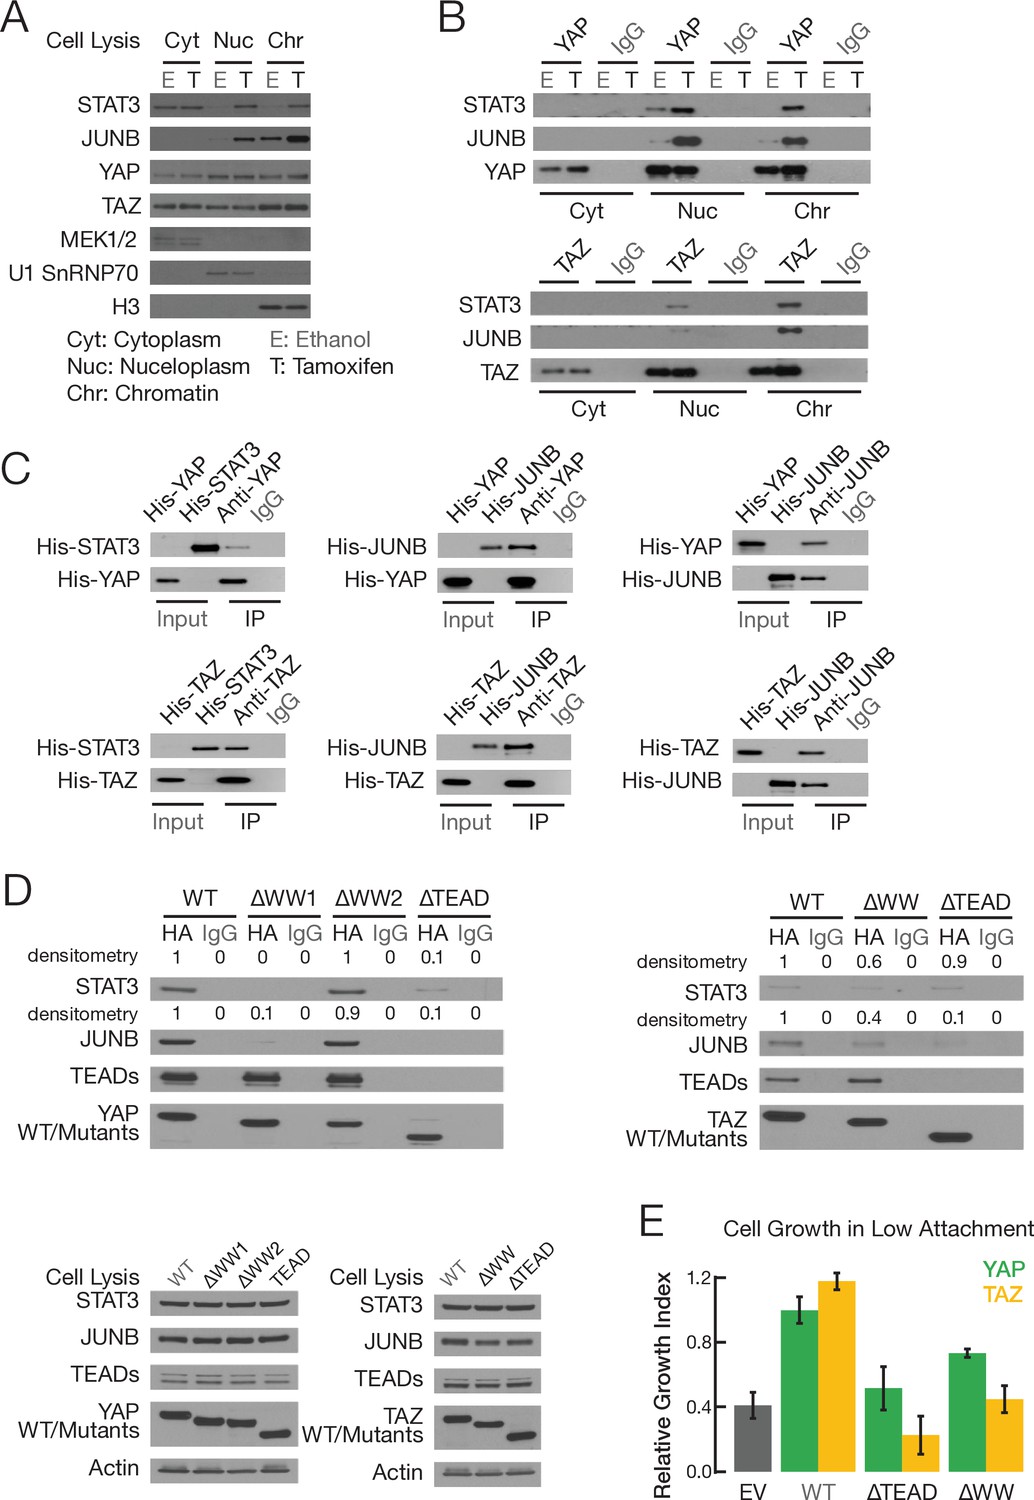
YAP and TAZ, via WW domains, directly interact with STAT3 and JUNB.
(A) Levels of the indicated proteins in the indicated fractions in non-transformed (E; ethanol) and transformed (T; tamoxifen) conditions: MEK1/2, cytoplasm marker; U1 SnRNAP70, nucleoplasm marker; H3, chromatin marker. (B) Co-immunoprecipitation of endogenous proteins in cellular fractions from non-transformed and transformed cells. Western blot of the indicated proteins upon immunoprecipitation (IP) with antibodies against the indicated proteins or the IgG control. (C) Co-immunoprecipitation with Escherichia coli-generated His-tagged recombinant proteins. Western blot of the input and immunoprecipitated (IP) proteins with antibodies against the indicated proteins. The input sample contained 10% of the amount used for recombinant proteins used for the co-immunoprecipitation. (D) Top two panels are western blots of the indicated proteins upon immunoprecipitation with the indicated HA-tagged YAP (left) or TAZ (right) derivatives or IgG control. Bottom two panels are western blots of cell extracts prior to immunoprecipitation. (E) Relative growth in conditions of low attachment in cells overexpressing the indicated proteins or empty vector (EV) control in parental MCF-10A cells (lacking ER-Src). Error bars indicate ± SD of 3 replicates.
Figure 3—figure supplement 1
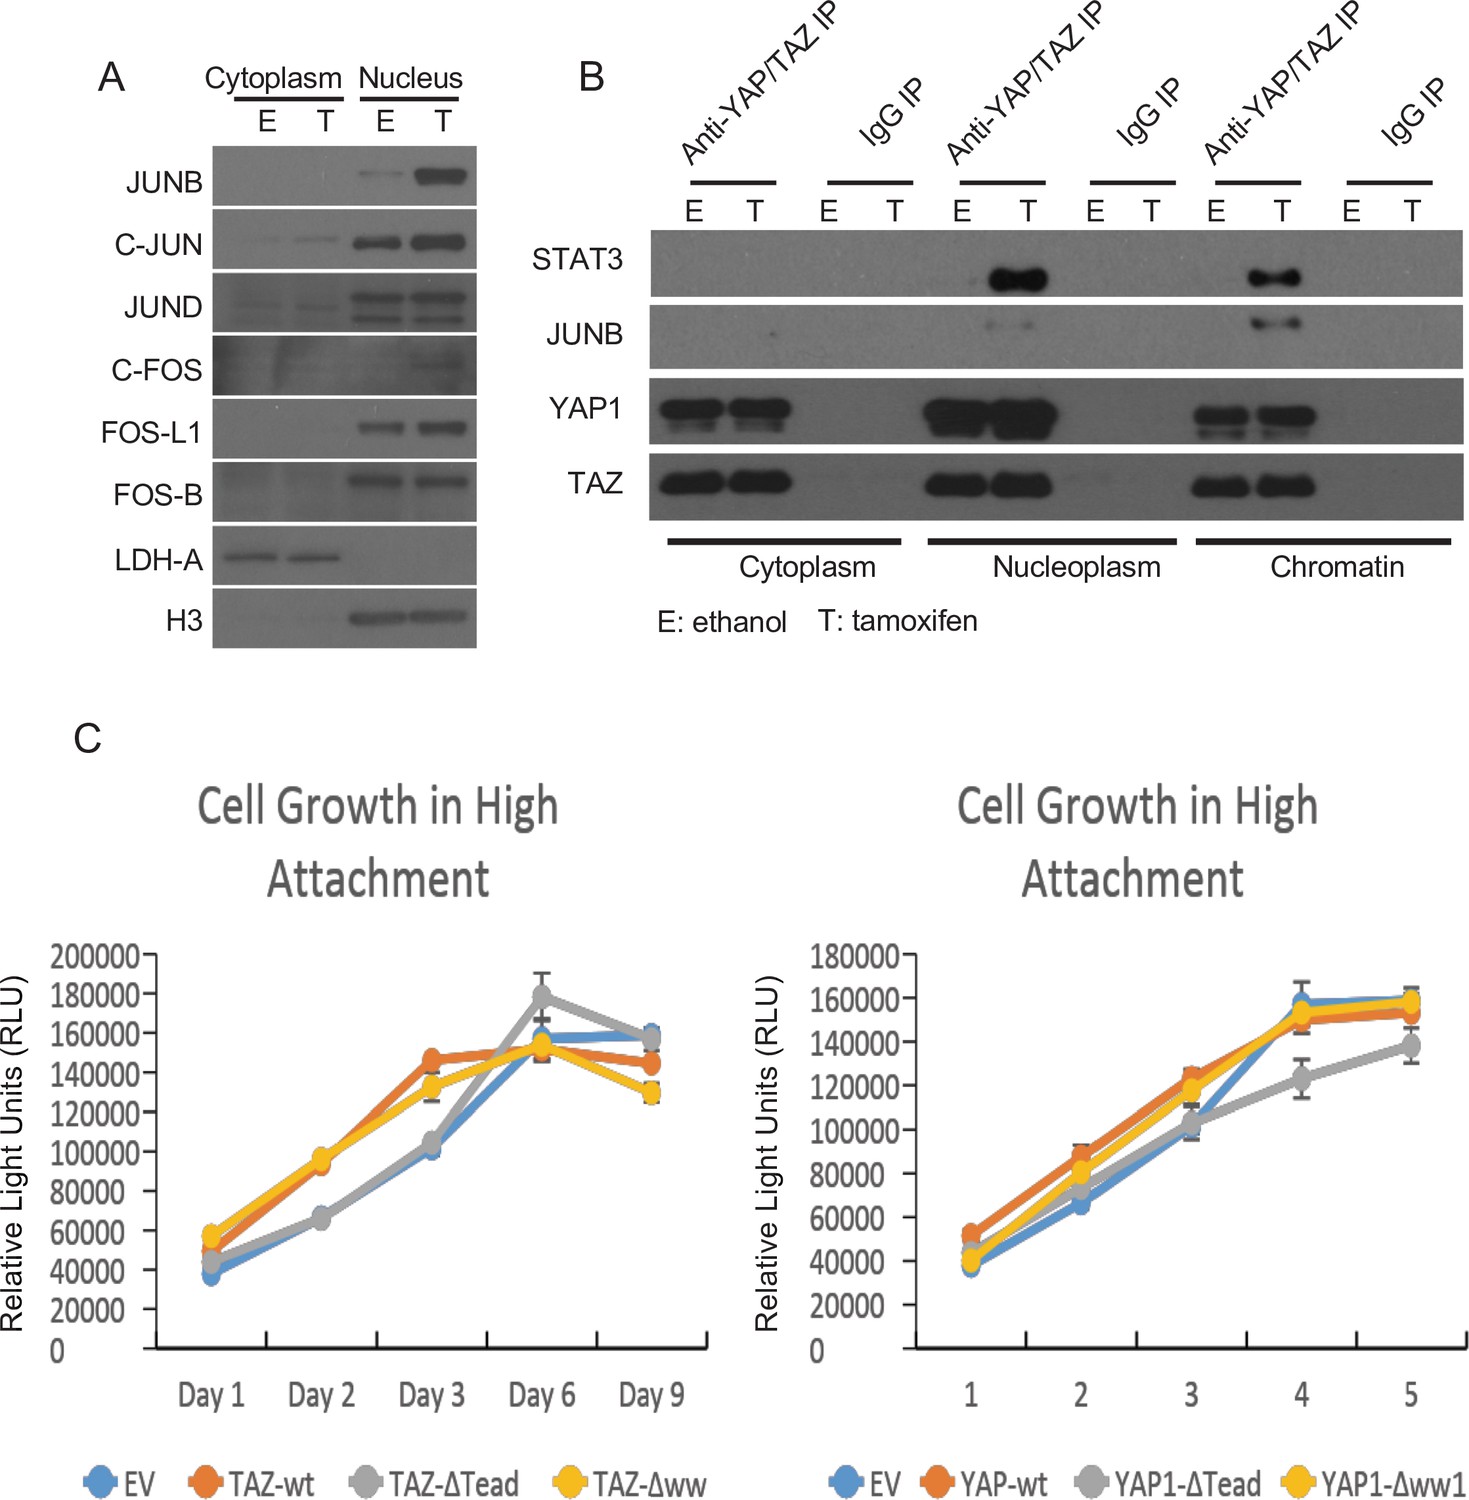
Interactions of YAP and TAZ with JUNB and STAT3.
(A) Levels of the indicated proteins in the cytoplasm or nucleus of non-transformed (E) or transformed (T) cells. LDH-A is a cytoplasm marker and H3 is a nucleus marker. (B) Levels of the indicated proteins upon immunoprecipitation (IP) with antibodies (Anti) against the indicated proteins and the IgG control. The Anti-YAP/TAZ antibody recognizes both YAP and TAZ. (C) Growth of cells overexpressing the indicated proteins (EV is the empty vector control) under conditions of high attachment; n = 3 with error bars ± SD.
Figure 4 with 1 supplement
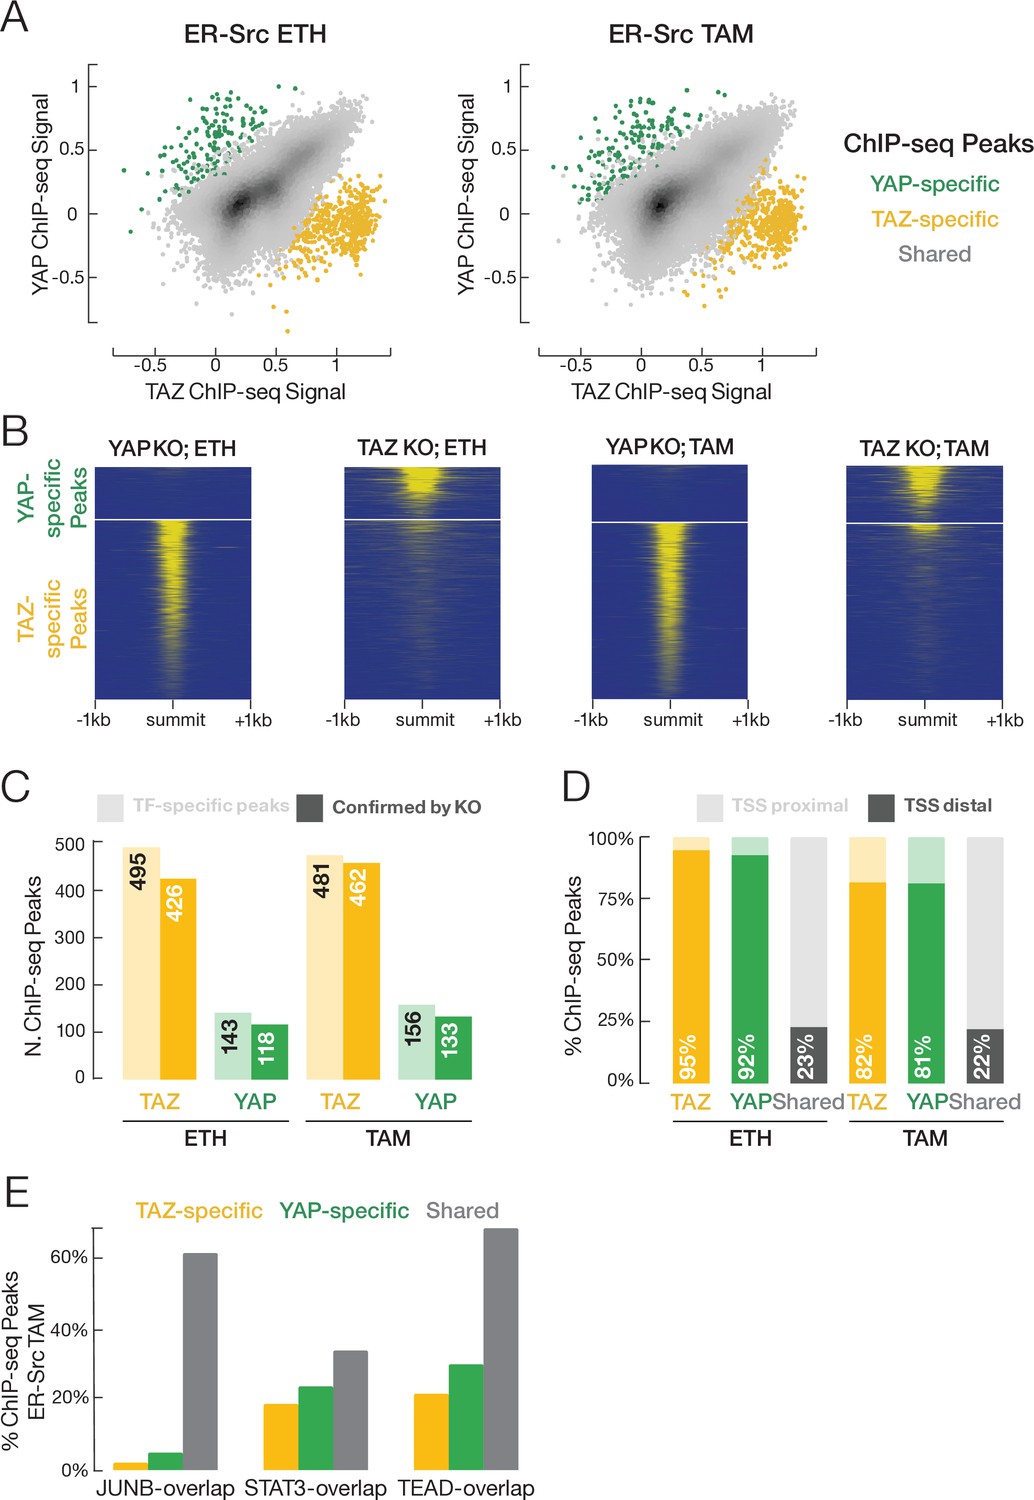
YAP and TAZ have highly similar binding profiles, but a small subset of binding sites is unique to each factor.
(A) Correlation (r ~ 0.7) of YAP and TAZ binding signals in non-transformed (ETH) and transformed (TAM) cells. Putative YAP- and TAZ-specific sites are indicated, respectively, as green and yellow. (B) YAP and TAZ binding signals in YAP- or TAZ-knockout cell lines using an antibody that recognizes both proteins. (C) Number of putative YAP- and TAZ-specific sites (lighter colors) confirmed in cells deleted for the indicated factor (darker colors). (D) Percentage of YAP-specific, TAZ-specific, and shared YAP/TAZ sites that are located proximal (light colors) or distal (darker colors) to the transcription start site (TSS). (E) Percentages of TAZ-specific (yellow), YAP-specific (green), and YAP/TAZ-shared (gray) sites intersecting with STAT3, JUNB, and TEAD sites in transformed cells. TAZ- and YAP-specific sites are significantly less likely than shared sites to intersect JUNB and TEAD sites (Chi-square p-values YAP/JUNB = 3.2 × 10⁻²⁴, TAZ/JUNB = 2.1 × 10–81, YAP/TEAD = 0.002, TAZ/TEAD = 9.7 × 10⁻²⁰).
Figure 4—figure supplement 1
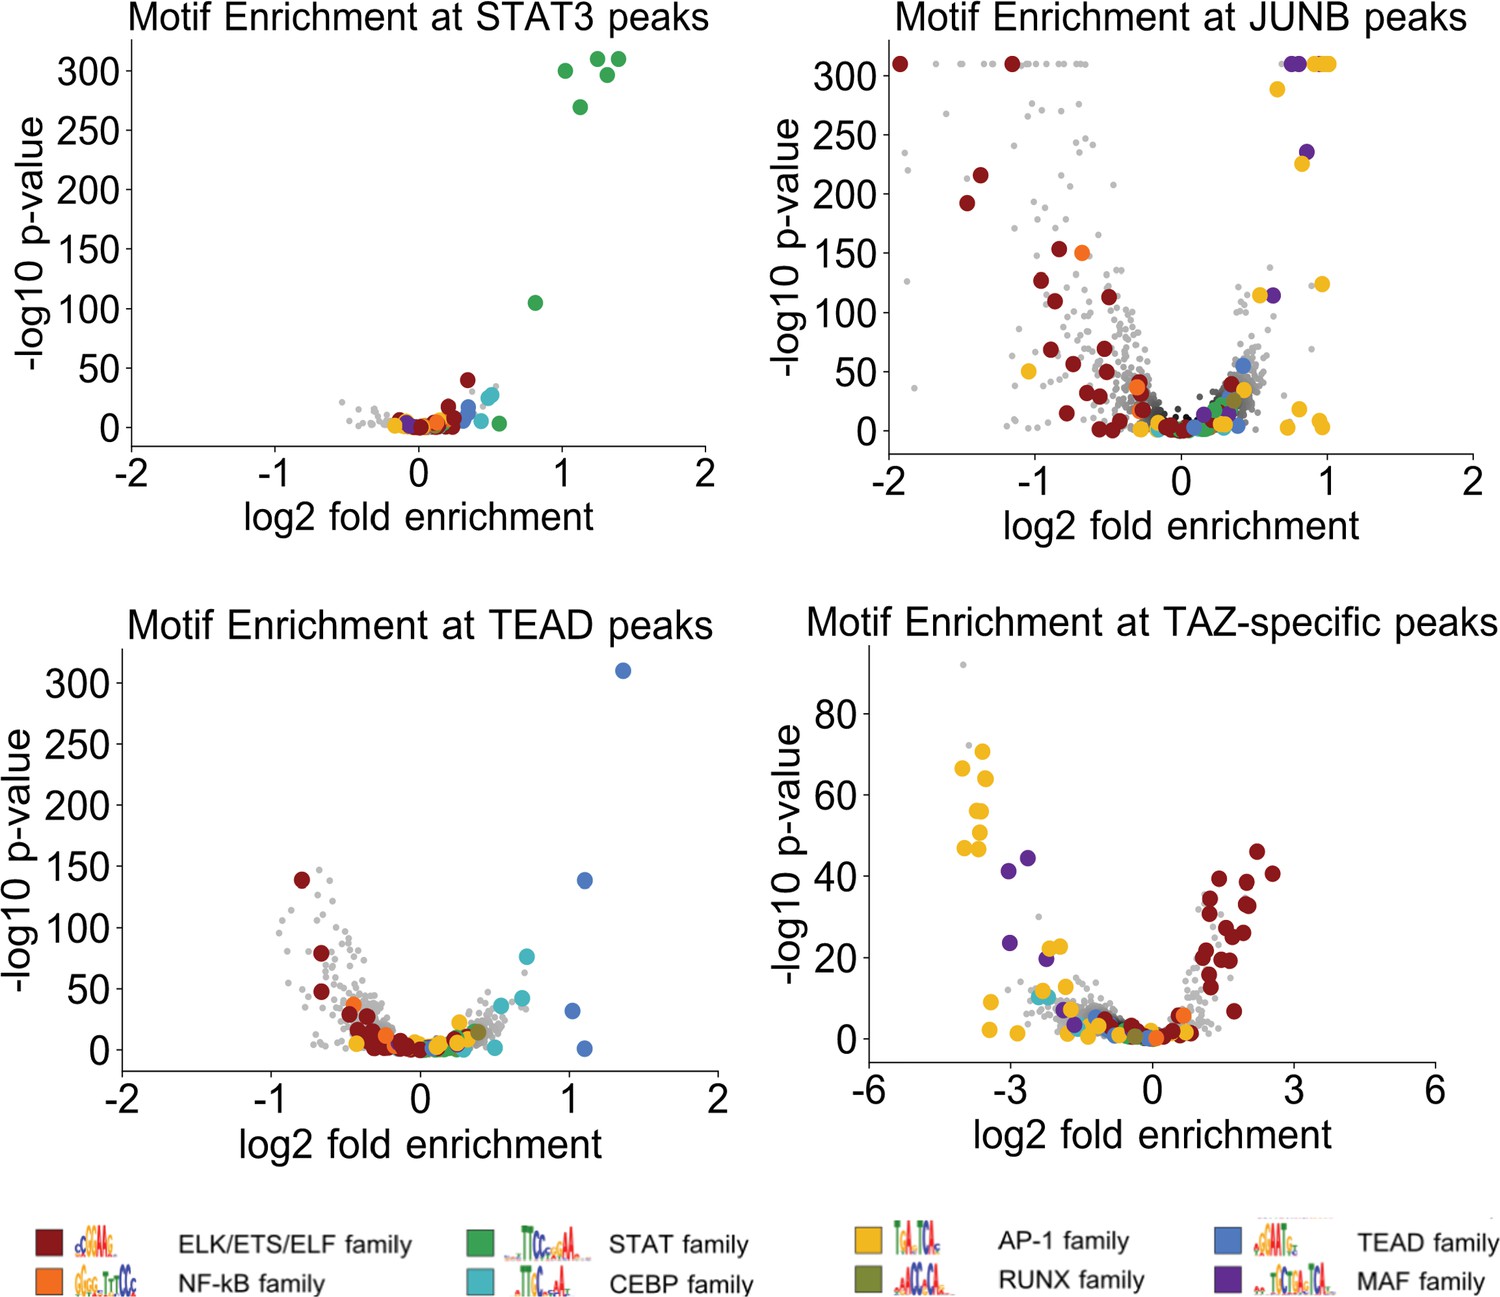
Motif enrichment and overlap of ChIP-seq peaks.
Enrichment of the indicated motifs (different colors) in STAT3, JUNB, TEAD, and TAZ-specific (i.e., not bound by YAP) binding sites when compared with matched control DNase-hypersensitive regions in transformed cells.
Figure 5 with 1 supplement
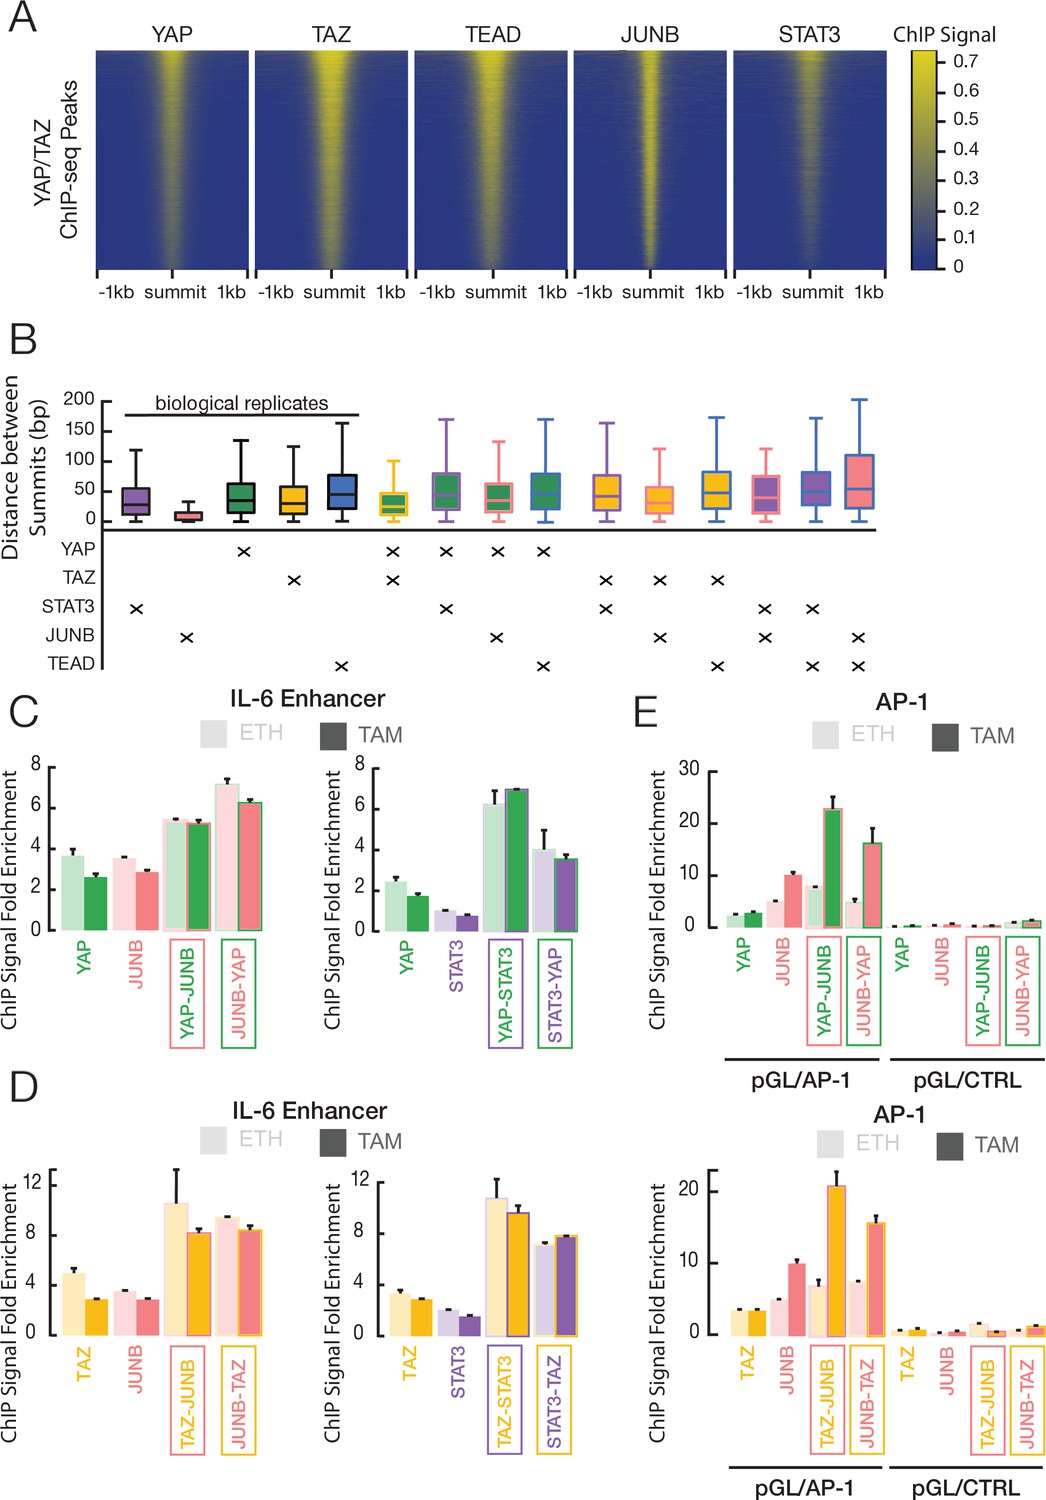
YAP and TAZ co-occupy sites with JUNB and STAT3 in transformed ER-Src cells.
(A) Heatmaps indicate ChIP-seq signals of the indicated proteins for YAP/TAZ peaks arrayed from top to bottom in decreasing YAP ChIP signal. (B) Distance between peak summits for biological replicates or combinations of the indicated factors in transformed cells. (C) Fold-enrichments of individual and sequential ChIP at the IL-6 enhancer in untransformed (ETH) and transformed (TAM) cells with YAP and either JUNB or STAT3 performed in the indicated order. (D) Fold-enrichments of individual and sequential ChIP at the IL-6 enhancer with TAZ and either JUNB or STAT3 performed in the indicated order. (E) Fold-enrichments of individual and sequential ChIP of the indicated proteins on a plasmid containing either six AP-1 motifs or a control lacking these motifs (Ctrl). Error bars indicate ± SD of 3 replicates.
Figure 5—figure supplement 1
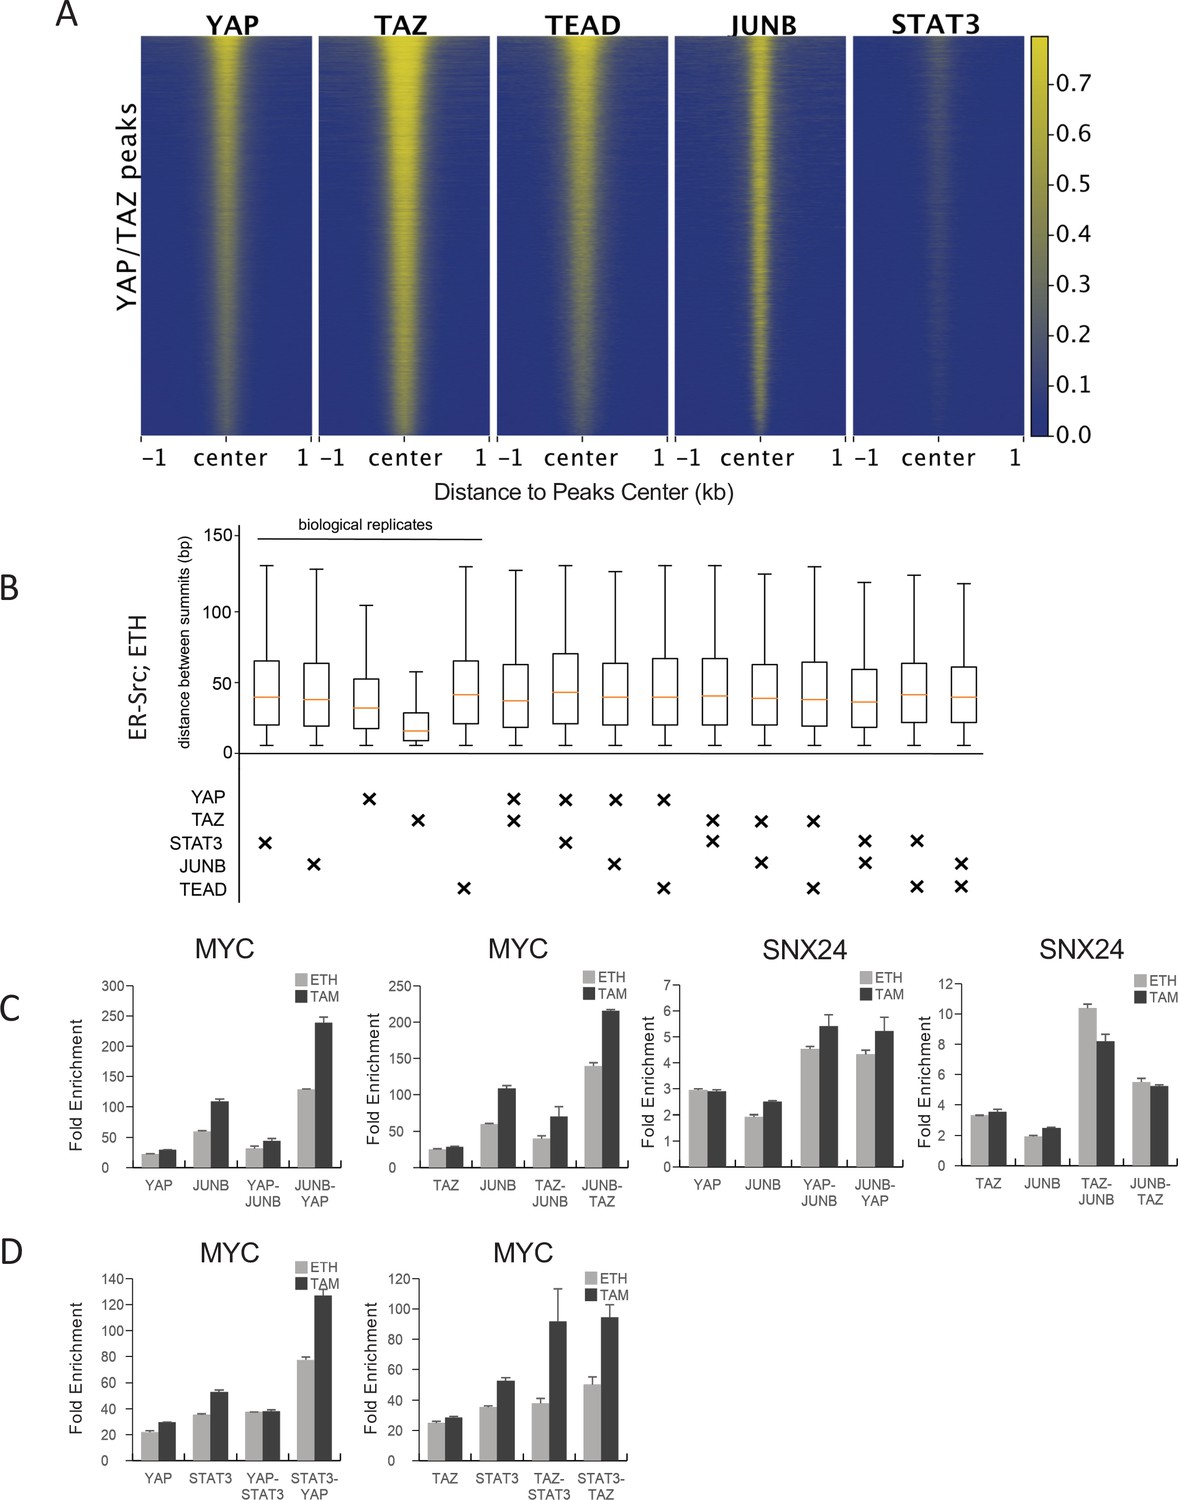
Co-binding of YAP/TAZ with other factors in non-transformed ER-Src cells (ethanol grown).
(A) Heatmaps indicate ChIP-seq signals of YAP, TAZ, TEAD, JUNB, and STAT3 for YAP/TAZ peaks arrayed from top to bottom in decreasing YAP ChIP signal. (B) Distance between peak summits for biological replicates or combinations of the indicated factors in non-transformed cells. (C) Sequential ChIP of YAP or TAZ with JUNB in the indicated orders in untransformed (ETH) and transformed (TAM) cells at the SNX24 and MYC loci. (D) Sequential ChIP of YAP or TAZ with JUNB in the indicated orders in untransformed (ETH) and transformed (TAM) cells at the MYC locus.
Figure 6 with 3 supplements
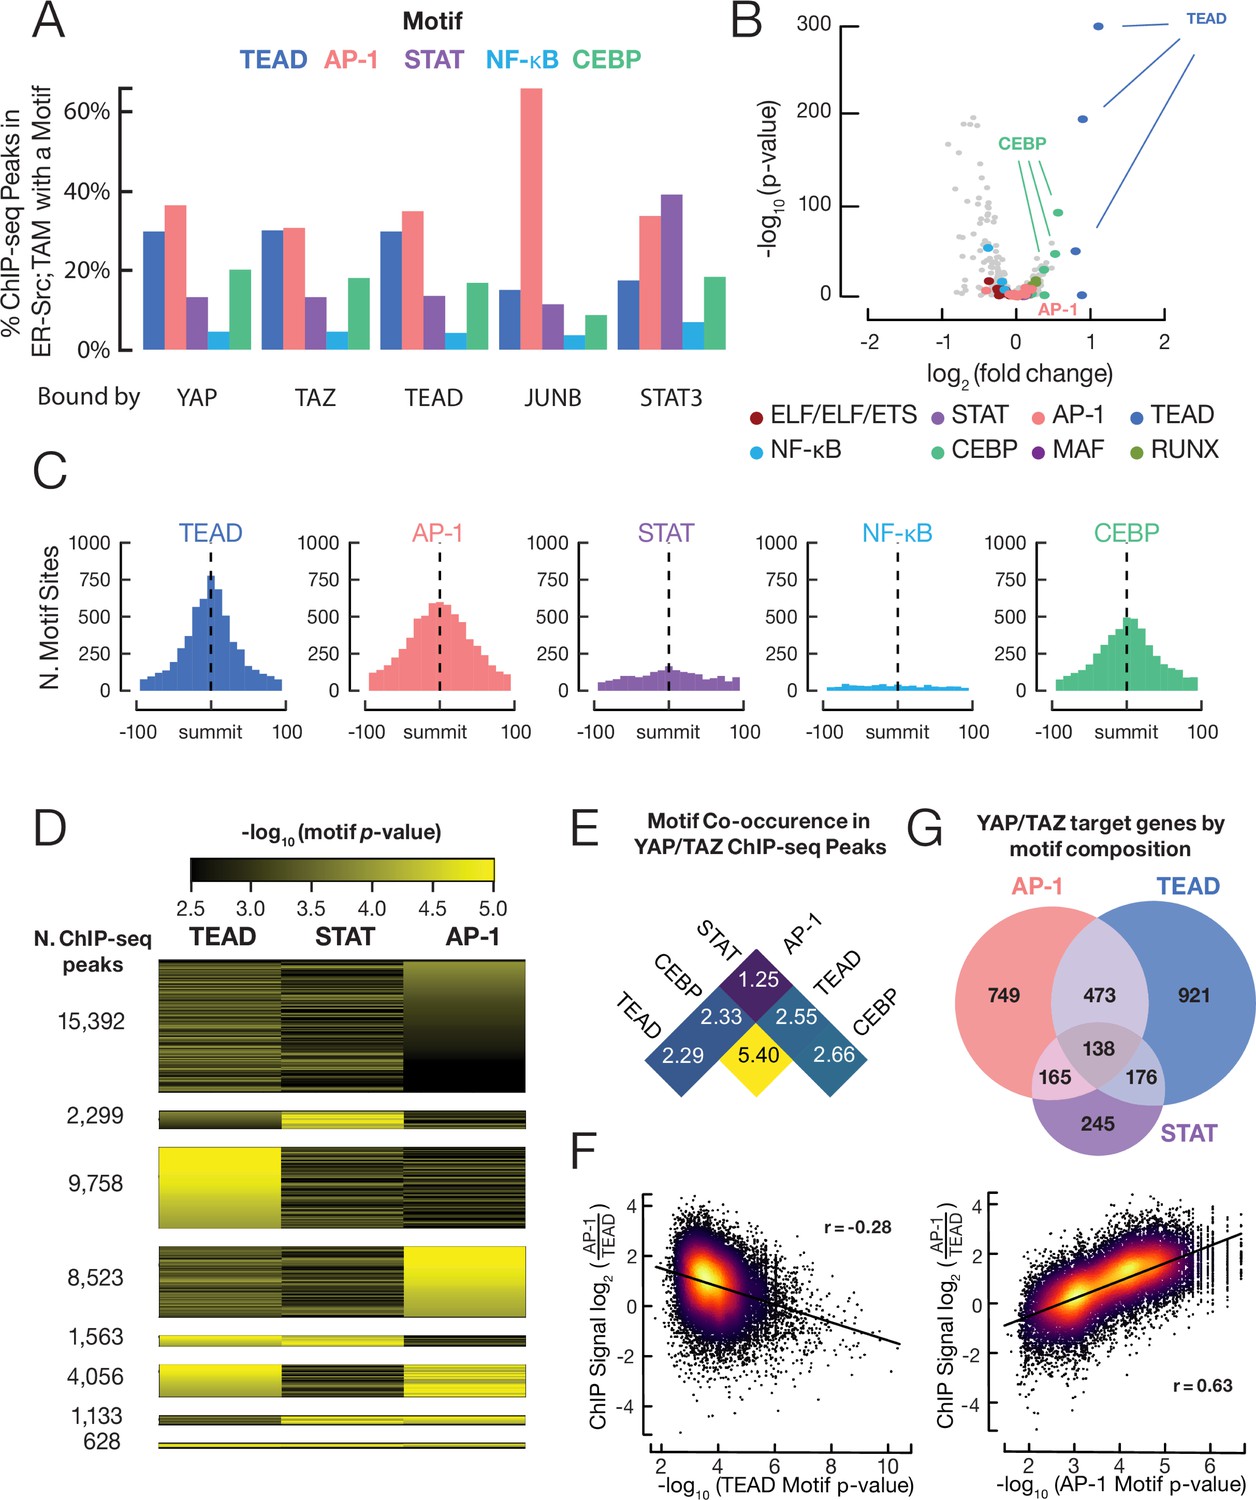
YAP/TAZ are recruited by TEAD, AP-1, CEBP proteins, and (to a lesser extent) STAT3.
(A) Percent of binding regions for the indicated proteins that contain a given DNA sequence motif. (B) Enrichment and p-values for various motifs within YAP/TAZ target sites in transformed cells as compared with control sites having similar DNase-seq signal profiles. (C) Histogram of all motif locations for the indicated proteins within 500 bp of a YAP/TAZ peak summit (defined as position 0). (D) Numbers of YAP/TAZ peaks containing the indicated motifs and motif scores. (E) Fold-enrichment of the indicated pairwise combinations of motifs in YAP/TAZ target sites relative to control sites. (F) Scatter plots of the log-ratio of JUNB vs. TEAD ChIP-seq signals against the AP-1 motif score (top panel) and TEAD motif score (bottom panel). Pearson correlation coefficient (r) is indicated for each panel. (G) Venn diagram illustrating the numbers of genes with a YAP/TAZ target site classified by motif located within 2 kb of their transcription start sites.
Figure 6—figure supplement 1
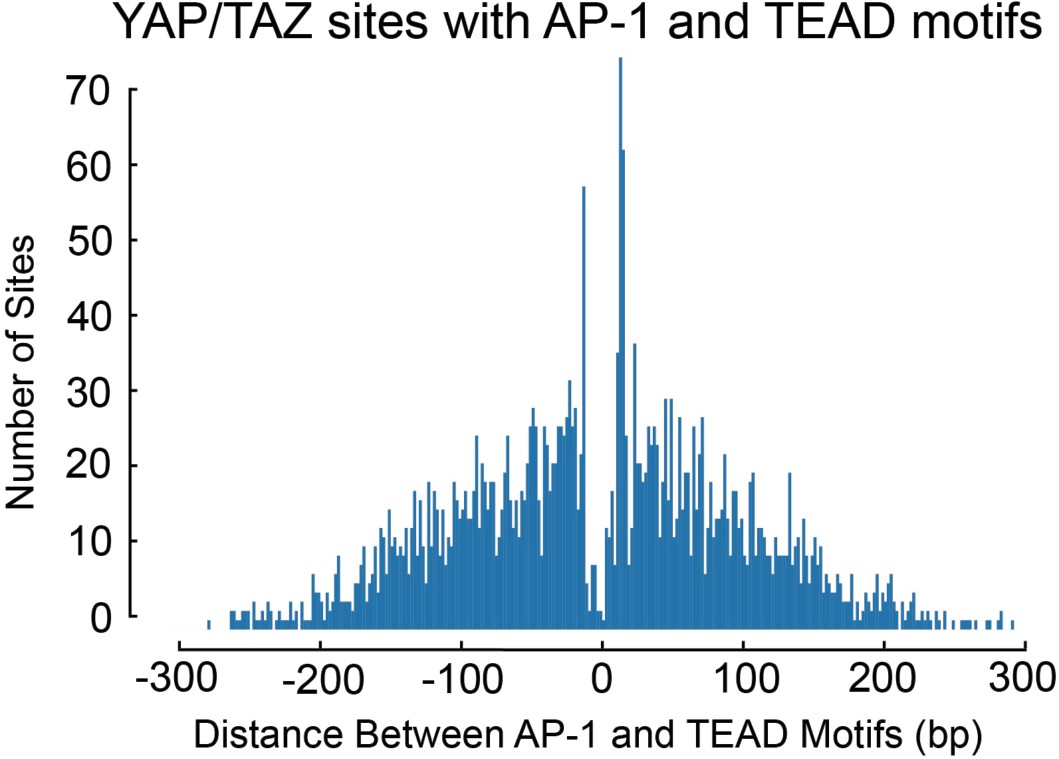
Distribution of the distances between AP-1 and TEAD motifs at YAP/TAZ binding sites containing both motifs.
Figure 6—figure supplement 2

YAP/TAZ binding sites and their co-binding with other factors in MDA-MD-231 cells.
(A) Heatmaps indicate ChIP-seq signals of indicated proteins for YAP/TAZ peaks arrayed from top to bottom in decreasing YAP ChIP signal. (B) Correlation between YAP and TAZ binding levels, with potential YAP-specific (green) and TAZ-specific (yellow) sites highlighted. (C) Intersection of various combinations of binding sites for the four factors in ethanol-treated MDA-MB-231 cells. (D) Inter-summit distances for biological replicates and pairwise combinations of binding sites in MDA-MB-231 cells.
Figure 6—figure supplement 3
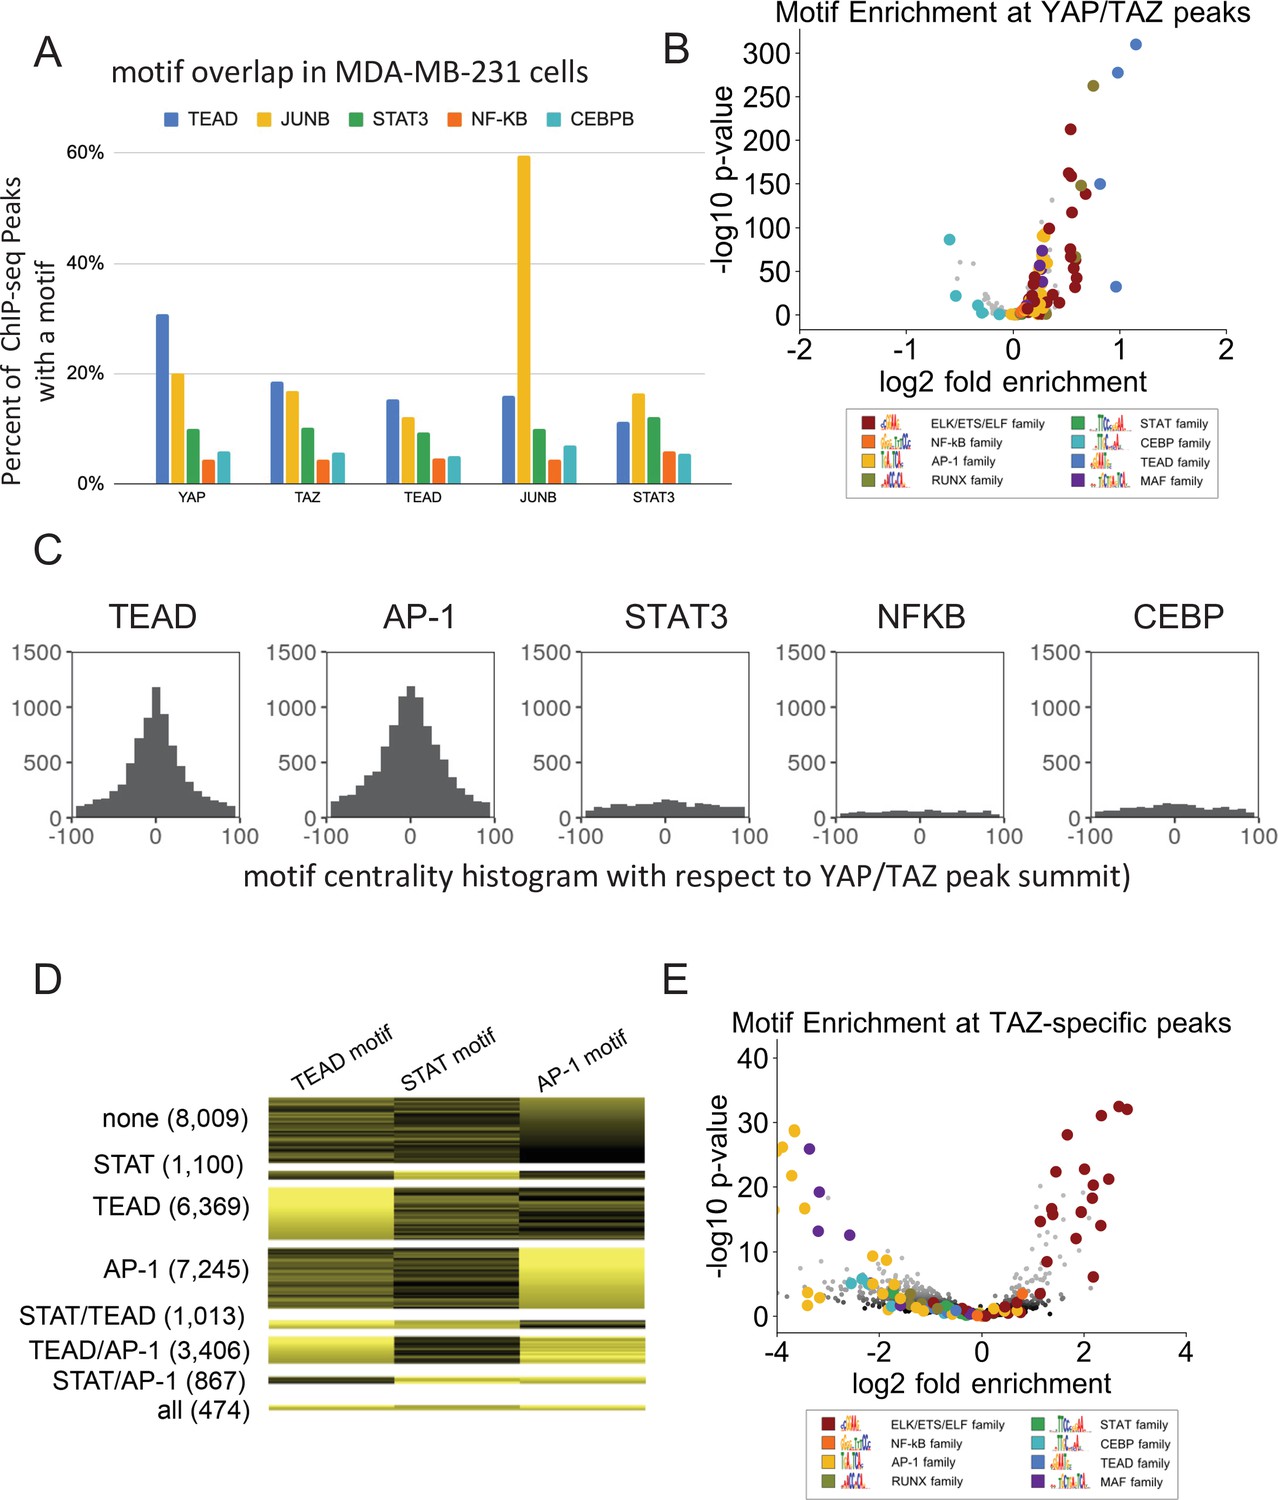
YAP/TAZ Motif enrichment and co-binding of YAP/TAZ with other factors in MDA-MD-231 cells.
(A) Percent of binding regions for the indicated proteins that contain a given DNA sequence motif (different colors). (B) Enrichment of motifs within YAP/TAZ binding sites as compared with control DNase hypersensitive sites. (C) Histogram of all motif locations for TEAD, JUNB, STAT3, NF-κB, and CEBPB occurring within 100 bp of a YAP/TAZ peak summit (defined as position 0). (D) Numbers of YAP/TAZ peaks containing the indicated motifs and motif scores. (E) Enrichment of motifs within TAZ-specific peaks as compared with control DHSs.
Figure 7 with 2 supplements
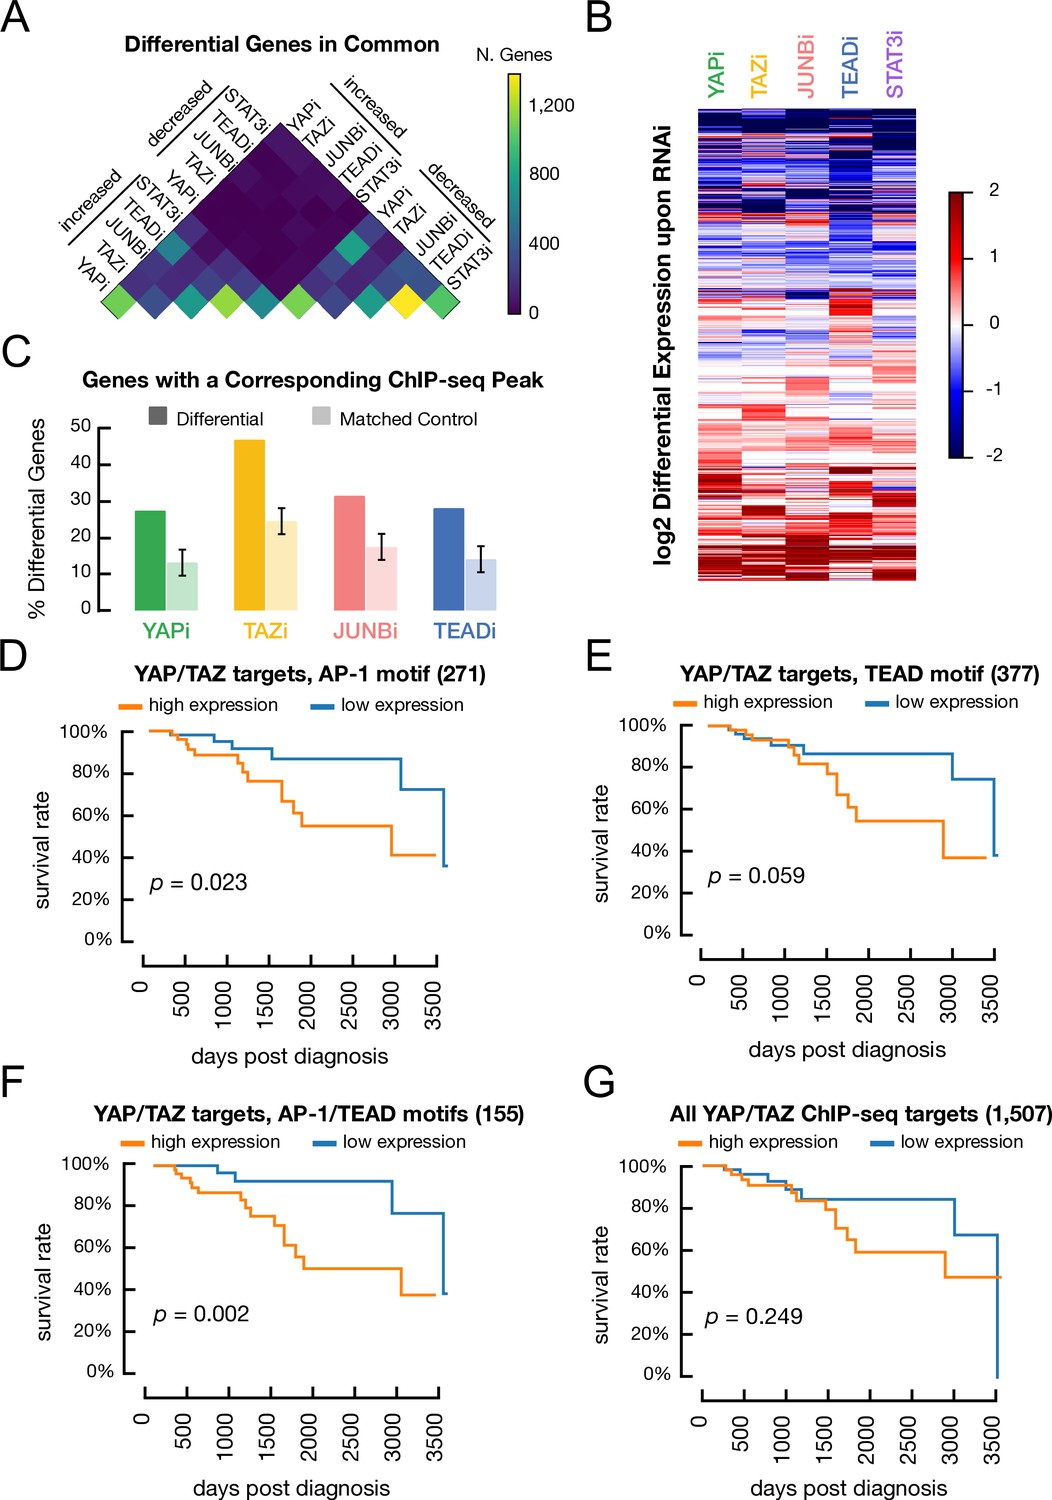
Genes regulated by YAP, TAZ, JUNB, and TEAD and association of various classes of YAP/TAZ target site with differences in overall survival in triple-negative breast cancer patients.
(A) Overlap between genes with decreased or increased expression in transformed cells treated with RNAi against YAP, TAZ, STAT3, or JUNB when compared with a control RNAi. (B) Heatmap illustrates the differential gene expression (log2) upon RNAi of each factor. Columns correspond to genes. (C) Percentage of differentially expressed genes following treatment with a given RNAi (dark colors) and matched control genes (light colors) which also have a YAP/TAZ target site for the corresponding factor within 2 kb of a transcription start site. (D) Kaplan–Meier survival curves for the YAP/TAZ target sites with an AP-1 motif in patients with high (orange) or low (blue) signature scores. (E) Kaplan–Meier survival curve for the YAP/TAZ target sites with a TEAD motif. (F) Kaplan–Meier survival curve for the YAP/TAZ target sites with both AP-1 and TEAD motifs. (G) Kaplan–Meier survival curve for all YAP/TAZ target sites.
Figure 7—figure supplement 1

Kaplan–Meier survival curves for the indicates genes sets from (A) the complete set of YAP/TAZ target sites, (B) the subset containing only AP-1 motifs, (C) the subset containing only TEAD motifs, and (D) the subset containing both AP-1 and TEAD motifs, for the indicated cohorts of breast cancer patients (luminal A, left; luminal B, center; HER2+, right).
Figure 7—figure supplement 2
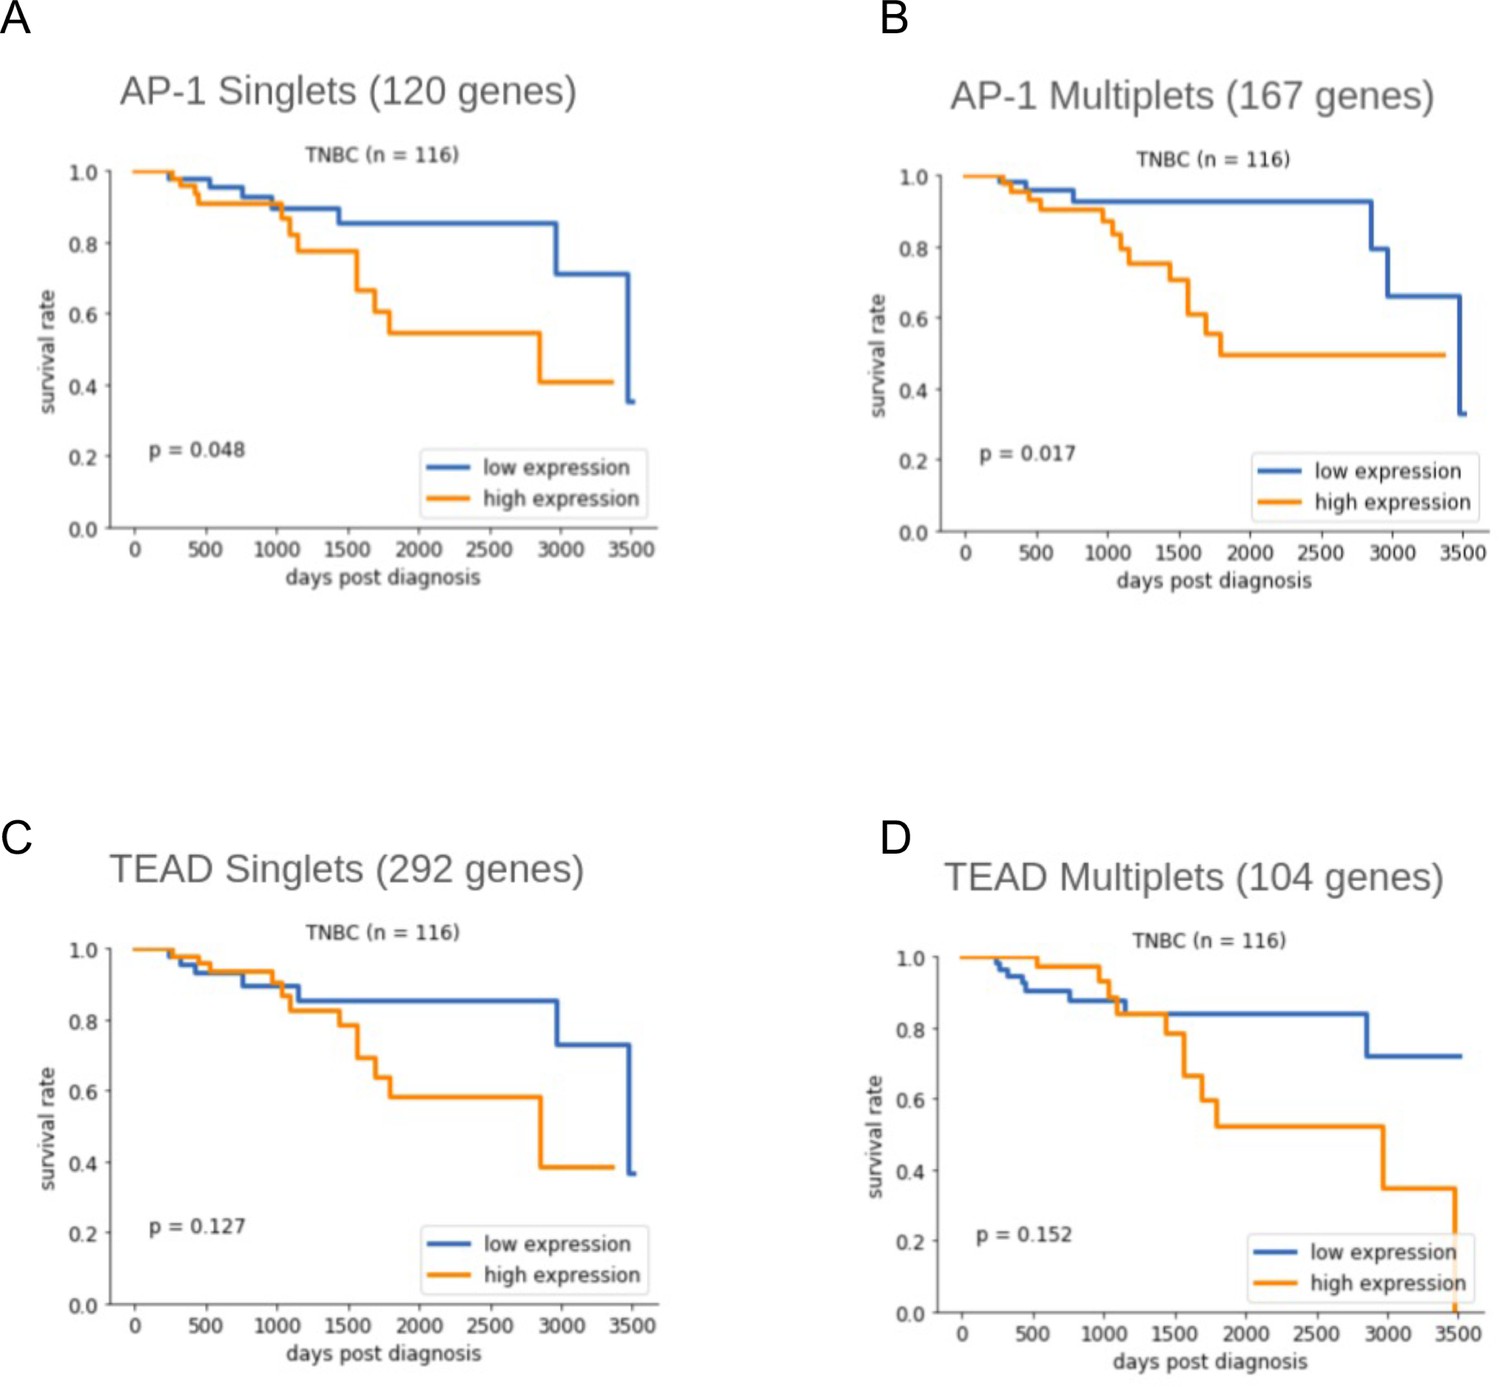
Kaplan–Meier survival curves for genes sets from (A) YAP/TAZ target sites containing exactly one AP-1 motif site, (B) YAP/TAZ target sites containing two or more AP-1 motif sites, (C) YAP/TAZ target sites containing exactly one TEAD motif site, and (D) YAP/TAZ target sites containing two or more TEAD motif sites.
Figure 8
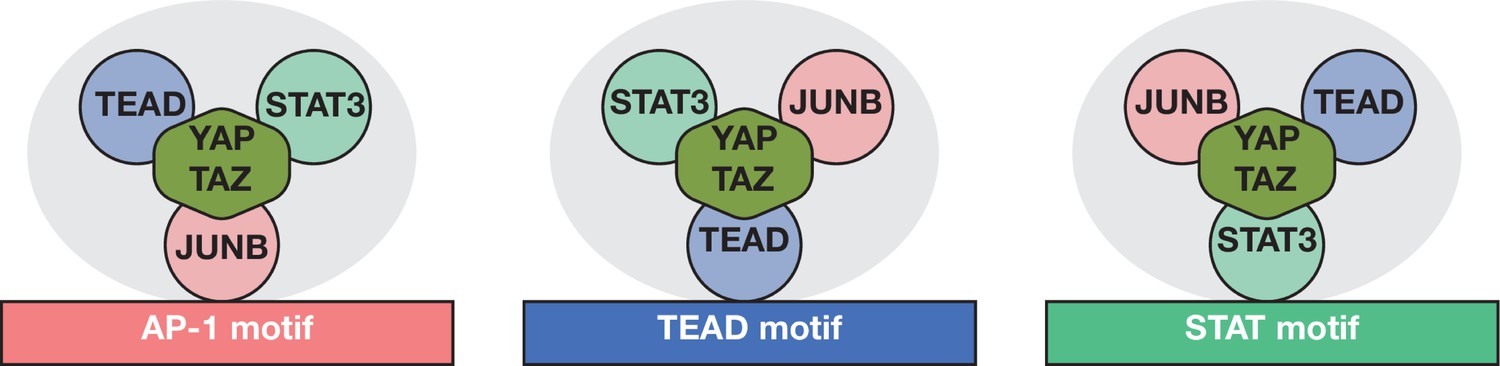
Model for YAP/TAZ recruitment by AP-1, STAT3, and TEAD proteins.
Three different classes of YAP/TAZ target sites based on the recruiting motif are depicted. The overall complex (gray oval) includes all three DNA-binding proteins and perhaps additional proteins (not shown) with the cognate protein directly interacting with the indicated motif. Potential protein–DNA interactions not involving the indicated motif may exist but are not shown. Interactions between TEAD, STAT3, and AP-1 are not specified and may or may not be direct. YAP/TAZ is capable of and shown interacting with all three DNA-binding proteins, but relative contributions of the DNA-binding proteins to YAP/TAZ recruitment are not indicated or known.
Additional files
-
Supplementary file 1
Correlation between (A) biological replicates and (B) number of binding sites of the indicated proteins in ER-Src ethanol or tamoxifen; wild-type and YAP or TAZ knockout (KO) and MDA-MB-231 cells.
- https://cdn.elifesciences.org/articles/67312/elife-67312-supp1-v2.pdf
-
Supplementary file 2
Enriched GO categories for YAP-specific, TAZ-specific, or shared YAP/TAZ target genes.
- https://cdn.elifesciences.org/articles/67312/elife-67312-supp2-v2.xlsx
-
Supplementary file 3
Gene signatures for the indicated categories of YAP/TAZ target sites.
- https://cdn.elifesciences.org/articles/67312/elife-67312-supp3-v2.xlsx
-
Supplementary file 4
Enriched GO terms with associated q-values for genes with YAP/TAZ target sites containing only AP-1, TEAD, or STAT motif but not combinations of motifs.
- https://cdn.elifesciences.org/articles/67312/elife-67312-supp4-v2.xlsx
-
Supplementary file 5
siRNAs, antibodies, qPCR primers, ChIP-seq primers, and list of datasets.
- https://cdn.elifesciences.org/articles/67312/elife-67312-supp5-v2.xlsx
-
Transparent reporting form
- https://cdn.elifesciences.org/articles/67312/elife-67312-transrepform1-v2.pdf
Download links
A two-part list of links to download the article, or parts of the article, in various formats.
Downloads (link to download the article as PDF)
Open citations (links to open the citations from this article in various online reference manager services)
Cite this article (links to download the citations from this article in formats compatible with various reference manager tools)
YAP and TAZ are transcriptional co-activators of AP-1 proteins and STAT3 during breast cellular transformation
eLife 10:e67312.
https://doi.org/10.7554/eLife.67312


