Canonical NF-κB signaling maintains corneal epithelial integrity and prevents corneal aging via retinoic acid
- Bio-X Institutes, Key Laboratory for the Genetics of Developmental and Neuropsychiatric Disorders, Ministry of Education, Shanghai Jiao Tong University, China
- Department of Ophthalmology, Xinhua Hospital affiliated to Shanghai Jiao Tong University School of Medicine, China
- Institute of Traditional Chinese Medicine and Stem Cell Research, School of Basic Medicine, Chengdu University of Traditional Chinese Medicine, China
Figures
Figure 1 with 3 supplements
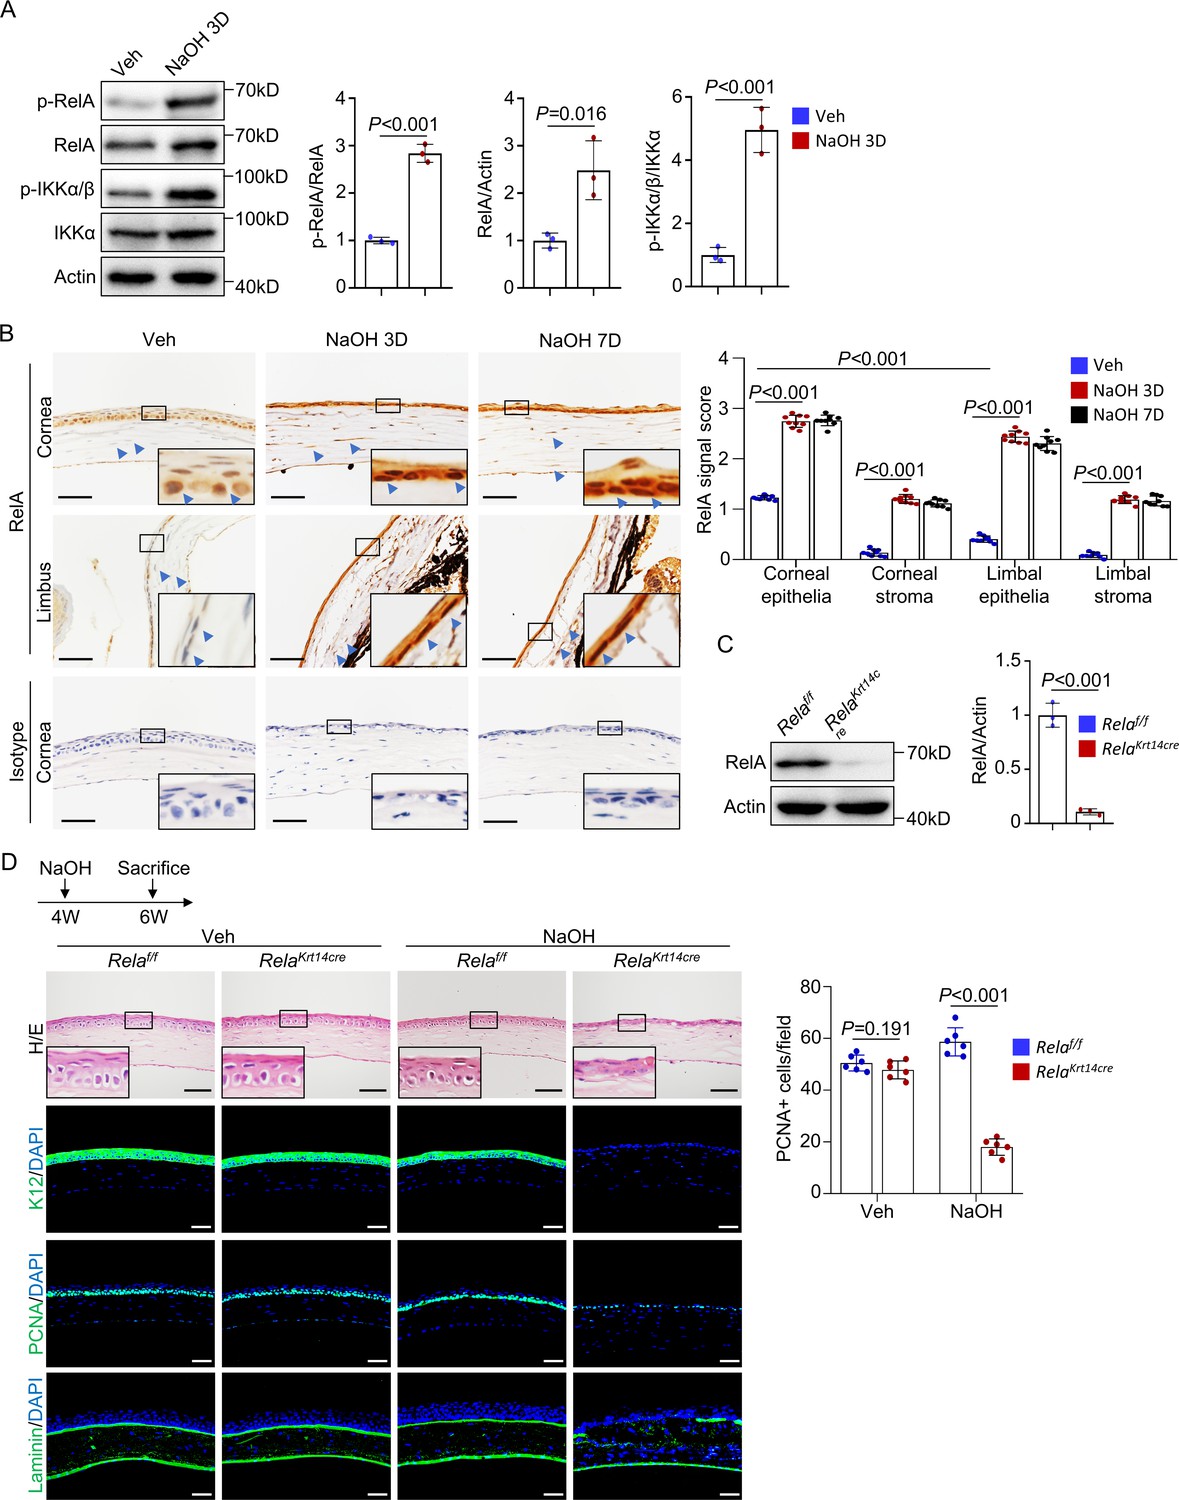
Rela ablation in K14+corneal epithelial stem cells impaired corneal regeneration.
(A) Representative western blot results showed enhanced activation of NF-κB in corneal samples during regeneration. The blots were probed with antibodies against RelA, p-RelA, IKKα, or p-IKKα/β. Right panel: quantitation results. n = 3 per group. (B) Representative immunohistochemical staining results showed nuclear localization of RelA in epithelial and stromal cells in normal and regenerating corneas. Arrowheads: RelA signals. Scale bar, 50 µm. Right panel: quantitation results. n = 3 views/sample × 3 samples per group. (C) Western blot results showed that RelA level was drastically reduced in Krt14-Cre; Relaf/f mouse corneal samples. Right panel: quantitation results. n = 3 per group. (D) Histological analyses revealed that cornea repair was defective in Krt14-Cre; Relaf/f mice. The cornea sections were stained with H/E or antibodies against PCNA, K12, or laminin. Scale bar, 50 µm. Upper panel: diagram showing the time of injury and mouse euthanization. Right panel: quantitation results. n = 6 per group. Data was presented as mean ± SEM. Unpaired two-tailed Student’s t-test was applied for (A, C), and two-way ANOVA was applied in (B, D). p-value<0.05 was considered as statistically significant.
-
Figure 1—source data 1
Numeric data used in Figure 1.
- https://cdn.elifesciences.org/articles/67315/elife-67315-fig1-data1-v2.xlsx
Figure 1—figure supplement 1
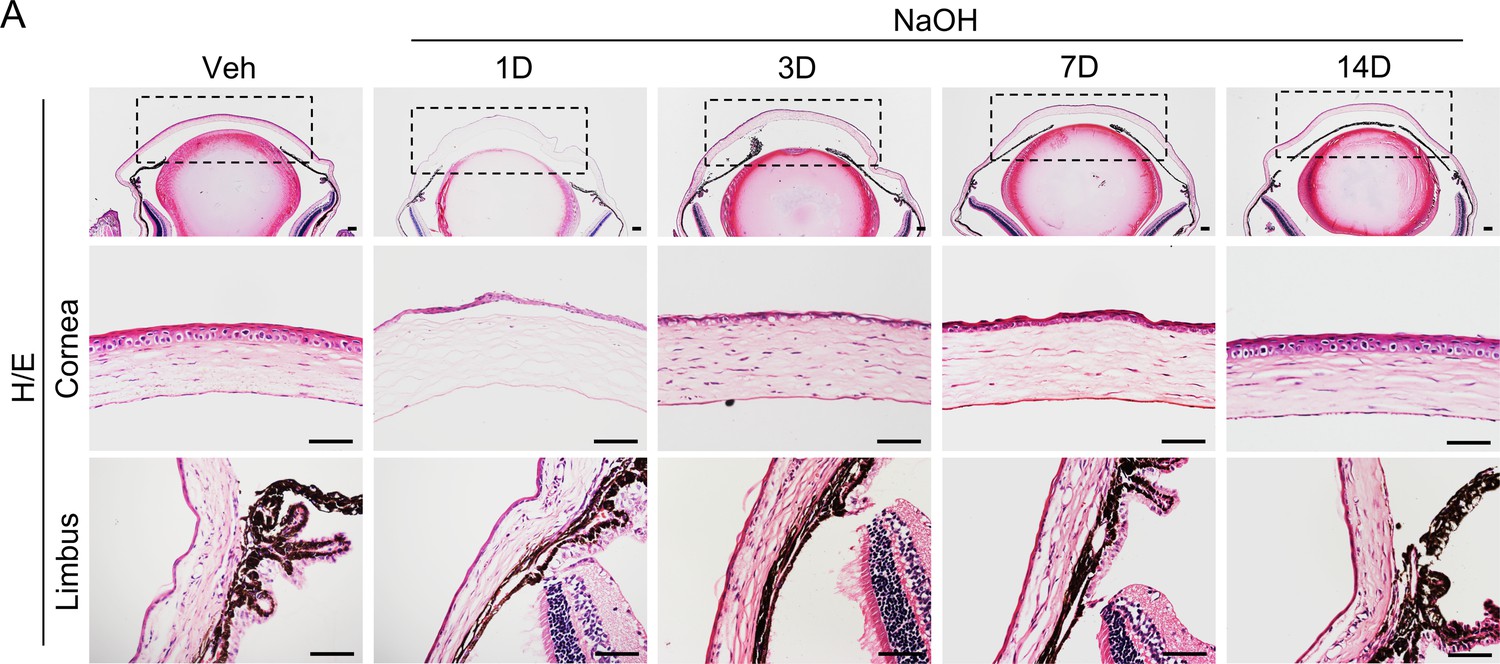
The corneal regeneration process after alkaline burn.
Histological analysis showed the regeneration process of the cornea following NaOH burn in normal mice. Scale bar, 50 µm.
Figure 1—figure supplement 2
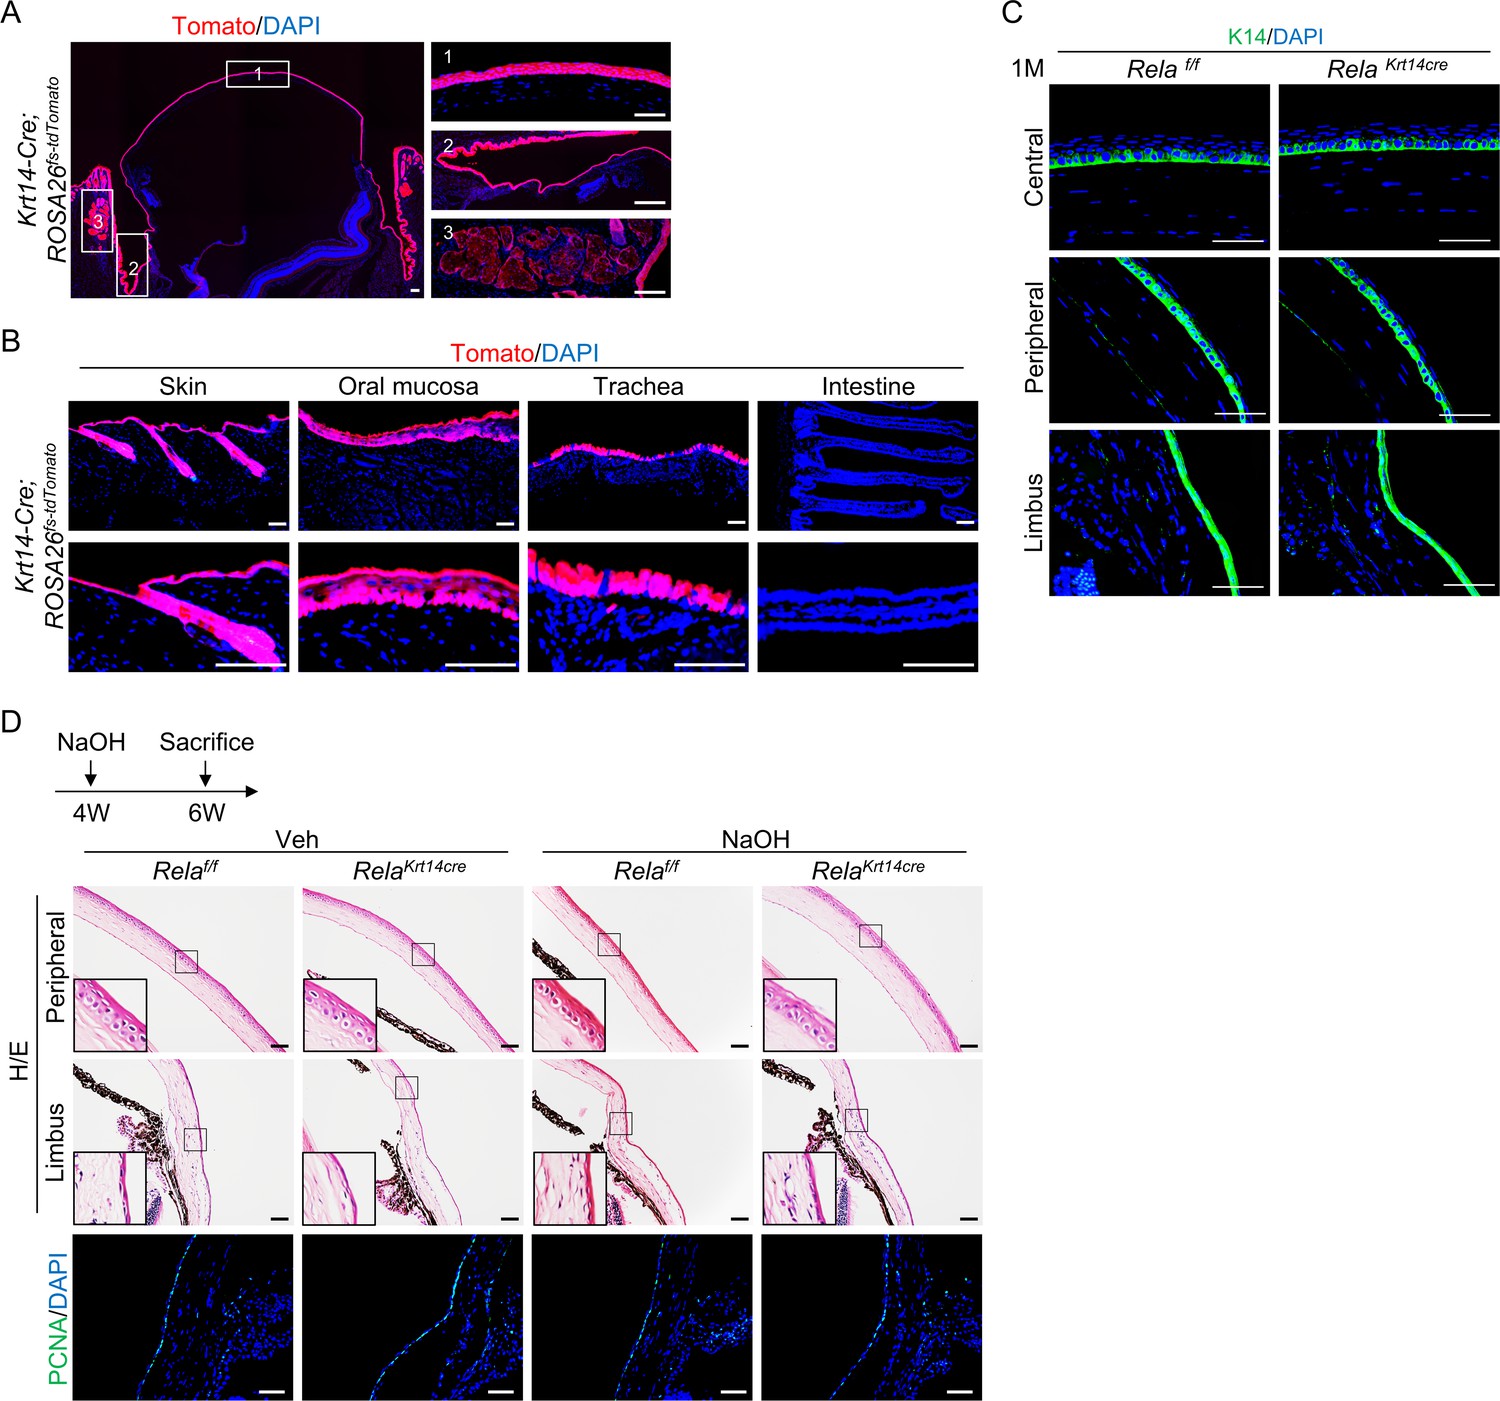
Tracing results of Krt14-Cre; ROSA26fs-tdTomato mice.
(A) Lineage tracing in Krt14-Cre; ROSA26fs-tdTomato mice confirmed marking of corneal epithelial cells, limbal corneal epithelial stem cells, conjunctiva, and meibomian glands. Scale bar, 50 µm. (B) Lineage tracing in oral mucosa, trachea, and small intestine of Krt14-Cre; ROSA26fs-tdTomato mice. Scale bar, 50 µm. (C) Normal expression of K14 in central and peripheral cornea and the limbus of young Krt14-Cre; Relaf/f mice. Scale bar, 50 µm. (D) Representative histological analyses showed that cell proliferation in the limbal region was not affected in Krt14-Cre; Relaf/f mice during regeneration. Scale bar, 50 µm.
Figure 1—figure supplement 3
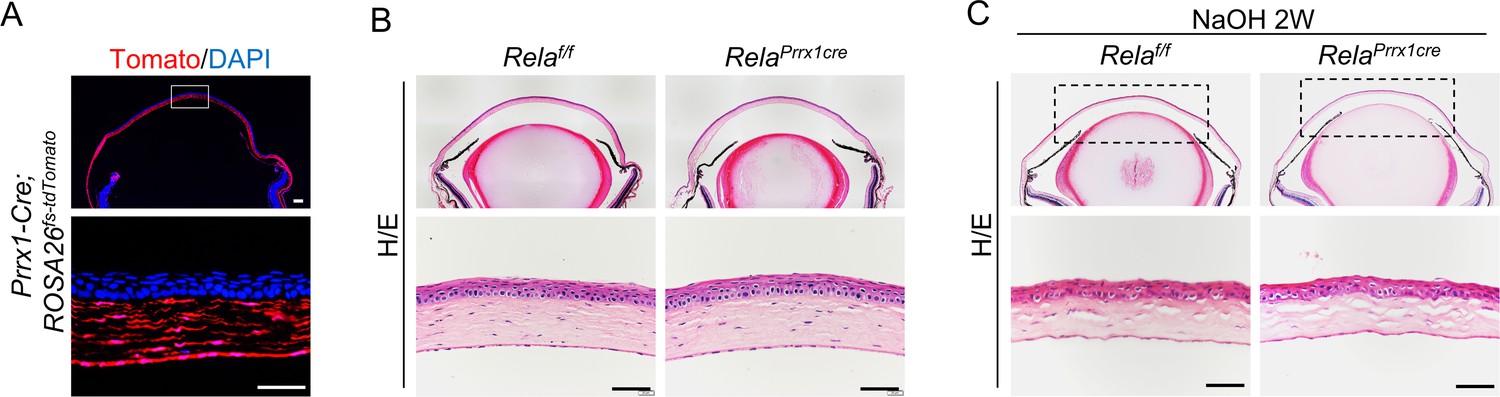
Deletion of Rela in stromal cells did not affect corneal homeostasis or regeneration.
(A) Genetic tracing experiments using Prrx1-Cre; ROSA26fs-tdTomato mice revealed that Prrx1 marked corneal stromal cells. Scale bar, 50 µm. (B) The histology of the cornea was normal in adult Prrx1-Cre; Relaf/f mice compared to control mice. Scale bar, 50 µm. (C) No difference was observed in corneal regeneration in adult Prrx1-Cre; Relaf/f and control mice. Scale bar, 50 µm.
Figure 2 with 2 supplements
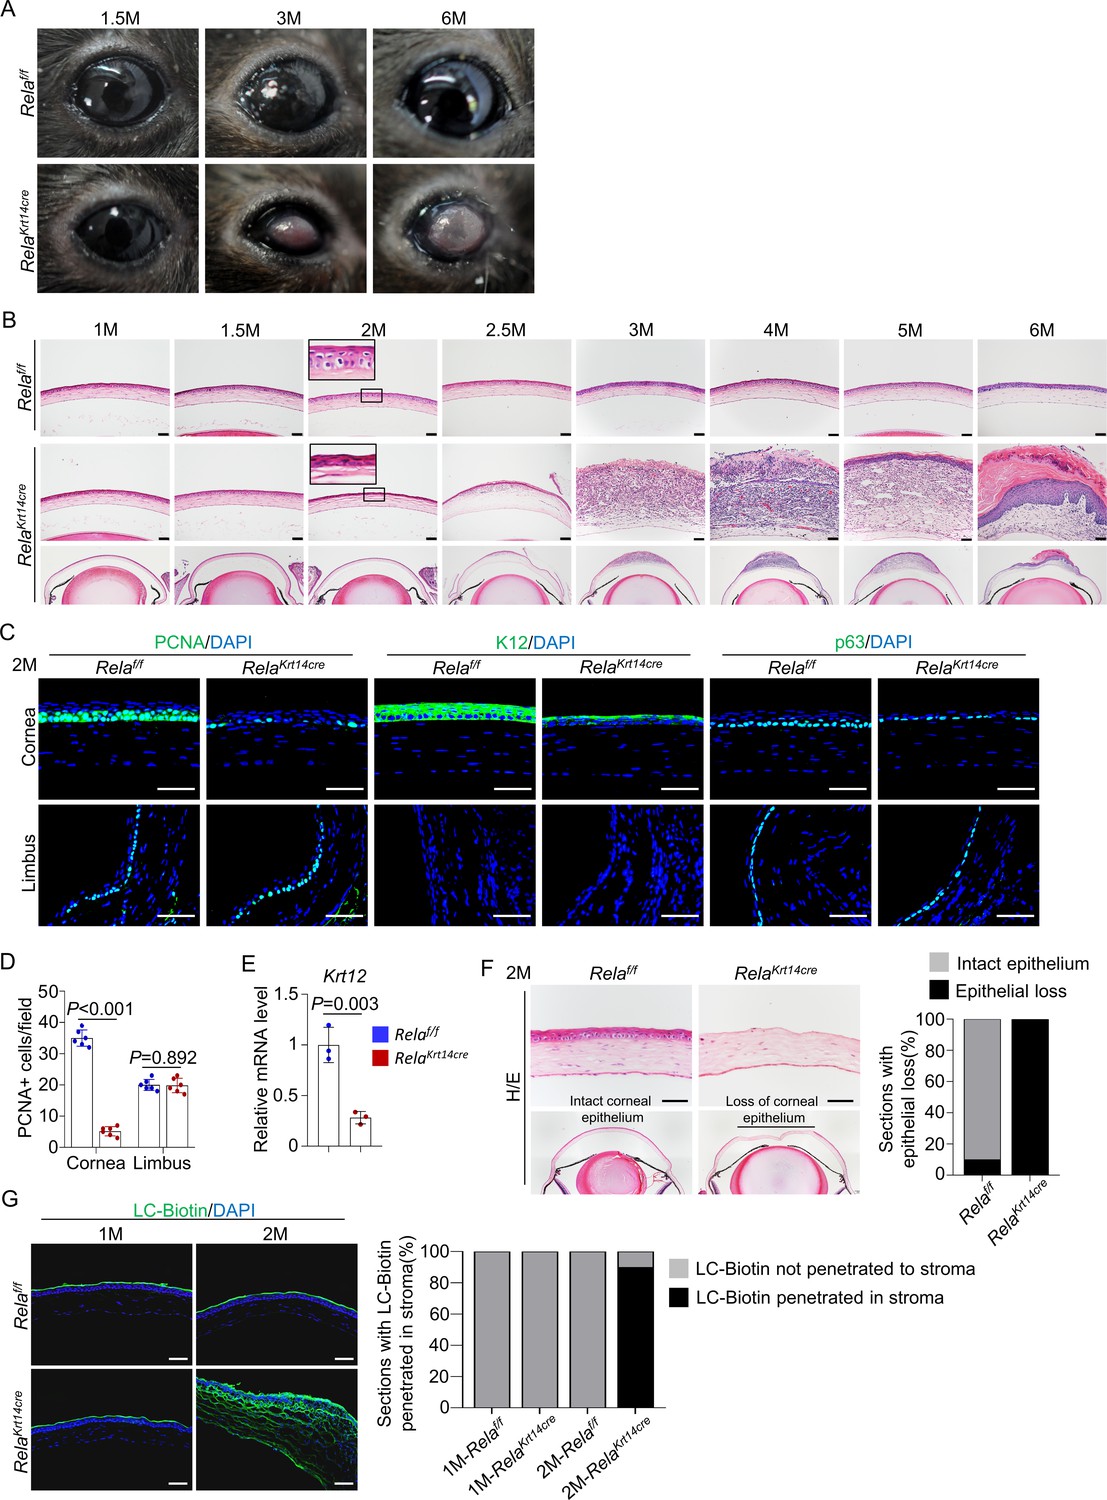
Rela ablation causes age-dependent epithelial deterioration and plaque formation at the central cornea.
(A) Representative images showed the plaques formed at the central cornea of all 6-month-old Krt14-Cre; Relaf/f mice. n = 10 per group. (B). Representative H/E staining results showed an age-dependent change in cornea structures of Krt14-Cre; Relaf/f mice. Scale bar, 50 µm. (C). Representative immunostaining results showed that both epithelial proliferation and differentiation were defective in 2-month-old Krt14-Cre; Relaf/f mice. Cornea sections were stained for PCNA, p63, or K12. Scale bar, 50 µm. (D). Quantitation data of PCNA+ proliferating cells. n = 6 per group. (E). qPCR analysis showed that K12 mRNA levels were decreased in 2-month-old Krt14-Cre; Relaf/f mouse corneal epithelial samples compared to control samples. n = 3 per group. (F). Corneal fragility assay showed that corneal epithelial layer was scraped off more easily in mutant mice than control mice. Scale bar, 50 µm. Right panel: quantitation results. n = 10 per group. (G). LC-biotin staining assays showed that the integrity of the epithelial layer was disrupted in 2- but not 1-month-old Krt14-Cre; Relaf/f mice. Scale bar, 50 µm. Right panel: quantitation results. n = 10 per group. Data was presented as mean ± SEM. Unpaired two-tailed Student’s t-test was applied in (D, E). p-value<0.05 was considered as statistically significant.
-
Figure 2—source data 1
Numeric data used in Figure 2.
- https://cdn.elifesciences.org/articles/67315/elife-67315-fig2-data1-v2.xlsx
Figure 2—figure supplement 1
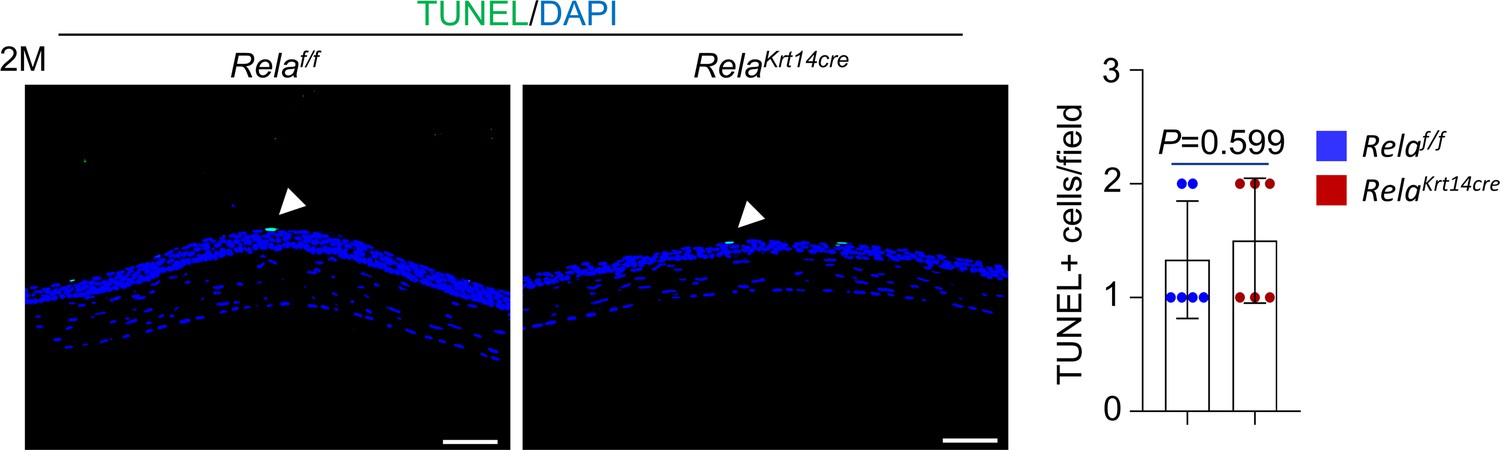
Corneal epithelia shown no alteration in apoptosis in Krt14-Cre; Relaf/f mice.
TUNEL analysis showed normal apoptosis rate in the cornea of 2-month-old Krt14-Cre; Relaf/f mice. Scale bar, 50 µm. n = 6 per group. Data was presented as mean ± SEM. Unpaired two-tailed Student’s t-test was applied in Figure 2—figure supplement 2. p-value<0.05 was considered as statistically significant.
-
Figure 2—figure supplement 1—source data 1
Numeric data used in Figure 2—figure supplement 1.
- https://cdn.elifesciences.org/articles/67315/elife-67315-fig2-figsupp1-data1-v2.xlsx
Figure 2—figure supplement 2
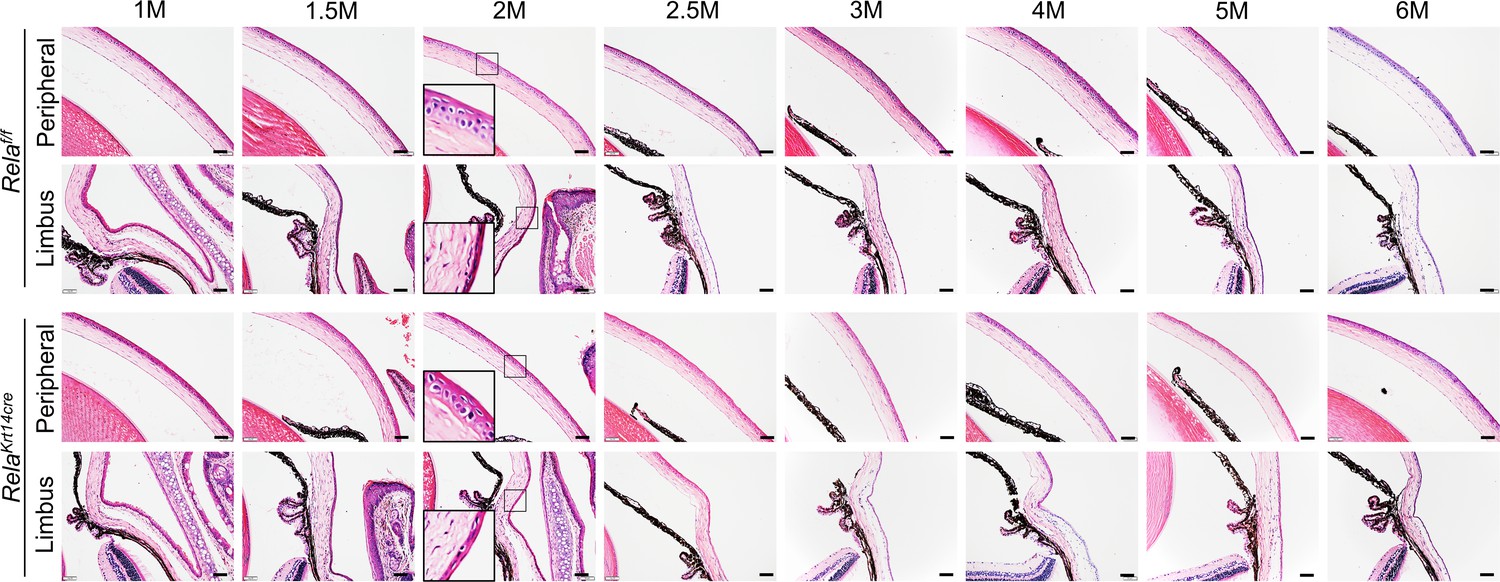
The peripheral and limbal regions appeared normal in Krt14-Cre; Relaf/f mice.
Representative H/E staining results showed no changes in peripheral and limbal structures of Krt14-Cre; Relaf/f mice. Scale bar, 50 µm.
Figure 3 with 4 supplements
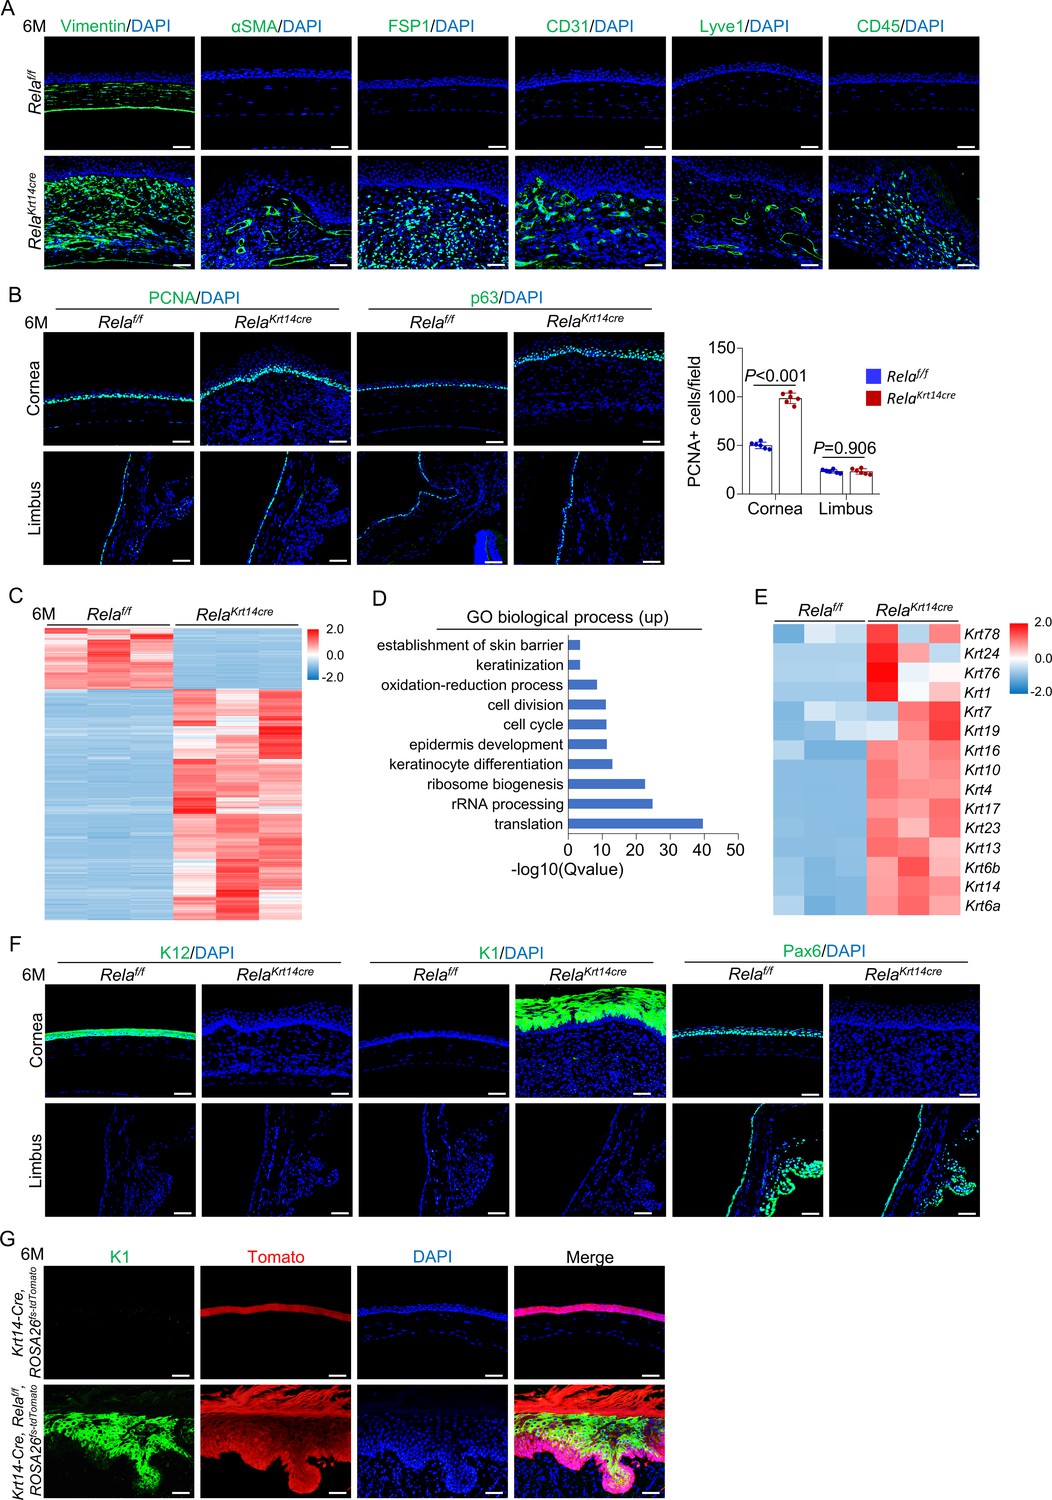
Stroma remodeling, neovascularization, and metaplasia at central cornea in Krt14-Cre; Relaf/f mice.
(A) Representative immunostaining results showed that vimentin, αSMA, FSP1, CD31, Lyve1, and CD45 signals were increased in 6-month-old Krt14-Cre; Relaf/f mice compared to control mice. Scale bar, 50 µm. (B) Representative immunostaining results showed that PCNA and p63 signals were increased at the central cornea but not the limbus in 6-month-old Krt14-Cre; Relaf/f mice compared to control mice. Scale bar, 50 µm. Right panel: quantitation data. n = 6 per group. (C) Heatmap of top 2000 genes expressed in the corneal epithelia of 6-month-old Krt14-Cre; Relaf/f mice compared to control mice. n = 3 per group. (D) GO biological process analysis of upregulated genes in the mutant samples. (E) Heatmap of keratin genes expressed in corneal epithelial samples of 6-month-old Krt14-Cre; Relaf/f mice compared to control mice. n = 3 per group. (F) Representative immunostaining results for K12, K1, and Pax6 in the corneal epithelia of 6-month-old Krt14-Cre; Relaf/f mice. Scale bar, 50 µm. (G) Tracing of Tomato+ cells revealed that K1-expressing dermal-like cells were derived from K14+ cells. Six-month-old Krt14-Cre; Relaf/f; ROSA26fs-tdTomato mice were used. Scale bar, 50 µm. Data was presented as mean ± SEM. Unpaired two-tailed Student’s t-test was applied in (B). p-value<0.05 was considered as statistically significant.
-
Figure 3—source data 1
Numeric data used in Figure 3.
- https://cdn.elifesciences.org/articles/67315/elife-67315-fig3-data1-v2.xlsx
Figure 3—figure supplement 1
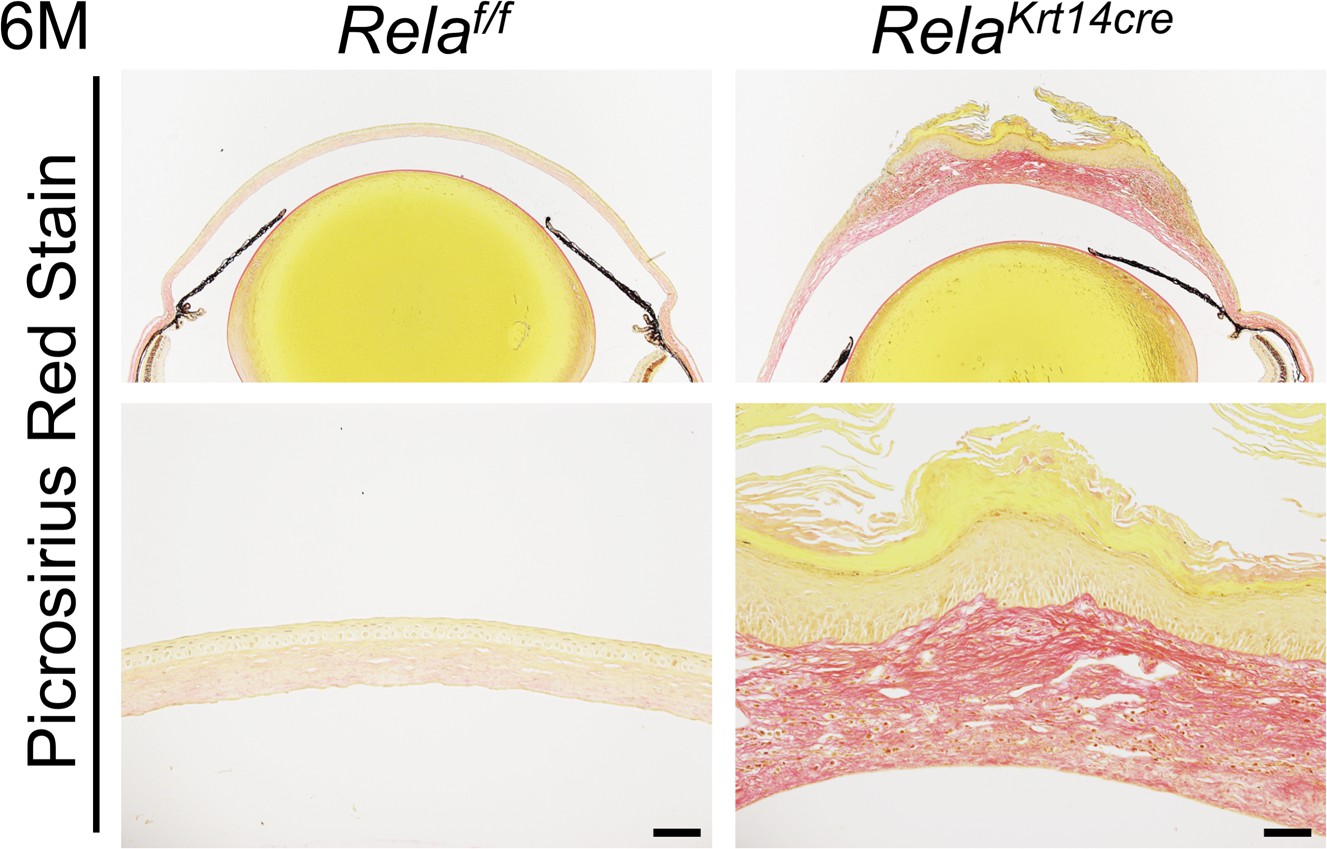
Krt14-Cre; Relaf/f mice showed fibrosis in the cornea.
Representative Picrosirius sating results of the corneas of the mutant and control mice at 6 months of age. Scale bar, 50 µm.
Figure 3—figure supplement 2
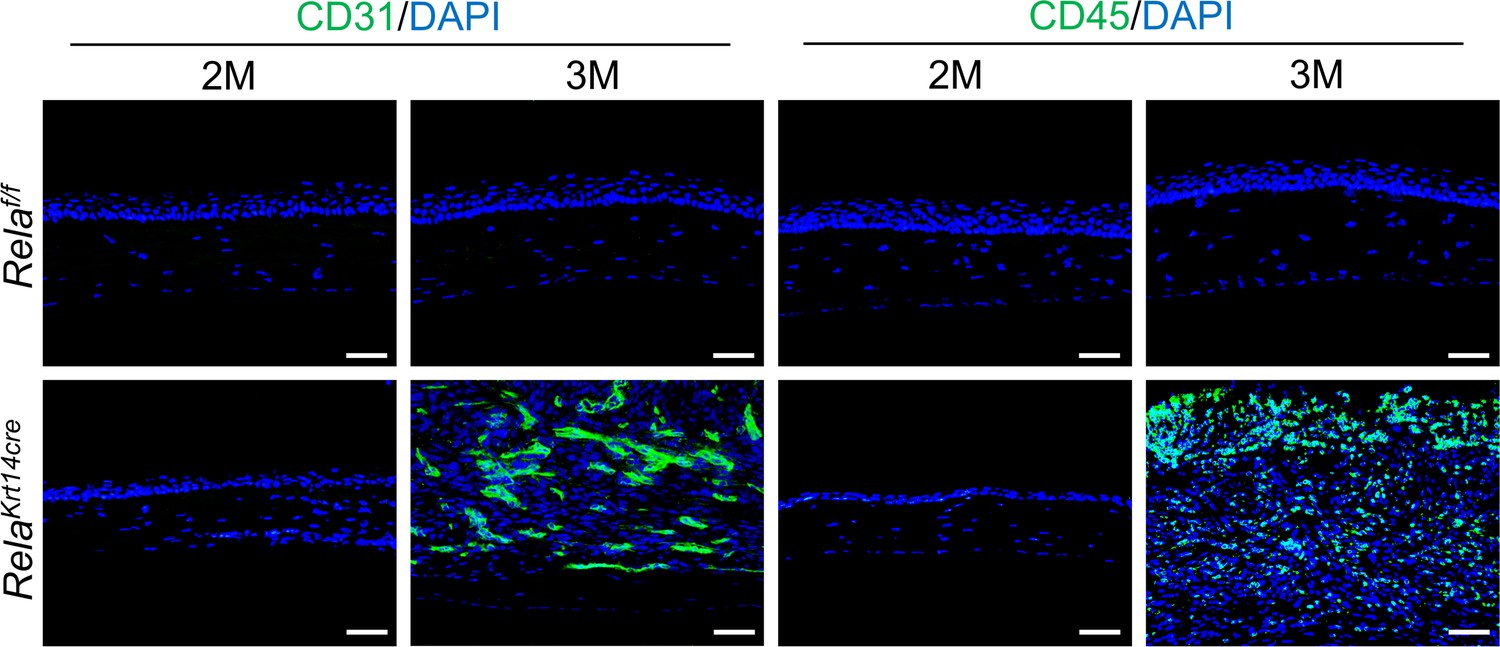
Krt14-Cre; Relaf/f mice showed blood vessels formation and immune cell infiltration at 3 but not 2 months of age.
Representative immunostaining revealed that Krt14-Cre; Relaf/f mice showed blood vessels (CD31+) formation and immune cell infiltration (CD45+) at 3 but not 2 months of age. Scale bar, 50 µm.
Figure 3—figure supplement 3
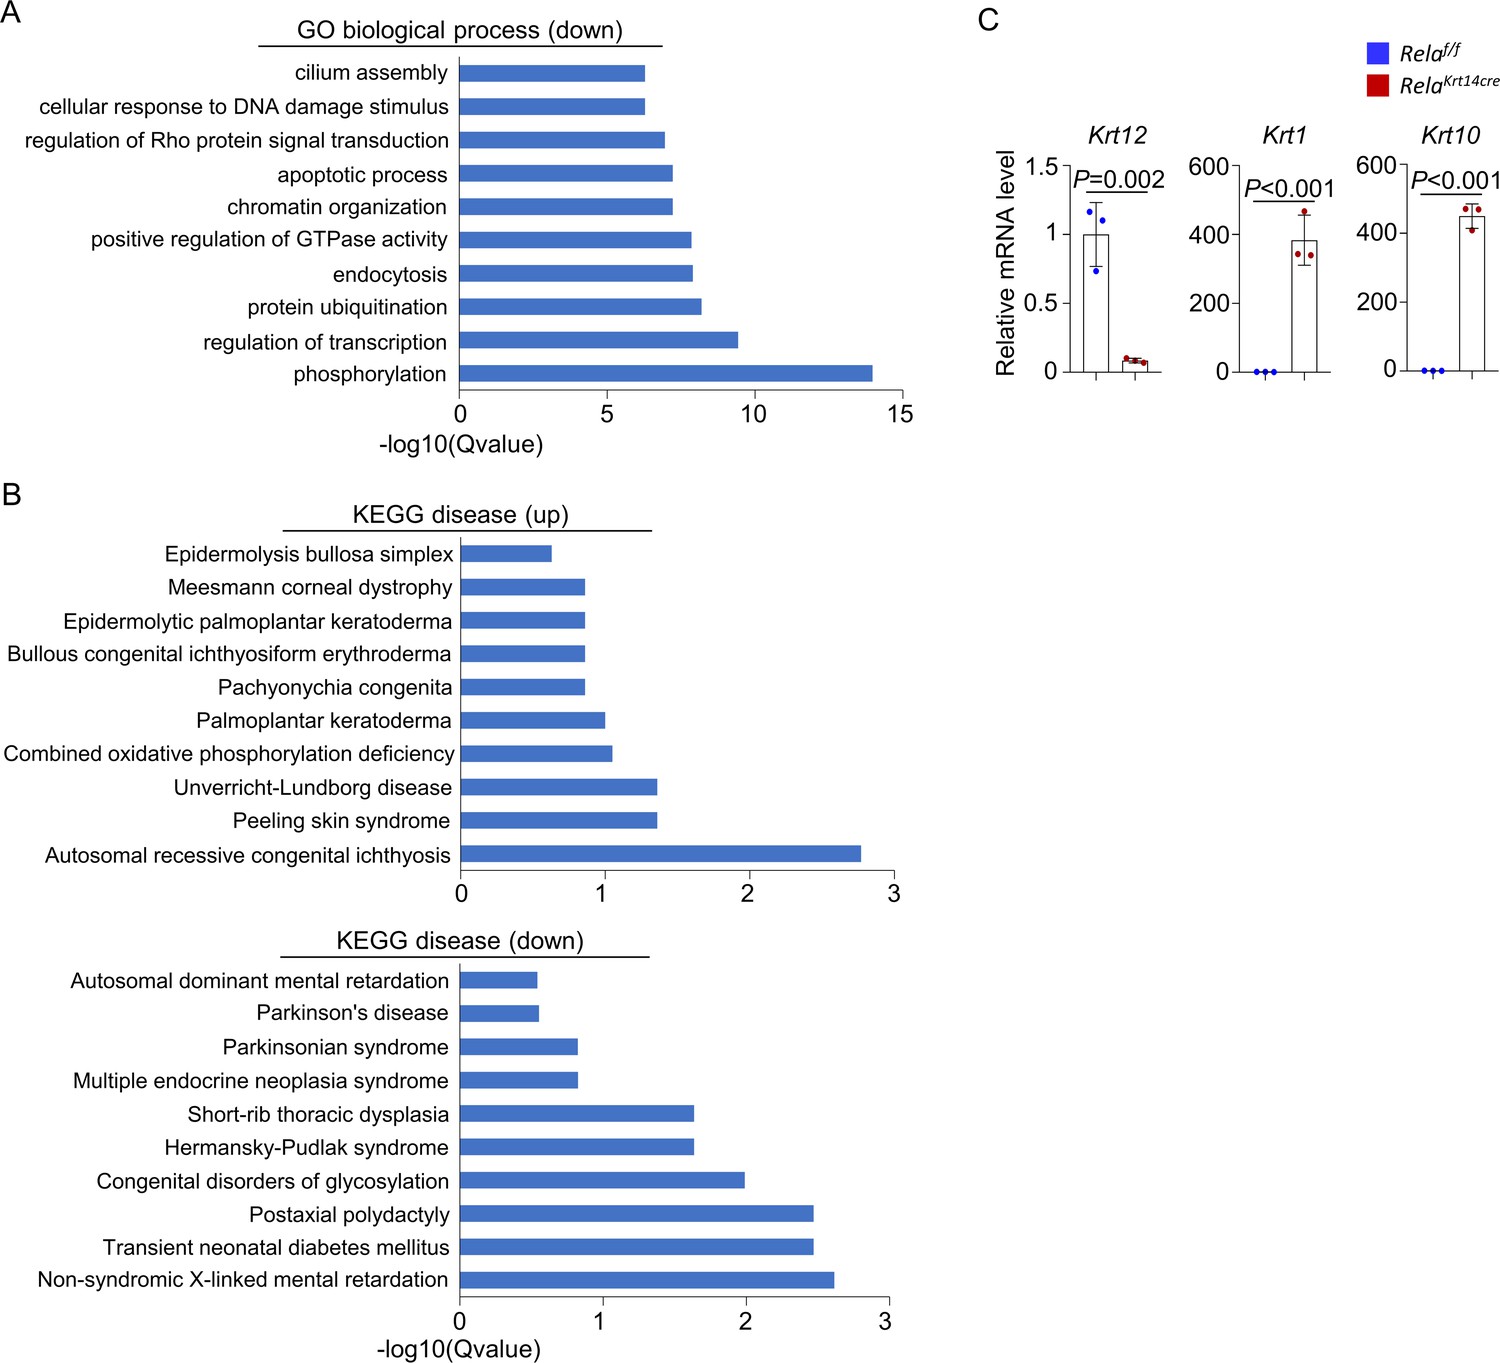
RNA-seq results of corneal samples of 6-month-old Krt14-Cre; Relaf/f and control mice.
(A) GO biological process analysis of downregulated genes in the corneal epithelial samples of the mutant mice. (B) KEGG disease analysis of up- or downregulated genes in the corneal epithelial samples of the mutant mice. (C) Quantitative PCR analysis of K12, K1, and K10 in corneal epithelial samples of 6-month-old Krt14-Cre; Relaf/f and control mice. n = 3 per group. Data was presented as mean ± SEM. Unpaired two-tailed Student’s t-test was applied in (C). p-value<0.05 was considered as statistically significant.
-
Figure 3—figure supplement 3—source data 1
Numeric data used in Figure 3—figure supplement 3.
- https://cdn.elifesciences.org/articles/67315/elife-67315-fig3-figsupp3-data1-v2.xlsx
Figure 3—figure supplement 4
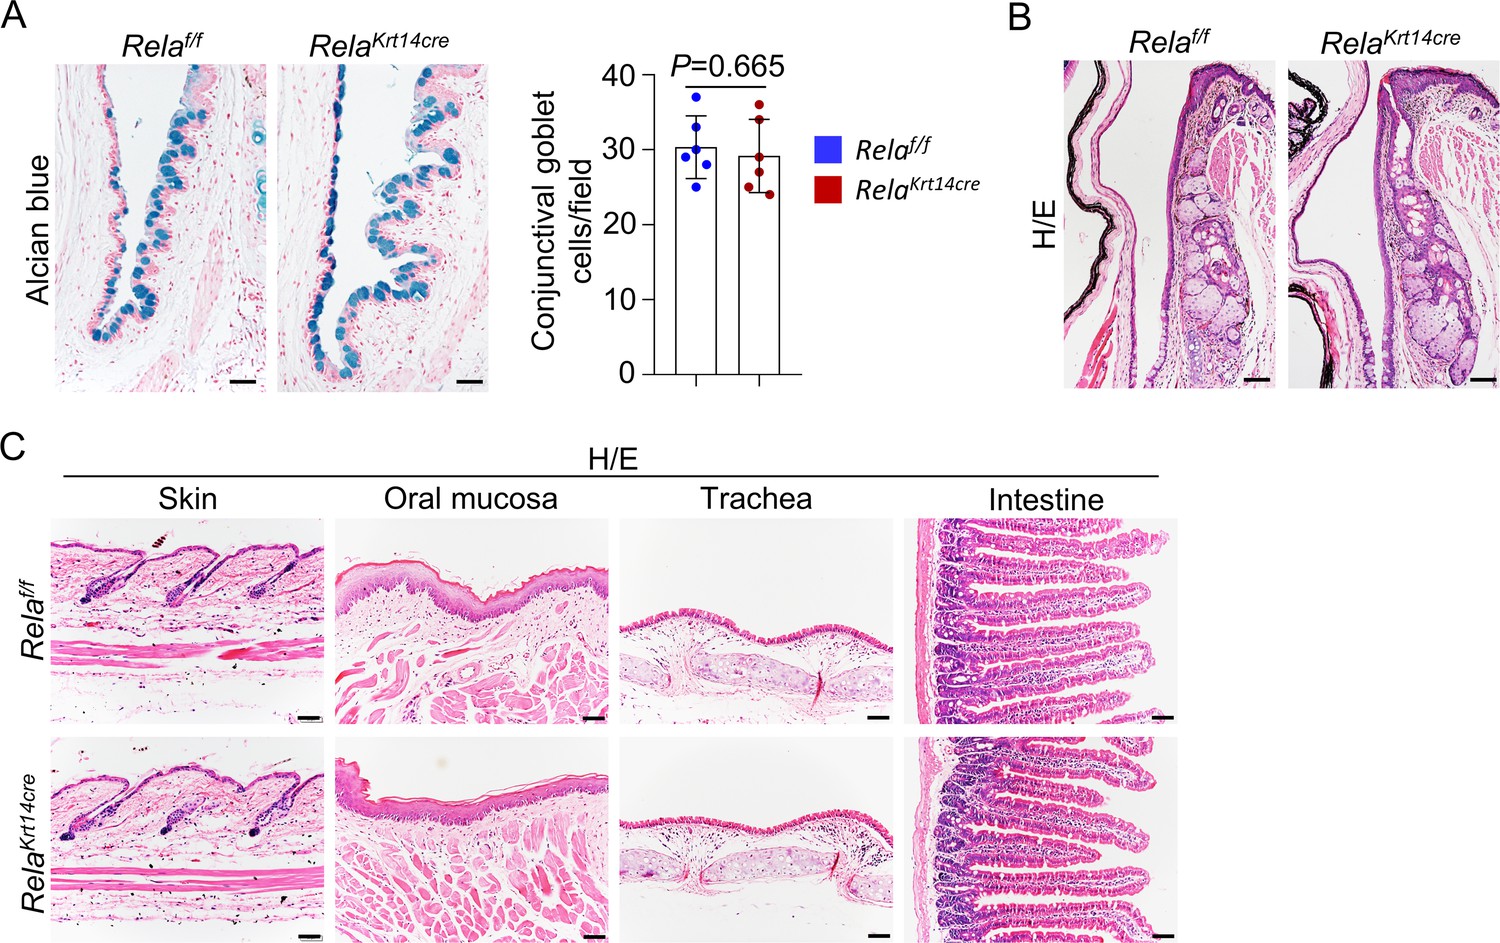
Other tissues marked by K14 were normal in 6-month-old Krt14-Cre; Relaf/f mice.
(A) Alcian blue staining showed that Rela ablation did not affect the structure of the conjunctiva. Right panel: quantitation data of goblet cells. Scale bar, 50 µm. n = 6 per group. (B) H/E staining showed that Rela ablation did not affect the structure of meibomian glands. Scale bar, 50 µm. (C) H/E staining showed that Rela ablation did not affect the structure of skin, oral mucosa, trachea, or small intestinal epithelial cells. Scale bar, 50 µm. Data was presented as mean ± SEM. Unpaired two-tailed Student’s t-test was applied in (A). p-value<0.05 was considered as statistically significant.
-
Figure 3—figure supplement 4—source data 1
Numeric data used in Figure 3—figure supplement 4.
- https://cdn.elifesciences.org/articles/67315/elife-67315-fig3-figsupp4-data1-v2.xlsx
Figure 4 with 2 supplements
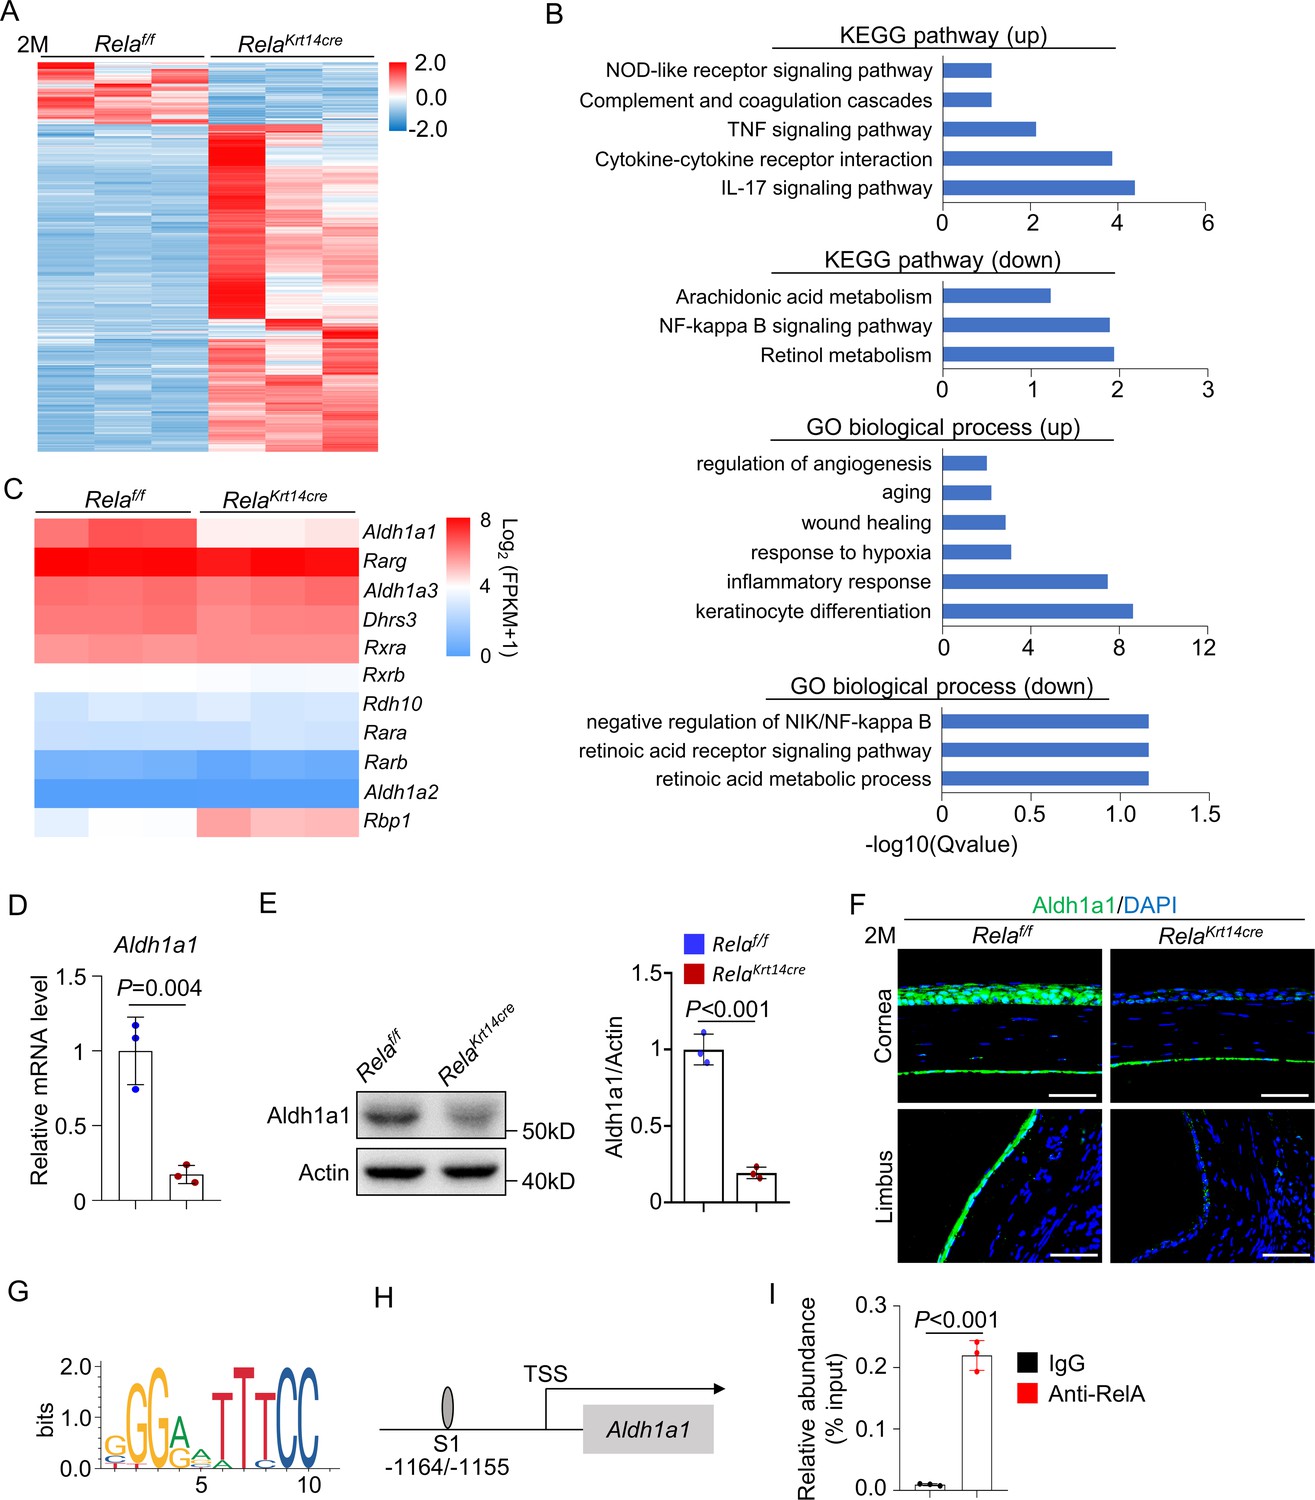
Rela ablation suppresses expression of retinoic acid synthesis enzyme Aldh1a1.
(A) Heatmap of transcriptomes of corneal epithelial samples of 2-month-old Krt14-Cre; Relaf/f and control mice. n = 3 per group. (B) KEGG analysis and GO analysis of corneal epithelial cells of 2-month-old Krt14-Cre; Relaf/f and control mice. Both upregulated (up) and downregulated (down) pathways or modules were presented. (C) Heatmap of retinoic acid synthesis genes in corneal epithelial cells of 2-month-old Krt14-Cre; Relaf/f mice compared to control mice. n = 3 per group. (D) Quantitative PCR showed downregulation of Aldh1a1 expression in corneal epithelial samples of Krt14-Cre; Relaf/f mice. n = 3 per group. (E) Representative western blot results showed that Aldh1a1 protein level was reduced in corneal samples of Krt14-Cre; Relaf/f mice. Right panel: quantitation data. n = 3 per group. (F) Representative immunostaining results showed downregulation of Aldh1a1 in Krt14-Cre; Relaf/f mouse cornea. Scale bar, 50 µm. (G) Sequence logos of 10-mer RelA-binding motif. (H) Schematic presentation of the putative RelA-binding site in the promoter region of Aldh1a1. (I) Quantitative PCR analysis of the immunoprecipitated DNA showed that Aldh1a1 promoter had a RelA-binding site. n = 3 per group. Data was presented as mean ± SEM. Unpaired two-tailed Student’s t-test was applied in (D, E, I). p-value<0.05 was considered as statistically significant.
-
Figure 4—source data 1
Numeric data used in Figure 4.
- https://cdn.elifesciences.org/articles/67315/elife-67315-fig4-data1-v2.xlsx
Figure 4—figure supplement 1
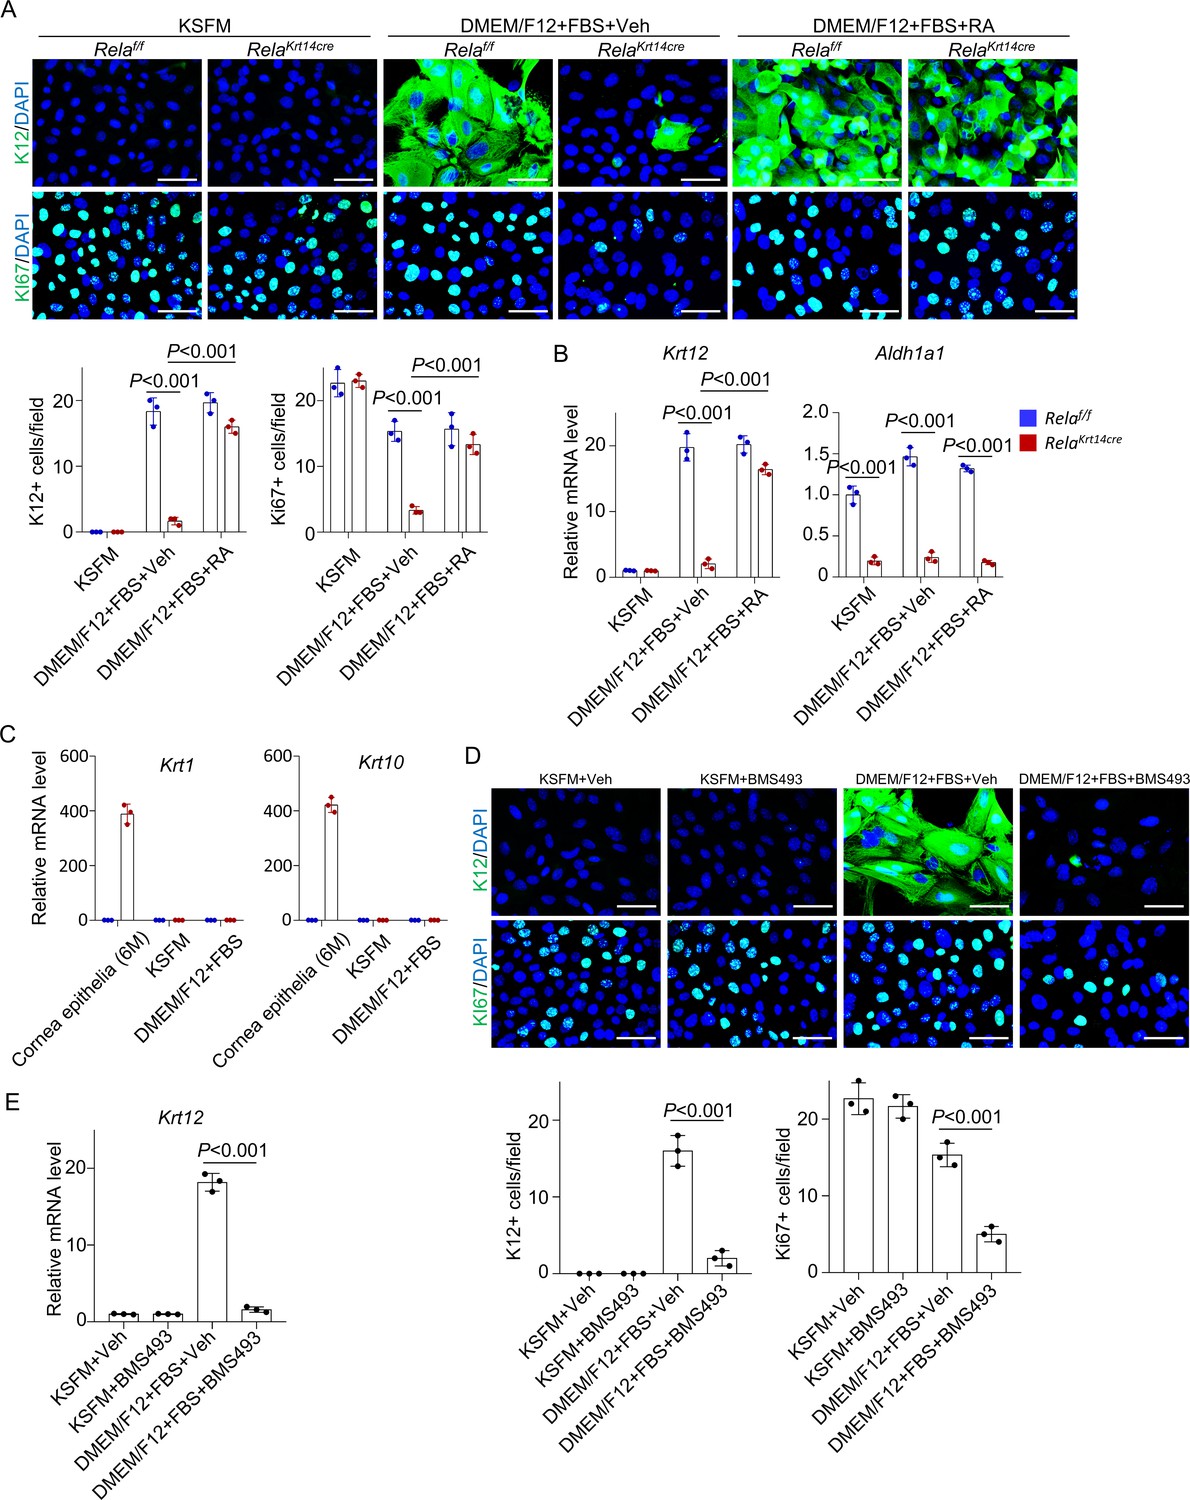
RelA was required for corneal epithelial cell proliferation and differentiation in vitro.
(A) Representative immunostaining showed defects of proliferation (PCNA) and differentiation (K12) of Rela-/- corneal epithelial cells when cultured in the differentiation medium, which were rescued by retinoic acid (RA). Scale bar, 50 µm. The lower panels are quantitation data. Five views were counted for each sample. n = 3 per group. (B) Quantitative PCR analysis confirmed the decrease of K12 and Aldh1a1 mRNA levels in Rela-/- epithelial cells, which were rescued by RA. n = 3 per group. (C) Quantitative PCR analysis showed the epidermal markers K1 and K10 were not detectable in Rela-/- or control cultures. Corneal samples of 6-month-old mutant mice were used as a positive control. n = 3 per group. (D) Representative immunostaining showed that addition of inhibitor for RA receptor (BMS493) to normal corneal epithelial cells blocked cell proliferation and differentiation. Scale bar, 50 µm. The lower panels were quantitation data. Five views were counted for each sample. n = 3 per group. (E) Quantitative PCR analysis confirmed the decrease in Krt12 mRNA levels after BMS493 treatment. n = 3 per group. Data was presented as mean ± SEM. Unpaired two-tailed Student’s t-test was applied in (C–E), and two-way ANOVA was applied in (A, B). p-value<0.05 was considered as statistically significant.
-
Figure 4—figure supplement 1—source data 1
Numeric data used in Figure 4—figure supplement 1.
- https://cdn.elifesciences.org/articles/67315/elife-67315-fig4-figsupp1-data1-v2.xlsx
Figure 4—figure supplement 2
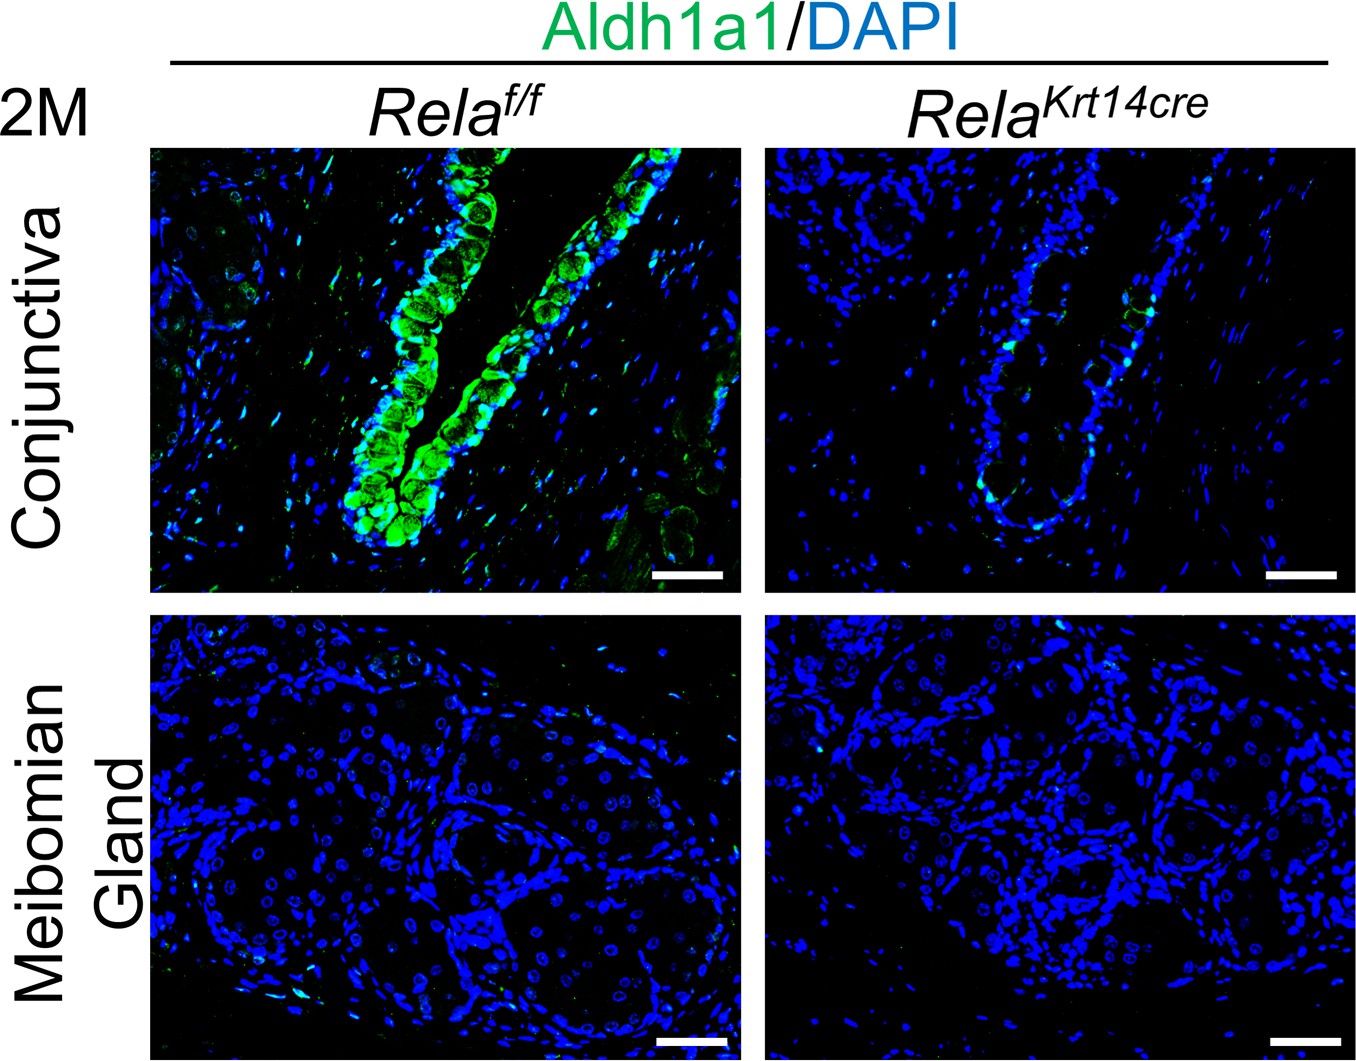
Effects of Rela ablation on Aldha1 expression in conjunctiva and meibomian glands.
Representative immunostaining results of 2-month-old mouse samples. Scale bar, 50 µm.
Figure 5 with 4 supplements
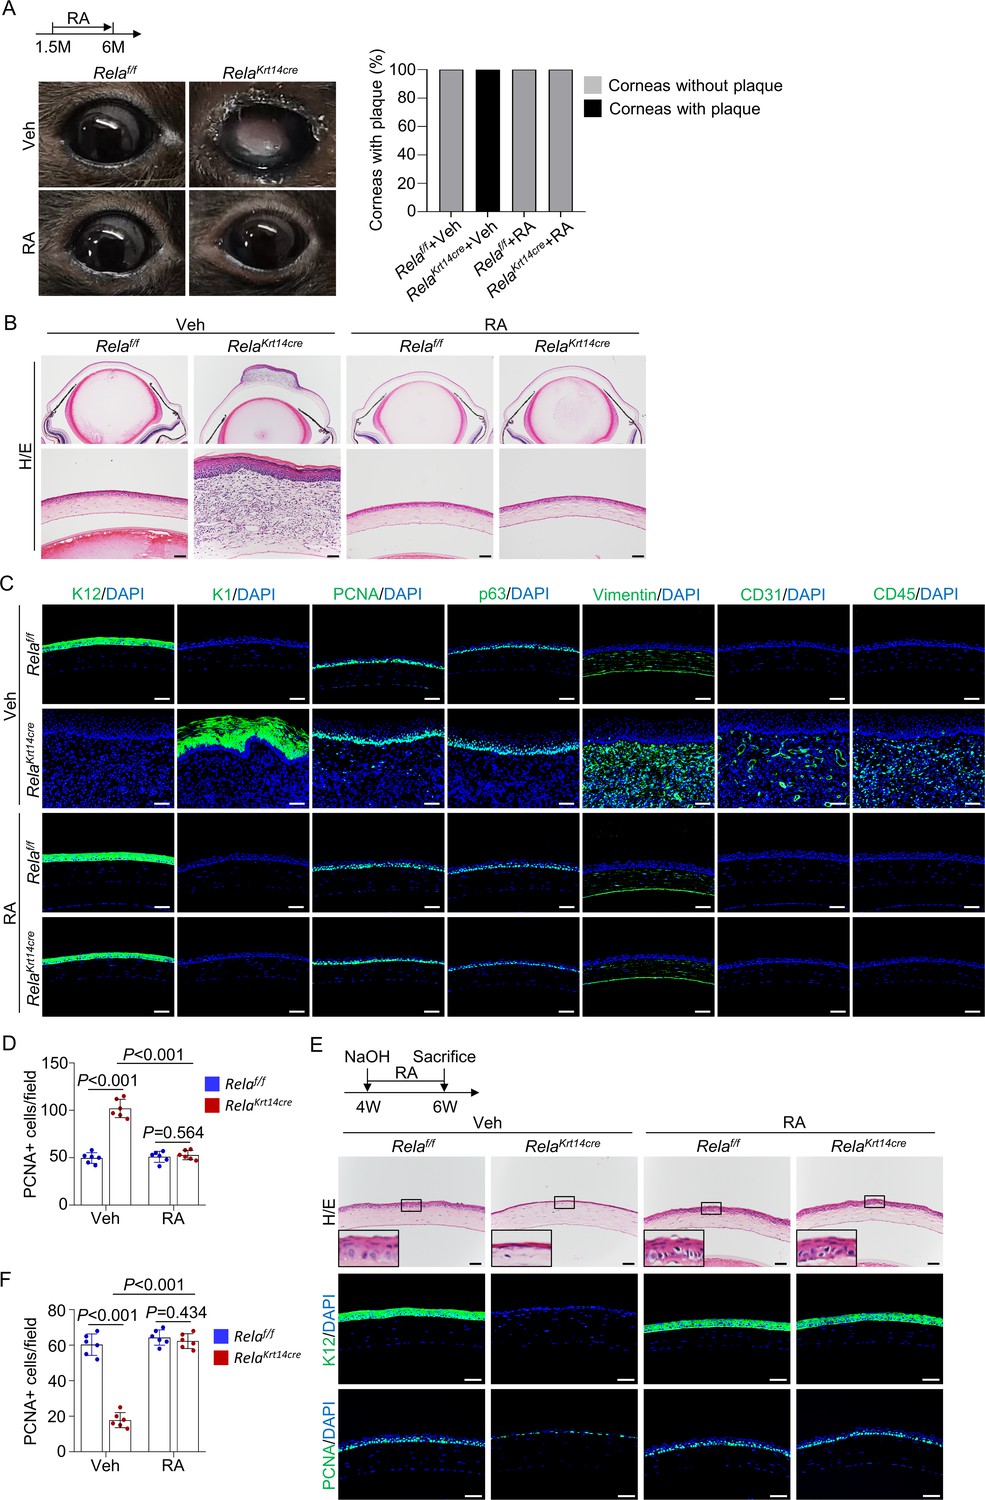
Retinoic acid (RA) diminishes homeostatic and regenerative defects caused by Rela ablation.
(A) Representative images showed that RA blocked Rela ablation-induced plaque formation in Krt14-Cre; Relaf/f mice. Upper panel: diagram showing the time of RA administration and mouse euthanization. Right panel: quantitation data. n = 10 per group. (B) Representative H/E staining results showed restoration of corneal structures by RA in Krt14-Cre; Relaf/f mice. Scale bar, 50 µm. (C) Representative immunostaining results showed that epidermal fate conversion (K1 and K12), overproliferation (PCNA and p63), stromal remodeling (vimentin), angiogenesis (CD31), and leukocyte infiltration (CD45) were all diminished by RA administration. Scale bar, 50 µm. (D) The percentage of PCNA+ proliferating cells. n = 6 per group. (E) Representative histological results showed that RA rescued corneal regeneration defects in Krt14-Cre; Relaf/f mice. Upper panel: diagram showing the time of injury and RA administration. (F) The percentage of PCNA+ proliferating cells. n = 6 per group. Data was presented as mean ± SEM. Two-way ANOVA was applied in (D, F). p-value<0.05 was considered as statistically significant.
-
Figure 5—source data 1
Numeric data used in Figure 5.
- https://cdn.elifesciences.org/articles/67315/elife-67315-fig5-data1-v2.xlsx
Figure 5—figure supplement 1
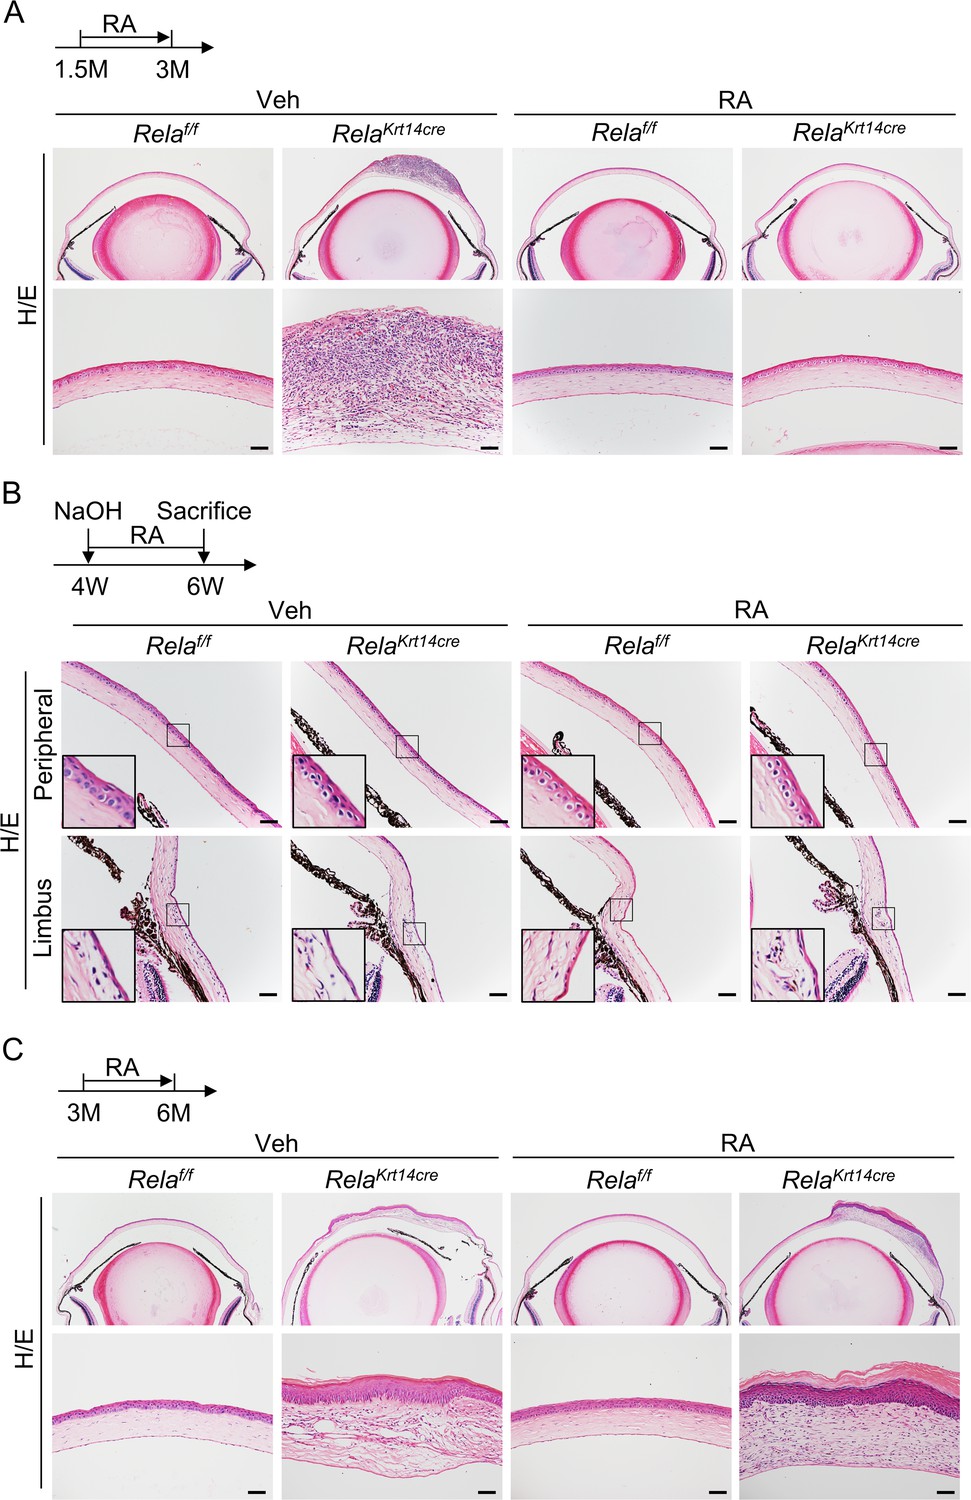
Retinoic acid (RA) rescued early epithelial defects but not stroma remodeling or epithelia metaplasia.
(A) Representative histological results showed that RA rescued thinning and disruption of corneal epithelial layer after 1.5 months of treatment. Upper panel: diagram showing the time of RA administration and mouse euthanization. Scale bar, 50 µm. (B) Representative histological analysis results of the peripheral and limbus region in mice with alkaline burn. Scale bar, 50 µm. (C) Representative histological analysis results showed that RA did not rescue stromal remodeling or epidermal metaplasia of Krt14-Cre; Relaf/f mice if applied at 3 months of age. Upper panel: diagram showing the time of RA administration and mouse euthanization. Scale bar, 50 µm.
Figure 5—figure supplement 2
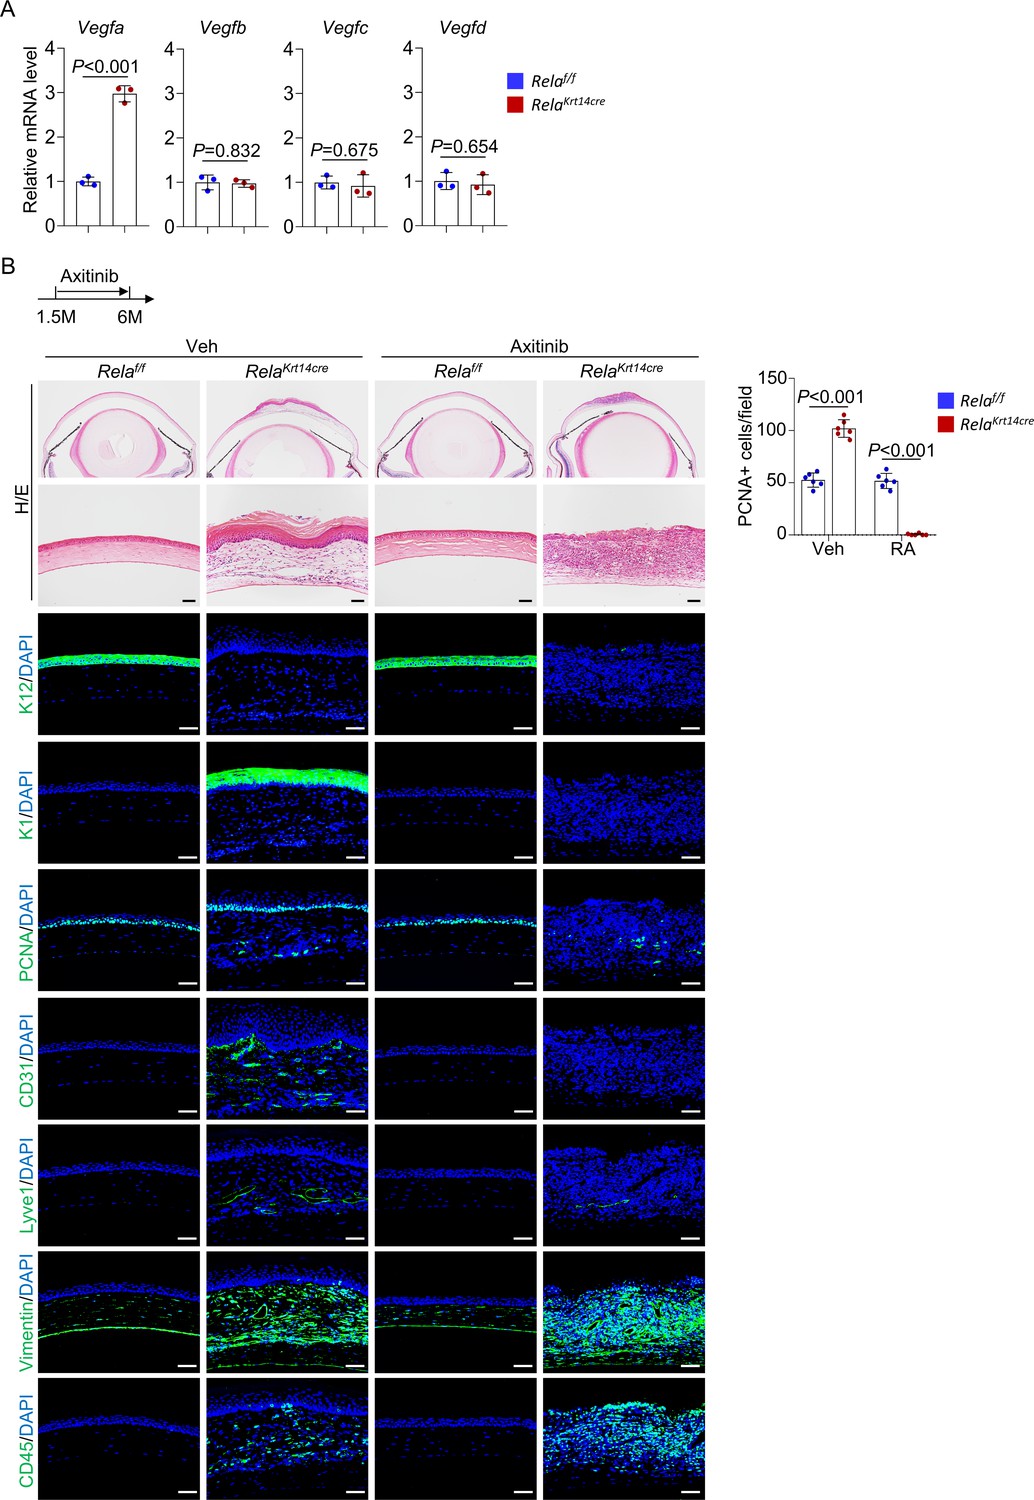
Axitinib alleviates epidermal metaplasia and plaque formation in Krt14-Cre; Relaf/f mice.
(A) Quantitative PCR analysis revealed that Vegfa but no other Vegf molecules was increased in corneal stroma samples of Krt14-Cre; Relaf/f mice. n = 3 per group. (B) Representative histological analyses indicated that axitinib diminished angiogenesis (CD31), epithelial cell overproliferation (PCNA), and corneal epithelial metaplasia (K1) although the corneal epithelial layer remained thinner (K12). The diluent was used as control (Veh). Scale bar, 50 µm. Right panel: quantitation data of PCNA+ cells. n = 6 per group. Data was presented as mean ± SEM. Unpaired two-tailed Student’s t-test was applied in (A, B). p-value<0.05 was considered as statistically significant.
-
Figure 5—figure supplement 2—source data 1
Numeric data used in Figure 5—figure supplement 2.
- https://cdn.elifesciences.org/articles/67315/elife-67315-fig5-figsupp2-data1-v2.xlsx
Figure 5—figure supplement 3
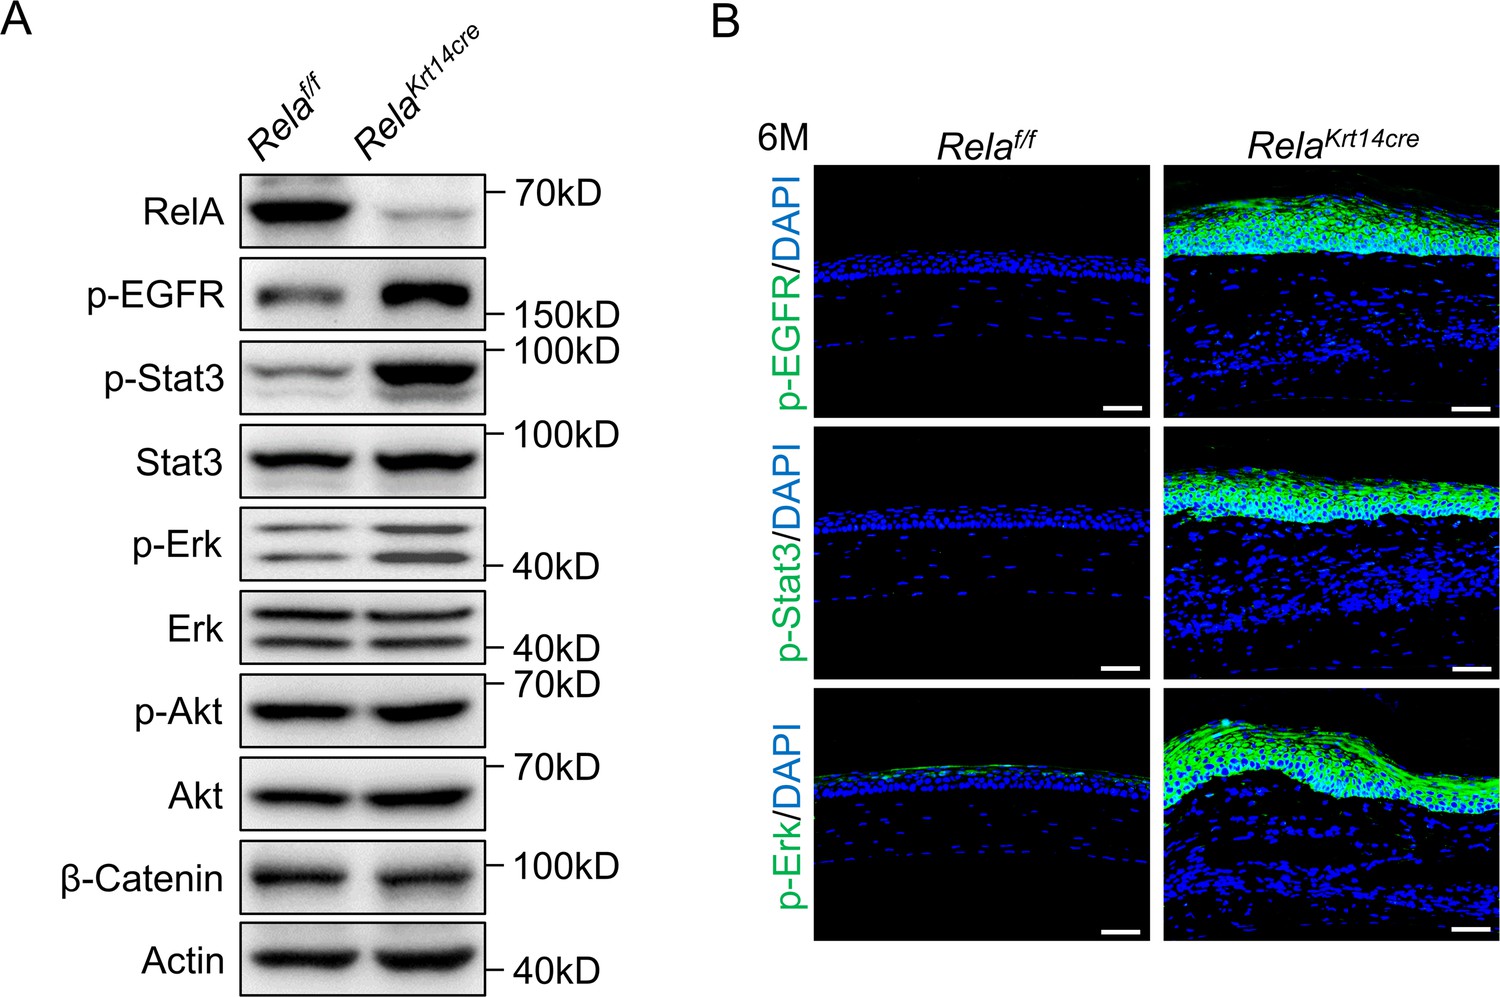
Enhanced activation of EGFR, Erks, and Stat3 in the metaplastic corneal tissues.
(A) Representative western blot results showed enhanced activation of the Erks, Stat3, and EGFR but not Akt or β-catenin in corneal samples of 6-month-old Krt14-Cre; Relaf/f mice. (B) Representative immunostaining results confirmed the activation of Erk, Stat3, and EGFR in the metaplastic cells of 6-month-old Krt14-Cre; Relaf/f mice. Scale bar, 50 µm.
Figure 5—figure supplement 4
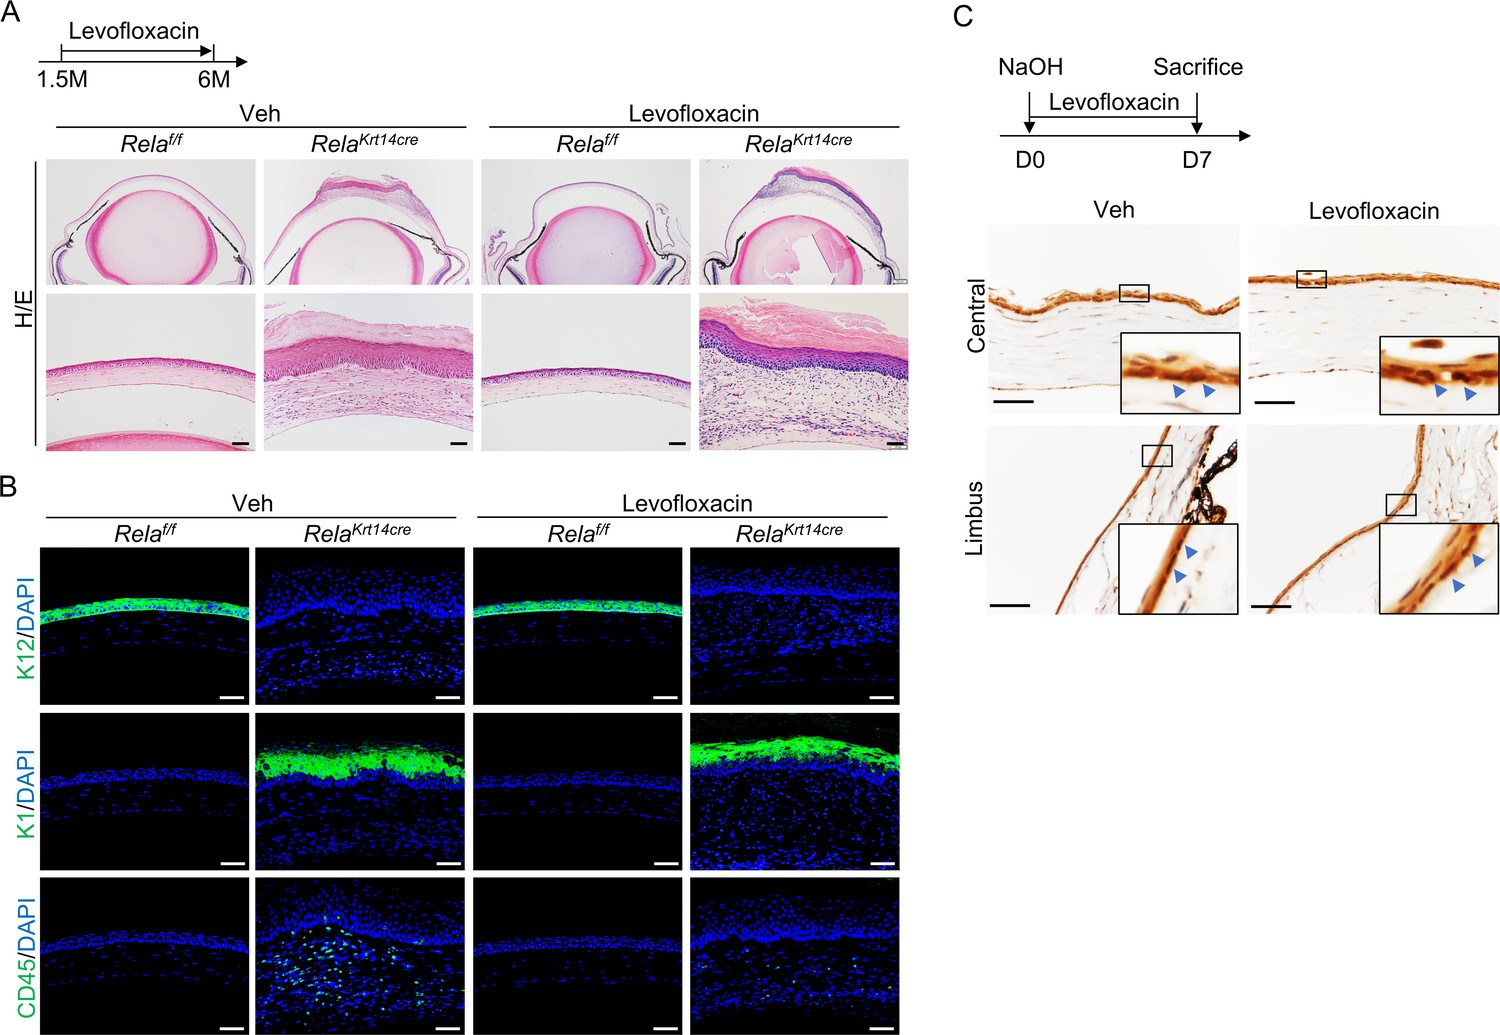
Antibiotic levofloxacin did not rescue Rela ablation-induced corneal phenotypes.
(A) Representative H/E staining showed that levofloxacin could not rescue the corneal defects of Krt14-Cre; Relaf/f mice. Upper panel: diagram showing the time of levofloxacin administration and mouse euthanization. Scale bar, 50 µm. (B) Representative immunostaining showed that levofloxacin diminished CD45+ immune cell infiltration but did not affect epidermal cell conversion or plaque formation in Krt14-Cre; Relaf/f mice. Scale bar, 50 µm. (C) Representative immunohistochemical staining showed that levofloxacin did not affect NF-κB activation in epithelial cells during cornea regeneration. Scale bar, 50 µm.
Figure 6 with 2 supplements
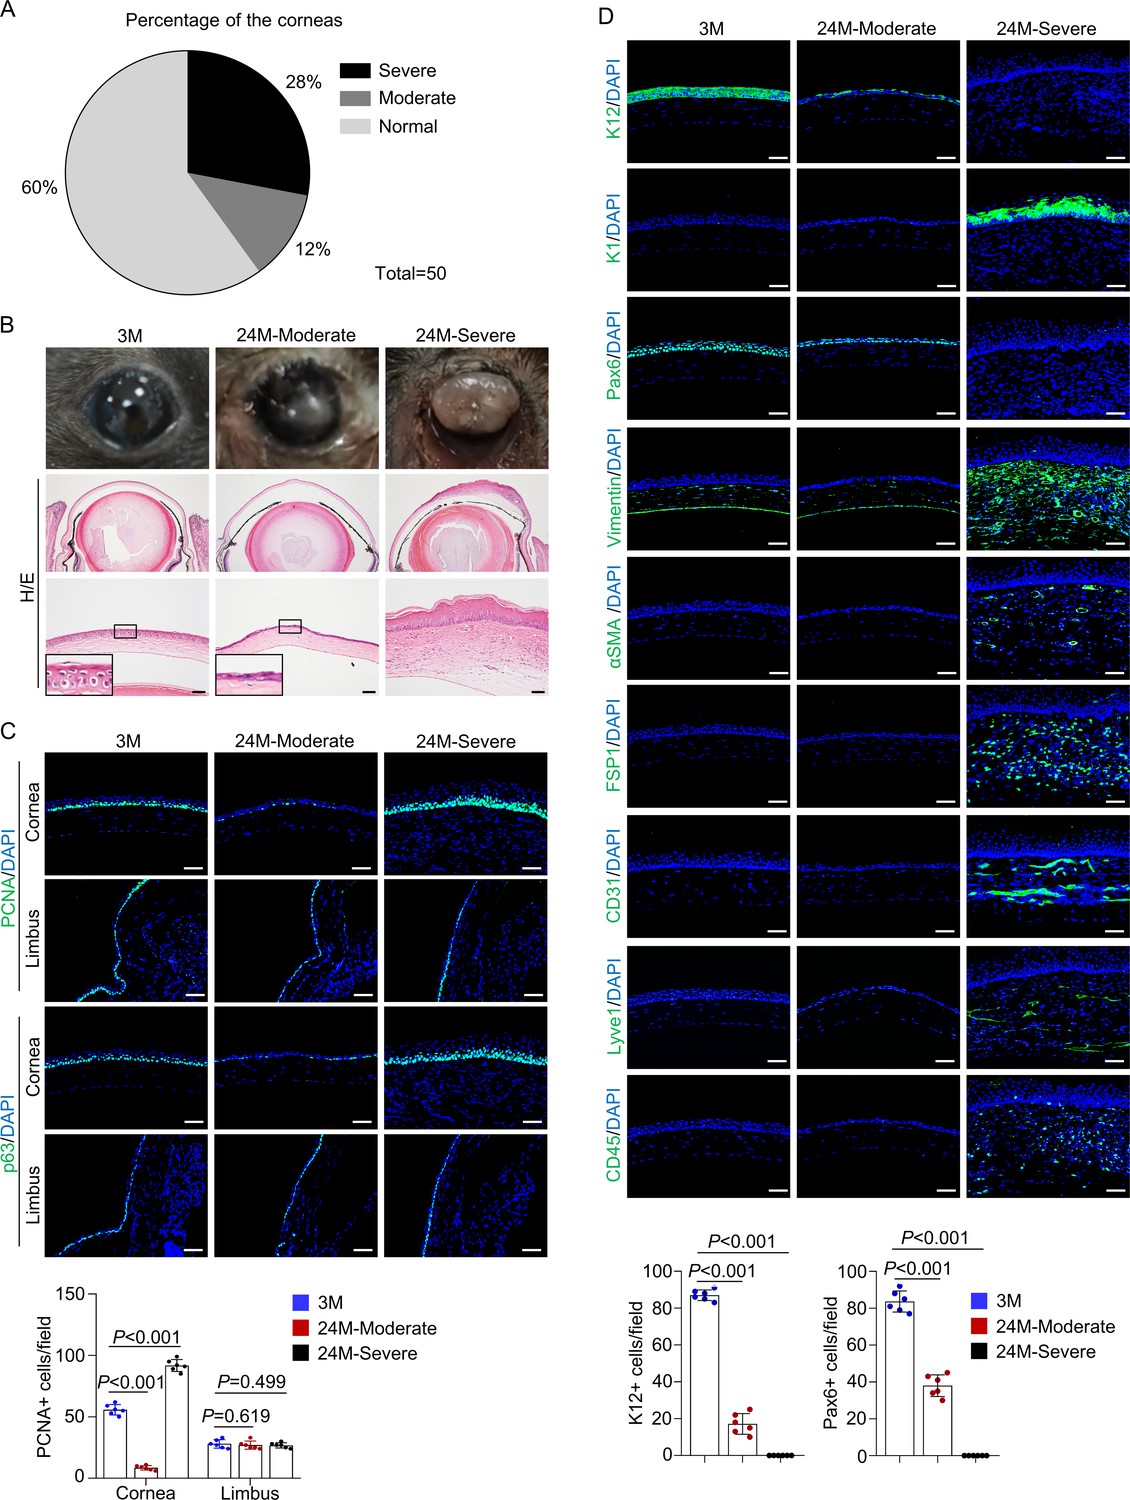
Natural aging produces similar corneal phenotypes as Krt14-Cre; Relaf/f mice.
(A) The percentages of mice showing corneal epithelial layer thinning (moderate) and plaque formation (severe) at 24 months of age compared to young mice. n = 50. (B) Representative histological images showed thinning of corneal epithelial layer or overgrowth of corneal epithelial layer in old mice. Scale bar, 50 µm. (C) Representative immunostaining results showed alterations in the number of PCNA+ cells and p63+ cells while the limbus showed no alteration in 24-month-old mice (with cornea defects). Scale bar, 50 µm. Lower panel: quantitation data of PCNA+ cells. n = 6 per group. (D) Representative immunostaining results showed alterations in the expression of differentiation marker K12, Pax6, epidermal marker K1, stromal cell marker vimentin, FSP1 and αSMA, blood vessel marker CD31, lymphatic vessel marker Lyve1, and immune cell marker CD45 in 24-month-old mice (with plaque formation). Scale bar, 50 µm. Lower panel: quantitation data. n = 6 per group. Data was presented as mean ± SEM. Unpaired two-tailed Student’s t-test was applied in (C, D). p-value<0.05 was considered as statistically significant.
-
Figure 6—source data 1
Numeric data used in Figure 6.
- https://cdn.elifesciences.org/articles/67315/elife-67315-fig6-data1-v2.xlsx
Figure 6—figure supplement 1
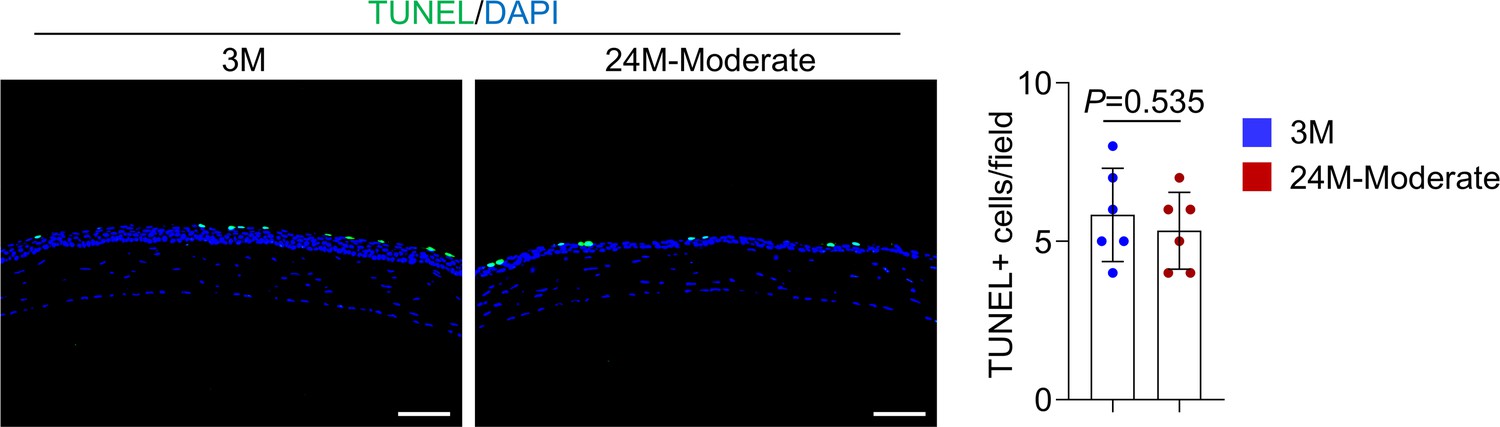
Apoptosis rate was not affected in the cornea of 24-month-old mice.
TUNEL analysis showed that apoptosis rate was not affected in the cornea of 24-month-old mice compared to young mice. Right panel: quantitation data. Scale bar, 50 µm. n = 6 per group. Data was presented as mean ± SEM. Unpaired two-tailed Student’s t-test was applied in Figure 6—figure supplement 2. p-value<0.05 was considered as statistically significant.
-
Figure 6—figure supplement 1—source data 1
Numeric data used in Figure 6—figure supplement 1.
- https://cdn.elifesciences.org/articles/67315/elife-67315-fig6-figsupp1-data1-v2.xlsx
Figure 6—figure supplement 2
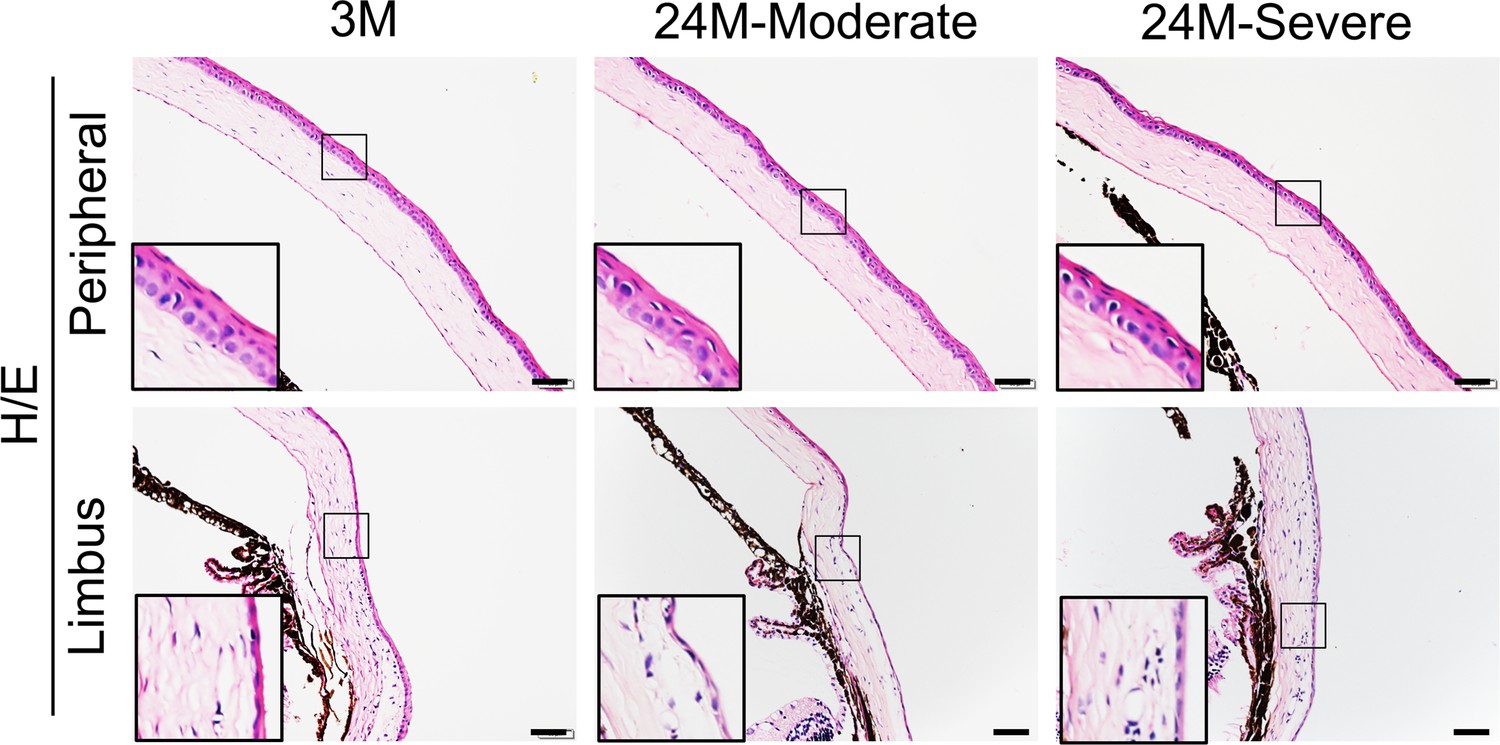
The peripheral and limbal regions appeared unaltered in aged mice.
Representative H/E staining results showed no changes in peripheral and limbal structures of aged mice. Scale bar, 50 µm.
Figure 7 with 1 supplement

Retinoic acid (RA) supplementation prevents development of aging-like corneal phenotypes.
(A) Representative western blot results showed decreased levels of RelA, p-RelA, and Aldh1a1 in the corneal samples of 24-month-old mice (with thinner epithelial layer) compared to young mice. Right panel: quantitation data. n = 3 per group. (B) Quantitative PCR analysis confirmed the decrease of Rela and Aldh1a1 mRNA levels in the corneal epithelial samples of aged mice. n = 3 per group. (C) Representative immunohistochemical staining showed that the levels of RelA were decreased in the cornea of 24-month-old mice. Scale bar, 50 µm. (D) Representative immunostaining showed that levels of Aldh1a1 were drastically reduced in corneal samples of aged mice. Scale bar, 50 µm. (E) Administration of RA to 20-month-old normal mice alleviated the aging-related corneal phenotypes. n = 20 per group. (F) Representative histological results showed that RA prevented corneal defects in aged mice. Scale bar, 50 µm. Right panel: quantitation data. n = 6 per group. Data was presented as mean ± SEM. Unpaired two-tailed Student’s t-test was applied in (A, B), and two-way ANOVA was applied in (F). p-value<0.05 was considered as statistically significant.
-
Figure 7—source data 1
Numeric data used in Figure 7.
- https://cdn.elifesciences.org/articles/67315/elife-67315-fig7-data1-v2.xlsx
Figure 7—figure supplement 1
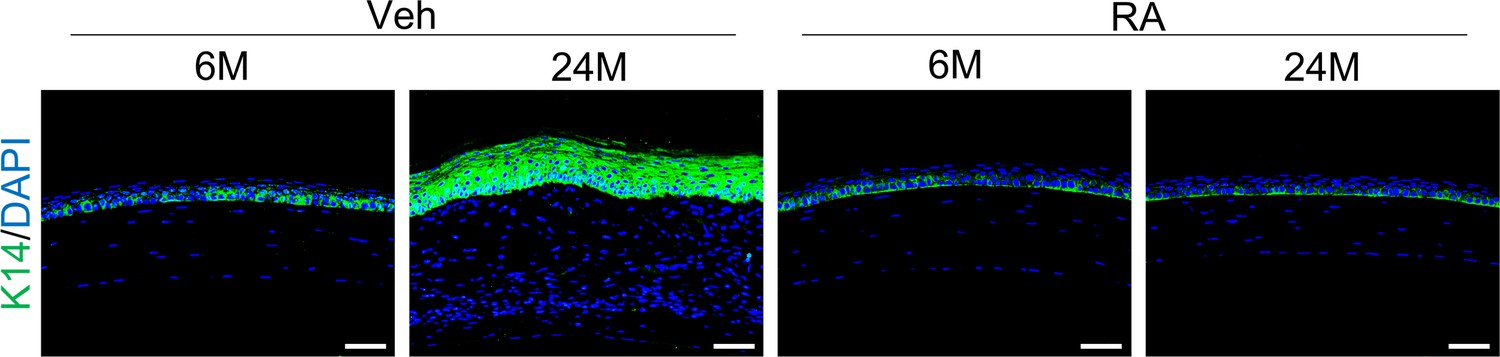
Retinoic acid (RA) prevented increase of K14 in aged mice.
Representative immunostaining showed that RA prevented increase of K14 in aged mice. Scale bar, 50 µm.
Tables
Key resources table
| Reagent type (species) or resource | Designation | Source or reference | Identifiers | Additional information |
|---|---|---|---|---|
| Genetic reagent (Mus musculus) | Relaf/f | The Jackson Laboratory | RRID:IMSR_JAX:024342 | Stock No: 024342 |
| Genetic reagent (M. musculus) | Krt14-cre | The Jackson Laboratory | RRID:IMSR_JAX:004782 | Stock No: 004782 |
| Genetic reagent (M. musculus) | Prrx1-cre | The Jackson Laboratory | RRID:IMSR_JAX:005584 | Stock No: 005584 |
| Genetic reagent (M. musculus) | ROSA26fs-tdTomato | The Jackson Laboratory | RRID:IMSR_JAX:007914 | Stock No: 007914 |
| Antibody | Rabbit monoclonal to K12 | Abcam | Cat# ab185627, RRID:AB_2889825 | IF(1:200) |
| Antibody | Rabbit monoclonal to vimentin | Abcam | Cat# ab92547, RRID:AB_10562134 | IF(1:100) |
| Antibody | Rabbit polyclonal to ɑSMA | Abcam | Cat# ab5694, RRID:AB_2223021 | IF(1:100) |
| Antibody | Rat monoclonal to CD31 | Abcam | Cat# ab56299, RRID:AB_940884 | IF(1:100) |
| Antibody | Rabbit polyclonal to CD45 | Abcam | Cat# ab10558, RRID:AB_442810 | IF(1:100) |
| Antibody | Rabbit monoclonal to p63 | Abcam | Cat# ab124762, RRID:AB_10971840 | IF(1:100) |
| Antibody | Rabbit monoclonal to FSP1 | Abcam | Cat# ab197896, RRID:AB_2728774 | IF(1:100) |
| Antibody | Rabbit monoclonal to p-EGF receptor (Tyr1068) | Cell Signaling Technology | Cat# 3777, RRID:AB_2096270 | IF(1:100) WB(1:1000) |
| Antibody | Rabbit monoclonal to p-Stat3 (Tyr705) | Cell Signaling Technology | Cat# 9145, RRID:AB_2491009 | IF(1:100) WB(1:1000) |
| Antibody | Mouse monoclonal to Stat3 | Cell Signaling Technology | Cat# 9139, RRID:AB_331757 | WB(1:1000) |
| Antibody | Rabbit monoclonal to p-Erk1/2 (Thr202/Tyr204) | Cell Signaling Technology | Cat# 9101, RRID:AB_331646 | IF(1:100) WB(1:1000) |
| Antibody | Mouse monoclonal to Erk1/2 | Cell Signaling Technology | Cat# 9107, RRID:AB_10695739 | WB(1:1000) |
| Antibody | Rabbit monoclonal to RelA | Cell Signaling Technology | Cat# 8242, RRID:AB_10859369 | IHC(1:100) CHIP(1:100) |
| Antibody | Rabbit monoclonal to p-RelA (Ser536) | Cell Signaling Technology | Cat# 3033, RRID:AB_331284 | WB(1:1000) |
| Antibody | Rabbit monoclonal to RelA | Cell Signaling Technology | Cat# 4764, RRID:AB_823578 | WB(1:1000) |
| Antibody | Rabbit monoclonal to p-Akt (Ser473) | Cell Signaling Technology | Cat# 4060, RRID:AB_2315049 | WB(1:1000) |
| Antibody | Rabbit monoclonal to Akt | Cell Signaling Technology | Cat# 9272, RRID:AB_329827 | WB(1:1000) |
| Antibody | Rabbit monoclonal to p-IKKɑ/β (Ser176/180) | Cell Signaling Technology | Cat# 2697, RRID:AB_2079382 | WB(1:1000) |
| Antibody | Rabbit polyclonal to IKKɑ | Cell Signaling Technology | Cat# 2682, RRID:AB_331626 | WB(1:1000) |
| Antibody | Rabbit polyclonal to K1 | BioLegend | Cat# 905601, RRID:AB_2565051 | IF(1:200) |
| Antibody | Rabbit polyclonal to Pax6 | BioLegend | Cat# 901302, RRID:AB_2749901 | IF(1:200) |
| Antibody | Mouse monoclonal to LYVE-1 | Reliatech | Cat#103PA50AG, RRID:AB_2876870 | IF(1:100) |
| Antibody | Rabbit polyclonal to ALDH1A1 | Proteintech | Cat# 15910-1-AP, RRID:AB_2305276 | IF(1:100) |
| Antibody | Rabbit polyclonal to Ki-67 | Thermo Fisher Scientific | Cat# PA5-19462, RRID:AB_10981523 | IF(1:100) |
| Antibody | Mouse monoclonal to PCNA | Santa Cruz Biotechnology | Cat# sc-56, RRID:AB_628110 | IF(1:100) |
| Antibody | Rabbit polyclonal to β-catenin | Santa Cruz Biotechnology | Cat# sc-7199, RRID:AB_634603 | WB(1:1000) |
| Antibody | Mouse monoclonal to β-actin | Santa Cruz Biotechnology | Cat# sc-47778, RRID:AB_626632 | WB(1:5000) |
| Antibody | Anti-rabbit IgG, HRP-linked Antibody | Cell Signaling Technology | Cat# 7074, RRID:AB_2099233 | WB(1:5000) |
| Antibody | Anti-mouse IgG, HRP-linked Antibody | Cell Signaling Technology | Cat# 7076, RRID:AB_330924 | WB(1:5000) |
| Antibody | Goat anti-Rabbit IgG Secondary Antibody, Alexa Fluor488 | Thermo Fisher Scientific | Cat# A-11008, RRID:AB_143165 | IF(1:200) |
| Antibody | Goat anti-Mouse IgG Secondary Antibody, Alexa Fluor488 | Thermo Fisher Scientific | Cat# A-11001, RRID:AB_2534069 | IF(1:200) |
| Antibody | Goat anti-Rat IgG Secondary Antibody, Alexa Fluor488 | Thermo Fisher Scientific | Cat# A-11006, RRID:AB_2534074 | IF(1:200) |
| Sequence-based reagent | RT-qPCR primers | This paper | See Table 1 | |
| Sequence-based reagent | CHIP primers | This paper | See Table 2 | |
| Commercial assay or kit | PrimeScript RT reagent Kit | TAKARA | RR037A | |
| Commercial assay or kit | Fast Start Universal SYBR Green Master kit | Roche | 04887352001 | |
| Commercial assay or kit | SimpleChIP Enzymatic Chromatin IP Kit | Cell Signaling Technology | #9002 | |
| Chemical compound, drug | Retinoic acid | Sigma-Aldrich | Cat# R2625 | |
| Chemical compound, drug | BMS493 | Sigma-Aldrich | Cat# B6688 | |
| Chemical compound, drug | Axitinib | Selleck Chemicals | Cat# S1005 | |
| Chemical compound, drug | 0.5% Levofloxacin Eye Drops | Santen | N/A | |
| Chemical compound, drug | EZ-Link Sulfo-NHS-LC-Biotin | Thermo Fisher Scientific | Cat# A39257 | |
| Software, algorithm | ImageJ | (http://imagej.nih.gov/ij/) | ||
| Software, algorithm | GraphPad Prism 8 | https://www.graphpad.com | RRID:SCR_015807 | Version 8 |
Table 1
Quantitative PCR primer sequences used in the study.
| Gene | Forward primer | Reverse primer |
|---|---|---|
| Krt12 | CATGGCTGAGCAAAATCGGAA | CAGGGACGACTTCATGGCG |
| Rela | AGGCTTCTGGGCCTTATGTG | TGCTTCTCTCGCCAGGAATAC |
| Aldh1a1 | ATACTTGTCGGATTTAGGAGGCT | GGGCCTATCTTCCAAATGAACA |
| Krt1 | TGGGAGATTTTCAGGAGGAGG | GCCACACTCTTGGAGATGCTC |
| Krt10 | CGAAGAGCTGGCCTACCTAAA | GGGCAGCGTTCATTTCCAC |
| Vegfa | GCACATAGGAGAGATGAGCTTCC | CTCCGCTCTGAACAAGGCT |
| Vegfb | GCCAGACAGGGTTGCCATAC | GGAGTGGGATGGATGATGTCAG |
| Vegfc | GAGGTCAAGGCTTTTGAAGGC | CTGTCCTGGTATTGAGGGTGG |
| Vegfd | TTGAGCGATCATCCCGGTC | GCGTGAGTCCATACTGGCAAG |
Table 2
Primer sequences used for chromatin immunoprecipitation assays.
| Gene | Predictive binding site | Forward sequence | Reverse sequence |
|---|---|---|---|
| Aldh1a1 | S1: GCGAATTTCC | AACATCTTGGGGTGCATTGC | TAGCTAGGGGAGGAACAGGG |
| S2: GGGACTTTTC | ATGATTCACAAGTGCACGCA | CAGAATCTTCGCATTGTCTTTGT | |
| S3: GGGATCTTCC | TGTTTGGGAATTGGCCTGAG | AGCCTGCTTCTCTCTCTCTC |
Additional files
Download links
A two-part list of links to download the article, or parts of the article, in various formats.
Downloads (link to download the article as PDF)
Open citations (links to open the citations from this article in various online reference manager services)
Cite this article (links to download the citations from this article in formats compatible with various reference manager tools)
Canonical NF-κB signaling maintains corneal epithelial integrity and prevents corneal aging via retinoic acid
eLife 10:e67315.
https://doi.org/10.7554/eLife.67315


