Probing the effect of clustering on EphA2 receptor signaling efficiency by subcellular control of ligand-receptor mobility
- Multiscale Research Institute of Complex Systems, Fudan University, China
- Department of Chemistry, University of California, Berkeley, United States
- Department of Biochemistry and Molecular Biology, The University of Texas Medical Branch at Galveston, United States
- Mechanobiology Institute, National University of Singapore, Singapore
- College of Health and Life Sciences, Hamad Bin Khalifa University, Qatar
- Department of Cell and Developmental Biology, Sackler Faculty of Medicine, Tel Aviv University, Israel
Figures
Figure 1 with 2 supplements
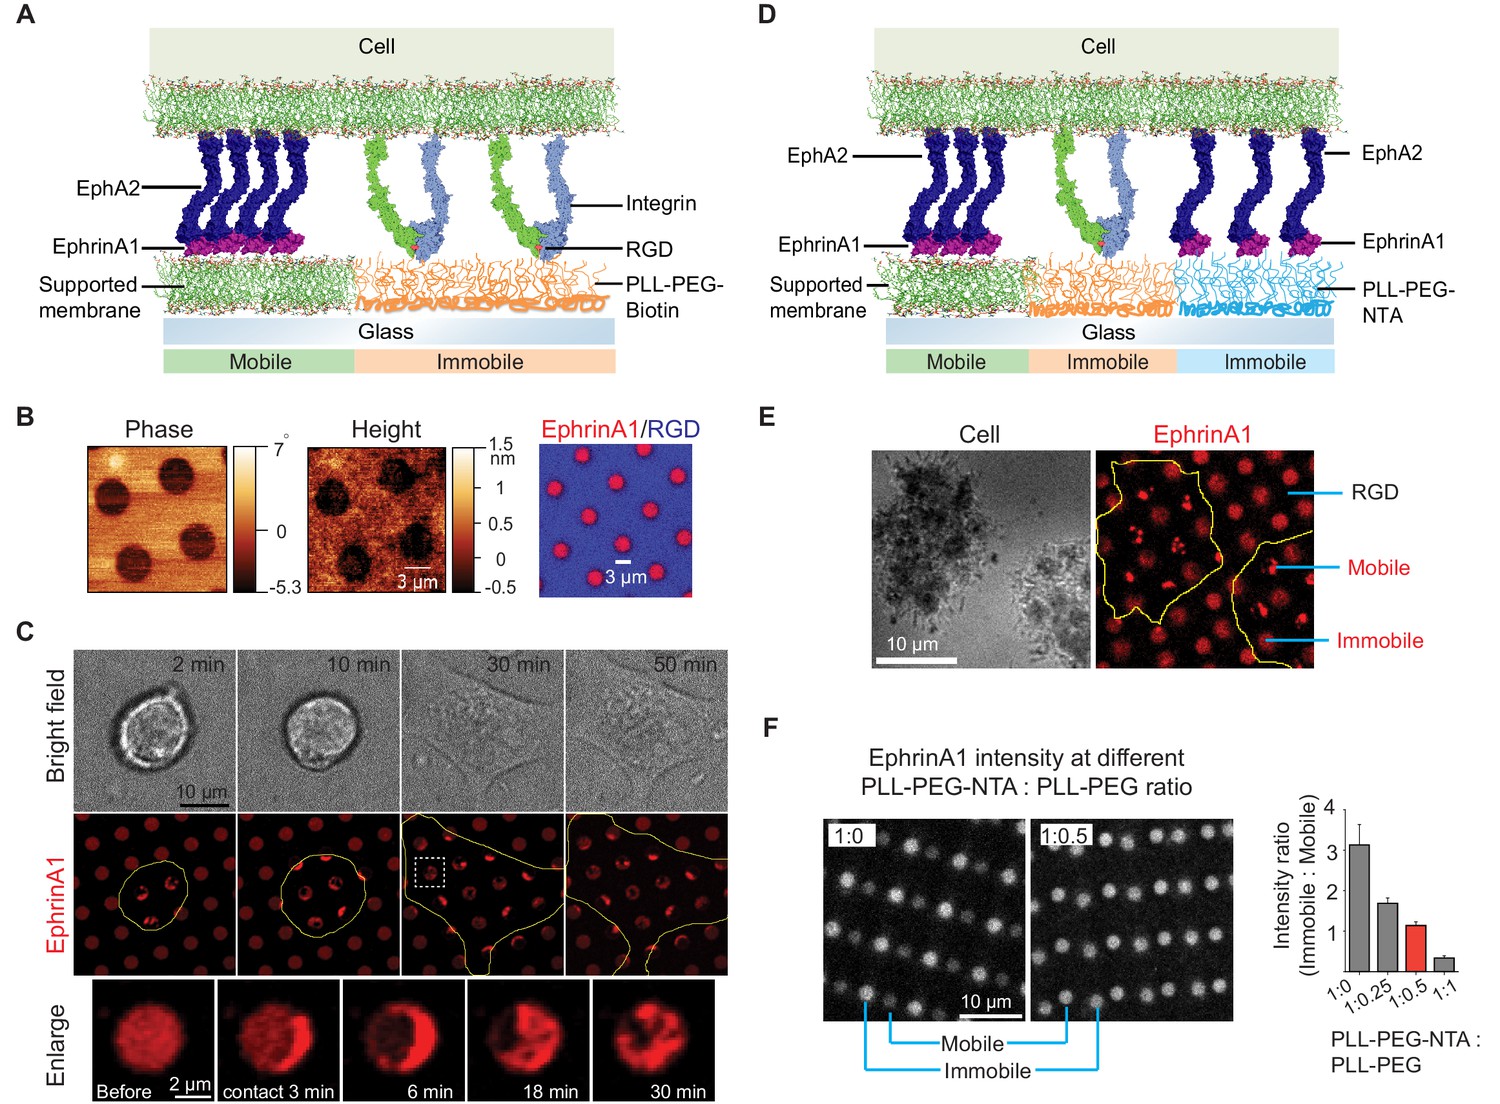
Presentation of mobile and immobile ephrinA1 ligands to a single cell.
(A) Schematic illustration of the two-component substrate. (B) AFM and fluorescence images of the substrate. (C) Representative bright-field and fluorescence images of a cell spreading on the substrate with indicated spreading time. Yellow outlines indicate the cell boundary. Bottom panel represents an enlarged ephrinA1 membrane corral before or after cell contact. (D) Schematic illustration of the three-component substrate. (E) Representative reflective interference contrast and fluorescence images of cells spreading on the substrate. (F) Fluorescence images (in gray scale) and quantification of ephrinA1 intensity in mobile or immobile corrals by titrating PLL-(g)-PEG-NTA with PLL-(g)-PEG. Data are presented as mean± SD. AFM, atomic force microscopy.
Figure 1—figure supplement 1
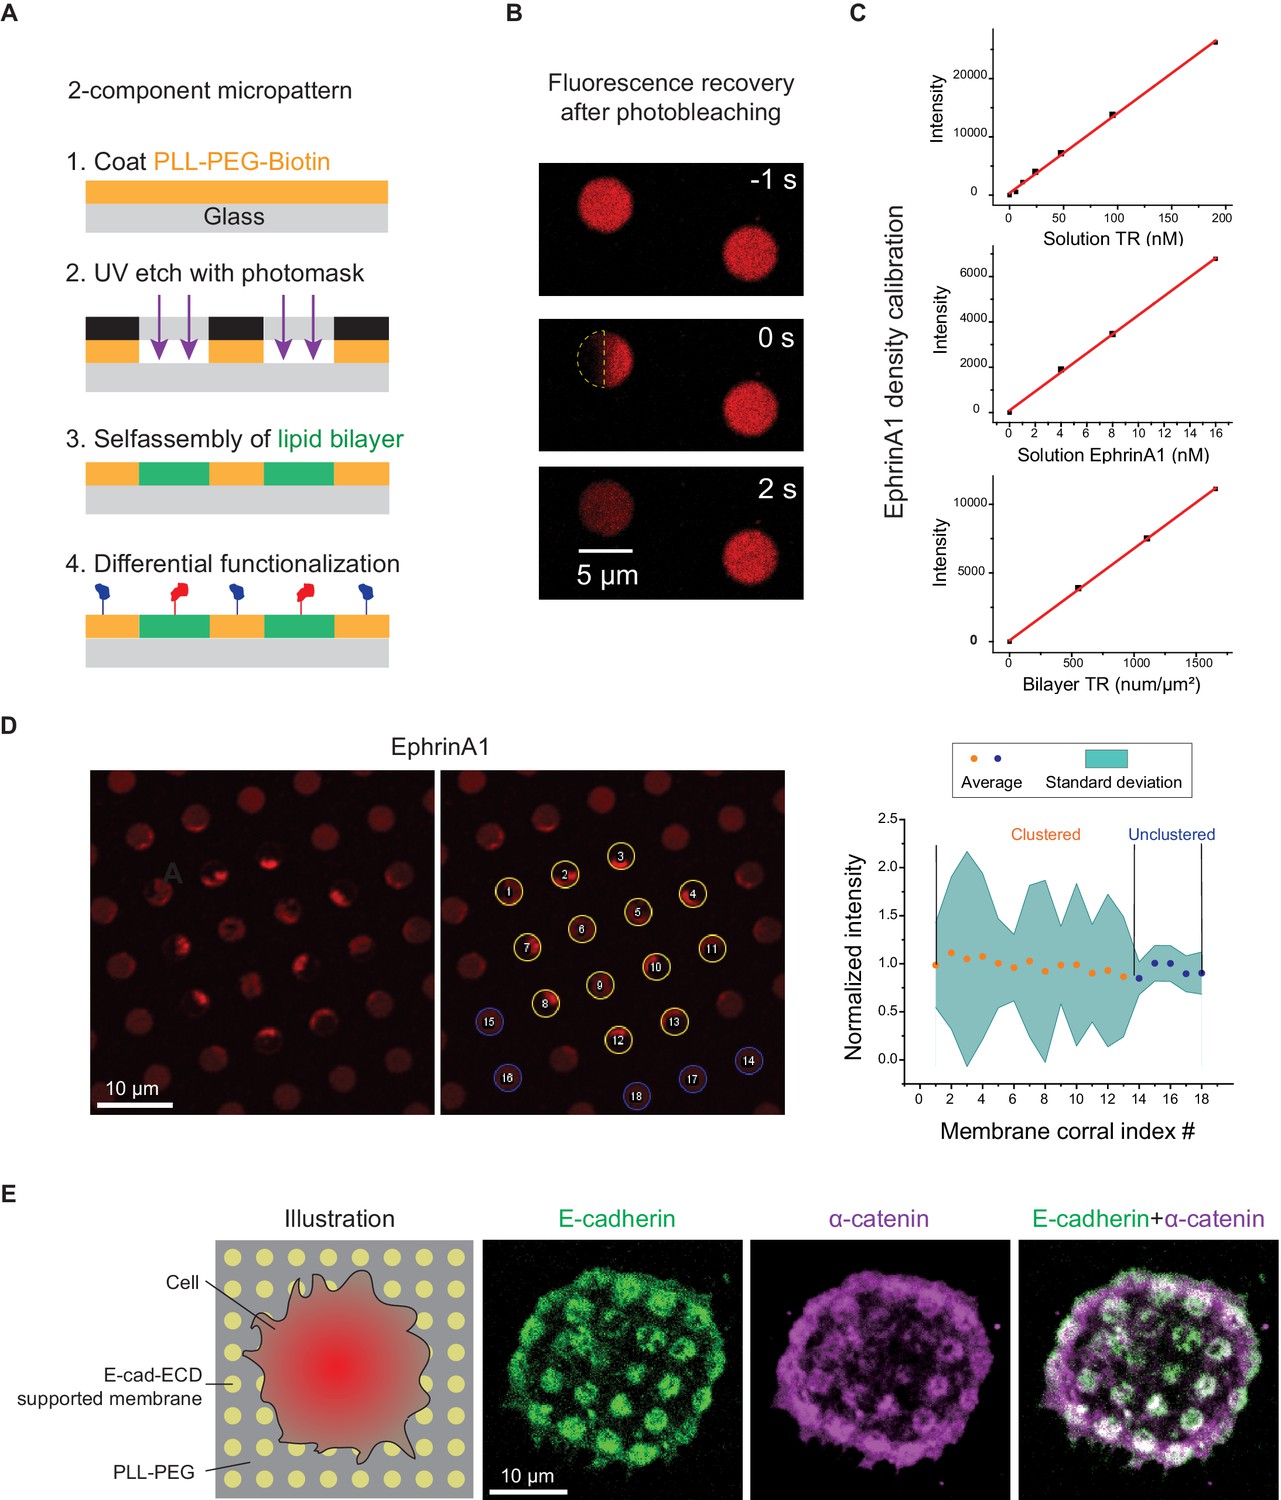
Micropatterning of 2-component substrate.
(A) Schematic illustration of the micropatterning method. (B) FRAP images of ephrinA1 in a micropatterned membrane corral, with indicated time before or after photobleach. Yellow semicircle indicates the photobleached area. The recovery of fluorescence signal in the photobleached area with a concomitant decrease in the total fluorescence intensity of the corral indicates effective ‘fencing’ of the membranes. (C) Quantification of ephrinA1 density on supported membranes. EphrinA1 density on lipid bilayers was calibrated by comparing fluorescence intensity ratio in solution and on bilayer with a reference marker Texas Red (TR). At a given imaging setting, F=constant=I(EphrinA1 solution)/I(EphrinA1 bilayer)=I (TR solution)/I(TR bilayer), where I is the concentration-normalized intensity of fluorophores. I(TR solution), I(EphrinA1 solution), and I(TR bilayer) are calculated from linear fitting of the data points in the three graphs. Therefore, I(EphrinA1 bilayer)=I(EphrinA1 solution)×I(TR bilayer)/I(TR solution)=20.52 intensity(a.u.)/density (num/μm2). The final density of EphrinA1 on bilayer is calculated as (measured fluorescence intensity)/20.52 num/μm2. (D) EphrinA1 cluster variability. The ephrinA1 cluster variability is quantified by standard deviation of ephrinA1 intensity in each membrane corral. Corrals #1–13 form ephrinA1 clusters underneath the cell; corrals #14–18 are outside of the cell. The intensity of each corral is normalized to corral #1. (E) Reconstitution of E-cadherin adhesion on micropatterned supported membrane substrates. Left: schematic illustration of cells adhering to a micropatterned substrate containing E-cadherin extracellular domain (E-cad-ECD) functionalized supported membrane corals. Right: fluorescent images of E-cadherin-GFP and α-catenin showing the association of α-catenin to E-cadherin clusters.
Figure 1—figure supplement 2
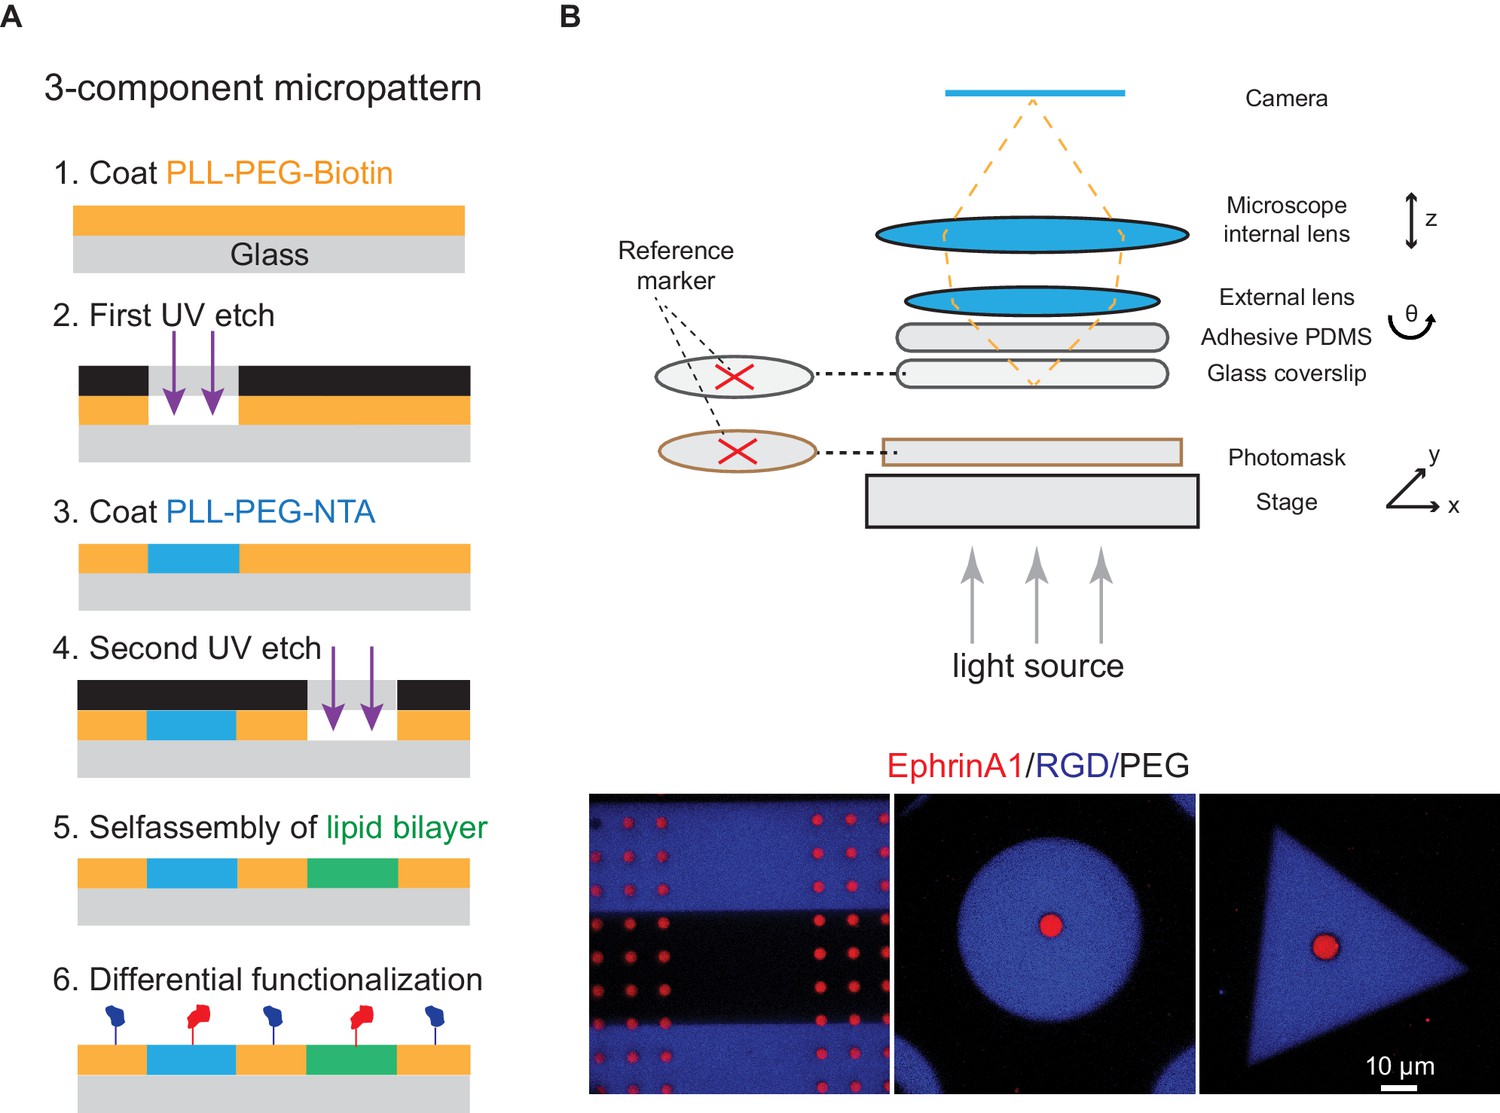
Micropatterning of 3-component substrate.
(A) Schematic illustration of the micropatterning method. (B) Versatile layouts of the three-component substrate by microscopy-assisted alignment. Before each UV etch process, the marker on the polymer-coated coverslip and the one on the photomask are aligned at the same position so that the three-component layout can be controlled.
Figure 2 with 1 supplement
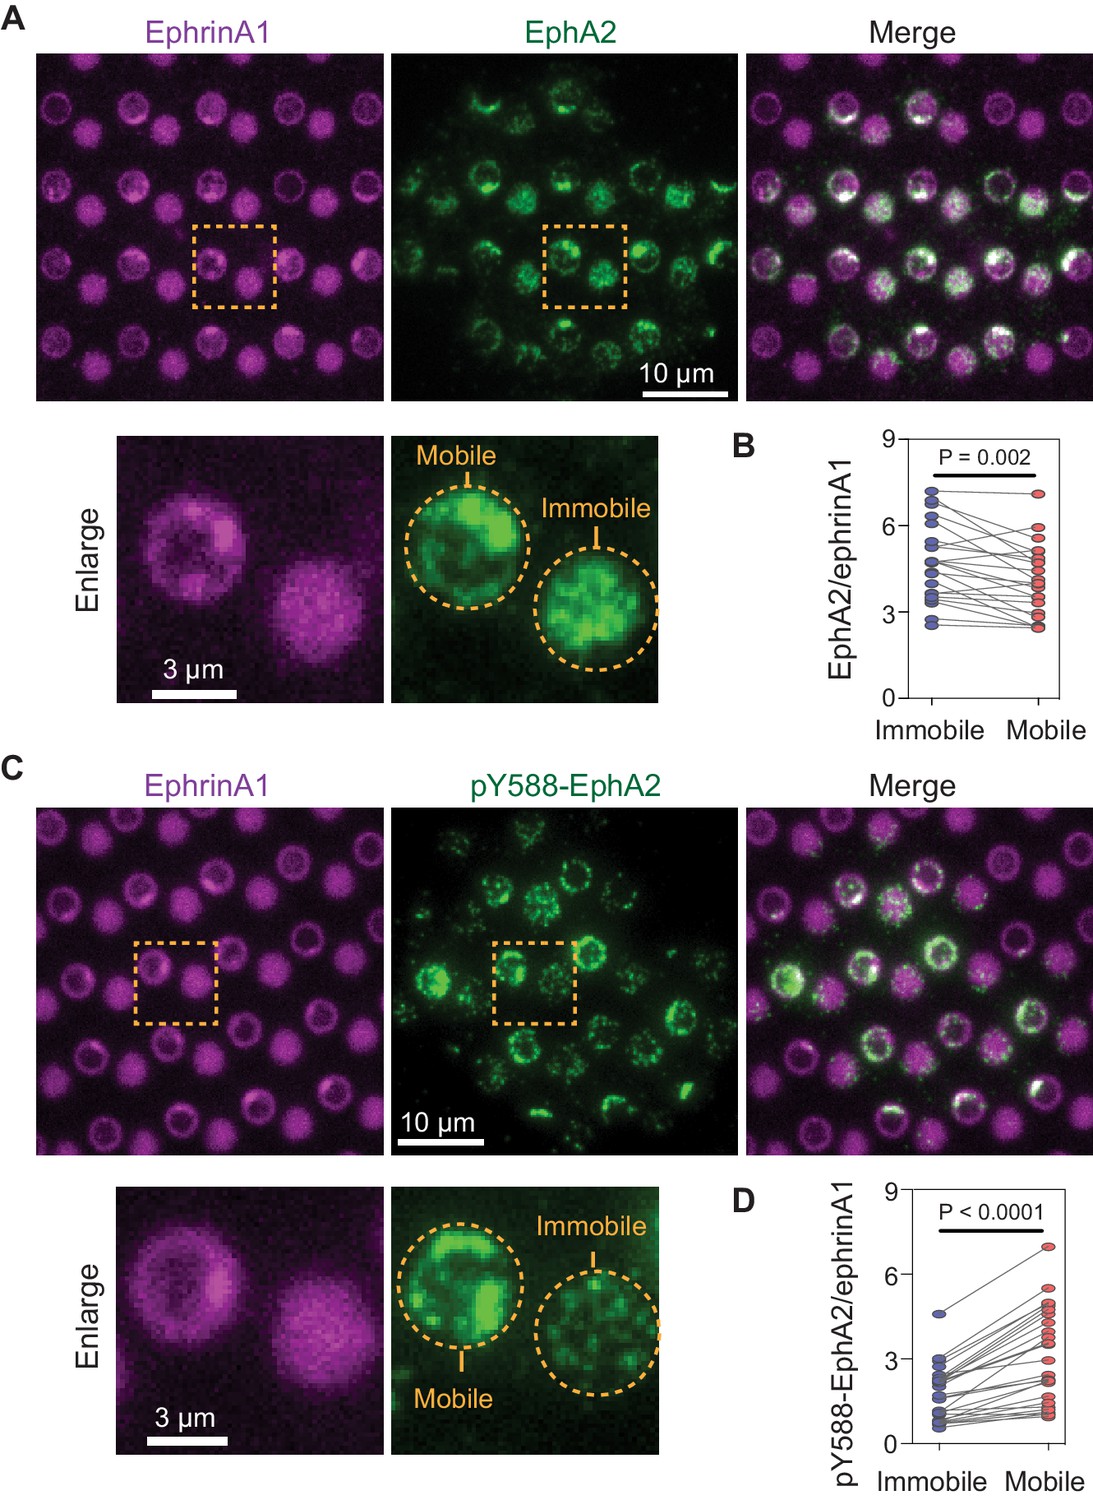
Mobile ephrinA1 stimulation increases EphA2 phosphorylation.
(A) Representative immunofluorescence images of EphA2 in MDA-MB-231 cells fixed after 45 min spread on the substrate. The yellow square marked region is enlarged in bottom panel. (B) Quantification of EphA2/ephrinA1 intensity ratio in mobile and immobile ephrinA1 corrals. Each data point represents an averaged ratio from multiple corrals from a single cell. The two grouped data from the same cell are paired for comparison. Significance is analyzed by paired-group Student’s t-test. N=22 cells. (C) Representative immunofluorescence images of pY588-EphA2. Condition same as above. (D) Quantification of pY588-EphA2/ephrinA1 intensity ratio in mobile and immobile ephrinA1 corrals. N=26 cells.
-
Figure 2—source data 1
Quantification of EphA2/eprinA1 or pY588EphA2/eprinA1 intensity ratio in mobile or immobile ephrinA1 regions.
- https://cdn.elifesciences.org/articles/67379/elife-67379-fig2-data1-v2.xlsx
Figure 2—figure supplement 1
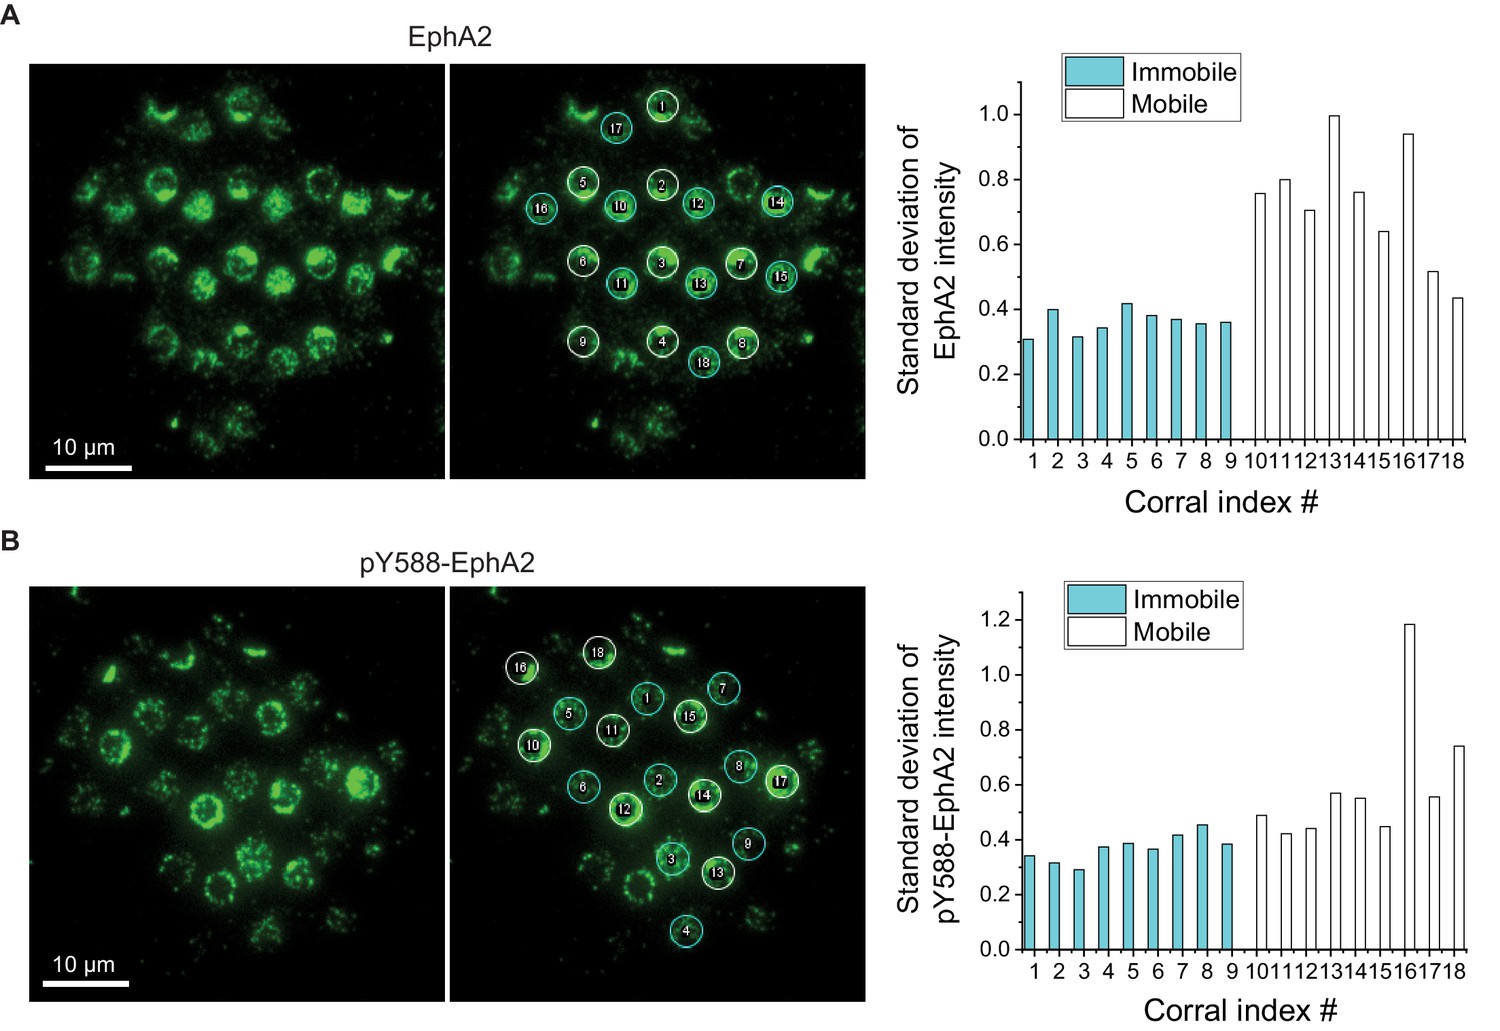
EphA2 clusters have large variability.
(A) The EphA2 cluster variability is quantified by standard deviation of EphA2 intensity in each membrane corral or immobilized polymer. Corrals #1–9 are mobile regions and corrals #10–18 are immobile regions. The standard deviation of each corral is normalized by its average intensity. (B) The pY588-EphA2 cluster variability, quantified same as above.
Figure 3 with 1 supplement
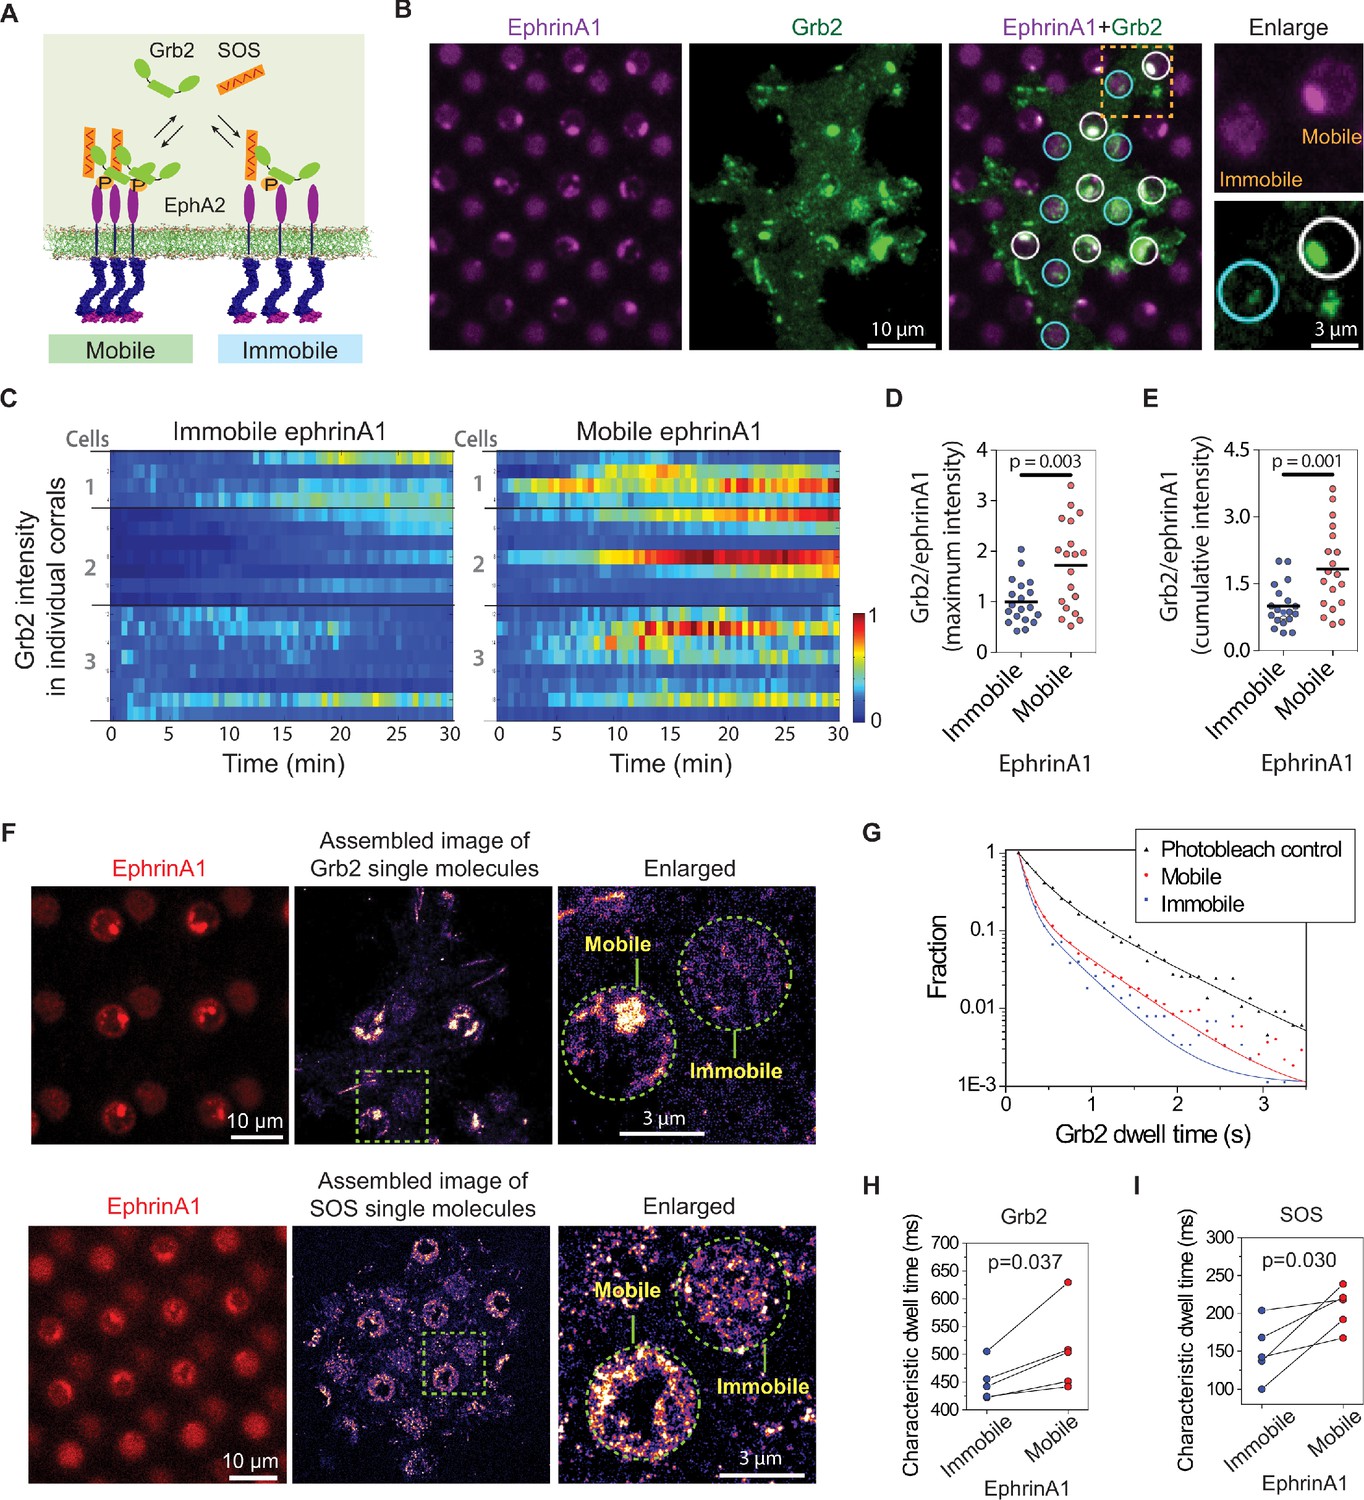
EphA2 clustering enhances Grb2:SOS signaling transductions by increasing on-rate and molecular dwell time.
(A) Schematic illustration of Grb2 and SOS recruitment to mobile or immobile EphA2 receptors under the same cell. (B) Representative live-cell images of a Grb2-tdEos transfected cell spreading on the substrate after 45 min, with white circles indicating mobile ephrinA1 corrals and cyan circles indicating immobile ephrinA1. A yellow square marked region is enlarged to highlight the differential Grb2 recruitment to a mobile ephrinA1 corral and an immobile one. (C) Heat map of temporal Grb2-tdEos intensities in three cells. Each block represents the normalized intensity of Grb2 in an ephrinA1 corral at a given time, starting from cell contact to a total period of 30 min, at 30 s/frame acquisition speed. The intensity of Grb2 is normalized according to its highest intensity of all corrals through the whole time period for each cell, and is color-coded for visualization. Quantification of (D) maximum Grb2 intensity or (E) 30 min cumulative intensity in mobile or immobile ephrinA1 corrals, normalized with ephrinA1 ligand intensity in each corral. Significance is analyzed by Student’s t-test. (F) Single-molecule imaging of Grb2-tdEos or SOS-tdEos. The coordinates of Grb2 or SOS single molecules when they first appear in a continuous movie are assembled to generate a localization image. (G) Distribution of Grb2-tdEos single-molecule dwell time. Membrane located CAAX-tdEos is applied as a photobleach control measured from another cell. Quantification of (H) Grb2-tdEos or (I) SOS-tdEos single-molecule dwell time. The dwell time distribution is fitted by a two-order exponential decay function and the slower time constant τ2 is used to represent characteristic dwell time for pairwise comparison in a group of cells. N=5 cells. Significance is analyzed by paired-group Student’s t-test.
-
Figure 3—source data 1
Time-lapse recording of Grb2-tdEos fluorescence intensity in each mobile or immobile ephrinA1 region.
- https://cdn.elifesciences.org/articles/67379/elife-67379-fig3-data1-v2.xlsx
Figure 3—figure supplement 1
Single molecule imaging of Grb2-tdEos.
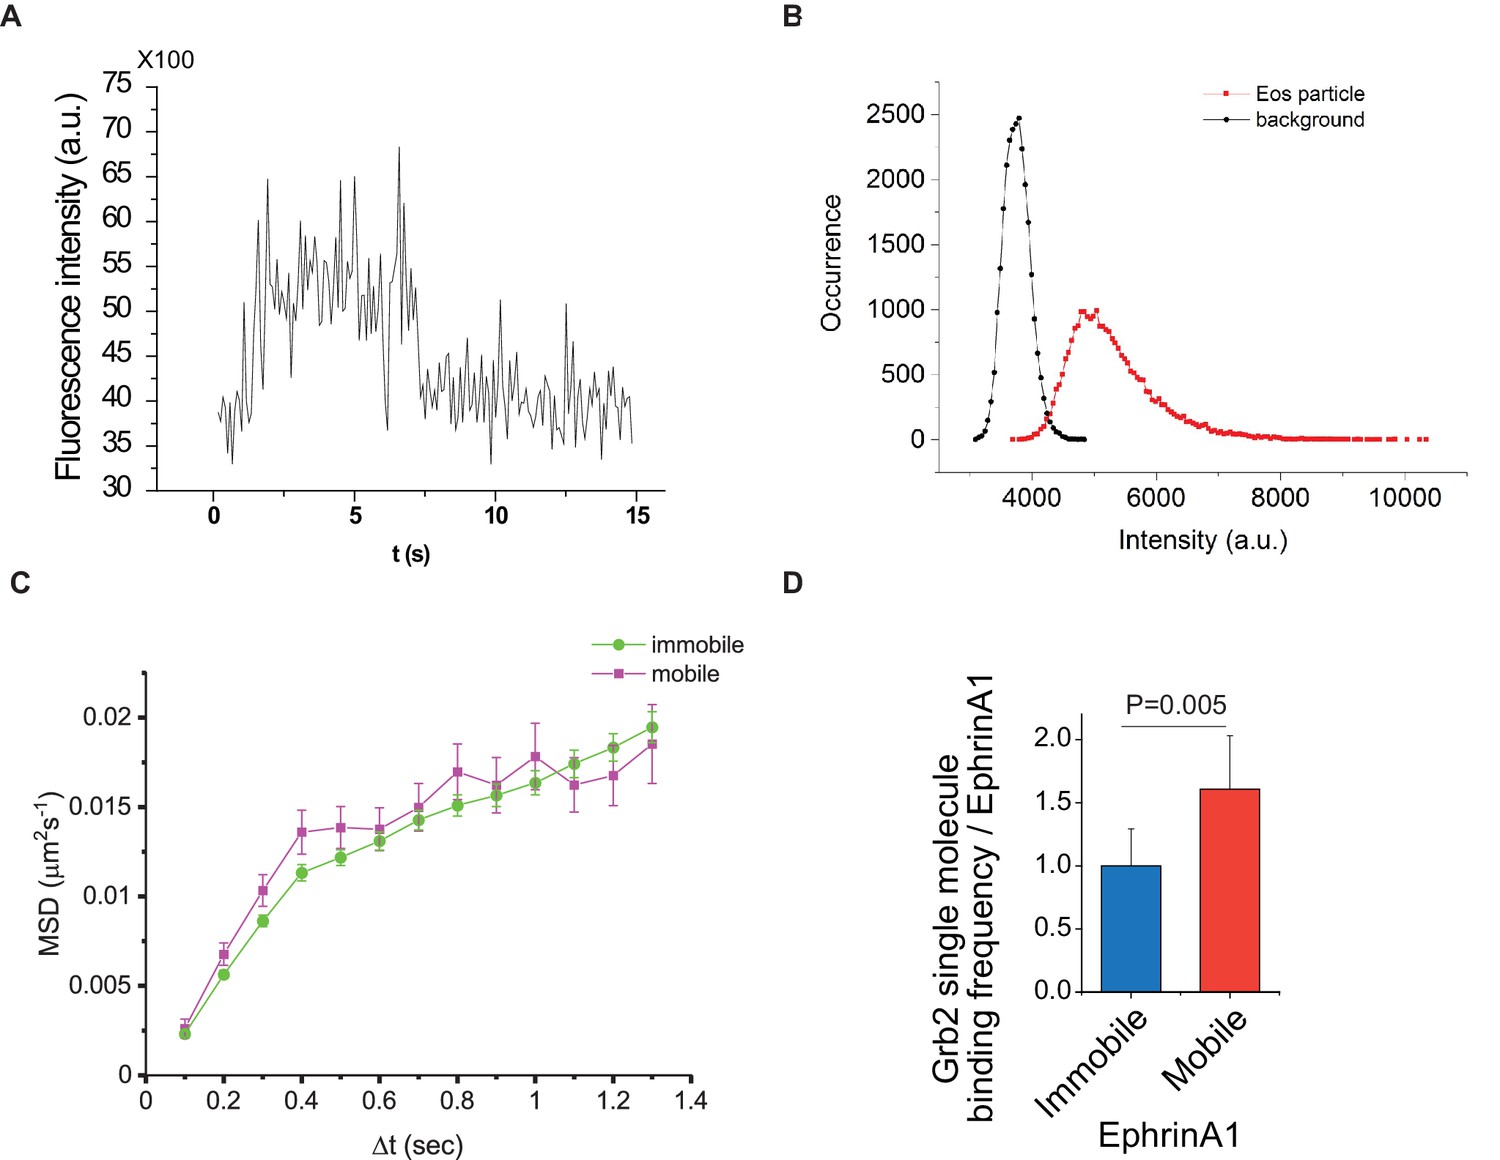
(A) Single-step photobleaching of Grb2-tdEos in live cells. (B) Distribution of Grb2-tdEos fluorescence intensities in a live cell movie. (C) Quantification of mean square displacements (MSDs) of Grb2-tdEos molecules in mobile or immobile regions in a live cell. (D) Quantification of Grb2-tdEos single-molecule binding frequency relative to ephrinA1 intensity (Kon). More than 3000 molecules were counted from three cells. Data are presented as mean± SD.
Figure 4
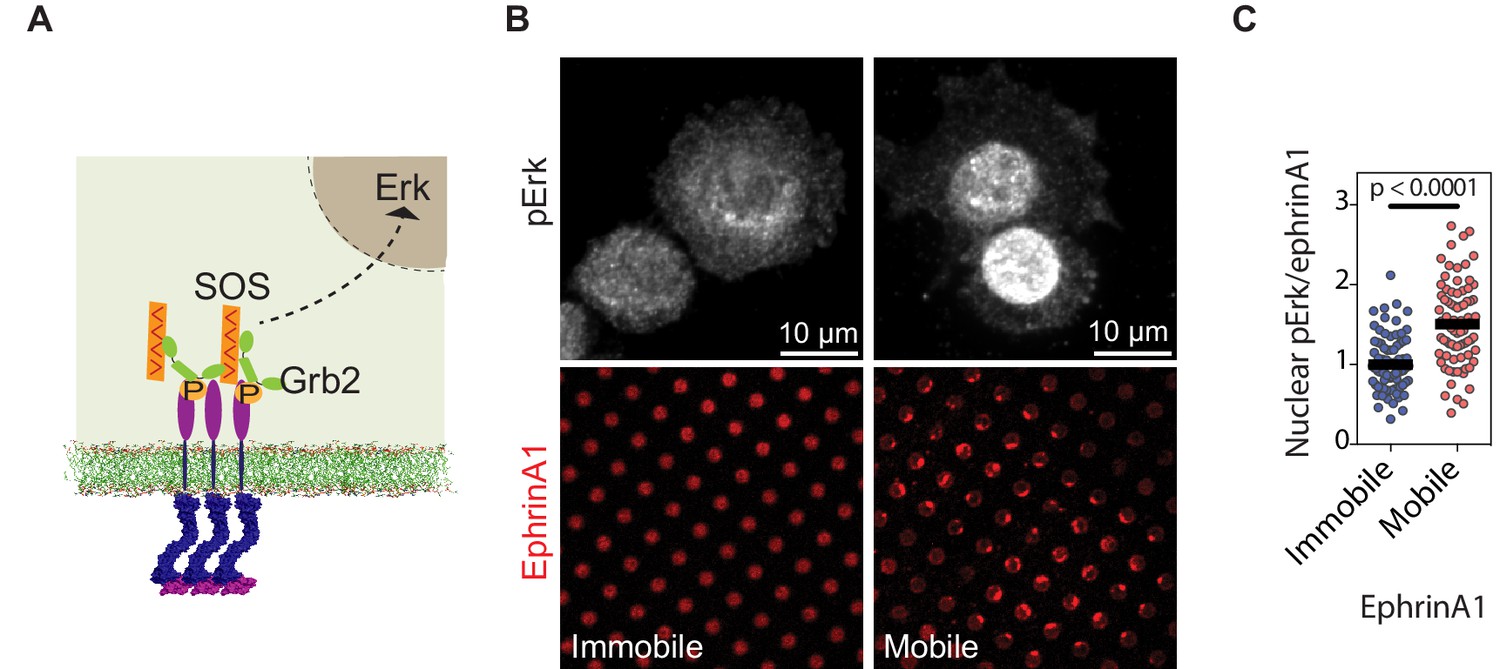
EphA2 clustering activates Erk.
(A) Schematic illustration of the signaling pathway from EphA2 receptor to nuclear Erk activation. (B) Representative immunofluorescence images of pErk in PC-3 cells fixed after 45 min spread on the two substrates. Mobile ephrinA1 on supported membranes, or immobile ephrinA1 on PLL-PEG-NTA polymers, are respectively micropatterned on RGD background. (C) Quantification of nuclear pErk/EphrinA1 intensity ratio of cells fixed after 45 min spread on mobile or immobile ephrinA1 substrates. N=103 cells for mobile and 82 cells for immobile substrates. Significance is analyzed by Student’s t-test.
-
Figure 4—source data 1
Quntification of nuclear pErk/ephrinA1 intensity ratio.
- https://cdn.elifesciences.org/articles/67379/elife-67379-fig4-data1-v2.xlsx
Figure 5
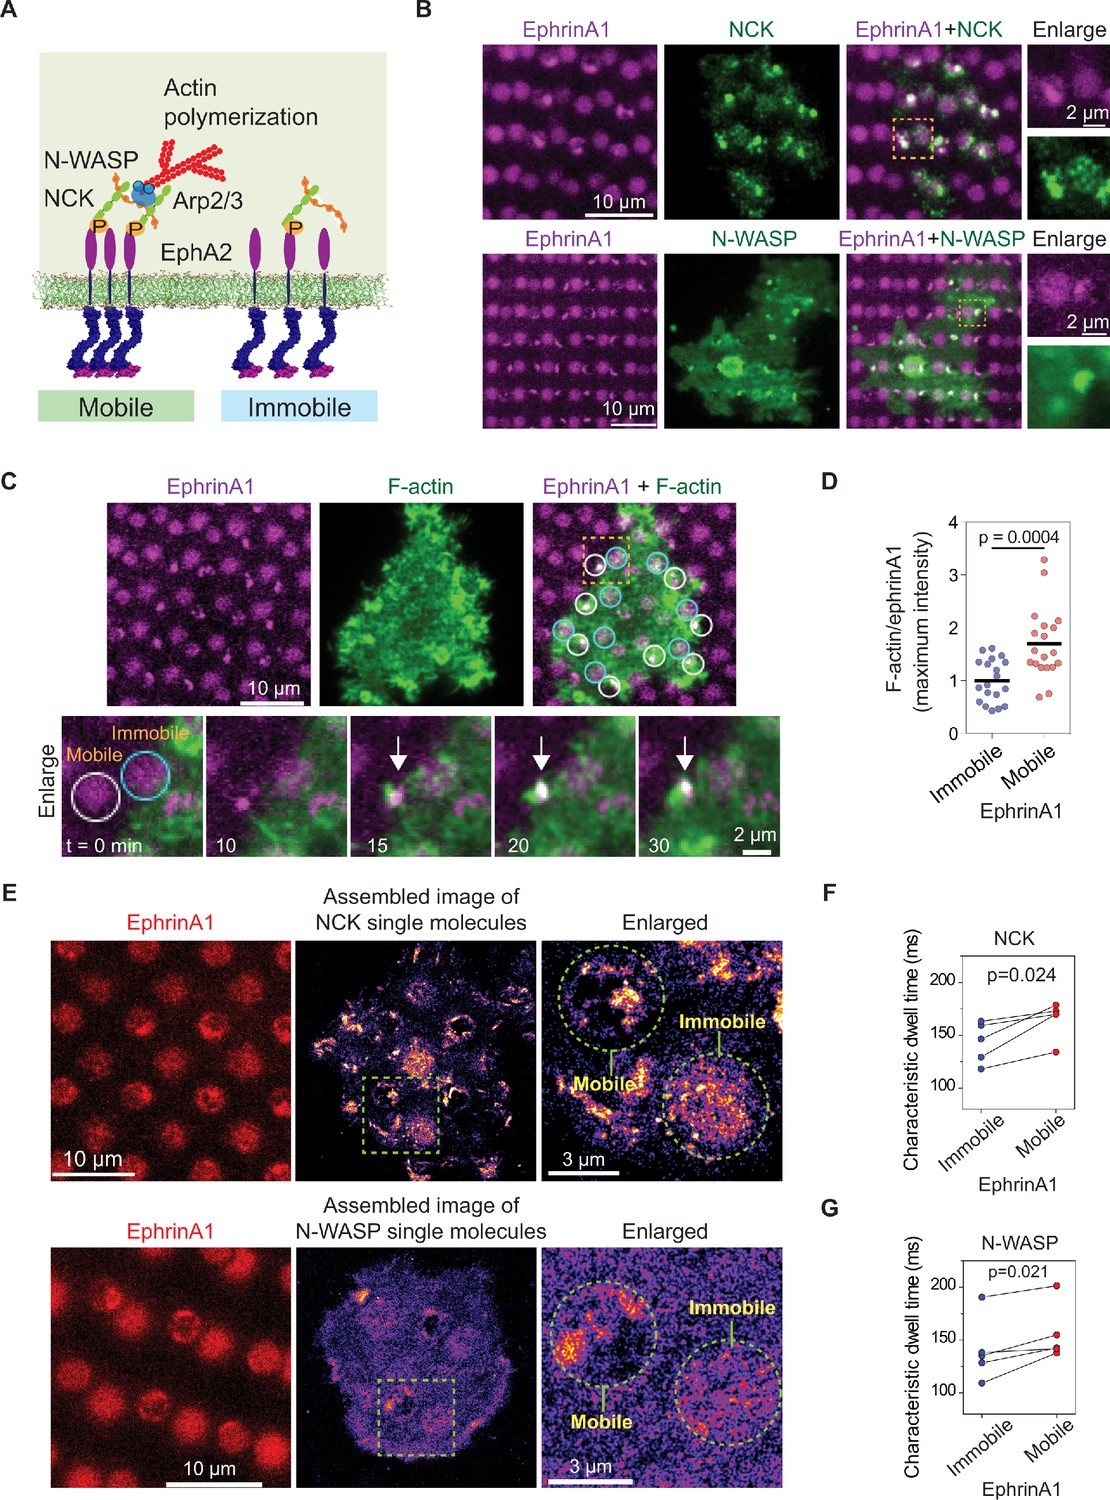
EphA2 clustering enhances NCK:N-WASP induced actin polymerization and increases molecular dwell time.
(A) Schematic illustration of the signaling pathway from EphA2 receptor to actin polymerization. (B) Representative live-cell images of an NCK-mEOS3.2 or N-WASP-mEOS3.2 transfected cell spreading on the substrate after 1 hr. (C) Representative live-cell images of an F-tractin-EGFP transfected cell spreading on the substrate, with white circles indicating mobile ephrinA1 corrals and cyan circles indicating immobile ephrinA1. The marked yellow square is enlarged to highlight temporal actin polymerization dynamics with referring to mobile or immobile ephrinA1 contact. The white arrow indicates local actin polymerization. (D) Quantification of maximum F-tractin-EGFP intensities in mobile or immobile ephrinA1 corrals, normalized with ephrinA1 ligand intensity in each corral. Significance is analyzed by Student’s t-test. N=19 cells. (E–G) Single-molecule imaging and quantification of NCK-mEos3.2 and N-WASP-mEos3.2. Condition same as Figure 3F–I. N=5 cells. Significance is analyzed by paired-group Student’s t-test.
-
Figure 5—source data 1
Quantification of maximum F-tractin-EGFP/ephrinA1 intensity ratio in mobile or immobile ephrinA1 regions.
- https://cdn.elifesciences.org/articles/67379/elife-67379-fig5-data1-v2.xlsx
Figure 6

EphA2 clustering increases Grb2 and N-WASP dwell time in COS7 cells.
(A) Representative live-cell images of Grb2-tdEOS or N-WASP-mEOS3.2 transfected COS7 cells spreading on the hybrid substrate. Quantification of (B) Grb2-tdEos or (C) N-WASP-mEos3.2 dwell time in COS7 cells. Condition same as Figure 3F–I. N=5 cells. Significance is analyzed by paired-group Student’s t-test.
Videos
Video 1
Bright-field and fluorescence images of an MDA-MB-231 cell spreading on ephrinA1 micropatterned substrate.
Left: bright field. Right: ephrinA1.
Video 2
A Grb2-tdEos transfected MDA-MB-231 cell spreading on ephrinA1 micropatterned substrate.
Video 3
Single-molecule imaging of Grb2-tdEos on mobile and immobile ephrinA1 substrate.
Video played at real-time speed.
Video 4
An F-tractin-EGFP transfected MDA-MB-231 cell spreading on ephrinA1 micropatterned substrate.
Tables
Key resources table
| Reagent type (species) or resource | Designation | Source or reference | Identifiers | Additional information |
|---|---|---|---|---|
| Cell line (Homo-sapiens) | MDA-MB-231 | ATCC | ATCC Cat# CRL-12532, RRID:CVCL_0062 | |
| Cell line (Homo-sapiens) | PC-3 | ATCC | ATCC Cat# CRL-7934, RRID:CVCL_0035 | |
| Cell line (Chlorocebus aethiops) | COS-7 | ATCC | ATCC Cat# CRL-1651, RRID:CVCL_0224 | Provided by UCB Cell Culture Facility |
| Antibody | Anti-EphA2 (Rabbit monoclonal) | Cell Signaling Technology | Cat# CST 6997 RRID:AB_10827743 | IF(1:1000) |
| Antibody | Anti-phospho-p44/42 MAPK (Erk1/2) (Rabbit polyclonal) | Cell Signaling Technology | Cat# CST 9101 RRID:AB_331646 | IF(1:1000) |
| Antibody | Anti-phospho-EphA2 (Tyr588) (D7X2L) (Rabbit monoclonal) | Cell Signaling Technology | Cat# CST 12677 RRID:AB_2797989 | IF(1:1000) |
| Recombinant DNA reagent | Grb2-tdEos (plasmid) | DOI: 10.1073/pnas.1203397109 | ||
| Recombinant DNA reagent | SOS-tdEos (plasmid) | DOI: 10.1073/pnas.1203397109 | ||
| Recombinant DNA reagent | CAAX-tdEos (plasmid) | DOI: 10.1073/pnas.1203397109 | ||
| Recombinant DNA reagent | F-tractin-EGFP (plasmid) | This paper | Maintained in Ronen Zaidel-Bar lab | |
| Recombinant DNA reagent | NCK-mEos3.2 (plasmid) | This paper | Cloned in Mechanobiology Institute Core facility, National University of Singapore | |
| Recombinant DNA reagent | N-WASP-mEos3.2 (plasmid) | This paper | Cloned in Mechanobiology Institute Core facility, National University of Singapore |
Additional files
Download links
A two-part list of links to download the article, or parts of the article, in various formats.
Downloads (link to download the article as PDF)
Open citations (links to open the citations from this article in various online reference manager services)
Cite this article (links to download the citations from this article in formats compatible with various reference manager tools)
Probing the effect of clustering on EphA2 receptor signaling efficiency by subcellular control of ligand-receptor mobility
eLife 10:e67379.
https://doi.org/10.7554/eLife.67379


