Single-cell analysis of the ventricular-subventricular zone reveals signatures of dorsal and ventral adult neurogenesis
- Eli and Edythe Broad Institute for Stem Cell Research and Regeneration Medicine, University of California, San Francisco, United States
- Department of Neurological Surgery, University of California, San Francisco, United States
- Neuroscience Graduate Program, University of California, San Francisco, United States
- Medical Scientist Training Program, University of California, San Francisco, United States
- Biomedical Sciences Graduate Program, University of California, San Francisco, United States
- Laboratorio de Neurobiología Comparada, Instituto Cavanilles de Biodiversidad y Biología Evolutiva, Universitat de València - Centro de Investigación Biomédica en Red sobre Enfermedades Neurodegenerativas (CIBERNED), Spain
Figures
Figure 1 with 2 supplements
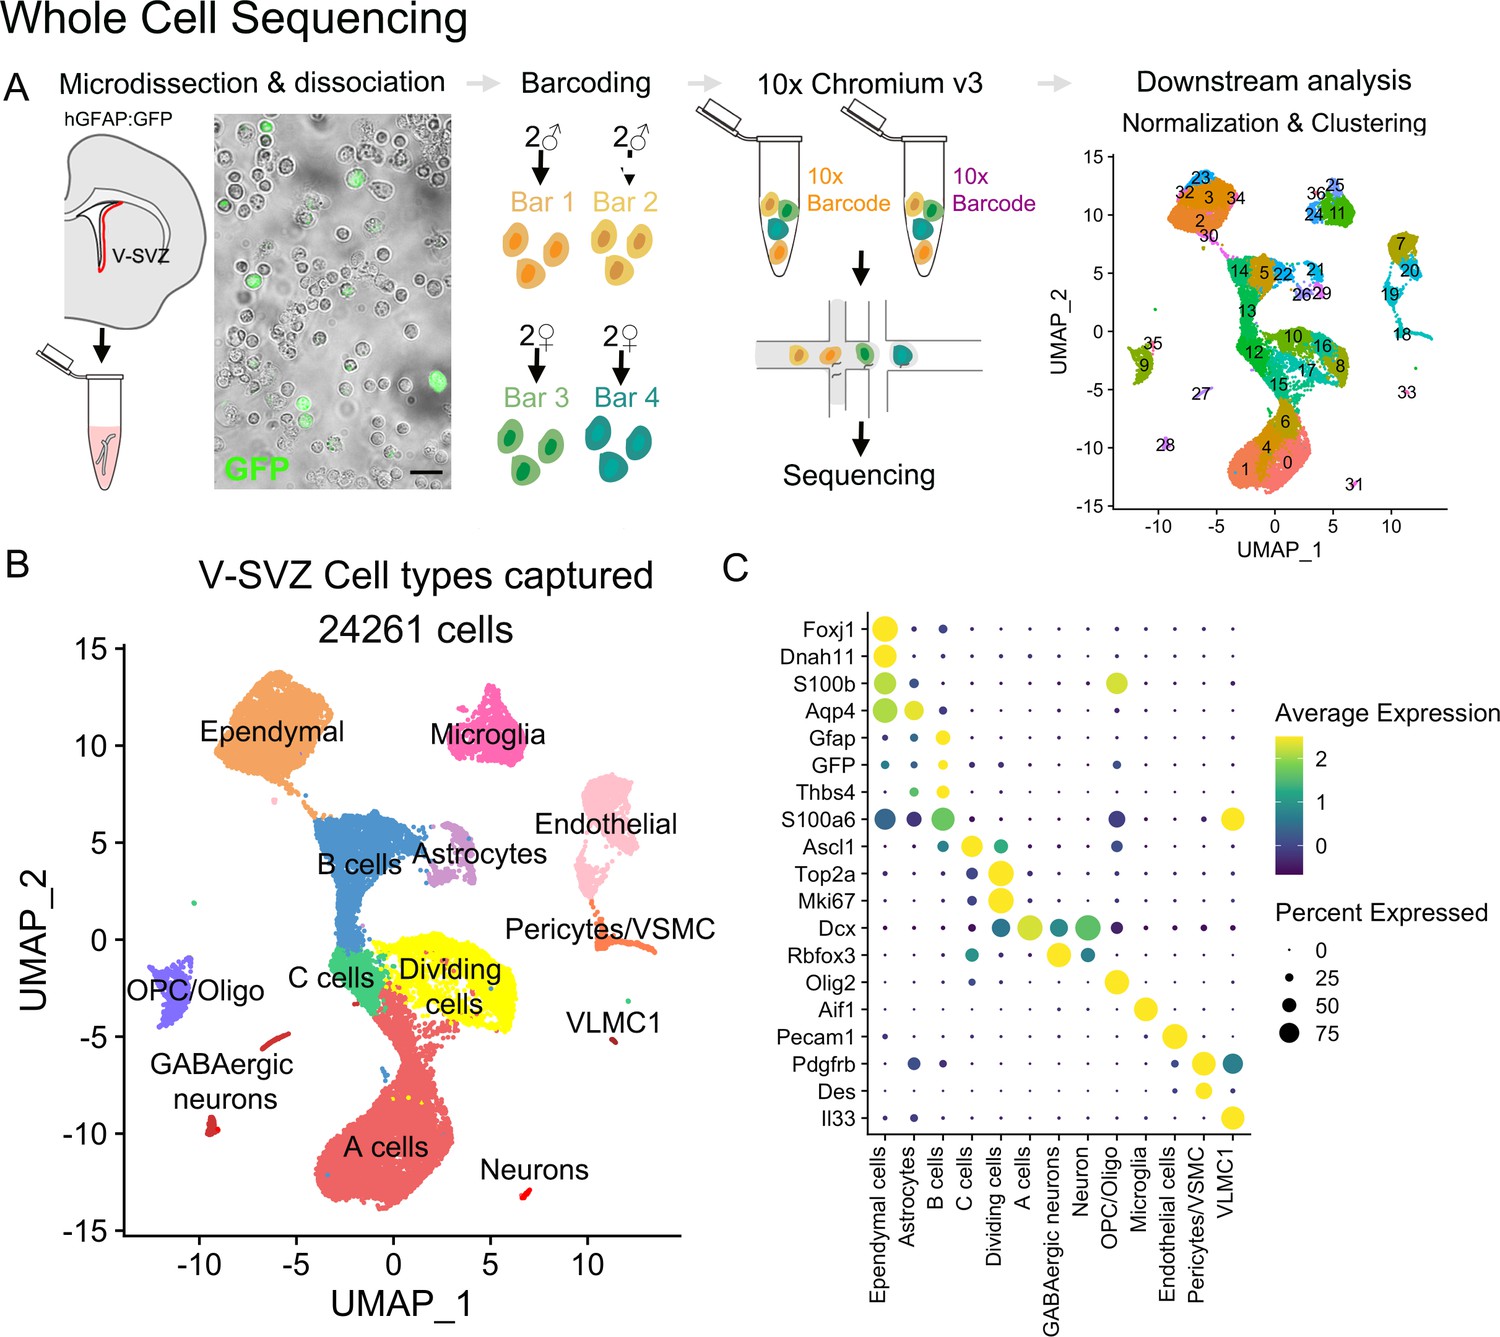
Whole-cell sequencing captures the cellular diversity and activation cascade of the adult neurogenic niche.
(A) Schematic of the whole-cell single-cell isolation and sequencing protocol (scRNA-Seq). The lateral wall of the lateral ventricles were microdissected from young adult hGFAP:GFP mouse brains (n=four males, n=four females). Four samples were multiplexed with MULTI-seq barcodes and combined together. Two 10x Chromium Controller lanes were loaded as technical replicates, and cells were sequenced and processed for downstream analysis (Figure 1—figure supplement 1). V-SVZ: Ventricular-Subventricular zone. (B) UMAP plot of scRNA-Seq cell types captured after demultiplexing and doublet removal. (C) Dot plot of cell-type-specific marker expression in the clusters from (B) (Figure 1—figure supplement 2).
Figure 1—figure supplement 1
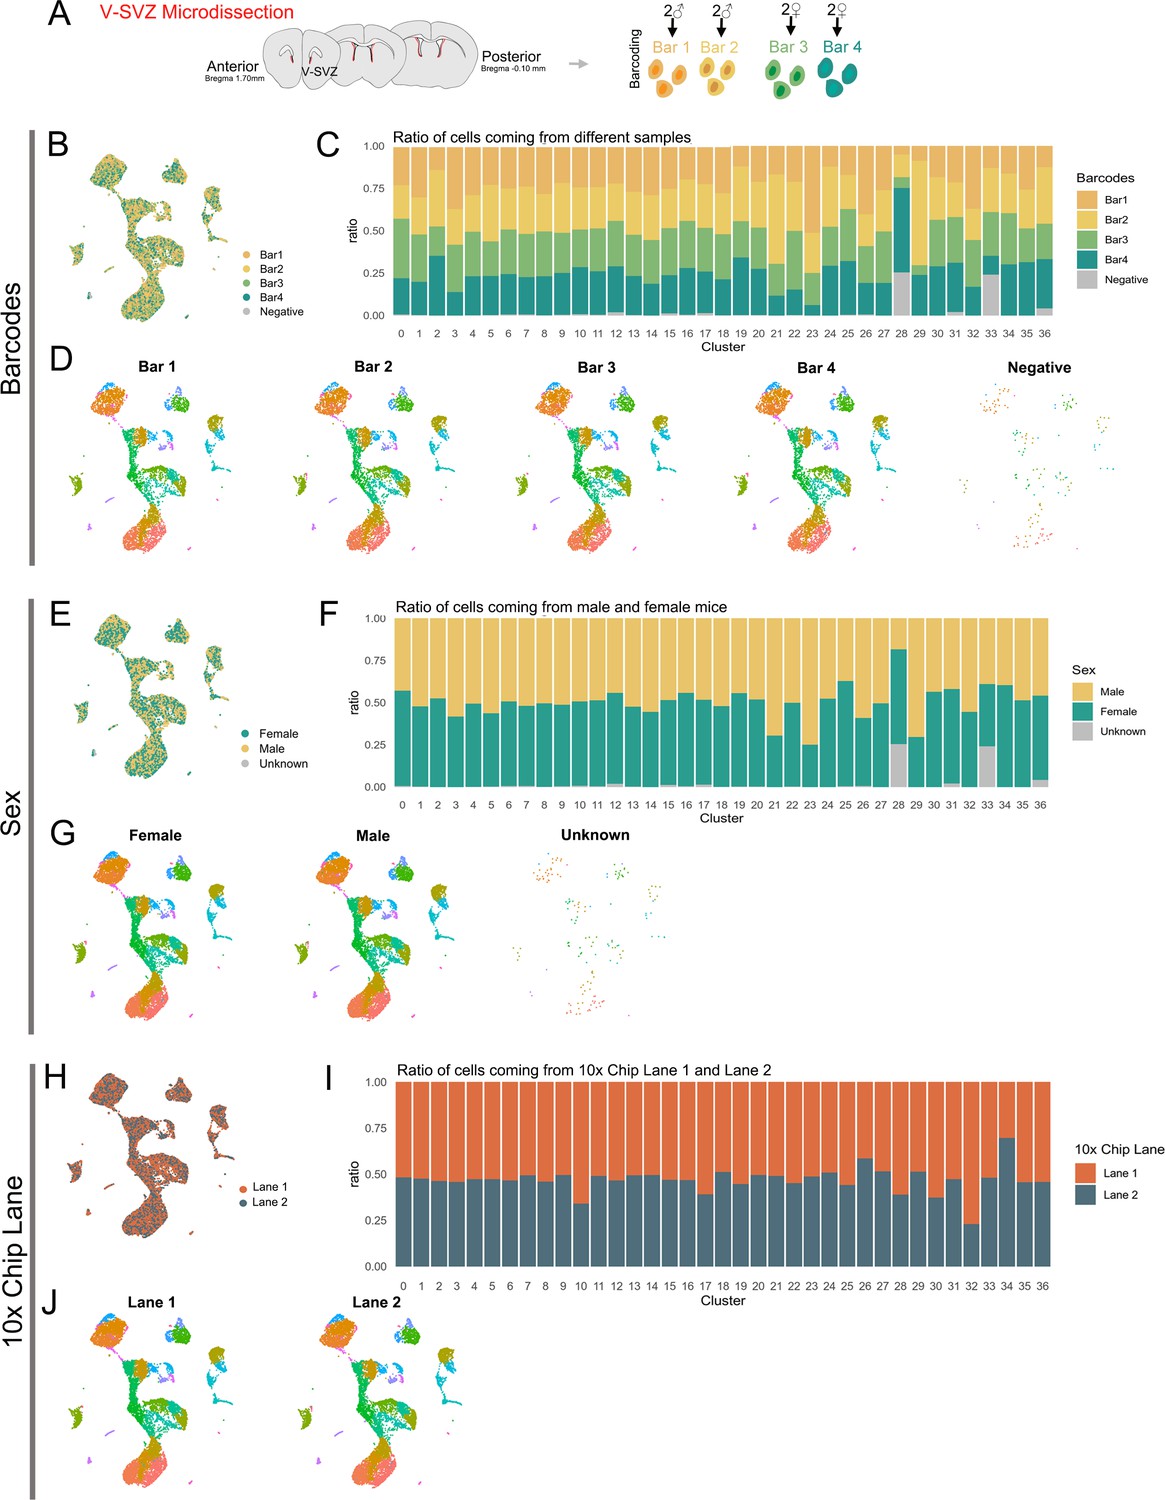
Biological and technical replicate metadata of the scRNA-Seq dataset.
(A) Diagram representing V-SVZ microdissected areas (red). The V-SVZ was microdissected from 1 mm brain slices from anterior (bregma 1.70) to Posterior bregma (−0.10 mm) regions. Single-cell suspensions from two female samples and two male samples were multiplexed with MULTI-seq barcodes (Bar1-4). (B) UMAP plot of sequenced cells after demultiplexing and quality control filtering, color-coded by MULTI-seq barcode. Cells with no detectable barcode are labeled ‘Negative’. (C) Ratio of cells within each cluster (see Figure 1A, right panel) coming from each Barcode sample. (D) UMAP plots of cells separated by Barcode number and color-coded by cluster number (see Figure 1A, right panel). (E) UMAP plot of sequenced cells color-coded by animal sex: Female cells (green) correspond to Barcodes 3 and 4 combined, male cells (tan) correspond to Barcodes 1 and 2 combined. Cells with no detectable barcode are labeled ‘Unknown’ (gray). (F) Ratio of cells within each cluster (see Figure 1A, right panel) coming from male (tan) or female (green) mice, or of unknown origin (gray). (G) UMAP plots of cells separated by animal sex and color-coded by cluster number (see Figure 1A, right panel). (H) UMAP plot of sequenced cells color-coded by 10x Chromium Controller Chip lane (equivalent to ‘batch’, or technical replicate): Lane 1 (orange) or Lane 2 (navy). (I) Ratio of cells within each cluster (see Figure 1A, right panel) coming from Lane 1 (orange) or Lane 2 (navy). (J) UMAP plots of cells separated by Lane and color-coded by cluster number (see Figure 1A, right panel).
Figure 1—figure supplement 2
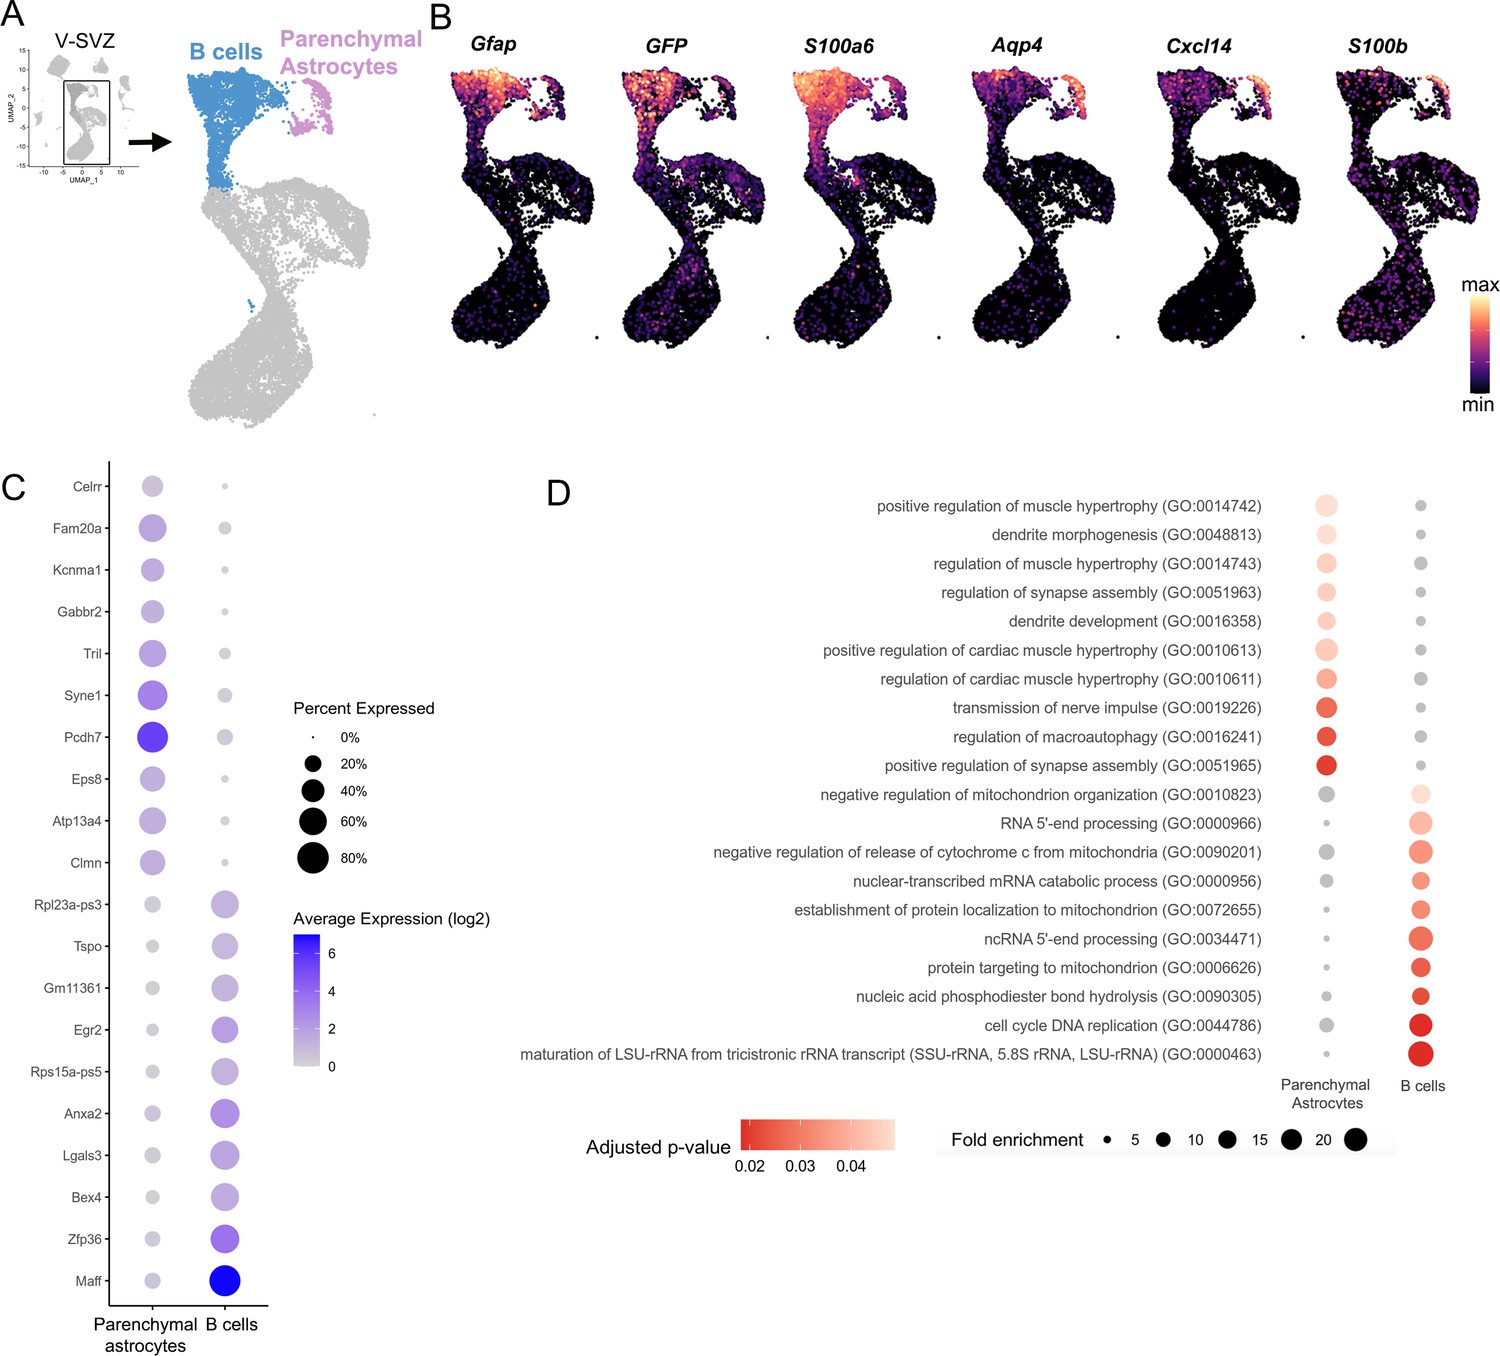
Transcriptomic profile of B cells versus Parenchymal Astrocytes.
(A) UMAP plot of V-SVZ neurogenic lineage cells (blue) and parenchymal astrocytes (purple) isolated from the scRNA-Seq dataset (inset, boxed area). (B) Gene expression of B cell-enriched markers Gfap, GFP, S100a6, and parenchymal astrocyte-enriched markers Aqp4, Cxcl14, S100b. (C) Dot plot of the top ten differentially expressed Parenchymal Astrocytes and B cell cluster markers. (D) Dot plot of significantly over-represented Gene Ontology (GO) terms identified by gene set enrichment analysis using differentially expressed Parenchymal astrocytes and B cell genes.
Figure 2
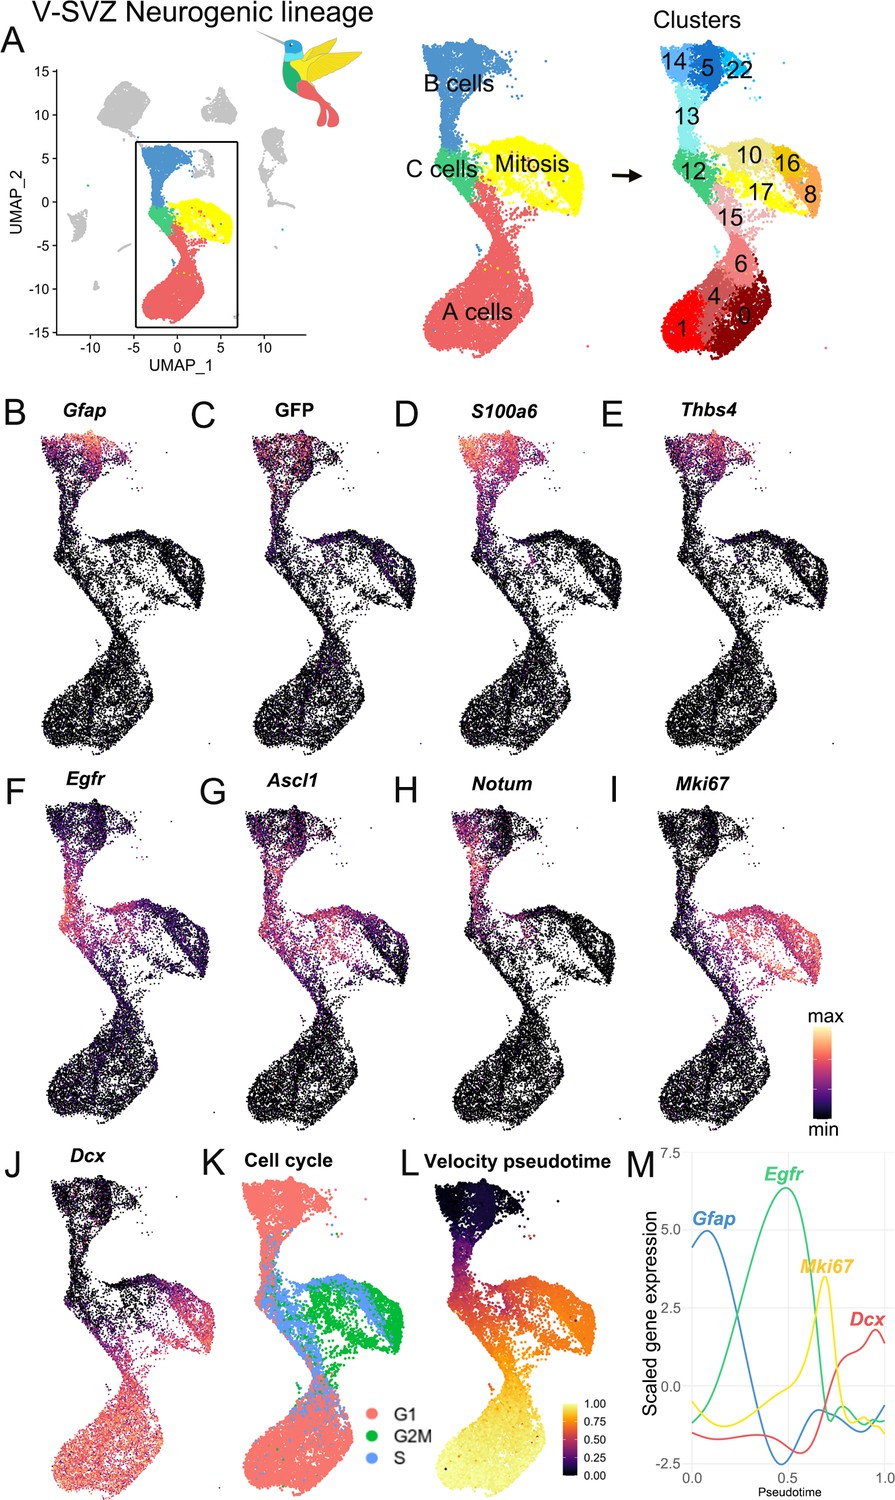
Characterization of the scRNA-Seq V-SVZ neurogenic lineage.
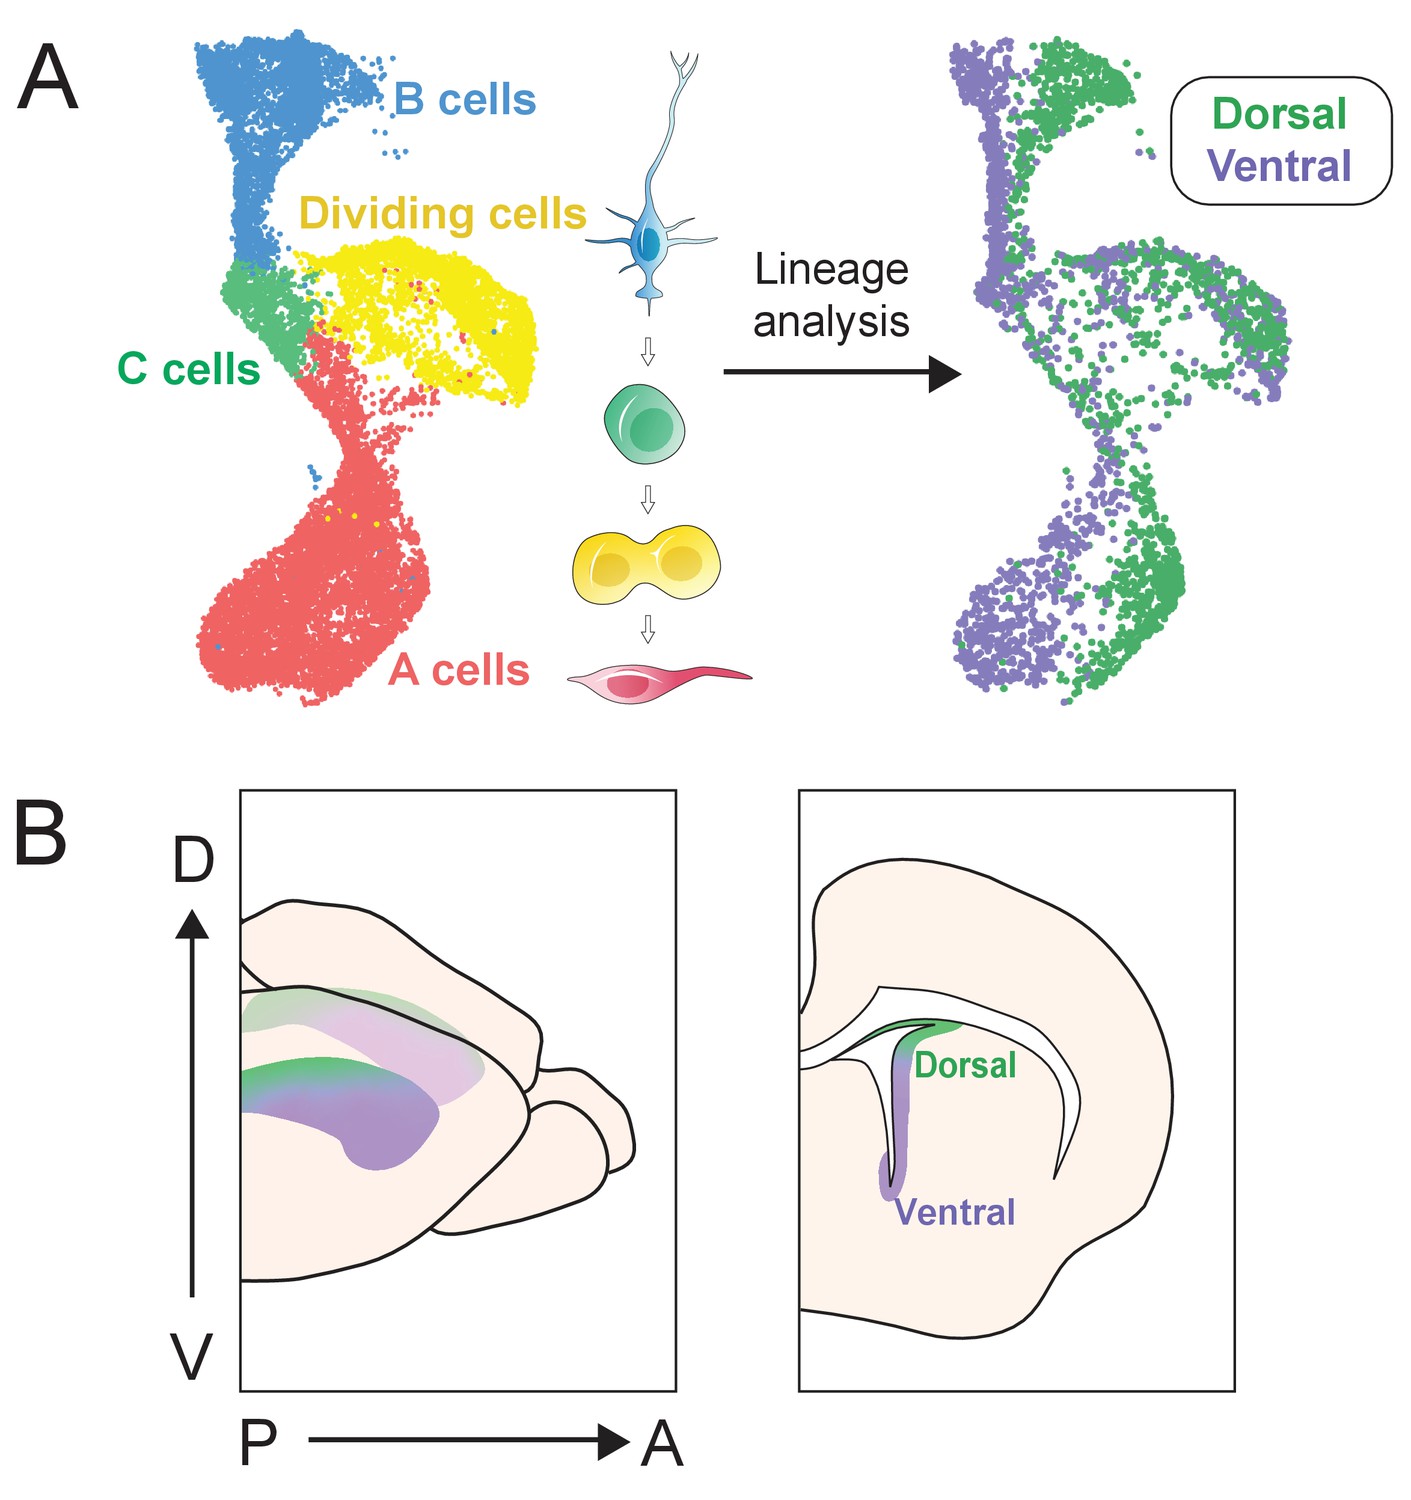
(A) The neurogenic lineage has a ‘bird-like’ shape, with B cells forming the head (blue), C cells in the body (green), dividing cells in the wing (yellow), and A cells in the tail (red). These are divisible into 14 distinct clusters, including 4 B cell clusters, 1 C cell cluster, 4 clusters of dividing cells, and 5 A cell clusters (right). (B-J). Gene expression captures progression along the lineage, with canonical markers of each stage expressed in its corresponding region of the UMAP plot. (K) Scoring cells by phase of the cell cycle reveals cells in G2M and S phase occupying the wing of the bird. (L-M). Pseudotime calculated by RNA velocity recapitulates the B to C to A trajectory along the neurogenic lineage. (M) Genes associated with B cells (Gfap), activated B and C cells (Egfr), mitosis (Mki67), and A cells (Dcx) peak in expression at corresponding stages in the lineage.
Figure 3 with 4 supplements
scRNAseq reveals regional heterogeneity among adult neural stem cells.
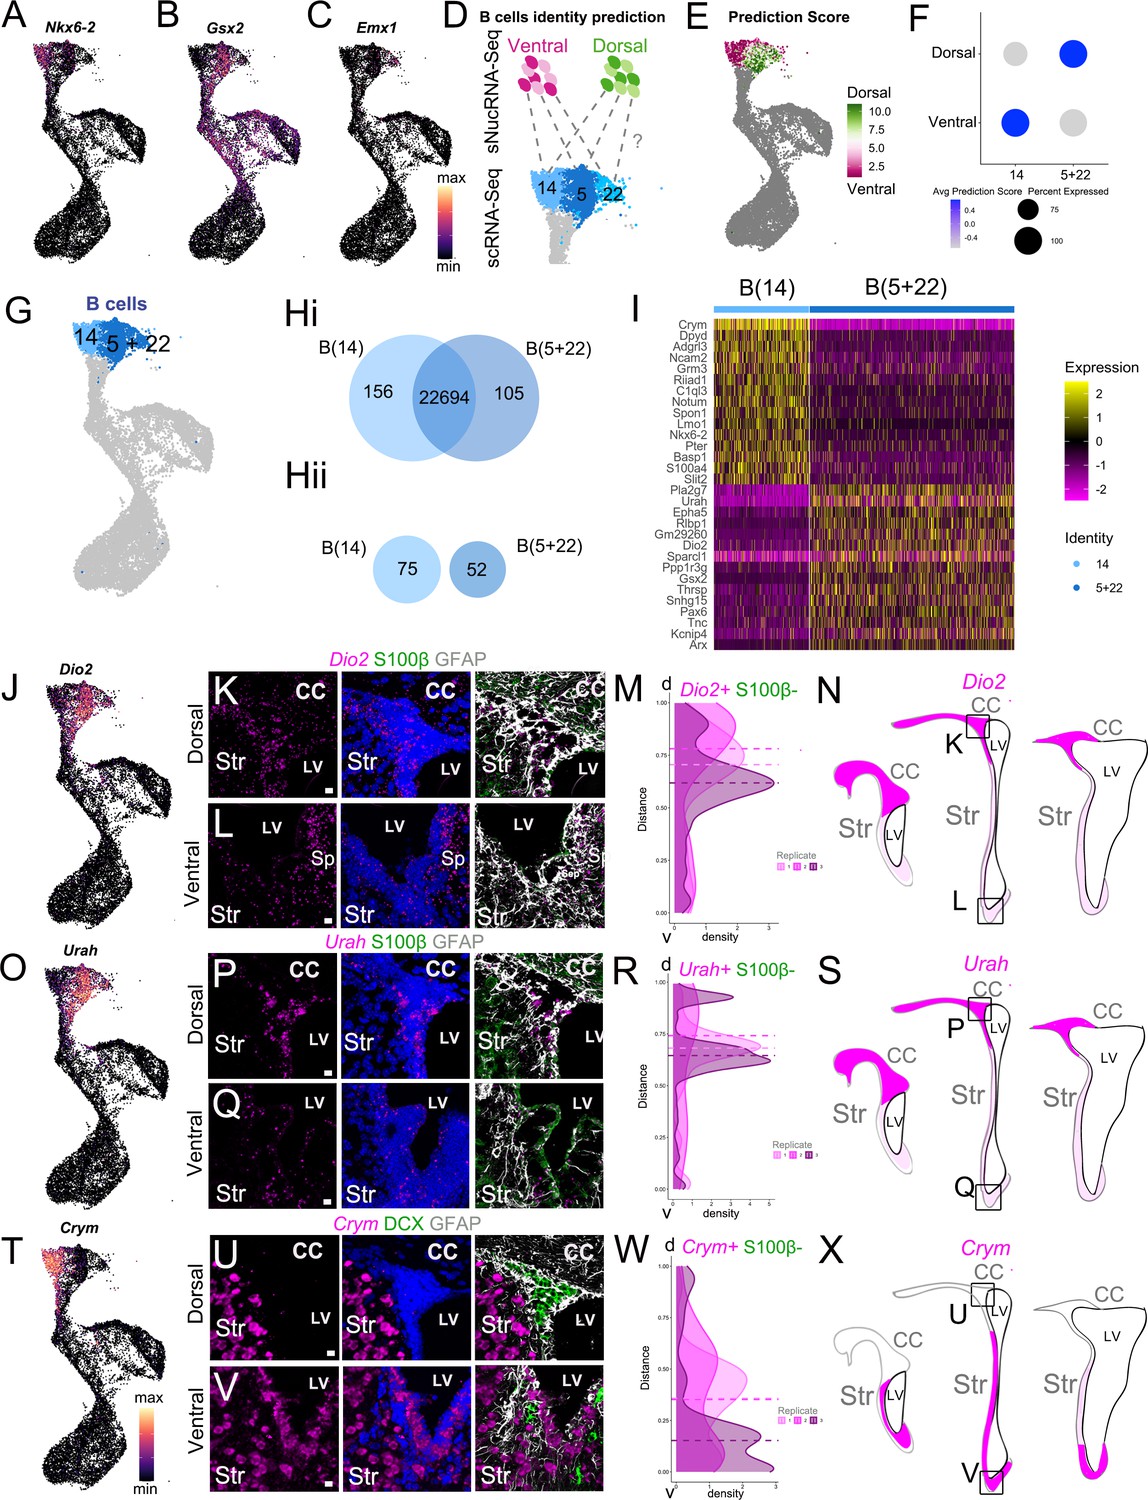
(A-C) UMAP plots of Nkx2.1 (A), Gsx2 (B), and Emx1 (C) expression in the scRNA-Seq neurogenic lineage (see also Figure 3—figure supplement 1). (D) Schematic of the region identity prediction calculation, where anchor gene sets (dashed gray lines) are calculated between Ventral Dissection (magentas) and Dorsal Dissection (greens) sNucRNA-Seq B cell nuclei and scRNAseq B cells (blues) and each scRNAseq B cell is given a Dorsal or Ventral Dissection predicted identity score (see also Figure 3—figure supplement 2). (E) The net predicted identity scores of each scRNA-Seq B cell plotted in UMAP space, where strongly Dorsal Dissection predicted identity cells are dark green, and strongly Ventral Dissection predicted identities are dark magenta. Dark gray cells were not included in the analysis. (F) Dot plot of the average Dorsal or Ventral Dissection predicted identity scores for scRNA-Seq B cell clusters B(14) and B(5+22). (G) UMAP plot of B cell cluster identities used in the following analysis: B(14) (light blue) and B(5+22) (dark blue). (H) (i) Venn diagram summarizing differential gene expression analysis between clusters B(14) (light blue) and B(5+22) (dark blue). (ii) Numbers of candidate marker genes identified after selecting significantly upregulated genes expressed in no more than 40% of cells of the other cluster. (I) Heatmap depicting expression of the top 10 differentially expressed genes between clusters B(14) (left) and B(5+22) (right). (J) UMAP plot of Dio2 expression in the scRNA-Seq neurogenic lineage. (K - L) Confocal micrographs of Dio2 RNA (magenta), S100b (green), and GFAP (white) protein expression in the dorsal (K) and ventral (L) V-SVZ. (M-N). Quantification of DAPI+, S100ß- Dio2 RNAscope puncta along the length of the V-SVZ (0 = ventral-most extent, 1 = dorso-lateral-most extent of the wedge) with the median puncta distribution location plotted as a horizontal line for each sample (n=3, each indicated by a different shade, ~ bregma 1.18, 0.98 and 0.62 mm). N. Summary schematic of Dio2 expression in three rostro-caudal coronal sections (~bregma 1.50, 0.98 and 0.14 mm); strong expression (magenta); sparse (light magenta). Boxed areas denote locations of dorsal (K) and ventral (L) high-magnification images. (O) UMAP plot of Urah expression in the scRNA-Seq neurogenic lineage. (P - Q) Confocal micrographs of Urah RNA (magenta), S100b (green), and GFAP (white) protein expression in the dorsal (P) and ventral (Q) V-SVZ. (R-S) Quantification of DAPI+, S100ß- Urah RNAscope puncta along the length of the V-SVZ (0 = ventral-most extent, 1 = dorso-lateral-most extent of the wedge) with the median puncta distribution location plotted as a horizontal line for each sample (n=3, each indicated by a different shade, bregma~ 1.34, 1.18 and 0.98 mm). S. Summary schematic of Urah expression in three rostro-caudal coronal sections (~bregma 1.50, 0.98 and 0.14 mm); strong expression (magenta); sparse (light magenta). Boxed areas denote locations of dorsal (P) and ventral (Q) high-magnification images. T UMAP plot of Crym expression in the scRNA-Seq neurogenic lineage. (U-V) Confocal micrographs of Crym RNA (magenta), DCX (green), and GFAP (white) protein expression in the dorsal (U) and ventral (V) V-SVZ. (W-X). Quantification of DAPI+,S100B- Crym RNAscope puncta along the length of the V-SVZ (as in M: 0 = ventral-most extent, 1 = dorso-lateral-most extent of the wedge; n=3, bregma~ 1.42, 1.18 and 0.98 mm). X. Summary schematic of Crym expression in three rostro-caudal coronal sections (~bregma 1.50, 0.98 and 0.14 mm); strong expression (magenta); low expression (white). Boxed areas denote locations of dorsal (U) and ventral (V) high-magnification images. DAPI: blue, LV: lateral ventricle, d: dorsal, v: ventral, CC: corpus callosum, Str: striatum. Scale bars: 10 μm (K, L, P, Q, U, and V).
-
Figure 3—source data 1
Quantifications of Crym, Dio2, and Urah RNAscope spots.
- https://cdn.elifesciences.org/articles/67436/elife-67436-fig3-data1-v3.xlsx
Figure 3—figure supplement 1
Identification of quiescent B cell clusters.
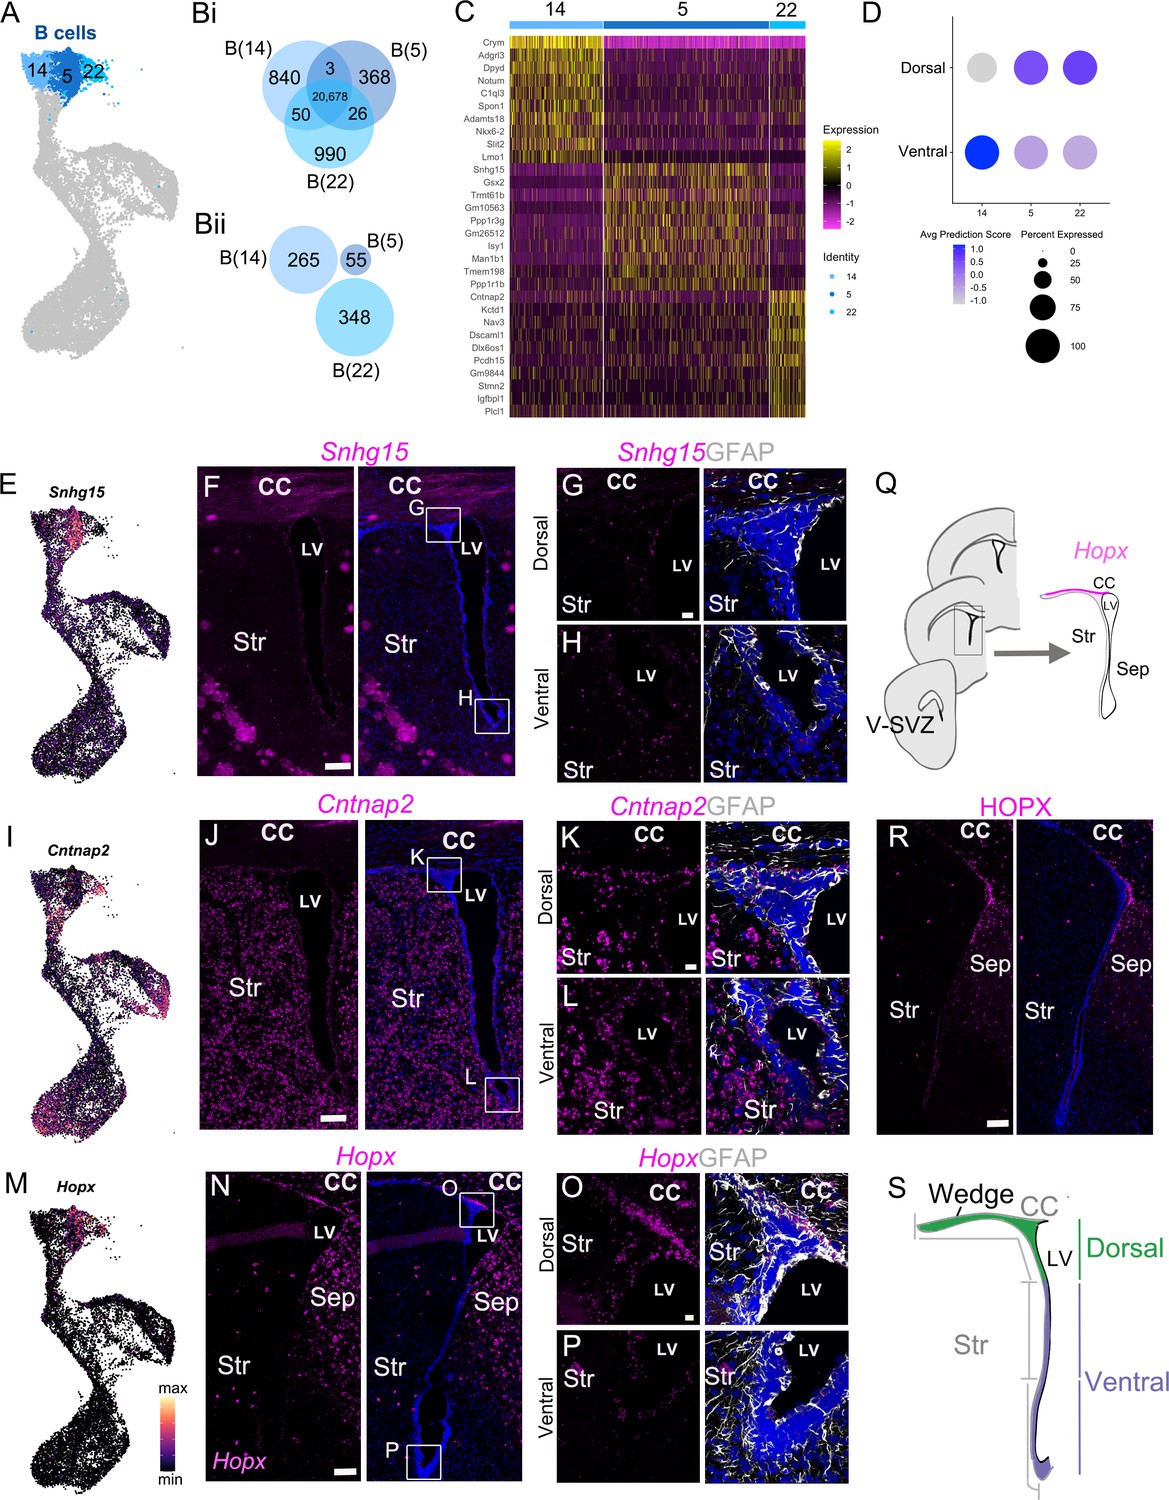
(A) UMAP plot of B cell cluster identities used in the following analysis: B(14), B(5), and B(22). (B) i Venn diagram summarizing differential gene expression analysis between clusters B(14), B(5), and B(22). ii Numbers of candidate marker genes identified after selecting significantly upregulated genes expressed in no more than 40% of cells of the other cluster. (C) Heatmap depicting expression of the top 10 differentially expressed genes between clusters B(14) (left), B(5) (center), and B(22) (right). (D) Dot plot of the average Dorsal or Ventral Dissection predicted identity scores for scRNA-Seq B cell clusters B(14), B(5), and B(22). (E) UMAP plot of Snhg15 expression in the scRNA-Seq neurogenic lineage. (F) Confocal micrograph of Snhg15 RNA (magenta) expression in the V-SVZ. Insets denote locations of high magnification images (G) and (H). (G-H) High magnification of dorsal (G) and ventral (H) V-SVZ regions denoted in (F) showing Snhg15 RNA (magenta) and GFAP protein (white) expression. (I) UMAP plot of Cntnap2 expression in the scRNA-Seq neurogenic lineage. (J) Confocal micrograph of Cntnap2 RNA (magenta) expression in the V-SVZ. Insets denote locations of high-magnification images (K) and (L). (K - L) High magnification of dorsal (K) and ventral (L) V-SVZ regions denoted in (J) showing Cntnap2 RNA (magenta) and GFAP protein (white) expression. (M) UMAP plot of Hopx expression in the scRNA-Seq neurogenic lineage. (N) Confocal micrograph of Hopx RNA (magenta) expression in the V-SVZ. Insets denote locations of high magnification images (O) and (P). (O - P) High magnification of dorsal (O) and ventral (P) V-SVZ regions denoted in (N) showing Cntnap2 RNA (magenta) and GFAP protein (white) expression. (Q) Summary schematic of anterior to posterior coronal brain sections analyzed (left) and one of the V-SVZ regions (boxed area on left, enlarged on right). Hopx expression is summarized as strong (magenta), sparse (light magenta), or absent (white) in different subregions of the V-SVZ. (R) Confocal micrograph of HOPX protein expression (magenta) in the V-SVZ. (S) Schematic of a coronal section of the lateral ventricle (LV) showing dorsal (green) and ventral (purple) domains and bins (gray) defined for quantifications. The dorsal bin (1) included the wedge and the dorsal V-SVZ exposed to the ventricle as indicated. The two ventral bins (2 and 3) were defined as the remaining V-SVZ on the lateral wall, equally divided in two. DAPI: blue, LV: lateral ventricle, CC: corpus callosum, Str: striatum. Scale bars: 100 μm (F, J, H, and R) 10 μm (G, H, K, L, O, and P).
Figure 3—figure supplement 2
Characterization of the sNucRNA-Seq dataset.
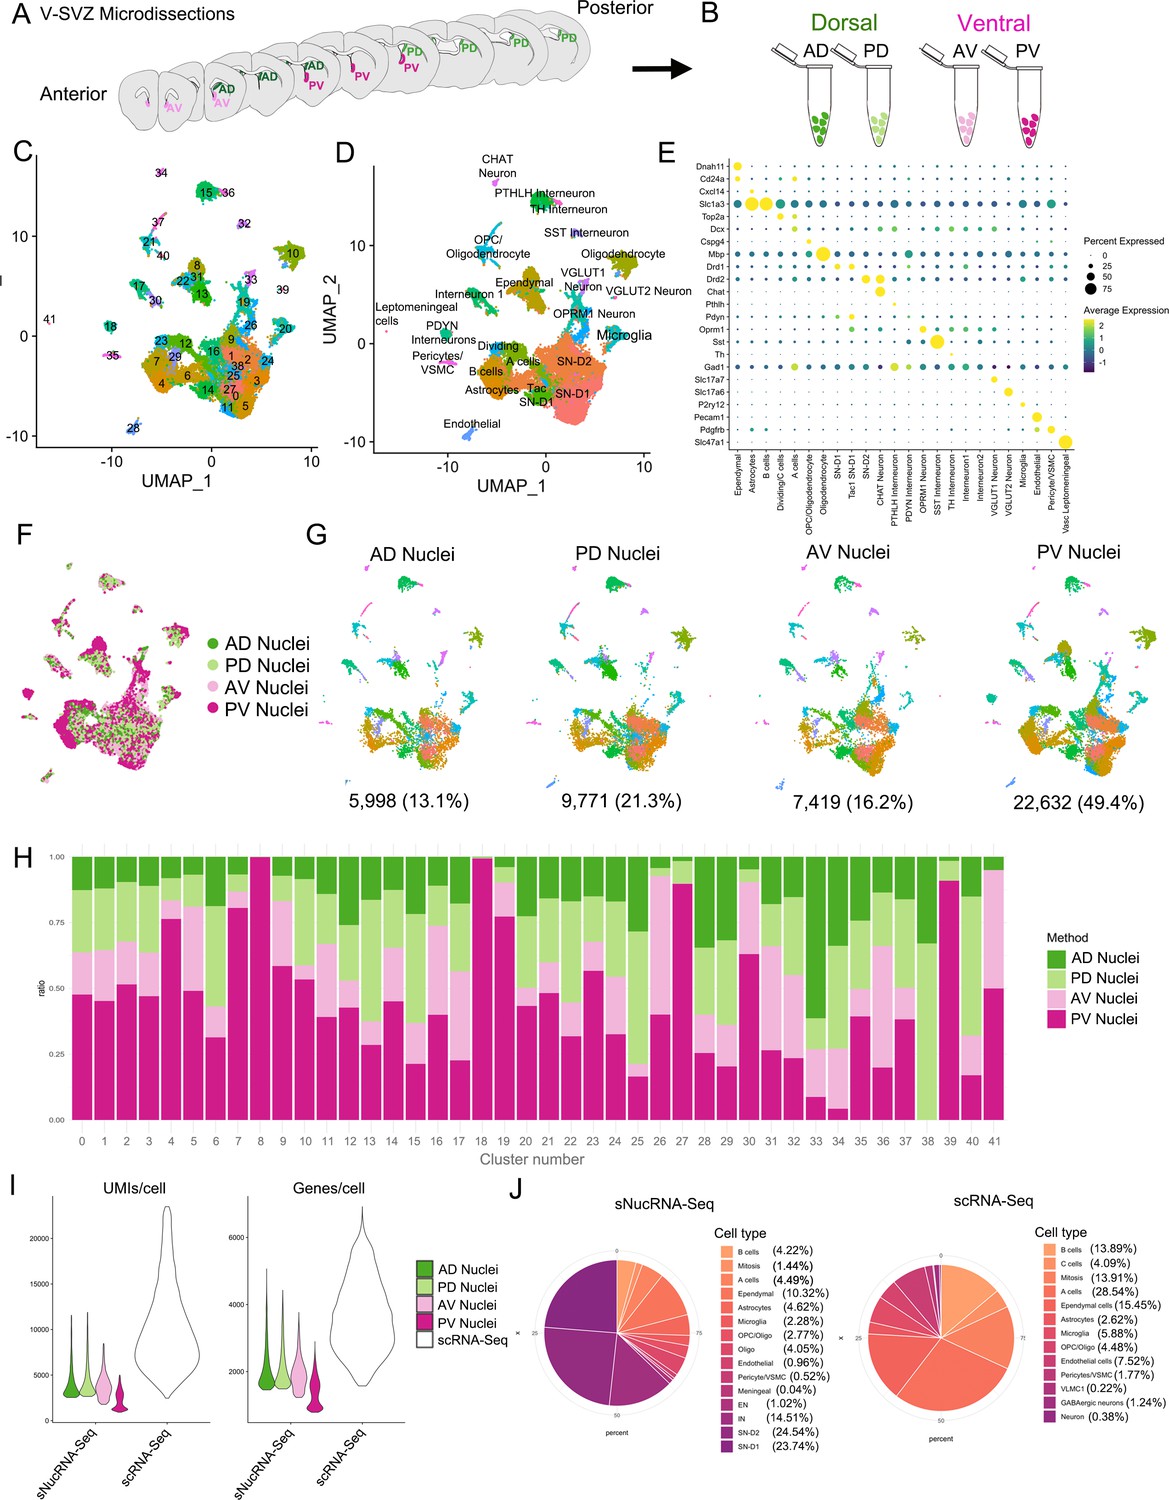
(A) Diagram representing the four V-SVZ microdissected regions: Anterior ventral (AV, pink), anterior dorsal (AD, dark green), posterior ventral (PV, magenta), and posterior dorsal (PD, light green). (B) Single nucleus suspensions from each region were processed as separate samples in parallel. (C) UMAP plot of sequenced nuclei after quality control filtering, color-coded by cluster number. (D) UMAP plot of sNucRNA-Seq cell types. (E) Dot plot of cell-type-specific marker expression in the clusters from (D). (F) UMAP plot of sequenced cells color-coded by region: AD (green), PD (light green), AV (pink), and PV (magenta). (G) UMAP plots of nuclei separated by region and color-coded by cluster number (see panel C). Below each plot is the number of nuclei and the percent of the total dataset originating from each region. (H) Ratio of nuclei within each cluster (see panel C) coming from each region sample. (I) Violin plot of the number of unique molecular identifiers (UMIs) detected per nucleus or cell (left panel), and number of genes detected per cell (right panel) in each sNucRNA-Seq region and in the scRNA-Seq dataset (white). Median UMIs: 9181scRNA-Seq/3,062sNucRNA-Seq, a threefold difference. Median genes: 3549scRNA-Seq/1,679sNucRNA-Seq, a 2.1-fold difference). (J) Pie charts of cell types represented in sNucRNA-Seq (left) and scRNA-Seq datasets (right). The scRNA-Seq dataset contains 60.4% neurogenic lineage cells (shades of orange; 14,660/24,261 total cells), compared to 10.6% in the sNucRNA-Seq dataset (4859/45,820 total nuclei). Conversely, the sNucRNA-Seq dataset contains 61.5% neurons (shades of purple; 28,185 nuclei, 13 subtypes (panel D), while the scRNA-Seq contains only 1.6% (395 cells, three subtypes; Figure 1A–B). The scRNA-Seq and sNucRNA-Seq datasets each contain 37.9% (9206 cells) and 25.1% (11,480 nuclei) glial cells, respectively (shades of plum). Cell types listed in each pie chart legend are plotted in order, clockwise from coordinate 0.
Figure 3—figure supplement 3
Gene Regulatory networks of dorsal and ventral B cell markers.
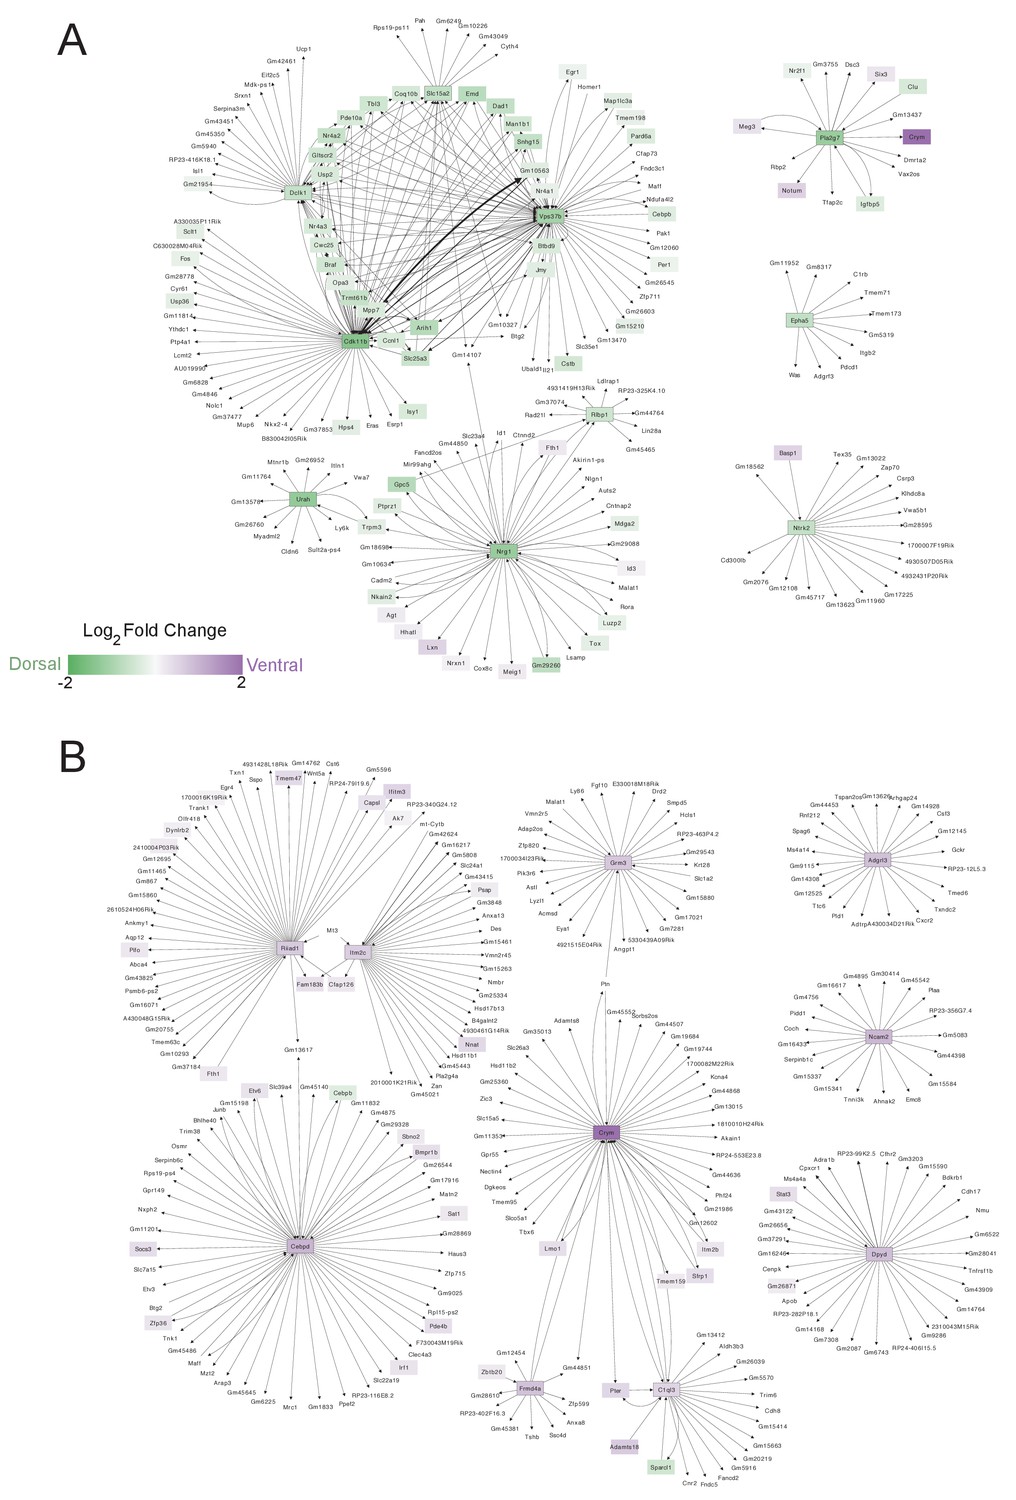
(A-B) Networks of predicted regulatory relationships (by GENIE3, visualized with Cytoscape) between (A) the top 10 markers of putative dorsal B cells (B(5+22)) and all transcripts expressed in B(5+22) or (B) the top 10 markers of putative ventral cells (B(14)) and all transcripts expressed in B(14). Color scale represents log2 fold change between B(5+22) and B(14), with genes upregulated in B(5+22) in green and genes upregulated in B(14) in purple. Black outlines demarcate the top 10 differentially expressed genes used to construct each network. Arrow thickness corresponds to the weight of the link between each pair of nodes. (A) The core dorsal network contains highly connected nodes including cell-cycle gene Cdk11b and Vps37b, as well as all three members of the nuclear receptor subfamily 4a (Nr4a1, Nr4a2, Nr4a3), steroid-thyroid hormone receptors. Interestingly, Pla2g7 in dorsal cells is predicted to (likely negatively) regulate the ventral marker Crym. (B) In the ventral network, two genes related to ciliary positioning (Cfap186) and neuronal survival (Fam183b) link two ventral markers and their corresponding regulatory modules. Three smaller, isolated networks are predicted to form around ventral marker genes. One large network forms around Crym, which we analyze in greater detail in Figure 3—figure supplement 4.
-
Figure 3—figure supplement 3—source data 1
Nodes and edges of gene regulatory networks of the top 10 dorsal or ventral DE genes in B cells.
- https://cdn.elifesciences.org/articles/67436/elife-67436-fig3-figsupp3-data1-v3.xlsx
Figure 3—figure supplement 4
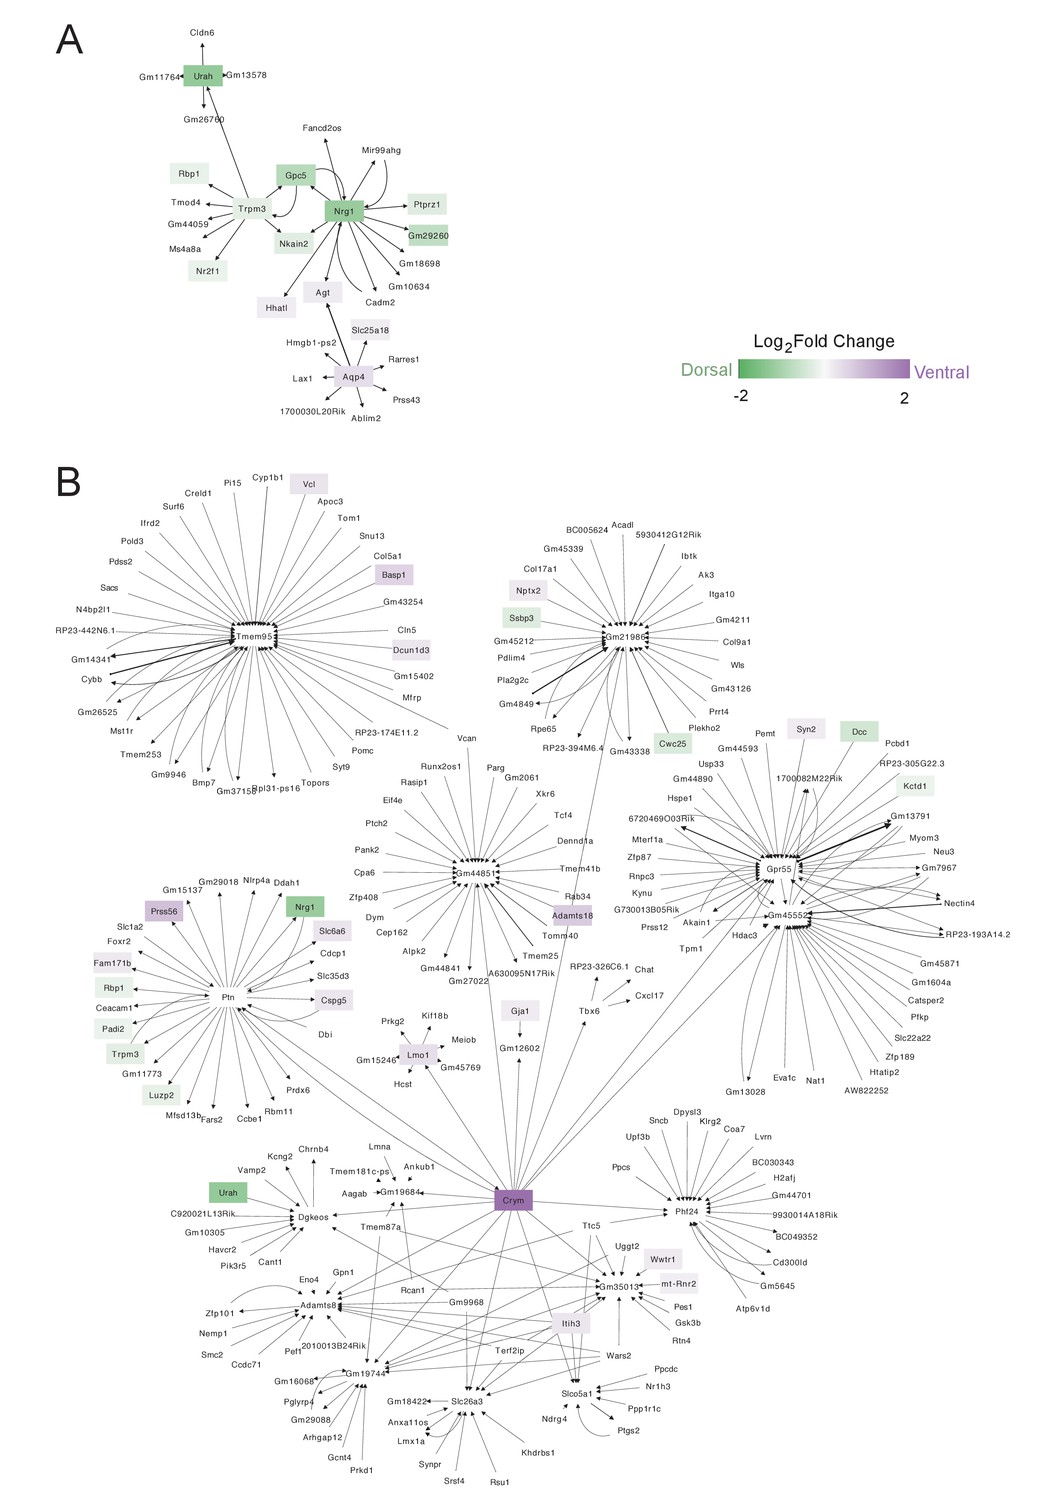
Urah and Crym-associated gene regulatory networks in dorsal and ventral B cells.
(A-B) Network of predicted regulatory relationships between (A) Urah and all genes in putative dorsal B cells or (B) Crym and all genes in putative ventral cells. Color scale represents log2 fold change in B(5+22) vs. B(14) for significantly differentially expressed genes. Arrow thickness corresponds to the weight of the link between each pair of nodes. Color scale represents log2 fold change between B(5+22) and B(14), with genes upregulated in B(5+22) in green and genes upregulated in B(14) in purple. Black outlines demarcate the top 10 differentially expressed genes used to construct each network. Arrow thickness corresponds to the weight of the link between each pair of nodes. (A) The main Urah-associated regulatory network forms around channel-related genes including Trpm3, Nkain2, and Nrg1. (B) Crym is predicted to regulate ventral marker Lmo1. Additionally, Ptn is at the center of a regulatory module that contains both dorsally and ventrally enriched genes, indicating that it may have a role in balancing the expression of genes important to both dorsal and ventral B cells.
-
Figure 3—figure supplement 4—source data 1
Nodes and edges of Urah or Crym gene regulatory networks in B cells.
- https://cdn.elifesciences.org/articles/67436/elife-67436-fig3-figsupp4-data1-v3.xlsx
Figure 4

Whole mounts reveal CRYM expression in a wide ventral domain.
(A-C) Confocal micrograph of a hGFAP:GFP coronal mouse brain section, where the V-SVZ is immunostained for GFP (green) and CRYM (magenta). B. High-magnification image of the dorsal wedge region of the V-SVZ. (C) High-magnification image of the ventral V-SVZ. (D-G) Immunostaining of CRYM (magenta) in a whole-mount preparation of the lateral wall of the V-SVZ, co-stained with β-CATENIN (white), with a summary schematic depicting the extent of the CRYM+ domain. (E–G) Higher magnification images of boxed regions in (D) showing the distribution of CRYM+ (magenta) in V-SVZ cells outlined by β-CATENIN (white). (H-I) High-magnification images of GFP+ (green) B1 cell-containing pinwheels in the dorsal (H) and ventral (I) V-SVZ outlined by β-CATENIN (white), also immunostained for CRYM (magenta). Quantifications showed that 95.11% ± 2.65 (SD) of the GFP+ B1 cells were CRYM+ in the ventral domain of the V-SVZ. In contrast, only 4.71% ± 1.38 (SD) of the GFP+ B1 cells in the dorsal region were CRYM+ (n=3; T-test, p<0.0001). (J-K) Immunogold transmission electron micrographs of CRYM+ B1 cell in the V-SVZ. K. High magnification of B1 cell apical contact with the lateral ventricle. A: anterior, P: posterior, D: dorsal, V: ventral. Scale bars: 150 μm (A), 20 μm (B and C), 200 μm (D), 50 μm (E, F and G), 10 μm (H and I), 2 μm (J), and 500 nm (K).
-
Figure 4—source data 1
Quantifications of CRYM+GFP+ B cells in coronal sections and whole mounts.
- https://cdn.elifesciences.org/articles/67436/elife-67436-fig4-data1-v3.xlsx
Figure 5 with 1 supplement
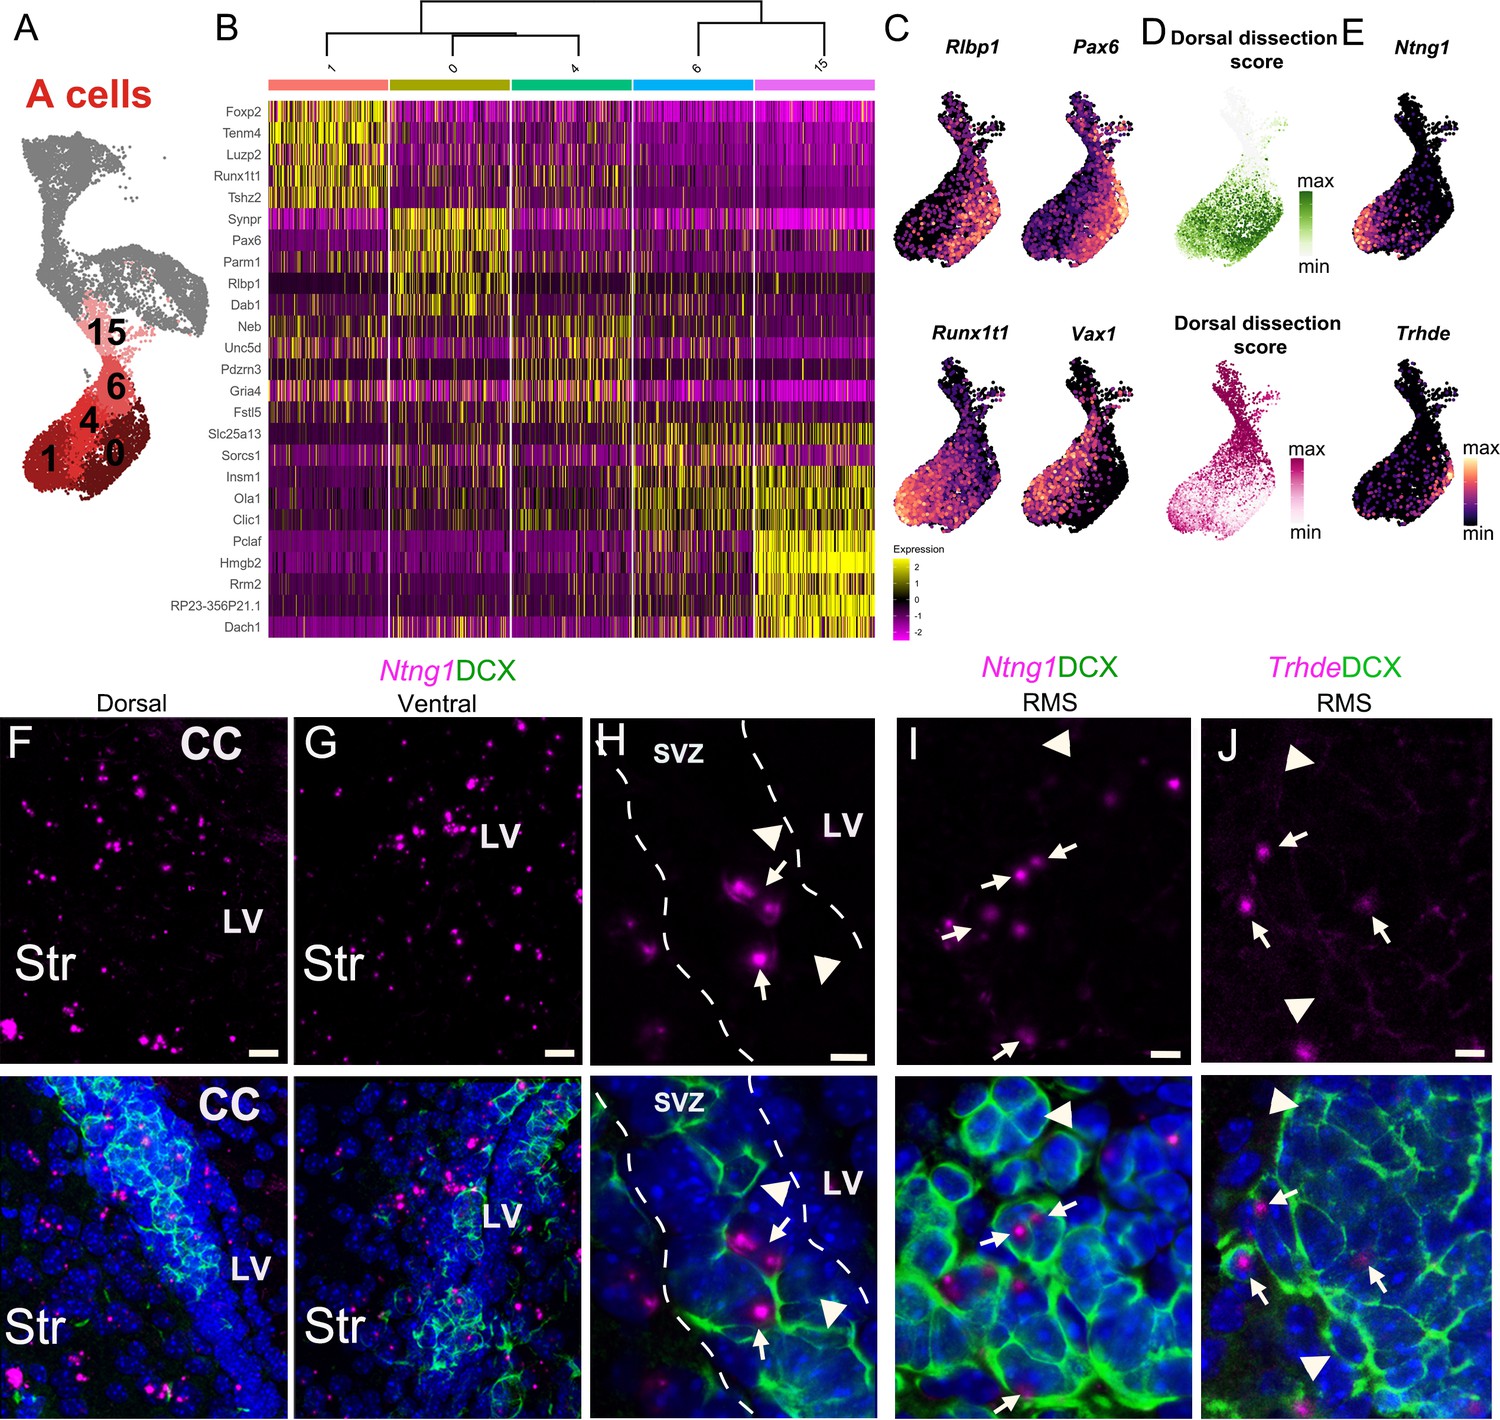
A cell cluster heterogeneity is linked to regionally organized dorsal/ventral domains.
(A) A cells are organized in five distinct clusters (1, 0, 4, 6, and 15). (B) Heatmap showing the top five differentially expressed genes for each of the five clusters. (C) The expression patterns of Rlbp1 and Runx1t1 are similar to Vax1 and Pax6, respectively, which are genes known to be enriched in ventral and dorsal domains of the V-SVZ. (D) The predicted regional dissection scores of each scRNA-Seq A cell plotted in UMAP space: cells with strong Dorsal Dissection prediction scores are green and strong Ventral Dissection prediction scores are dark magenta. (E) Expression patterns of marker genes Ntng1 and Trhde in A cells. (F-H) Expression of Ntng1 RNA (magenta) and DCX protein (green) in the dorsal (F) and ventral (G) V-SVZ, and high magnification of Ntng1-positive A cells (arrows) and Ntng1-negative A cells (arrowheads) in the V-SVZ (dotted lines) (see also Figure 5—figure supplement 1). (I) High magnification of Ntng1 puncta in DCX+ A cells (arrows), and Ntng1-negative A cells (arrowheads) in the RMS. (J) High-magnification image of Thrde RNA (magenta) in DCX+ A cells (arrows), along with Thrde-negative DCX+ A cells (arrowheads) in the RMS. DAPI: blue, RMS: rostral migratory stream, LV: lateral ventricle, CC: corpus callosum, Str: striatum. Scale bars: 10 μm (F and G), 5 μm (H, I, and J).
Figure 5—figure supplement 1
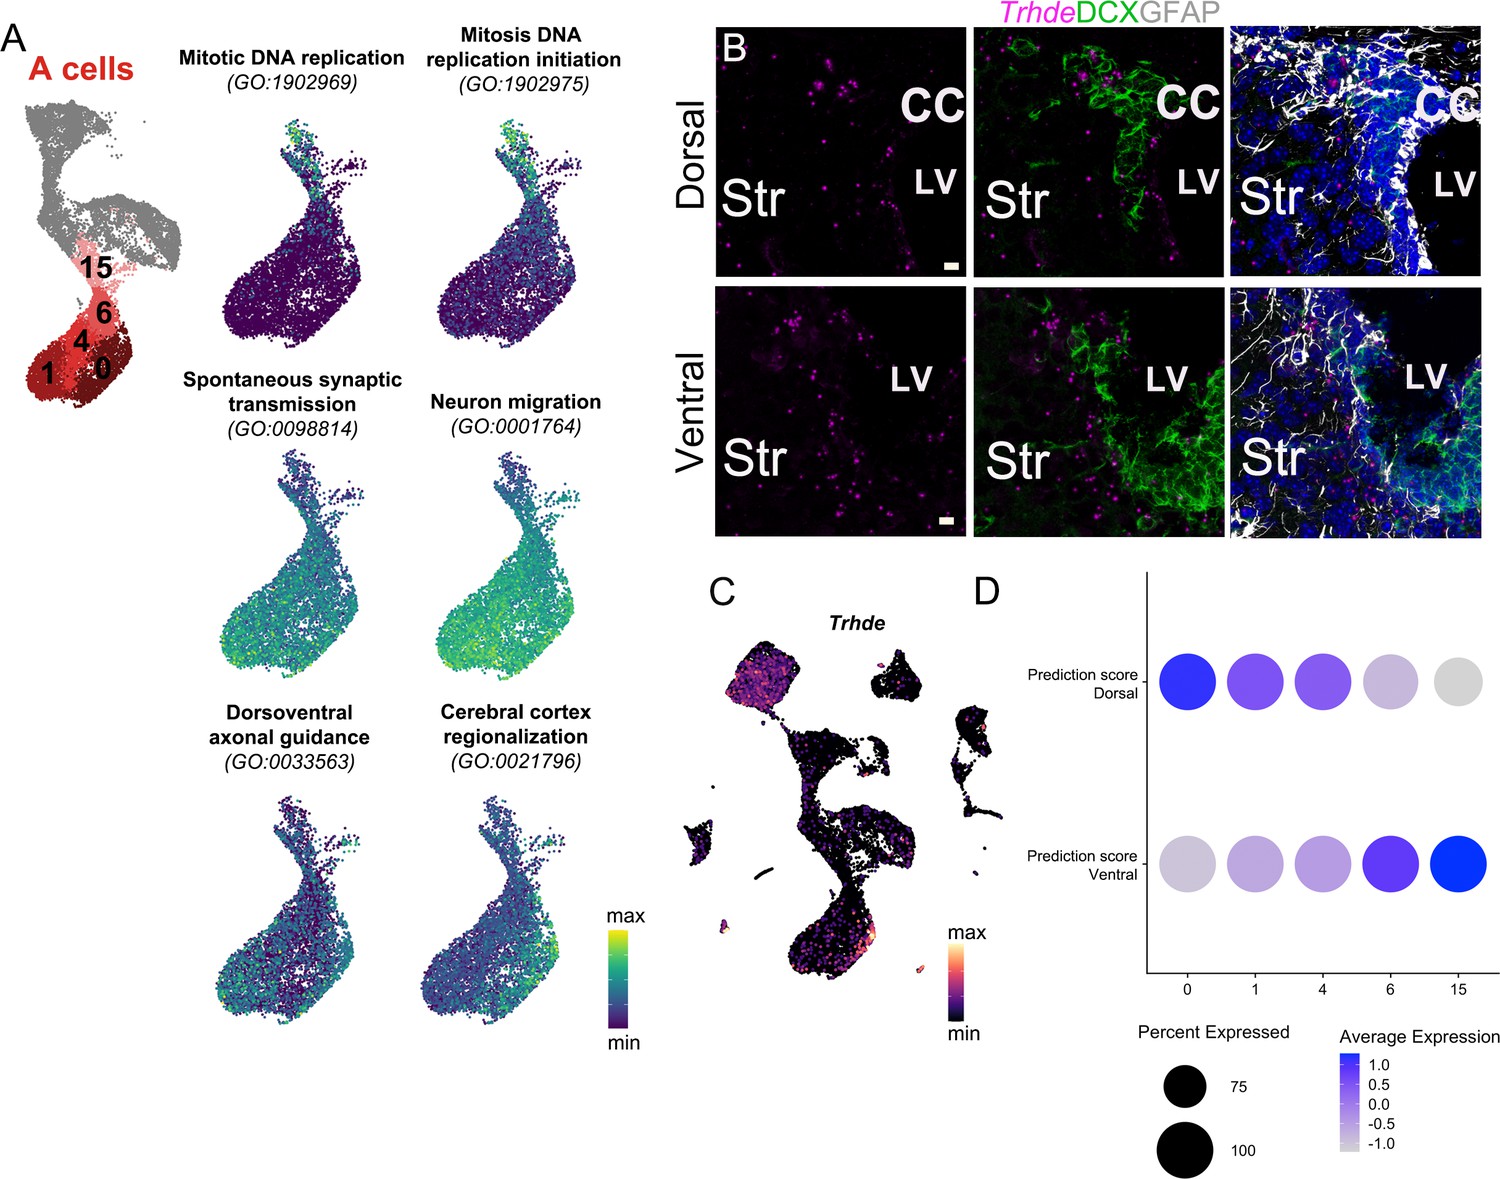
Characterization of A cell clusters.
(A) UMAP plot of A cell clusters, and UMAP plots of only A cell clusters labeled with AUCell scores of combined gene expression of genes contained in each of the six GO categories shown. (B) Trhde expression (magenta) in the dorsal (top row) and ventral (bottom row) V-SVZ, co-labeled with DCX (green) and GFAP (white) immunostaining. (C) Trhde expression in the full scRNA-Seq dataset. (D) Dot plot of the average Dorsal and Ventral Dissection prediction scores for each of the A cell clusters 0, 1, 4, 6, and 15. DAPI: blue, LV: lateral ventricle, CC: corpus callosum, Str: striatum. Scale bar: 10 μm (B).
Figure 6 with 1 supplement
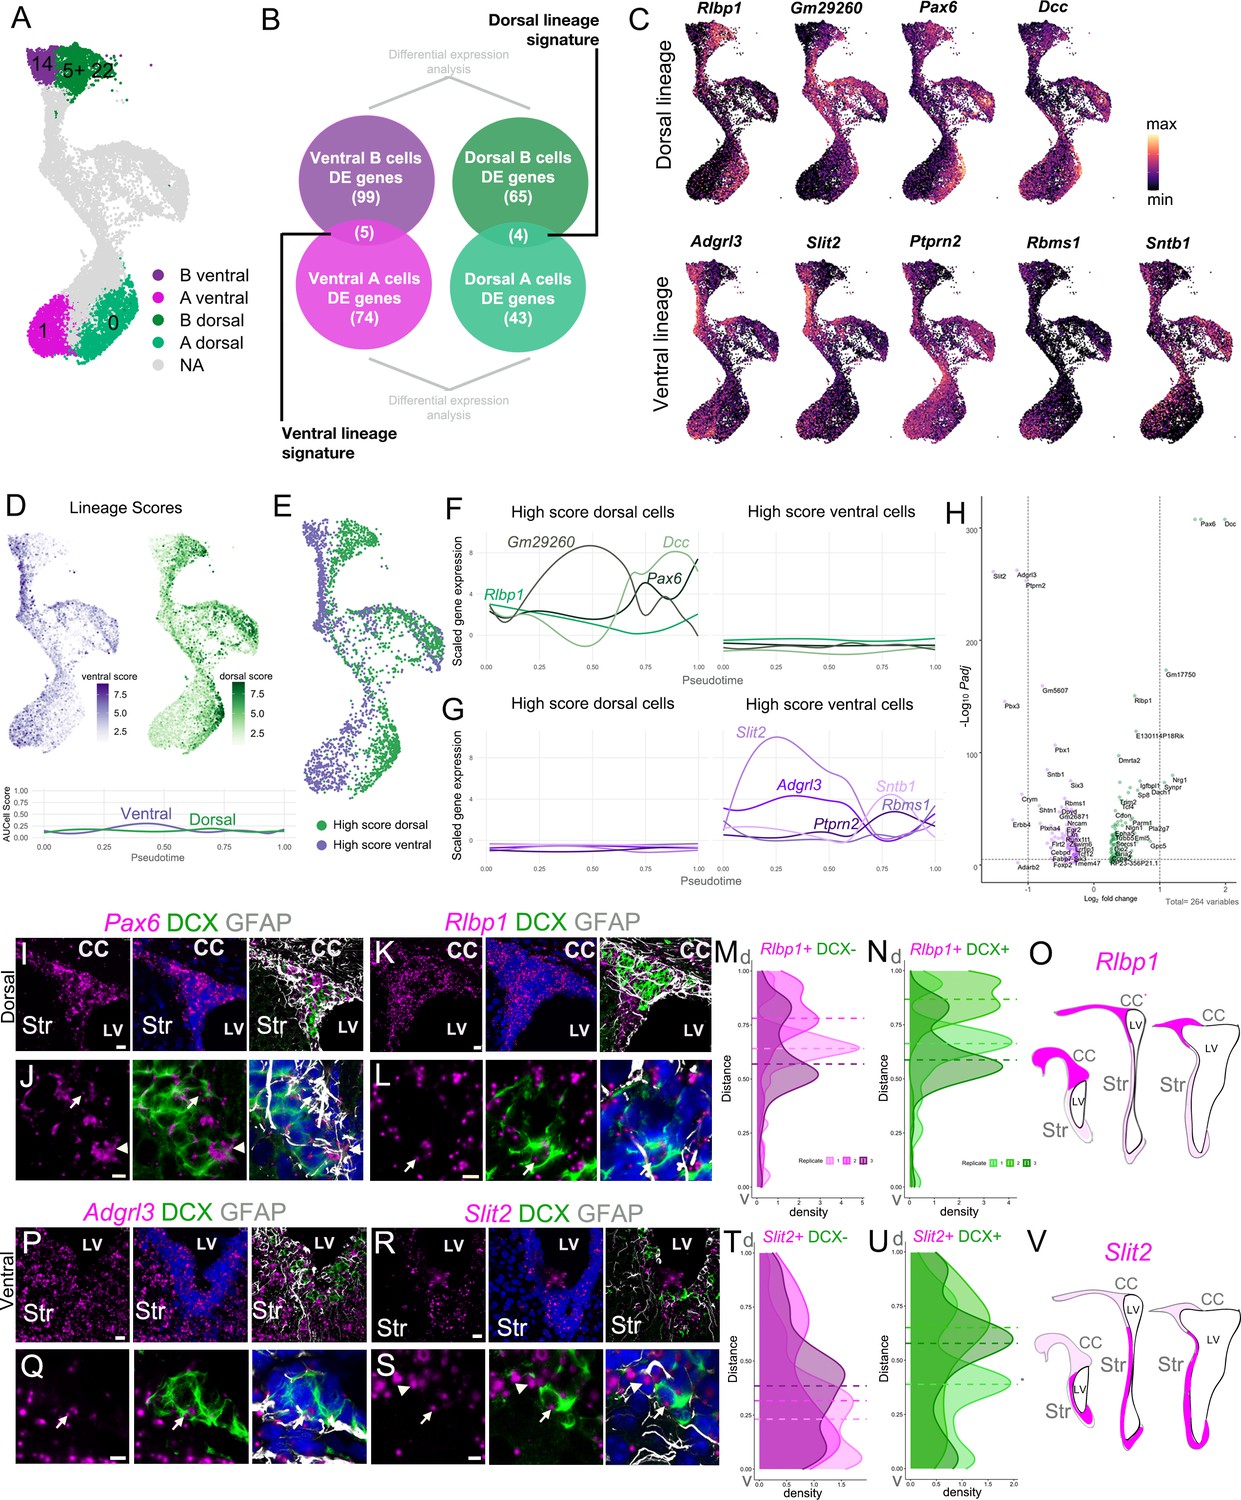
Regional transcriptional signatures are maintained along the neurogenic lineage.
(A) UMAP plot highlighting the putative dorsal and ventral B and A cell clusters. (B) Schematic illustrating the approach to identify genes that are differentially enriched in dorsal B and A, and ventral B and A cells, comparing B(14) to A(1) and B(5) and B(22) to A(0). (C) Expression patterns of dorsal (top row) and ventral markers (bottom row) identified as differentially enriched throughout the B-C-A lineage. (D) Cell scores based on the combined expression of genes in the ventral lineage signature (ventral score; purple) and genes in the dorsal lineage signature (dorsal score; green) throughout the neurogenic lineage. Lineage scores, as the combined expression of genes of the dorsal and ventral signatures, remain relatively constant throughout all cells along the neurogenic lineage. (E) High Score (top quartile of each lineage score) dorsal (green) and ventral (purple) cells in the neurogenic lineage. (F) Expression of dorsal signature genes in High Score dorsal (left) and High Score ventral cells (right) along the neurogenic lineage progression, assessed by pseudotime (see also Figure 6—figure supplement 1). (G) Expression of ventral signature genes in High Score dorsal (left) and High Score ventral cells (right) along the neurogenic lineage progression, assessed by pseudotime. (H) Volcano plot of significantly differentially expressed genes between High Score dorsal and High Score ventral neurogenic lineages. (I - J) RNAscope validation of dorsal lineage marker Pax6 (magenta) with DCX (green) and GFAP (white) immunostaining. High-magnification images of the V-SVZ dorsal wedge (I). J. High-magnification image of the V-SVZ where Pax6 colocalizes with an A cell (arrow) and B cell (arrowhead) (see also Figure 6—figure supplement 1). (K- L) RNAscope validation of dorsal lineage marker Rlbp1 (magenta) in the dorsal wedge (K). L. High-magnification images of Rlbp1 in the dorsal V-SVZ, where puncta are visible in a DCX-positive A cell (arrow). (M-O) Quantifications of DAPI+,DCX- (M) or DAPI+,DCX+ (N) Rlbp1 RNAscope puncta along the length of the V-SVZ (0 = ventral-most extent, 1 = dorso-lateral-most extent of the wedge) with the median puncta distribution location plotted as a horizontal line for each sample (n=3, each indicated by a different shade, ~ bregma 1.34, 1.18, and 0.98 mm). (O) Summary schematic of Rlbp1 expression in three rostro-caudal coronal sections (~bregma 1.50, 0.98, and 0.14 mm); strong expression (magenta); sparse (light magenta). Note that Pax6 showed a similar distribution. (P-Q) RNAscope validation of ventral lineage marker Adgrl3 (magenta) in the ventral V-SVZ. (Q) High-magnification image of Adgrl3 in the ventral V-SVZ, colocalizing with an A cell (arrow). (R-S). RNAscope validation of ventral lineage marker Slit2 (magenta) in the ventral V-SVZ. S. High-magnification image of the ventral V-SVZ, where Slit2 puncta colocalize with an A cell (arrow) and B cell (arrowhead). (T-V). Quantifications of DAPI+,DCX- (T) or DAPI+,DCX+ (U) Slit2 RNAscope puncta along the length of the V-SVZ (0 = ventral-most extent, 1 = dorso-lateral-most extent of the wedge) with the median puncta distribution location plotted as a horizontal line for each sample (n=3, each indicated by a different shade, ~ bregma 1.34, 1.18, and 0.62 mm). V. Summary schematic of Slit2 expression in three rostro-caudal coronal sections (~bregma 1.50, 0.98, and 0.14 mm); strong expression (magenta); sparse (light magenta). Note that Adgrl3 showed a similar distribution. CC: corpus callosum, Str: striatum, LV: lateral ventricle. Scale bars: 15 μm (K, P, and R), 10 μm (I), and 5 μm (J, L, Q, and S).
-
Figure 6—source data 1
Quantifications of Rlbp1 and Slit2 RNAscope spots.
- https://cdn.elifesciences.org/articles/67436/elife-67436-fig6-data1-v3.xlsx
Figure 6—figure supplement 1
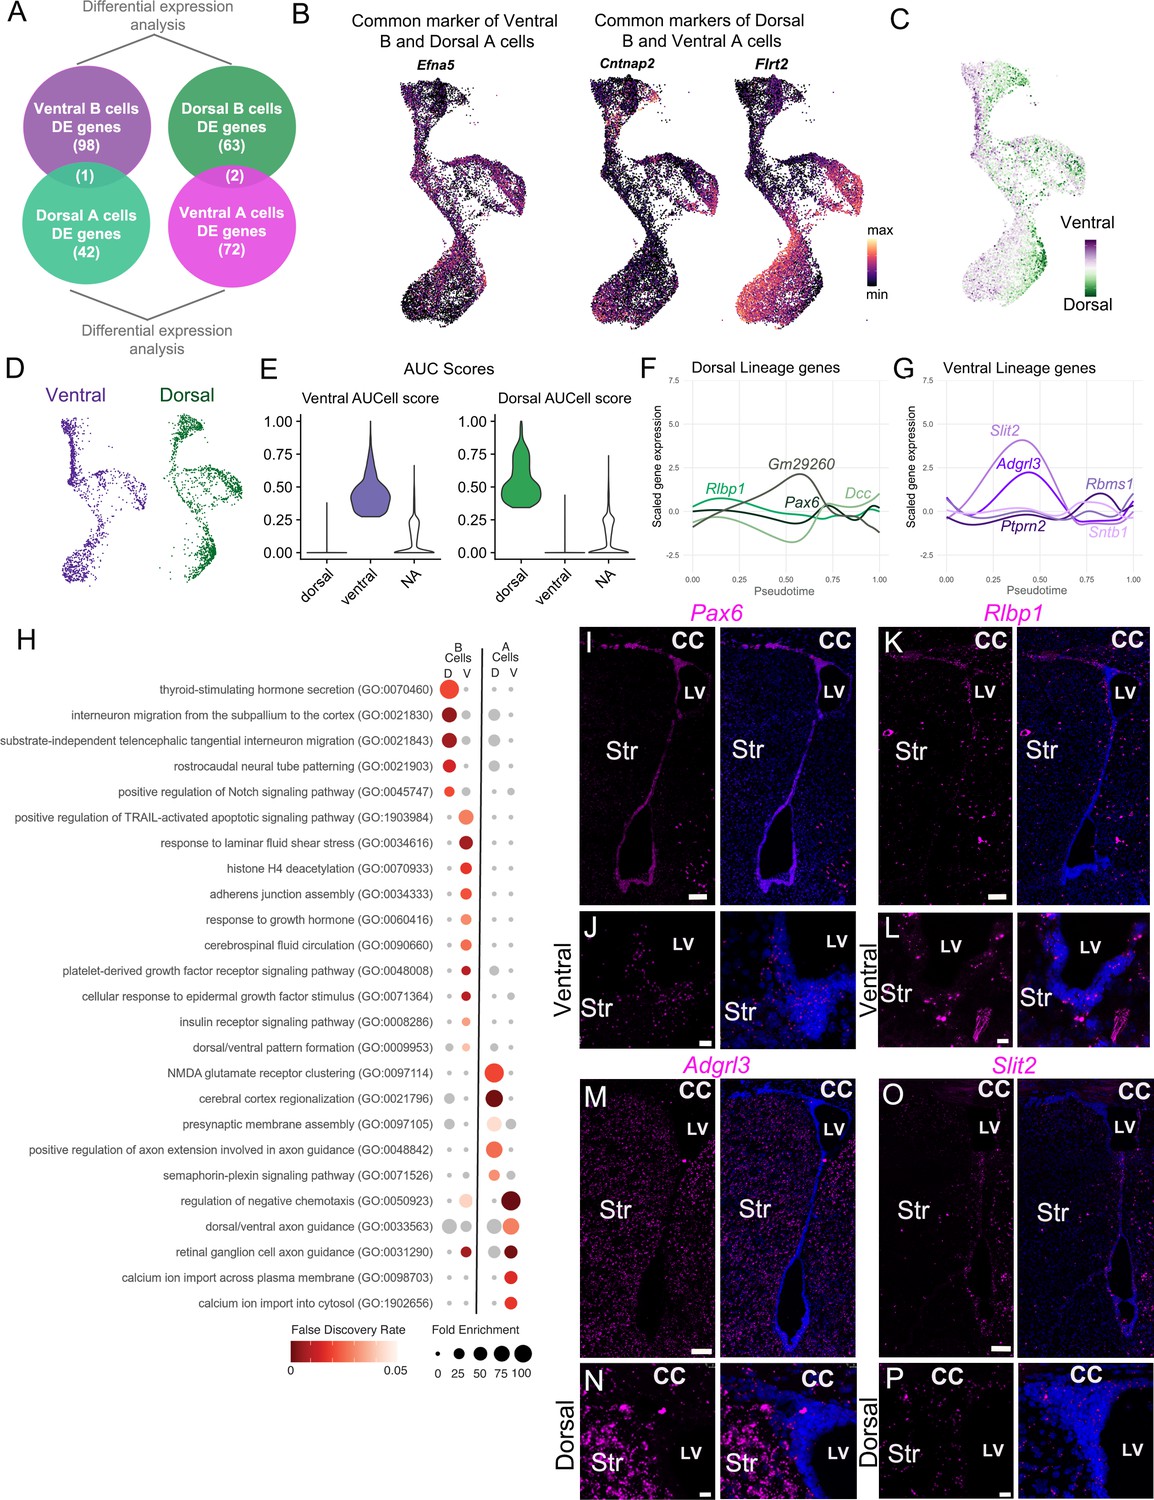
Characterization of dorsal and ventral neurogenic lineages.
(A) Schematic illustrating the control comparison to identify genes enriched in both ventral B and dorsal A cells, or in dorsal B and ventral A cells. (B) UMAP plots showing expression of the three genes identified in the analysis in (A), including Efna5, Cntnap2, and Flrt2. (C) UMAP plot colored by position score, based on net ventral (purple) and dorsal (green) AUCell scores. (D) UMAP of the neurogenic lineage split by classification into the ventral (purple) or dorsal (green) lineage. (E) Violin plots of AUCell score distribution of dorsal and ventral cells shown in (D). NA: cells not assigned. (F) Expression of dorsal signature genes in all cells along the neurogenic lineage progression represented by pseudotime. (G) Expression of ventral signature genes in all cells along the neurogenic lineage progression represented by pseudotime. (H) Gene ontology analysis on differentially expressed genes between High Score dorsal and ventral B cells and High Score dorsal and ventral A cells reveal overrepresented gene categories. (I-O) Low-magnification images of the entire V-SVZ in a coronal section, labeled with RNAscope probes (magenta) against Pax6 (J); Rlbp1 (L); Adgrl3 (N), and Slit2 (P). (J-L) High magnification of the ventral V-SVZ from panels I (J) and K (L). (N-P) High magnification of the dorsal V-SVZ from panel M (N) and O (P). Scale bars: 100 μm (I, K, M, and O) and 15 μm (J, L, N, and P).
Figure 7
scRNA-Seq reveals dorsal and ventral neurogenic lineage domains in the V-SVZ.
(A) A summary of cell types in the neurogenic lineage identified by scRNA-Seq and their classification into dorsal and ventral transcriptional identities. (B) Schematic depicting the dorsal and ventral domains newly identified by scRNA-Seq and snucRNA-Seq, and confirmed by staining and RNAscope.
Tables
Key resources table
| Reagent type (species) or resource | Designation | Source or reference | Identifiers | Additional information | |
|---|---|---|---|---|---|
| Genetic reagent (mouse) | hGFAP:GFP | The Jackson Laboratory (Zhuo et al., 1997) | Cat#003257 RRID:IMSR_JAX:003257 | Also referred as hGFAP::GFP: FVB/N-Tg(GFAPGFP)14Mes/J | |
| Antibody | Anti-ß-Catenin (Rabbit polyclonal) | Sigma | Cat#C2206 RRID:AB_476831 | IF (1:250) | |
| Antibody | Anti-CRYM (Mouse monoclonal) | Santa Cruz | Cat#sc-376687 RRID:AB_11150103 | also referred as anti-u-crystallin IF(1:100) | |
| Antibody | Anti-DCX (Rabbit polyclonal) | Cell signalling | Cat#4604S RRID:AB_561007 | IF (1:200) | |
| Antibody | Anti-GFAP (Chicken polyclonal) | Abcam | Cat#ab4674 RRID:AB_304558 | IF (1:500) | |
| Antibody | Anti-GFP (Chicken polyclonal) | Aves Labs | Cat#GFP1020 RRID:AB_10000240 | IF (1:400) | |
| Antibody | Anti-HOPX (Rabbit polyclonal) | Proteintech | Cat#11419–1-AP RRID:AB_10693525 | IF(1:500) | |
| Antibody | Anti-S100 (Rabbit polyclonal) | Dako | Cat#Z033 (discontinued) | IF(1:100) | |
| Antibody | Anti-Chicken Alexa Fluor 488 (Donkey) | Jackson ImmunoResearch Labs | Cat#703-545-155 RRID:AB_2340375 | IF(1:500) | |
| Antibody | Anti-Chicken Alexa Fluor 647 (Donkey) | Jackson ImmunoResearch Labs | Cat#703-605-155 RRID:AB_2340379 | IF(1:500) | |
| Antibody | Anti-mouse Alexa Fluor 647 (Donkey) | Invitrogen | Cat#A31571 RRID:AB_162542 | IF(1:500) | |
| Antibody | Anti-rabbit Alexa Fluor 555 (Donkey) | Invitrogen | Cat#A31572 RRID:AB_162543 | IF(1:500) | |
| Antibody | Anti-mouse ultrasmall0.8 nm IgG | Aurion, EMS | Cat#800.022 RRID:AB_2632382 | IF(1:50) | |
| Antibody | Donkey anti-rabbit biotinylated | Jackson ImmunoResearch | Cat#711-065-152 RRID:AB_2340593 | IF(1:400) | |
| Antibody | Anti-CD106 (Rat) oligonucleotide tag | BioLegend | Cat#105725 RRID:AB_2783044 | 1 µg/1 million cells | |
| Antibody | Anti-CD24 (Rat) oligonucleotide tag | BioLegend | Cat#101841 RRID:AB_2750380 | 1 µg/1 million cells | |
| Sequence-based reagent | MULTIseq barcode | PMID:31209384 | https://gartnerlab.ucsf.edu/more.php | TGAGACCT (A3) | |
| Sequence-based reagent | MULTIseq barcode | PMID:31209384 | https://gartnerlab.ucsf.edu/more.php | GCACACGC (A4) | |
| Sequence-based reagent | MULTIseq barcode | PMID:31209384 | https://gartnerlab.ucsf.edu/more.php | AGAGAGAG (A5) | |
| Sequence-based reagent | MULTIseq barcode | PMID:31209384 | https://gartnerlab.ucsf.edu/more.php | TCACAGCA (A6) | |
| Sequence-based reagent | Chromium i7 Multiplex kit | 10x Genomics | PN-120262 | Index numbers B12 and C1 | |
| Chemical compound | Red blood cell lysis buffer | BioLegend | Cat#420301 | ||
| Chemical compound | Myelin removal beads | Miltenyi Biotec | Cat#130-096-733 | ||
| Chemical compound | TSA fluorescein reagent pack | Akoya Biosciences | Cat#SAT701001EA | ||
| Chemical compound | TNB Blocking Buffer | Akoya Biosciences | Cat#FP1012 | ||
| Commercial assay or kit | Papain Dissociation System-EBSS | Worthington | Cat#LK003150 | ||
| Commercial assay or kit | Chromium Single cell 3’ Library and Gel Bead Kit v2 | 10x Genomics | Cat#PN-120267 | ||
| Commercial assay or kit | Chromium Single cell 3’ GEM, Library and Gel Bead Kit v3 | 10x Genomics | Cat#PN-1000092 | ||
| Commercial assay or kit | RNAscope 2.5 HD Red Detection kit | Advanced Cell Diagnostics | Cat#320497 | ||
| Commercial assay or kit | RNAscope 2.5 HD Duplex Detection kit | Advanced Cell Diagnostics | Cat#322430 | ||
| Commercial assay or kit | Mm-Lphn3 (Adgrl3) | Advanced Cell Diagnostics | Cat#317481 | ||
| Commercial assay or kit | Mm-Crym | Advanced Cell Diagnostics | Cat#466131 | ||
| Commercial assay or kit | Mm-Cnatnp2 | Advanced Cell Diagnostics | Cat#449381 | ||
| Commercial assay or kit | DapB | Advanced Cell Diagnostics | Cat#310043 | used as negative control | |
| Commercial assay or kit | Mm-Dio2 | Advanced Cell Diagnostics | Cat#479331 | ||
| Commercial assay or kit | Mm-Hopx | Advanced Cell Diagnostics | Cat#405161 | ||
| Commercial assay or kit | Mm-Ntng1-C2 | Advanced Cell Diagnostics | Cat#488871-C2 | ||
| Commercial assay or kit | Mm-Pax6 | Advanced Cell Diagnostics | Cat#412821 | ||
| Commercial assay or kit | Mm-PPIB | Advanced Cell Diagnostics | Cat#313911 | used as positive control | |
| Commercial assay or kit | Mm-Rlbp1 | Advanced Cell Diagnostics | Cat#468161 | ||
| Commercial assay or kit | Mm-Snhg15 | Advanced Cell Diagnostics | Cat#889191 | ||
| Commercial assay or kit | Mm-Slit2 | Advanced Cell Diagnostics | Cat#449691 | ||
| Commercial assay or kit | Mm-Trhde | Advanced Cell Diagnostics | Cat#450781 | ||
| Commercial assay or kit | Mm-Urah-C2 | Advanced Cell Diagnostics | Cat#525331-C2 | ||
| Commercial assay or kit | Silver enhancement kit | Aurion, EMS | Cat#25520 | ||
| Software, algorithm | Cellranger 2.1.0-v2.3.0 and 3.0.2-v3.2.0 | 10x Genomics | RRID:SCR_017344 | ||
| Software, algorithm | Seurat V3 (Rstudio package) | https://satijalab.org/seurat/ | RRID:SCR_007322 | ||
| Software, algorithm | scVelo | https://scvelo.readthedocs.io | RRID:SCR_018168 | ||
| Software, algorithm | Panther | http://www.pantherdb.org | RRID:SCR_004869 | ||
| Software, algorithm | GENIE3 | https://github.com/vahuynh/GENIE3 | RRID:SCR_000217 | ||
| Software, algorithm | BiNGO | https://apps.cytoscape.org/apps/bingo | RRID:SCR_005736 | ||
| Software, algorithm | Cytoscape | https://cytoscape.org | RRID:SCR_003032 | ||
| Software, algorithm | sp (Rstudio package) | https://edzer.github.io/sp/ | RRID:SCR_021328 | ||
| Software, algorithm | Imaris v9.6–9.7 | Oxford instruments | RRID:SCR_007370 | ||
| Software, algorithm | Adobe Photoshop | Adobe | RRID:SCR_014199 | ||
| Software, algorithm | Adobe Illustrator | Adobe | RRID:SCR_010279 | ||
| Software, algorithm | AUCell 3.13 | https://bioconductor.org/packages/release/bioc/html/AUCell.html | RRID:SCR_021327 | ||
Additional files
-
Supplementary file 1
B cells vs. astrocytes: DE genes and GO terms.
- https://cdn.elifesciences.org/articles/67436/elife-67436-supp1-v3.xlsx
-
Supplementary file 2
Cell cycle phase summary.
- https://cdn.elifesciences.org/articles/67436/elife-67436-supp2-v3.xlsx
-
Supplementary file 3
B cell clusters DE genes and GO terms.
- https://cdn.elifesciences.org/articles/67436/elife-67436-supp3-v3.xlsx
-
Supplementary file 4
A cell clusters DE genes and GO terms.
- https://cdn.elifesciences.org/articles/67436/elife-67436-supp4-v3.xlsx
-
Supplementary file 5
Dorsal and ventral lineages DE genes and GO terms.
- https://cdn.elifesciences.org/articles/67436/elife-67436-supp5-v3.xlsx
-
Supplementary file 6
sNucRNA-seq dorsal and ventral B cells differential gene expression analysis.
- https://cdn.elifesciences.org/articles/67436/elife-67436-supp6-v3.xlsx
-
Supplementary file 7
GFP gene sequence.
- https://cdn.elifesciences.org/articles/67436/elife-67436-supp7-v3.xlsx
-
Transparent reporting form
- https://cdn.elifesciences.org/articles/67436/elife-67436-transrepform-v3.docx
Download links
A two-part list of links to download the article, or parts of the article, in various formats.
Downloads (link to download the article as PDF)
Open citations (links to open the citations from this article in various online reference manager services)
Cite this article (links to download the citations from this article in formats compatible with various reference manager tools)
Single-cell analysis of the ventricular-subventricular zone reveals signatures of dorsal and ventral adult neurogenesis
eLife 10:e67436.
https://doi.org/10.7554/eLife.67436


