SIRT1 regulates sphingolipid metabolism and neural differentiation of mouse embryonic stem cells through c-Myc-SMPDL3B
- Signal Transduction Laboratory, National Institute of Environmental Health Sciences, Research Triangle Park, United States
- CAS Key Laboratory of Computational Biology, CAS-MPG Partner Institute for Computational Biology, Shanghai Institute of Nutrition and Health, Shanghai Institutes for Biological Sciences, University of Chinese Academy of Sciences, CAS Center for Excellence in Molecular Cell Science, Chinese Academy of Sciences, China
- Integrative Bioinformatics Support Group, National Institute of Environmental Health Sciences, Research Triangle Park, United States
- Biostatistics & Computational Biology Branch, National Institute of Environmental Health Sciences, Research Triangle Park, United States
- Children's Medical Center Research Institute, Department of Pediatrics, Harold C. Simmons Comprehensive Cancer Center, and Hamon Center for Regenerative Science and Medicine, University of Texas Southwestern Medical Center, United States
Figures
Figure 1 with 1 supplement

Deletion of SIRT1 in mESCs results in a dramatic accumulation of sphingomyelin.
(A) Metabolomic analysis reveals a massive accumulation of sphingolipids in SIRT1 KO mESCs. WT and SIRT1 KO mESCs were cultured in a complete mESC maintenance medium (M10) and metabolites were analyzed by metabolomics as described in Materials and methods. The networks of significantly changed metabolites in lipid metabolism were analyzed by Cytoscape 2.8.3. Metabolites increased in SIRT1 KO mESCs were labeled red (p<0.05) or pink (0.05 < p < 0.10), metabolites decreased in SIRT1 KO mESCs were labeled blue (p<0.05) or light blue (0.05 < p < 0.10). Metabolite node size is proportional to the fold change in KO vs WT (n = 5 biological replicates). (B) The relative abundance of different metabolites mapped into sphingolipid metabolism pathways. Metabolites in sphingolipid metabolism in WT and SIRT1 KO mESCs were analyzed as in (A) and the relative abundance of metabolites involved in sphingolipid metabolism was displayed by the heat map (n = 5 biological replicates). (C–D) SIRT1 KO mESCs have increased levels of BODIPY FL-labeled sphingomyelin. WT and SIRT1 KO mESCs cultured in ESGRO medium were labeled with BODIPY FL-labeled sphingomyelin for 30 min at 4°C then chased at 37°C for 30 min. The intensity of BODIPY FL-labeled sphingomyelin in cells was analyzed by (C) confocal fluorescence imaging and by (D) quantitative FACS (n = 3 biological replicates, ***p<0.001). Scale bars: 20 µm. (E) SIRT1 KO mESCs have increased levels of endogenous sphingomyelin. WT and SIRT1 KO mESCs cultured in ESGRO medium were extracted and total levels of endogenous sphingomyelin were determined in extracts by an enzyme-coupled colorimetric assay as described in Materials and methods (n = 3 biological replicates, *p<0.05). (F–H) Deletion of SIRT1 in E14 mESCs leads to accumulation of sphingomyelin. (F) SIRT1 was deleted in E14 mESC line using CRISPR/cas9 mediated gene editing technology and (G) relative levels of BODIPY FL-labeled sphingomyelins were imaged and (H) measured (n = 2 independent clones with three biological replicates for each clone, ***p<0.001). GC-01, pCRISPR-CG01 vector. Scale bars: 20 µm.
-
Figure 1—source data 1
Numerical data for bar graphs in D, E, and H.
- https://cdn.elifesciences.org/articles/67452/elife-67452-fig1-data1-v2.xlsx
-
Figure 1—source data 2
Uncut immunoblots in F.
- https://cdn.elifesciences.org/articles/67452/elife-67452-fig1-data2-v2.pdf
Figure 1—figure supplement 1
Deletion of SIRT1 in ESCs results in a dramatic accumulation of sphingomyelin.
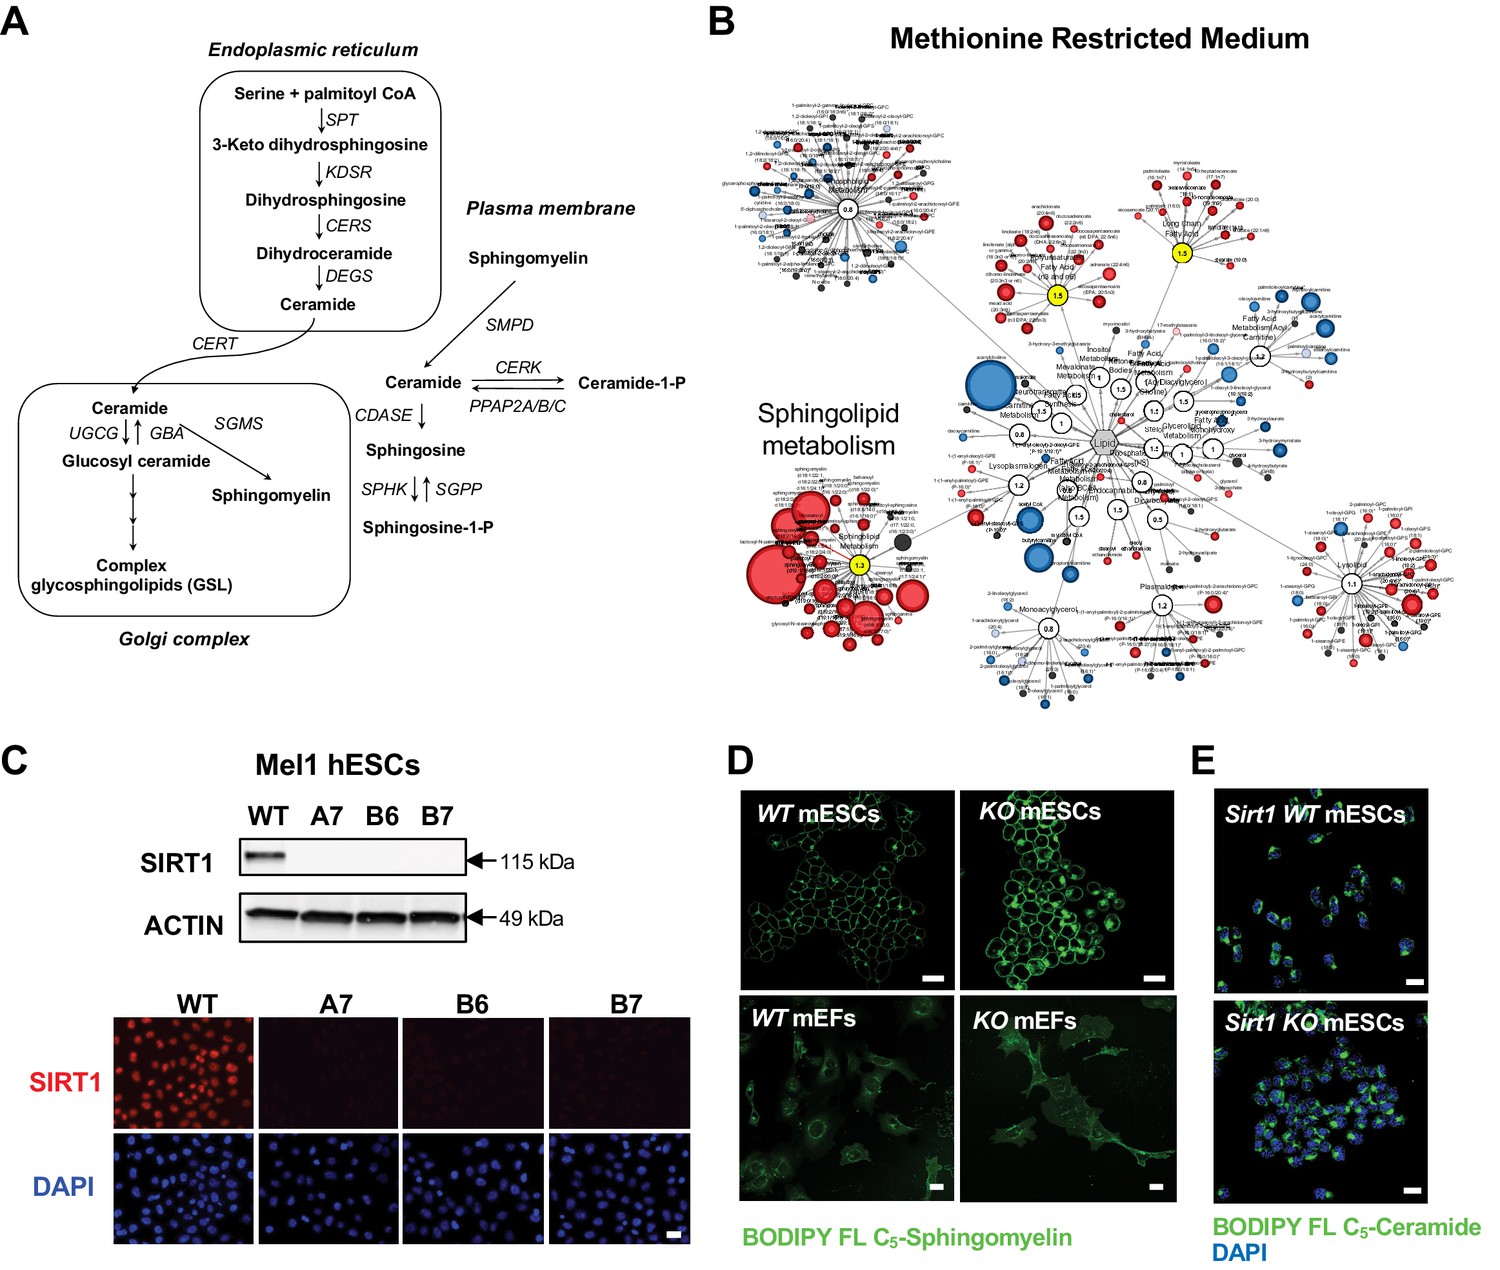
(A) Key sphingolipid metabolic pathways (modified from Chen et al., 2010). SPT: serine palmitoyl transferase; KDSR: 3-keto dihydrosphingosine reductase; CERS, ceramide synthase; DEGS: dihydroceramide desaturase; CERT: ceramide transfer protein; UGCG: UDP-glucose ceramide glucosyltransferase; GBA: glucosyl ceramidase; SGMS: sphingomyelin synthase; SMPD: sphingomyelin phosphodiesterase; CERK: ceramide kinase; PPAP2A/B/C: phosphatidic acid phosphatase 2A/B/C; CDASE: ceramidase; SPHK: sphingosine kinase; SGPP: sphingosine-1-phosphate phosphatase. (B) Metabolomic analysis reveals a massive accumulation of sphingolipids in SIRT1 KO mESCs cultured in methionine restricted medium. WT and SIRT1 KO mESCs were cultured in a methionine restricted M10 medium containing 6 µM of methionine for 6 hr and metabolites were analyzed by metabolomics as described in Methods. The networks of significantly changed metabolites in lipid metabolism were analyzed by Cytoscape 2.8.3. Metabolites increased in SIRT1 KO mESCs were labeled red (p<0.05) or pink (0.05 < p < 0.10), metabolites decreased in SIRT1 KO mESCs were labeled blue (p<0.05) or light blue (0.05 < p < 0.10). Metabolite node size is proportional to the fold change in KO vs WT (n = 5 biological replicates). (C) Deletion of SIRT1 in mel1 hESCs. SIRT1 KO hESCs were generated by CRISPR/Cas9 technology. The expression of SIRT1 protein was analyzed in three independent SIRT1 KO hESC lines by immuno-blotting (up) or immunofluorescent staining (bottom) with anti-SIRT1 antibodies. Bar, 20 μm. (D) Deletion of SIRT1 induces accumulation of sphingomyelin in mESCs but not in MEFs. Bars: 20 µm. (E) SIRT1 KO mESCs have comparable levels of ceramide as WT mESCs. WT and SIRT1 KO mESCs were labeled with BODIPY FL- ceramide for 30 min at 4°C then chased at 37°C for 30 min. Bars: 20 µm.
Figure 2 with 1 supplement

SIRT1-deficient mESCs have reduced expression of SMPDL3B and sphingomyelin degradation.
(A) SIRT1 KO mESCs have reduced mRNA levels of Smpdl3b. WT and SIRT1 KO mESCs were cultured in either ESGRO medium or M10 medium. The mRNA levels of indicated enzymes involved in sphingomyelin synthesis (Sgms) and degradation (Smpd) were analyzed by qPCR (n = 3 biological replicates, *p<0.05, **p<0.01). (B–C) SIRT1 KO mESCs have reduced protein levels of SMPDL3B. The protein levels of SMPDL3B were analyzed by (B) immunoblotting and (C) immuno-fluorescence staining. Scale bars: 20 µm. (D) SIRT1 KO mESCs have reduced degradation of sphingomyelin. WT and SIRT1 KO mESCs were preloaded with BODIPY FL-C5 sphingomyelin for 30 min at 4°C, then incubated with BODIPY FL-C5 sphingomyelin-free medium at 37°C. The dynamic of BODIPY FL-sphingomyelin was monitored for additional 12 hr at 37°C. WT and SIRT1 KO mESC clones that have comparable preloaded levels of BODIPY FL-C5 sphingomyelin were shown. Scale bars: 20 µm.
-
Figure 2—source data 1
Numerical data for bar graphs in A.
- https://cdn.elifesciences.org/articles/67452/elife-67452-fig2-data1-v2.xlsx
-
Figure 2—source data 2
Uncut immunoblots in B.
- https://cdn.elifesciences.org/articles/67452/elife-67452-fig2-data2-v2.pdf
Figure 2—figure supplement 1
Expression of sphingolipid synthesis and degrading enzymes in WT and SIRT1 KO mESCs.
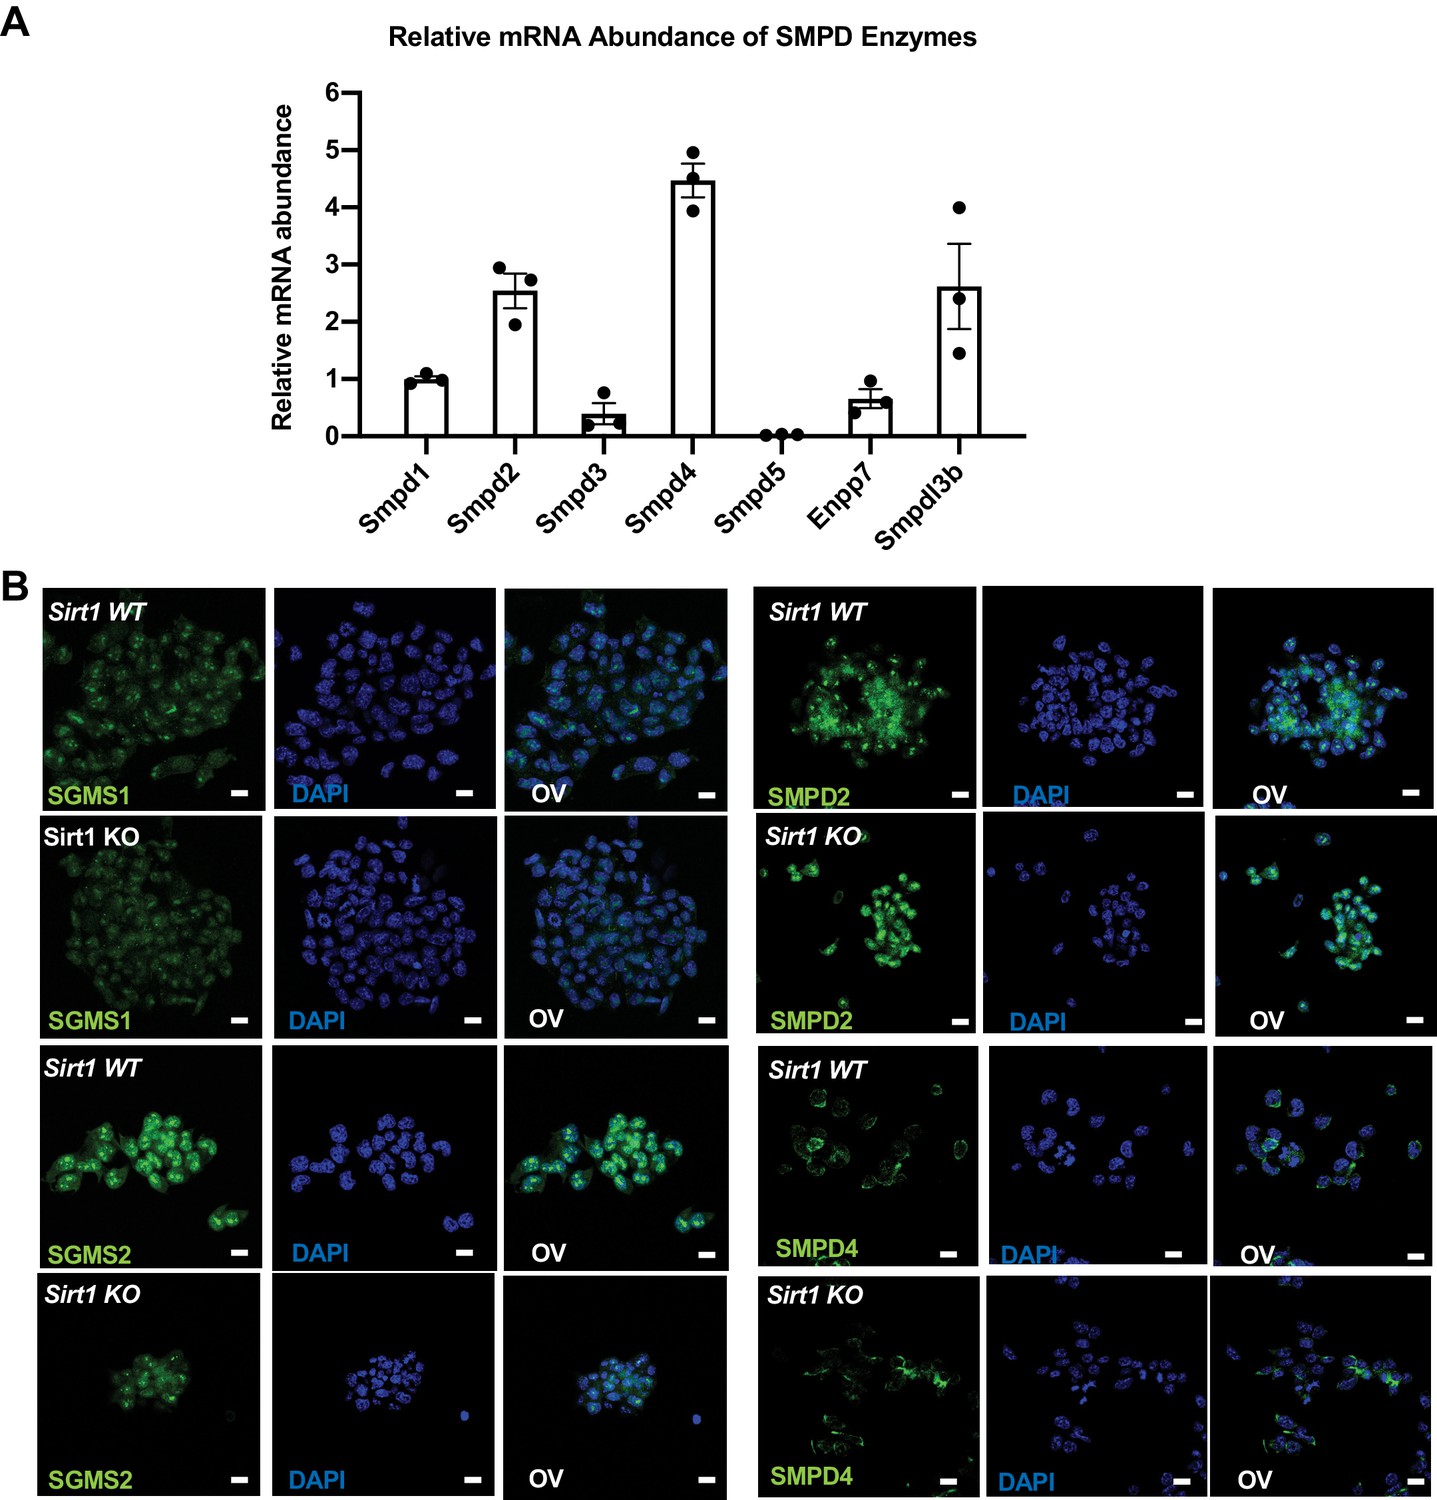
(A) Smpdl3b is one of the major Smpds in mESCs. The relative mRNA levels of indicated Smpds were measured by qPCR and normalized with standard curves using cDNA of each gene. Their relative abundance was then quantified and compared (n = 3 biological replicates). (B) The expression of SGMS1, SGMS2, SMPD2, and SMPD4 in WT and SIRT1 KO mESCs were analyzed by immunofluorescence staining. Bars: 20 µm.
-
Figure 2—figure supplement 1—source data 1
Numerical data for bar graph in A.
- https://cdn.elifesciences.org/articles/67452/elife-67452-fig2-figsupp1-data1-v2.xlsx
Figure 3 with 1 supplement
SMPDL3B directly controls the sphingomyelin contents in mESCs.
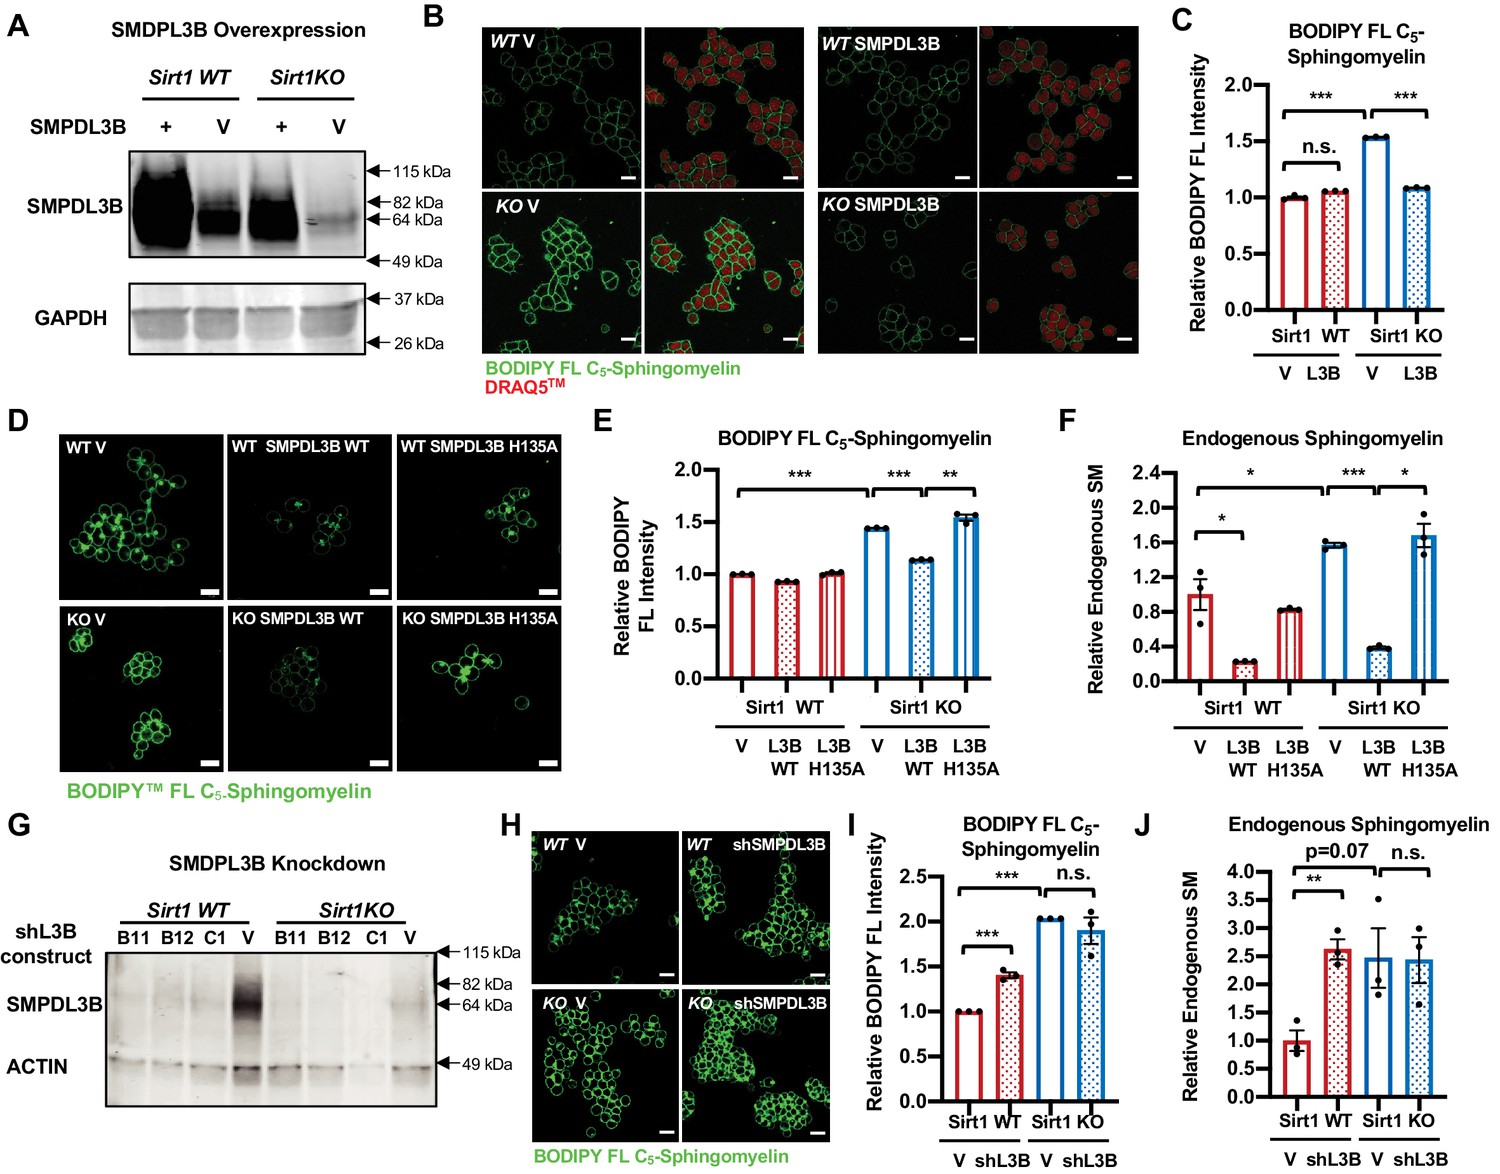
(A) Overexpression of SMPDL3B in mESCs. WT and SIRT1 KO mESCs were infected with lentiviral particles containing empty vector (V) or a construct expressing SMPDL3B. The expression of SMPDL3B was analyzed by immuno-blotting. (B–C) Overexpression of SMPDL3B reduces sphingomyelin levels in mESCs cultured in M10 medium. The cellular levels of sphingomyelin in WT and SIRT1 KO mESCs with or without overexpression of SMPDL3B were analyzed by (B) BODIPY FL-sphingomyelin confocal imaging, and (C) FACS assay (n = 3 biological replicates, *p<0.05, **p<0.01). Scale bars in (B): 20 µm. L3B in (C): SMPDL3B. (D–F) Overexpression of WT but not a catalytic inactive mutant SMPDL3B reduces sphingomyelin levels in mESCs cultured in in M10 medium. WT and SIRT1 KO mESCs transfected with an empty vector (V), a construct expressing WT SMPDL3B protein (SMPDL3B WT), or a construct expressing a catalytic inactive mutant SMPDL3B protein (SMPL3B H135A). The cellular levels of sphingomyelin in these transfected cells were analyzed by (D) BODIPY FL-sphingomyelin staining, (E) BODIPY FL-sphingomyelin FACS assay, or (F) an enzyme-coupled colorimetric assay for endogenous sphingomyelin. (n = 3 biological replicates, *p<0.05, **p<0.01, ***p<0.001). (G) Stable knockdown of the expression of SMPDL3B in mESCs. WT and SIRT1 KO mESCs were infected with lentiviral particles containing empty vector (V) or shRNA constructs for SMPDL3B (B11, B12, C1). The expression of SMPDL3B were analyzed by immuno-blotting. shL3B: shRNAs against SMPDL3B. (H–J) Knocking down SMPDL3B increases sphingomyelin levels in WT mESCs but not significantly further in SIRT1 KO mESCs in ESGRO medium. The cellular levels of sphingomyelin in WT and SIRT1 KO mESCs with or without stable knockdown of SMPDL3B were analyzed by (H) BODIPY FL-sphingomyelin confocal imaging, (I) BODIPY FL-sphingomyelin FACS assay, or (J) an enzyme-coupled colorimetric assay for endogenous sphingomyelin (n = 3 biological replicates, **p<0.01, ***p<0.001). Scale bars: 20 µm.
-
Figure 3—source data 1
Numerical data for bar graphs in C, E, F, I, and J.
- https://cdn.elifesciences.org/articles/67452/elife-67452-fig3-data1-v2.xlsx
-
Figure 3—source data 2
Uncut immunoblots in A and G.
- https://cdn.elifesciences.org/articles/67452/elife-67452-fig3-data2-v2.pdf
Figure 3—figure supplement 1
SMPDL3B directly controls the sphingomyelin contents in mESCs.
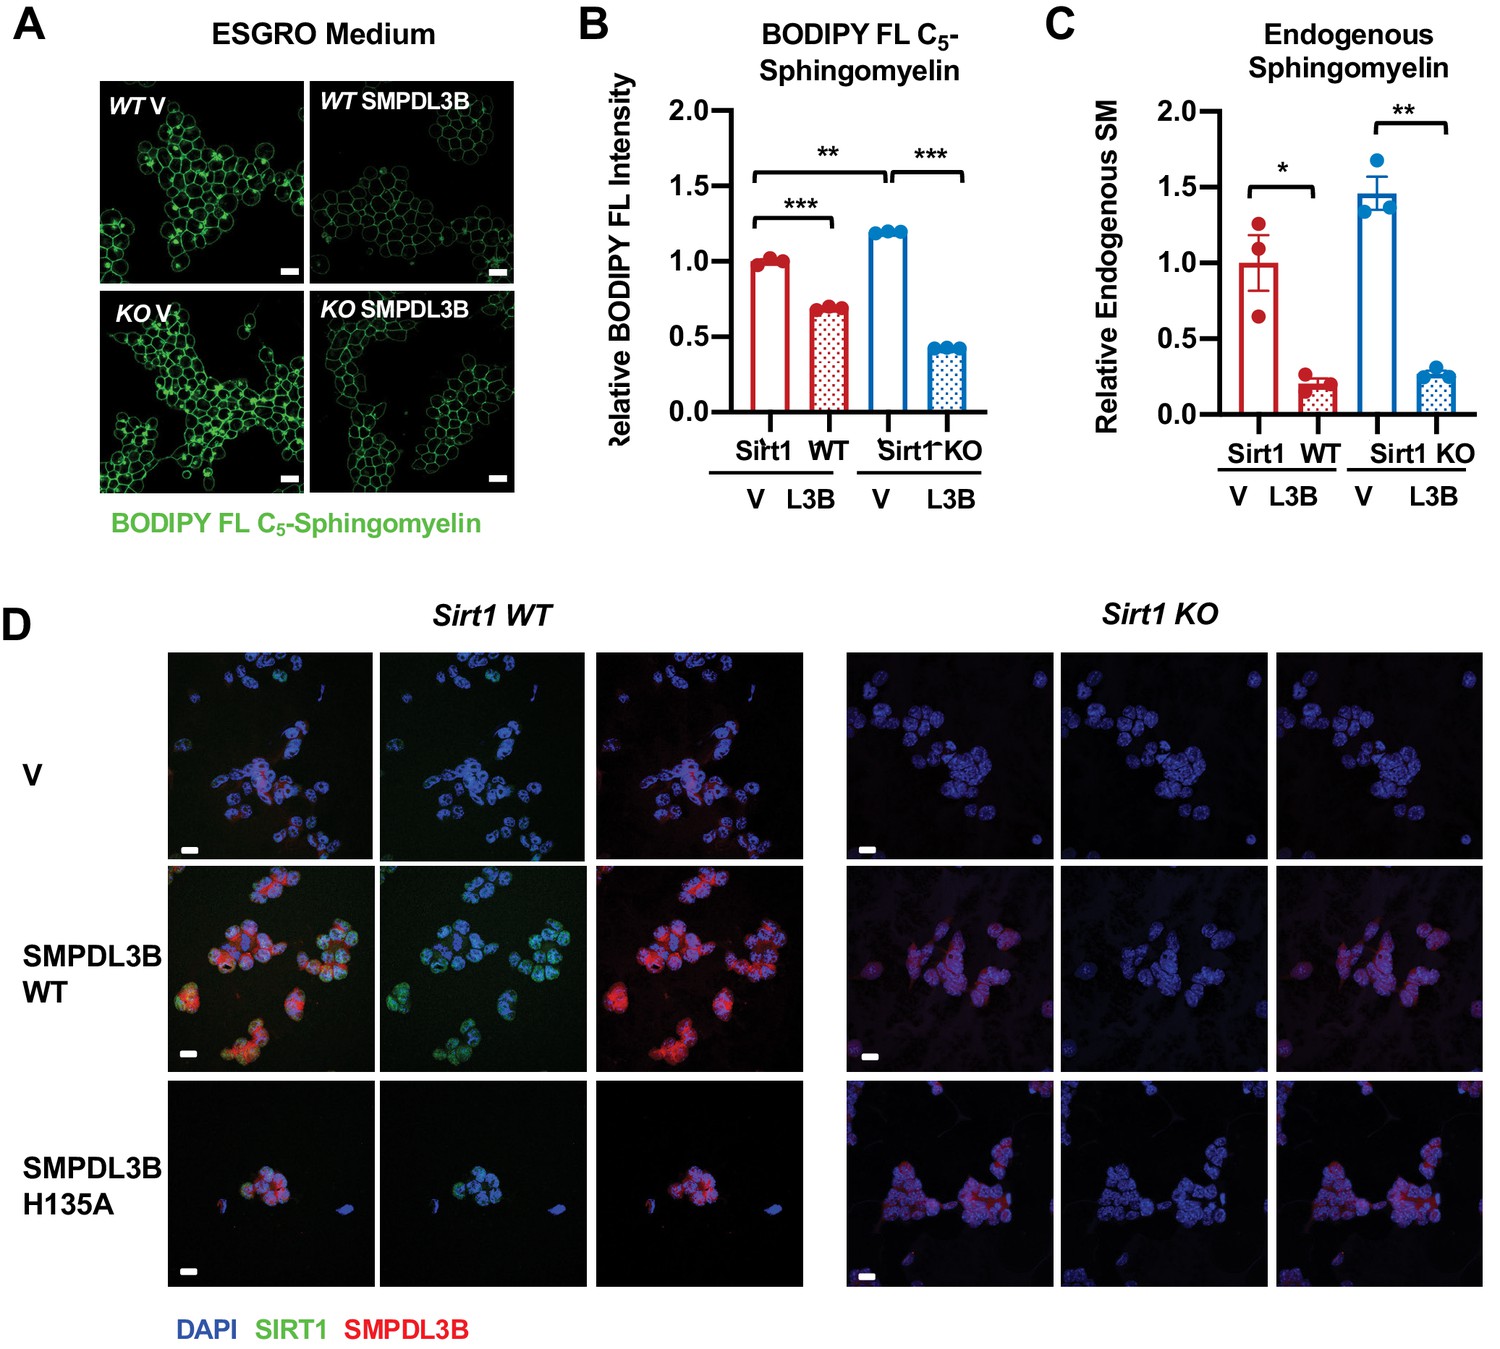
(A–C) Overexpression of SMPDL3B reduces sphingomyelin levels in mESCs cultured in ESGRO medium. The cellular levels of sphingomyelin in WT and SIRT1 KO mESCs with or without overexpression of SMPDL3B were analyzed by (A) BODIPY FL-sphingomyelin staining, (B) BODIPY FL-sphingomyelin FACS assay, or (C) an enzyme-coupled colorimetric assay for endogenous sphingomyelin. (n = 3 biological replicates, *p<0.05, **p<0.01, ***p<0.001). (D) The expression of WT or H135A mutant SMPDL3B in WT and SIRT1 KO mESCs. WT and SIRT1 KO mESCs were transfected with either an empty vector (V), or constructs expressing WT SMPDL3B protein (SMPDL3B WT) or a catalytic inactive mutant SMPDL3B protein (SMPL3B H135A). Cells were then subjected for immunofluorescent analysis with anti-SMPDL3B and SIRT1 antibodies. Scale bars: 20 µm.
-
Figure 3—figure supplement 1—source data 1
Numerical data for bar graphs in B and C.
- https://cdn.elifesciences.org/articles/67452/elife-67452-fig3-figsupp1-data1-v2.xlsx
Figure 4
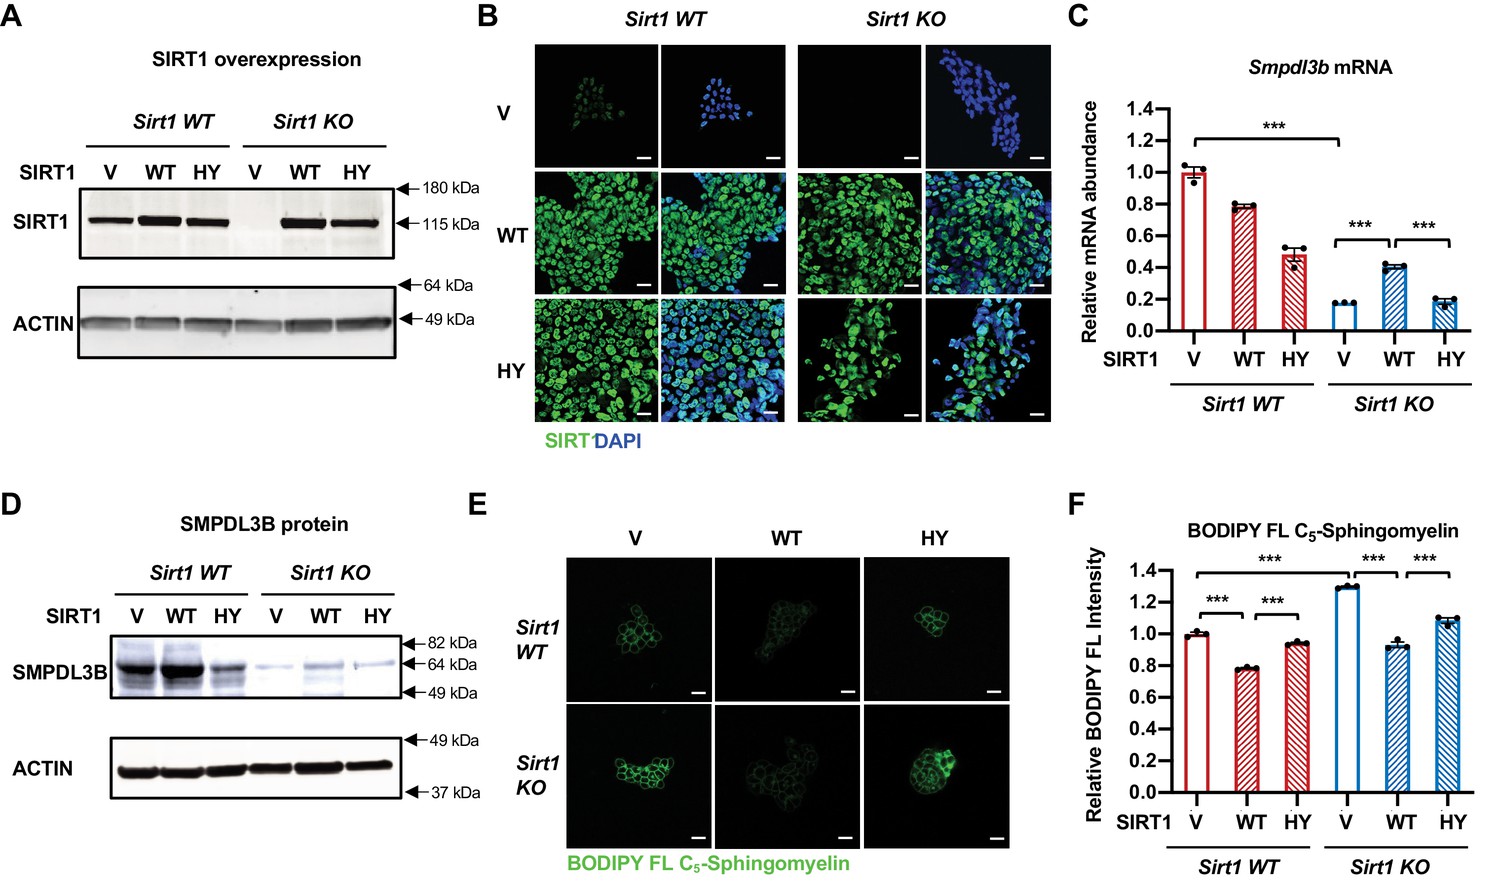
Expression of WT but not catalytically inactive SIRT1 partially rescues the sphingomyelin defect in SIRT1 KO mESCs.
(A–B) SIRT1 protein levels in indicated mESCs. WT and SIRT1 KO mESCs were infected with lentiviral particles containing empty vector (PLenti-III-EF1α) or constructs expressing WT or a catalytically inactive mutant SIRT1 (H355Y, HY). The expression of SIRT1 was analyzed by either (A) immunoblotting or (B) immunofluorescence staining. Bars in B: 20 µm. (C–D) Expression of the HY mutant SIRT1 represses the expression of Smpdl3b in WT mESCs, whereas expression of WT but not the HY mutant SIRT1 increases the expression of Smpdl3b in SIRT1 KO mESCs. The expression of SMPDL3B was analyzed by either (C) qPCR or (D) immunoblotting. (n = 3 biological replicates, ***p<0.001). (E–F) Expression of WT but not HY mutant SIRT1 significantly reduces the sphingomyelin levels in both WT and SIRT1 KO mESCs. Indicated WT and SIRT1 KO mESCs cultured in ESGRO medium were labeled with BODIPY FL-labeled sphingomyelin for 30 min at 4 °C then incubated at 37°C for 30 min. The intensity of BODIPY FL-labeled sphingomyelin in cells were analyzed by (E) confocal fluorescence imaging and by (F) quantitative FACS (n = 3 biological replicates, ***p<0.001). Bars in E: 20 µm.
-
Figure 4—source data 1
Numerical data for bar graphs in C and F.
- https://cdn.elifesciences.org/articles/67452/elife-67452-fig4-data1-v2.xlsx
-
Figure 4—source data 2
Uncut immunoblots in A and D.
- https://cdn.elifesciences.org/articles/67452/elife-67452-fig4-data2-v2.pdf
Figure 5 with 2 supplements
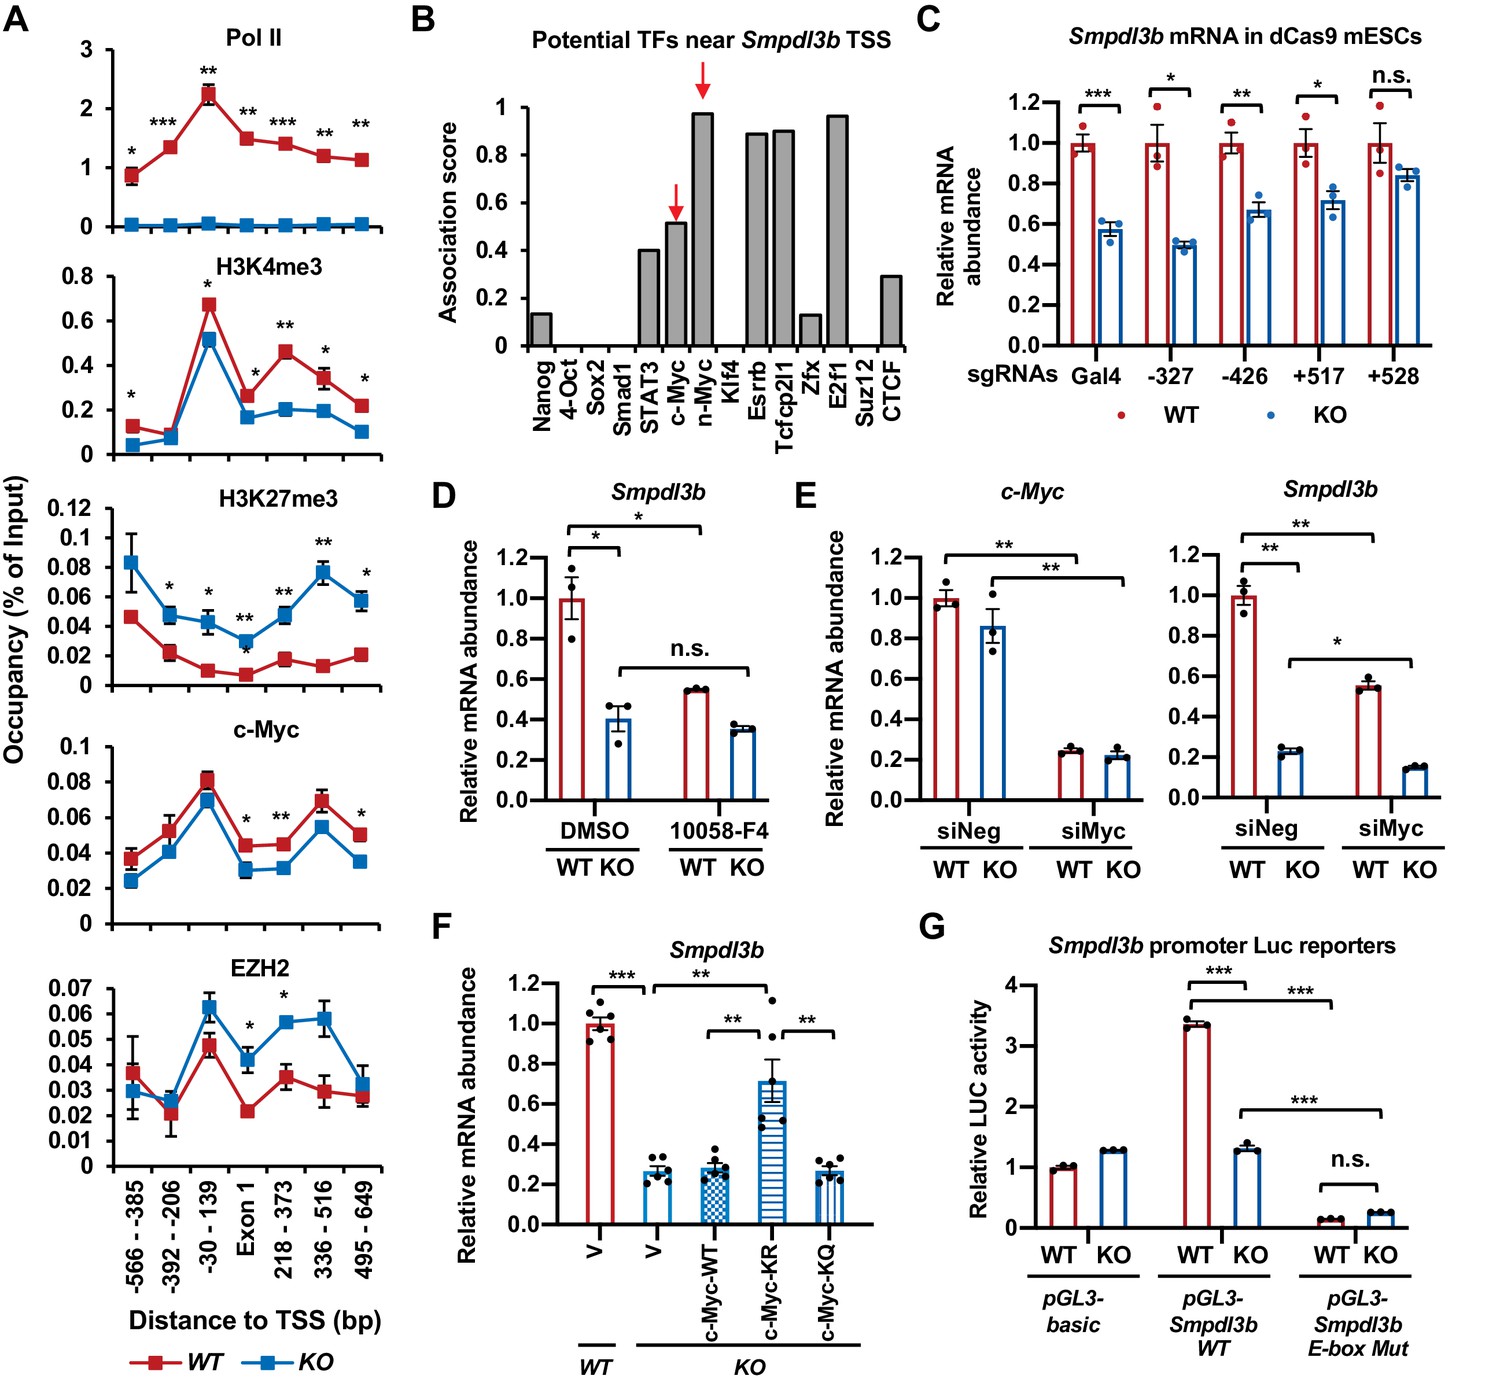
SIRT1 promotes the transcription of Smpdl3b through c-Myc in mESCs.
(A) SIRT1 KO mESCs have reduced transcription of Smpdl3b. WT and SIRT1 KO mESCs cultured in ESGRO medium were crosslinked and subjected for ChIP-qPCR profiling of PolII, c-Myc, EZH2, and indicated chromatin activation or repression marks near the TSS region of Smpdl3b gene (n = 4 biological replicates, *p<0.05, **p<0.01, ***p<0.001). (B) Association scores of potential transcription factors (TFs) near the TSS of Smpdl3b gene. The association scores of indicated TFs were obtained from a published dataset (Evans et al., 2014). A higher score is suggestive of a higher chance of Smpdl3b gene being targeted by the potential TF. (C) A guide RNA (gRNA) targeting the +528 locus at the TSS region of Smpdl3b gene rescues the expression of this gene. sgRNAs targeting indicated loci near the TSS region of Smpdl3b gene were transfected into WT and SIRT1 KO mESCs stably expressing a dox-inducible dCas9 and BirA-V5 (dCas9 mESCs). The mRNA levels of Smpdl3b were analyzed by qPCR (n = 3 biological replicates, *p<0.05, **p<0.01, ***p<0.001). (D) Inhibition of c-Myc activity reduces the expression of Smpdl3b gene in mESCs. WT and SIRT1 KO mESCs were treated with DMSO or 10 mM 10058-F4 for 48 hr. The mRNA levels of Smpdl3b were analyzed by qPCR (n = 3 biological replicates, *p<0.05, **p<0.01, ***p<0.001). (E) Knocking down c-Myc significantly reduces the expression of Smpdl3b gene in mESCs. WT and SIRT1 KO mESCs were transfected with siRNAs against c-Myc for 48 hr. The mRNA levels of c-Myc and Smpdl3b were analyzed by qPCR (n = 3 biological replicates, *p<0.05, **p<0.01). (F) Overexpression of the KR mutant of c-Myc partially reduces the expression of Smpdl3b gene in SIRT1 KO mESCs. The mRNA levels of Smpdl3b in indicated mESCs were analyzed by qPCR (n = 6 biological replicates, **p<0.01, ***p<0.001). (G) Mutation of the c-Myc binding E-box element on the promoter of Smpdl3b gene abolishes the expression of Smpdl3b luciferase reporter in mESCs. Luciferase reporters containing the basic vector (pGL3-basic), the WT promoter of Smpdl3b gene, or a promoter of Smpdl3b gene with a mutant E-box were transfected into WT and SIRT1 KO mESCs, and the luciferase activities were measured as described in Materials and methods (n = 3 biological replicates, ***p<0.001).
-
Figure 5—source data 1
Numerical data for graphs in A, B, C, D, E, F, and G.
- https://cdn.elifesciences.org/articles/67452/elife-67452-fig5-data1-v2.xlsx
Figure 5—figure supplement 1
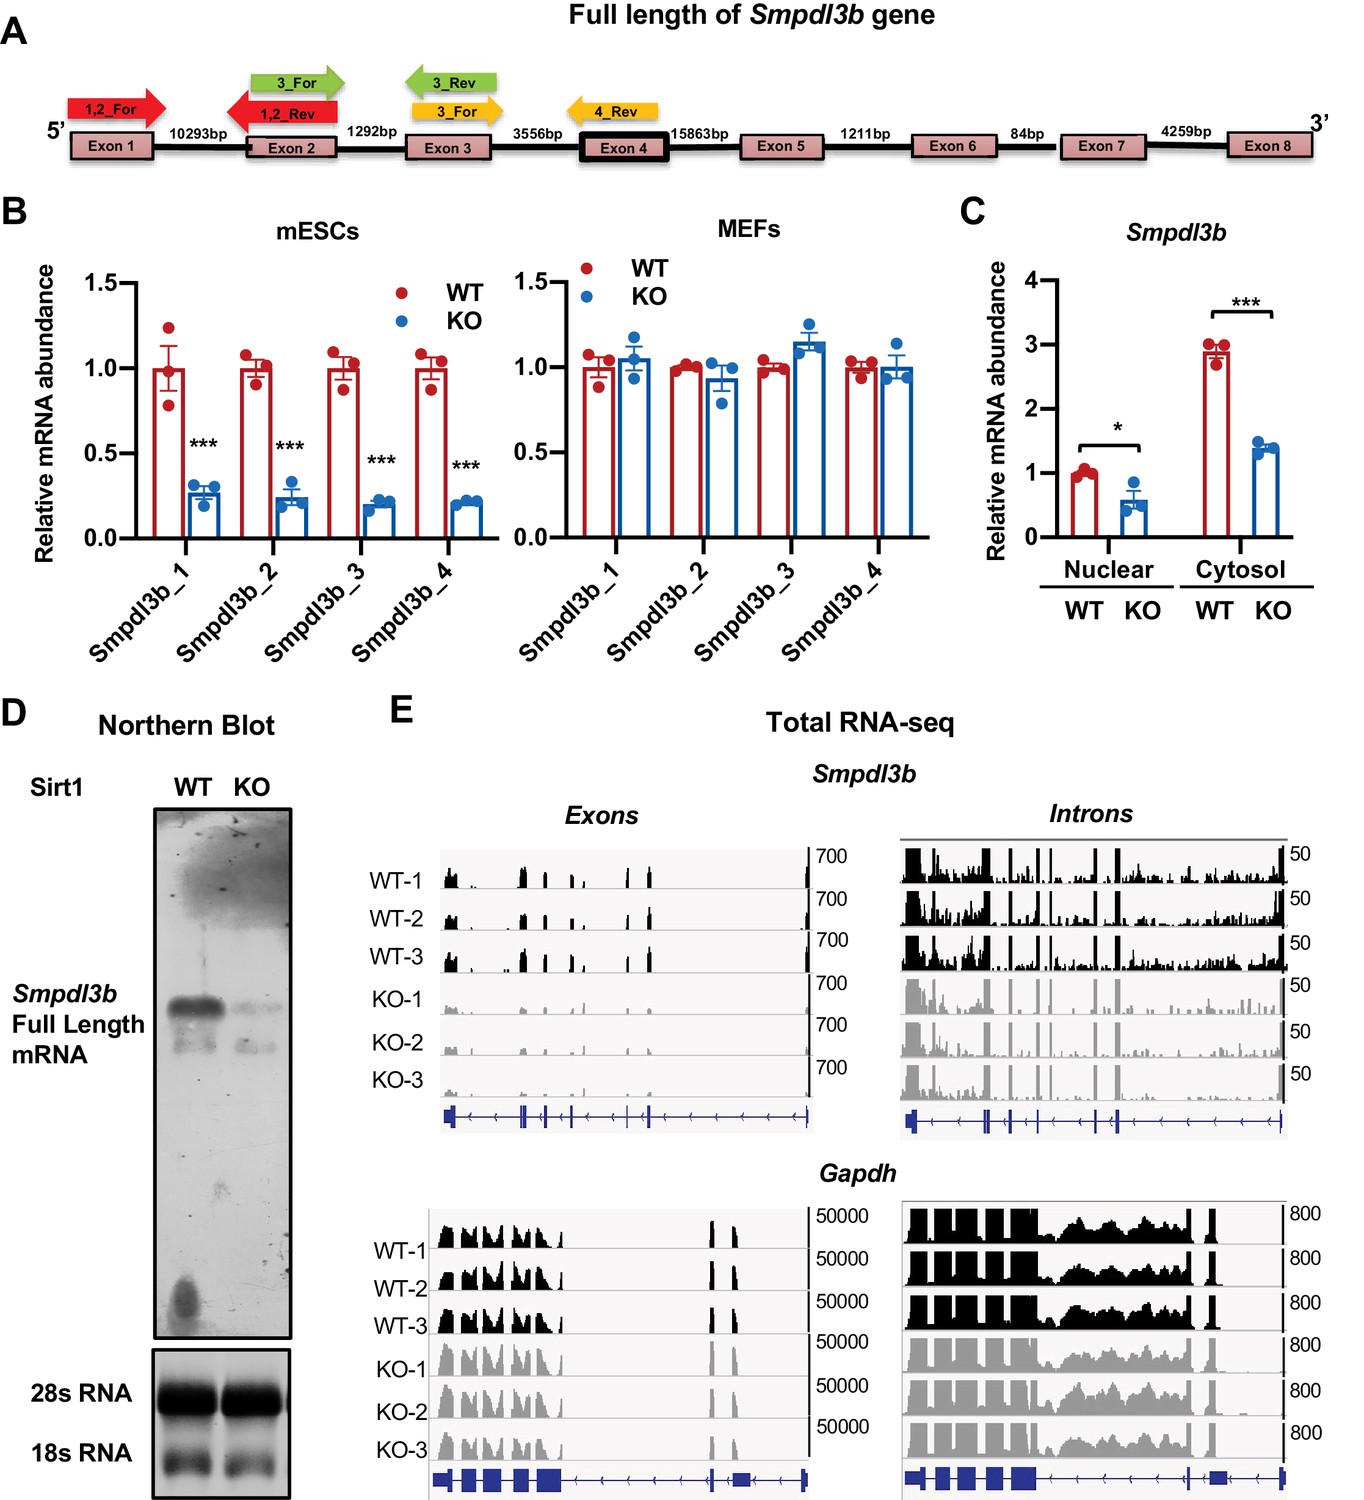
Deletion of SIRT1 reduces transcription of Smpdl3b gene.
(A) Diagram of mouse Smpdl3b gene structure. The locations of indicated qPCR primers were denoted. (B) SIRT1 KO mESCs but not MEFs have reduced mature Smpdl3b mRNA. The relative mature mRNA levels of Smpdl3b were analyzed by qPCR by four different pairs of primers as indicated in (A) (n = 3 biological replicates, ***p<0.001). (C) SIRT1 KO mESCs have reduced Smpdl3b mRNA in both nuclear and cytosol. The nuclear and cytosol fraction of WT and SIRT1 KO mESCs were separated as described in Methods and mRNA levels of Smpdl3b were analyzed by qPCR (n = 3 biological replicates, *p<0.05, ***p<0.001). (D) SIRT1 KO mESCs have reduced levels of full length Smpdl3b mRNA. Total RNA from WT and SIRT1 KO mESCs were probed for full length Smpdl3b mRNA by Northern blotting as described in Materials and methods. (E) SIRT1 KO mESCs have reduced abundance of transcripts of Smpdl3b gene at both intronic and exonic regions. Ribo-minus total RNA from WT and SIRT1 KO mESCs were sequenced by Nova-seq. The total reads mapped to the whole mouse Smpdl3b gene were shown. The transcript abundance of Gapdh gene at both exonic and intronic regions was shown as control.
-
Figure 5—figure supplement 1—source data 1
Numerical data for bar graphs in B and C.
- https://cdn.elifesciences.org/articles/67452/elife-67452-fig5-figsupp1-data1-v2.xlsx
Figure 5—figure supplement 2
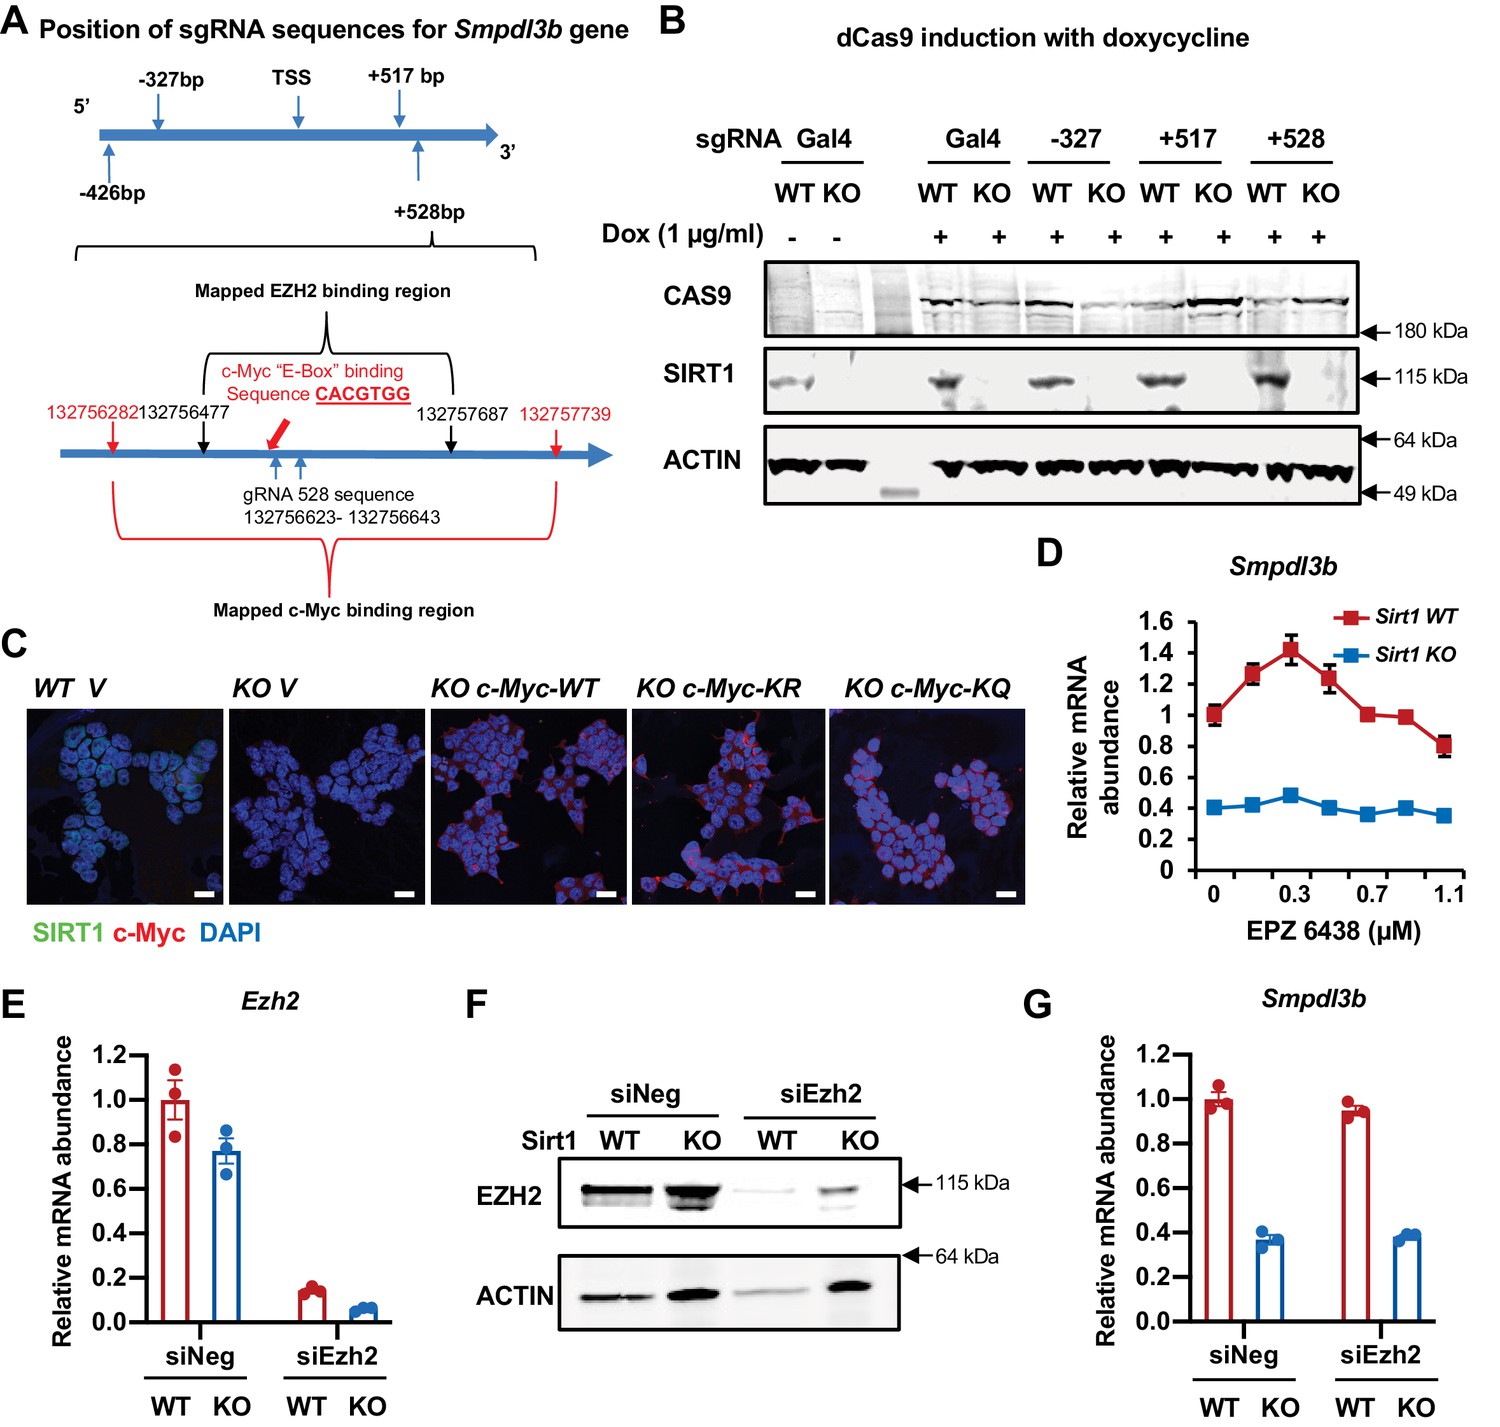
SIRT1 promotes the transcription of Smpdl3b through c-Myc but not EZH2 in mESCs.
(A) The positions of sgRNA targeting sequences on the Smpdl3b gene. The targeting sequence of gRNA +528 is located in a region containing both mapped c-Myc binding site and EZH2 binding site. (B) The expression of dCas9 and SIRT1 in WT and SIRT1 KO dCas9 mESCs. WT and SIRT1 KO dCas9 mESCs transfected with indicated sgRNA were treated with 1 μg/ml Dox for 48 hr. (C) Overexpression of WT, K323R, and K323Q mutant of c-Myc in SIRT1 KO mESCs. WT and SIRT1 KO mESCs were infected with lentiviral particles containing empty vector (V) or constructs expressing WT, K323R (KR), or K323Q (KQ) mutant of c-Myc. Bars: 20 µm. (D) Inhibition of EZH2 have limited effect on the expression of Smpdl3b gene in mESCs. WT and SIRT1 KO mESCs were treated with EPZ 6438 at indicated concentrations for 48 hr (n = 3 biological replicates). (E–F) Knocking down EZH2 in mESCs. WT and SIRT1 KO mESCs were transfected with control siRNA (siNeg) or siRNAs against EZH2 (siEZH2) for 48 hr. The expression of Smpdl3b was analyzed by (E) qPCR (n = 3 biological replicates) and (F) immunoblotting. (G) Knocking down EZH2 have minimal effect on the expression of Smpdl3b gene in mESCs (n = 3 biological replicates).
-
Figure 5—figure supplement 2—source data 1
Numerical data for bar graphs in D, E, and G.
- https://cdn.elifesciences.org/articles/67452/elife-67452-fig5-figsupp2-data1-v2.xlsx
-
Figure 5—figure supplement 2—source data 2
Uncut immunoblots in B.
- https://cdn.elifesciences.org/articles/67452/elife-67452-fig5-figsupp2-data2-v2.pdf
Figure 6 with 1 supplement
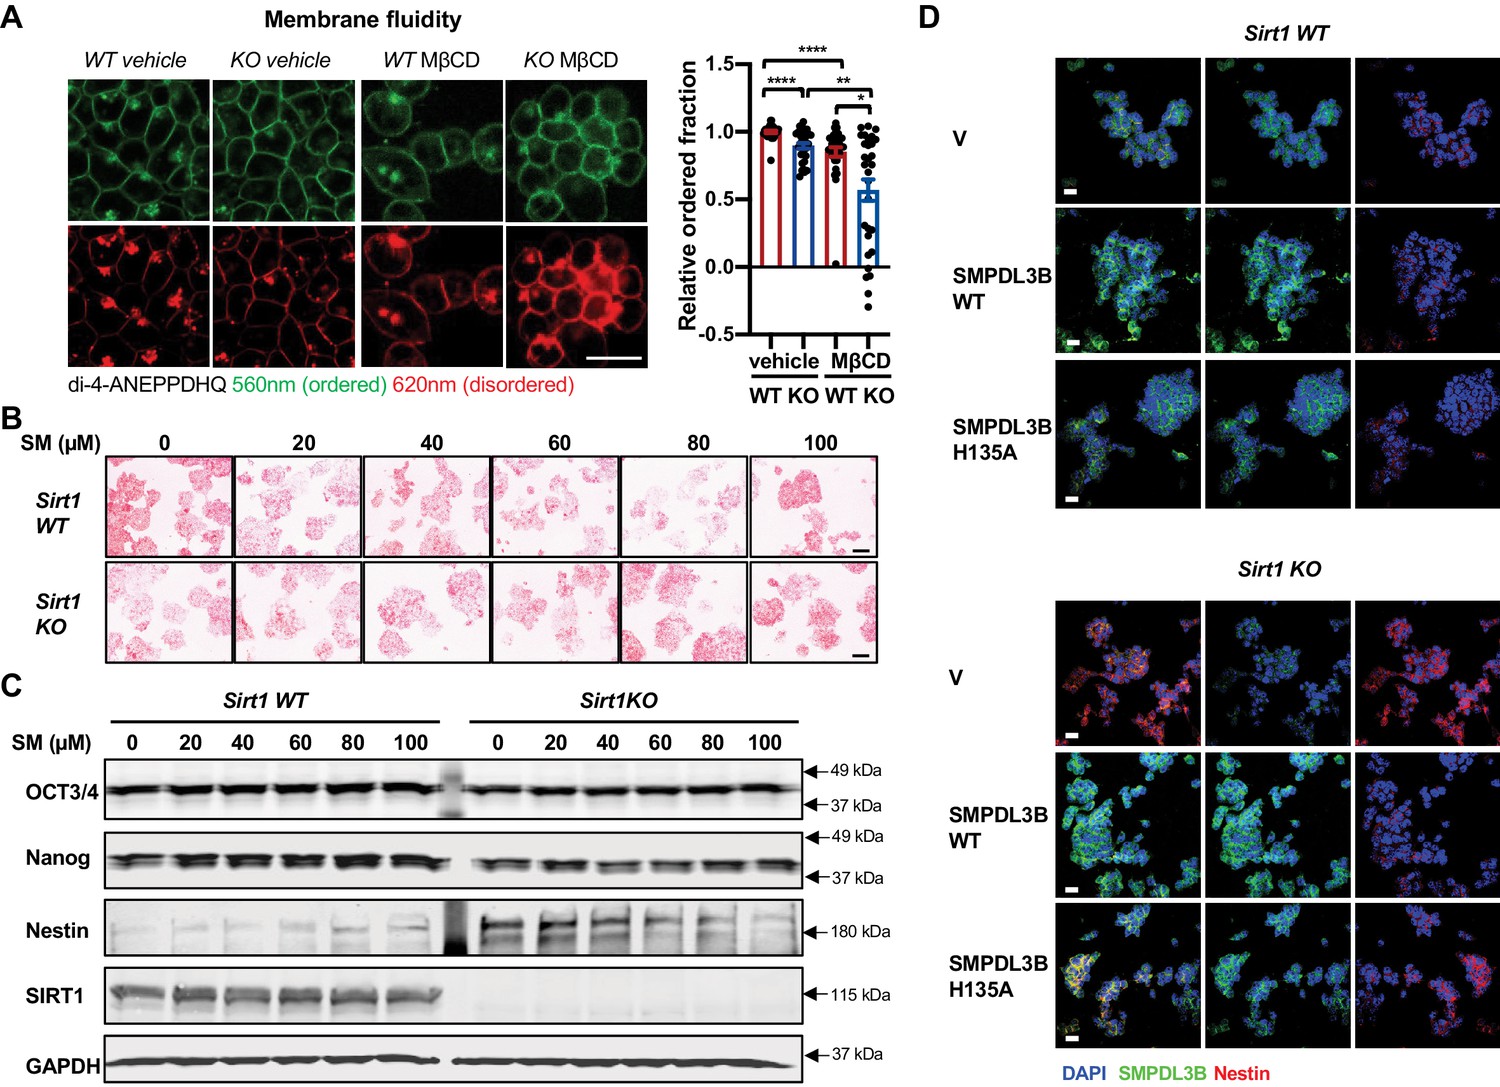
Sphingomyelin accumulation increases membrane fluidity and induces expression of Nestin in SIRT1 KO mESCs.
(A) SIRT1 KO mESCs have an increased membrane fluidity. WT and SIRT1 KO mESCs cultured in ESGRO medium were preincubated with or without 2.5 mM MβCD for 1 hr, then stained with 5 μM di-4-ANEPPDHQ for at least 30 min. The relative ordered fraction in each group was analyzed as described in Materials and methods (n = 30 clones/group, *p<0.05, **p<0.01, ***p<0.001, ****p<0.0001). Bars: 10 µm. (B–C) Exogeneous sphingomyelin treatment increases Nestin but not pluripotency markers in mESCs. WT and SIRT1 KO mESCs were treated with indicated concentrations of sphingomyelin (SM) in ESGRO medium for 48 hr. (B) The intensity of AP was analyzed as described in Materials and methods. Bars: 100 µm. (C) The protein abundance of pluripotency marker OCT3/4, Nanog and neuroepithelial stem cell marker Nestin in WT and Sirt1 KO mESCs were determined by immunoblotting. (D) Overexpression of WT but not a catalytic inactive mutant SMPDL3B reduces the expression of Nestin in SIRT1 KO mESCs. WT and SIRT1 KO mESCs transfected with an empty vector (V), a construct expressing WT SMPDL3B protein (SMPDL3B WT), or a construct expressing a catalytic inactive mutant SMPDL3B protein (SMPL3B H135A) were stained for SMPDL3B and Nestin. Scale bars: 20 µm.
-
Figure 6—source data 1
Numerical data for bar graphs in A.
- https://cdn.elifesciences.org/articles/67452/elife-67452-fig6-data1-v2.xlsx
-
Figure 6—source data 2
Uncut immunoblots in C.
- https://cdn.elifesciences.org/articles/67452/elife-67452-fig6-data2-v2.pdf
Figure 6—figure supplement 1
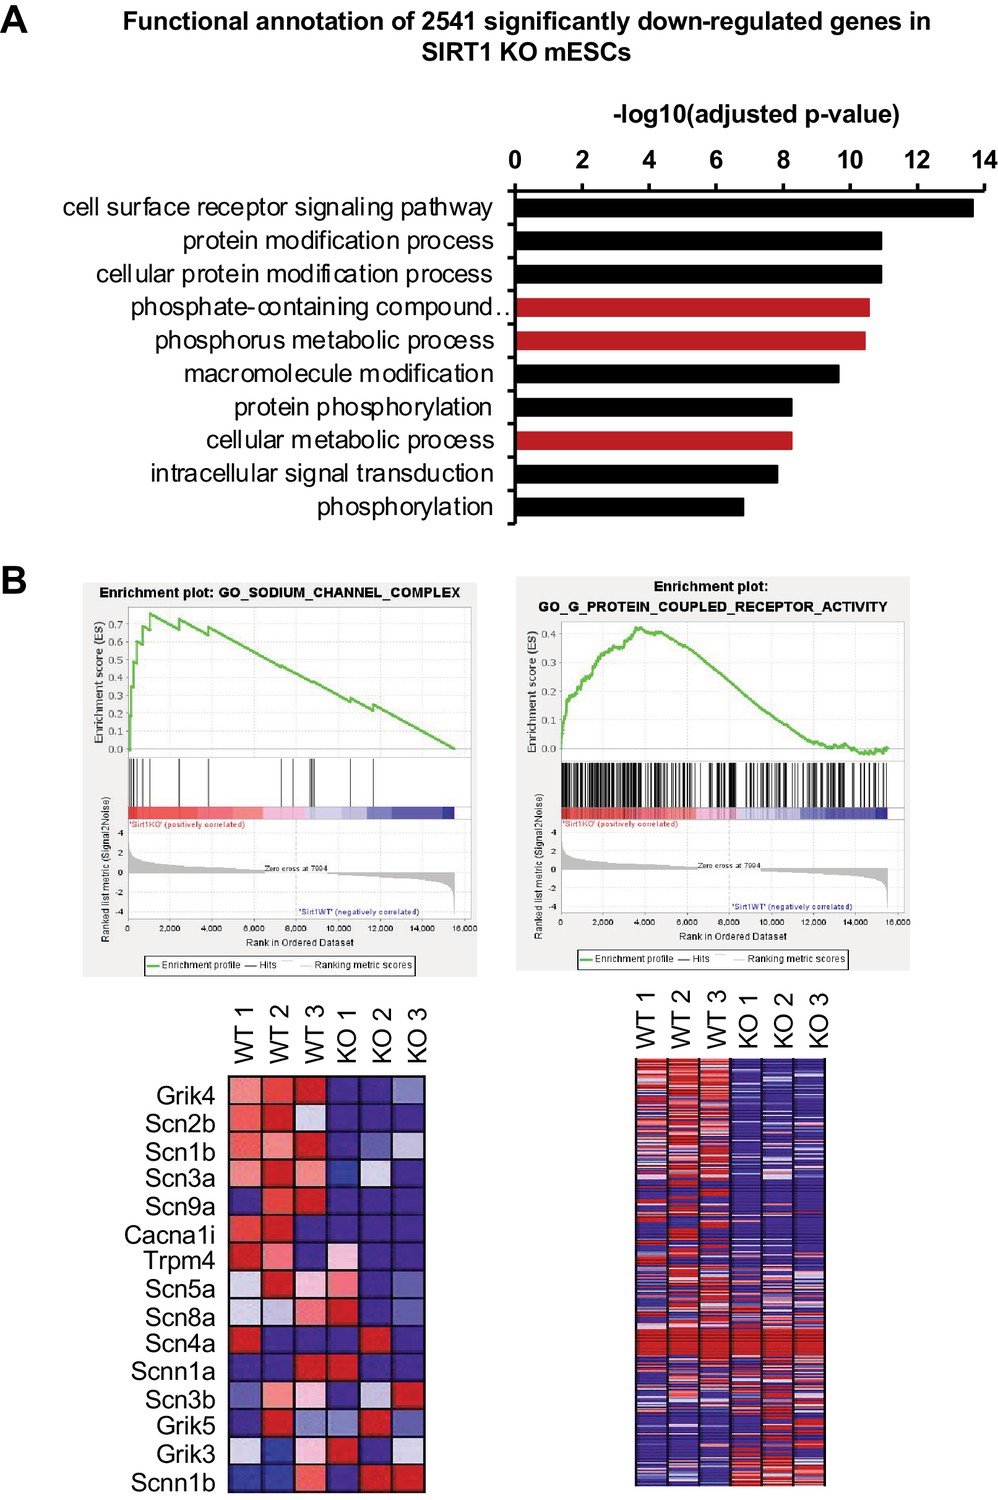
SIRT1 deficiency in mESCs significantly reduces the expression of genes involved in signaling pathways.
(A) Genes involved in signaling pathways are significantly enriched in genes downregulated in SIRT1 KO mESCs (q < 0.01). Red, pathways containing Smpdl3b. (B) Two major impaired membrane pathways in SIRT1 KO mESCs. GSEA analysis of transcriptomes from WT and SIRT1 KO mESCs was performed as described in Materials and methods. Two major downregulated membrane pathways were shown (n = 3 biological replicates).
Figure 7
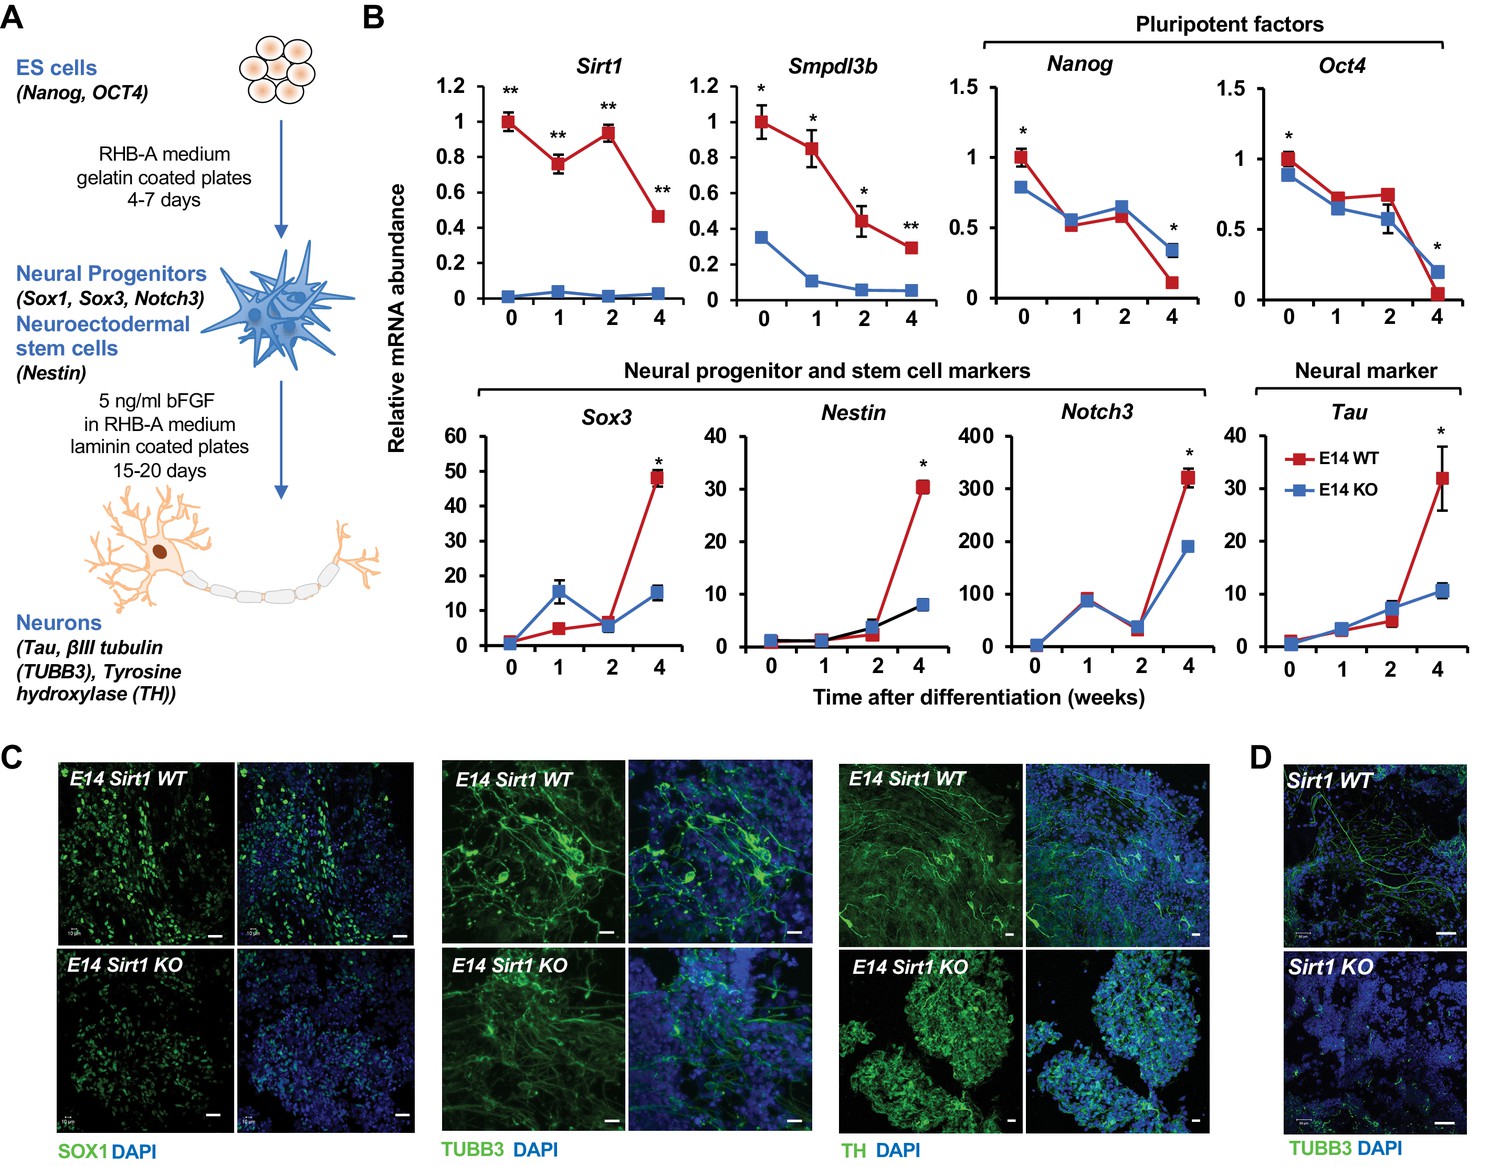
SIRT1 KO mESCs have an impaired neural differentiation in vitro.
(A) A diagram of the in vitro neural differentiation system. (B) SIRT1 KO E14 mESCs are less responsive to in vitro neural differentiation than WT mESCs. The expression of indicated genes were analyzed by qPCR during 4 weeks of in vitro neural differentiation. Please note that deletion of SIRT1 resulted in reduction in both repression of pluripotent factors and induction of markers for neural progenitors/stem cells and neurons (n = 3 biological replicates, *p<0.05, **p<0.01). (C) SIRT1 KO E14 mESCs have reduced expression of neural differentiation markers and disordered neuronal morphology. WT and SIRT1 KO E14 mESCs after 4 weeks of in vitro neural differentiation were stained for a neural progenitor marker SOX1 (left panels) and neuronal markers beta III tubulin (TUBB3, middle panels) and TH (right panels). Scale bars: 20 µm. (D) SIRT1 KO mESCs have reduced expression of TUBB3 and mature neuronal morphology. WT and SIRT1 KO mESCs after 4 weeks of in vitro neural differentiation were stained for TUBB3. Scale bars: 50 µm.
-
Figure 7—source data 1
Numerical data for line graphs in B.
- https://cdn.elifesciences.org/articles/67452/elife-67452-fig7-data1-v2.xlsx
Figure 8

Reduced expression of SMPDL3B is partially responsible for impaired in vitro neural differentiation in SIRT1 KO mESCs.
(A) Overexpression of SMPDL3B partially rescues gross neuronal morphology in in vitro differentiated SIRT1 KO mESCs. WT and SIRT1 KO mESCs stably infected with lentiviral particles containing empty vector (V) or constructs expressing SMPDL3B protein were subjected to 4 weeks of in vitro neural differentiation. The cell morphology was analyzed using regular light microscopy fixed with ZEISS AxioCamHR camera. Scale bars: 20 µm. (B) Overexpression of SMPDL3B partially rescues neuronal morphology in in vitro differentiated SIRT1 KO cells. WT and SIRT1 KO mESCs expressing vector (V) or SMPDL3B were differentiated for 4 weeks or 6 weeks. Six weeks of differentiation is for a better morphological analysis. The expression of TUBB3 and neuronal morphology were analyzed by immunofluorescence staining. Scale bars: 20 µm. (C) Overexpression of SMPDL3B partially increased the fraction of differentiated cells in in vitro differentiated SIRT1 KO cells. WT and SIRT1 KO mESCs expressing vector (V) or SMPDL3B were differentiated as in (A). The fraction of differentiated cells positive of indicated neural markers were quantified by FACS (n = 3 biological replicates, **p<0.01, ***p<0.001). (D) Overexpression of SMPDL3B partially rescues the expression of neural markers in in vitro differentiated SIRT1 KO cells. WT and SIRT1 KO mESCs expressing vector (V) or SMPDL3B were differentiated as in (A). The expression of indicated neural markers were analyzed by immunofluorescence staining. Scale bars: 20 µm. (E) Overexpression of SMPDL3B partially rescues the expression of neural progenitor markers in in vitro differentiated SIRT1 KO cells. WT and SIRT1 KO mESCs expressing vector (V) or SMPDL3B were differentiated as in (A). The expression of SOX2 and SOX3 were analyzed by qPCR (n = 3 biological replicates, *p<0.05, **p<0.01). (F) Knocking down SMPDL3B in WT mESCs impairs neural differentiation in vitro. WT and SIRT1 KO mESCs with or without stable knockdown of SMPDL3B were in vitro differentiated into neurons for 4 weeks. The expression of neural markers Tau and NEFH were analyzed by immunofluorescence staining. Scale bars: 50 µm. (G) WT but not a catalytic inactive SIRT1 rescues neural differentiation in vitro. WT and SIRT1 KO mESCs expressing vector (V), WT SIRT1, or a mutant SIRT1 lacking catalytic activity (HY) were in vitro differentiated into neurons for 4 weeks. The expression of neural markers SOX1 and Nestin were analyzed by immunofluorescence staining. Scale bars: 50 µm.
-
Figure 8—source data 1
Numerical data for bar graphs in C and E.
- https://cdn.elifesciences.org/articles/67452/elife-67452-fig8-data1-v2.xlsx
Figure 9
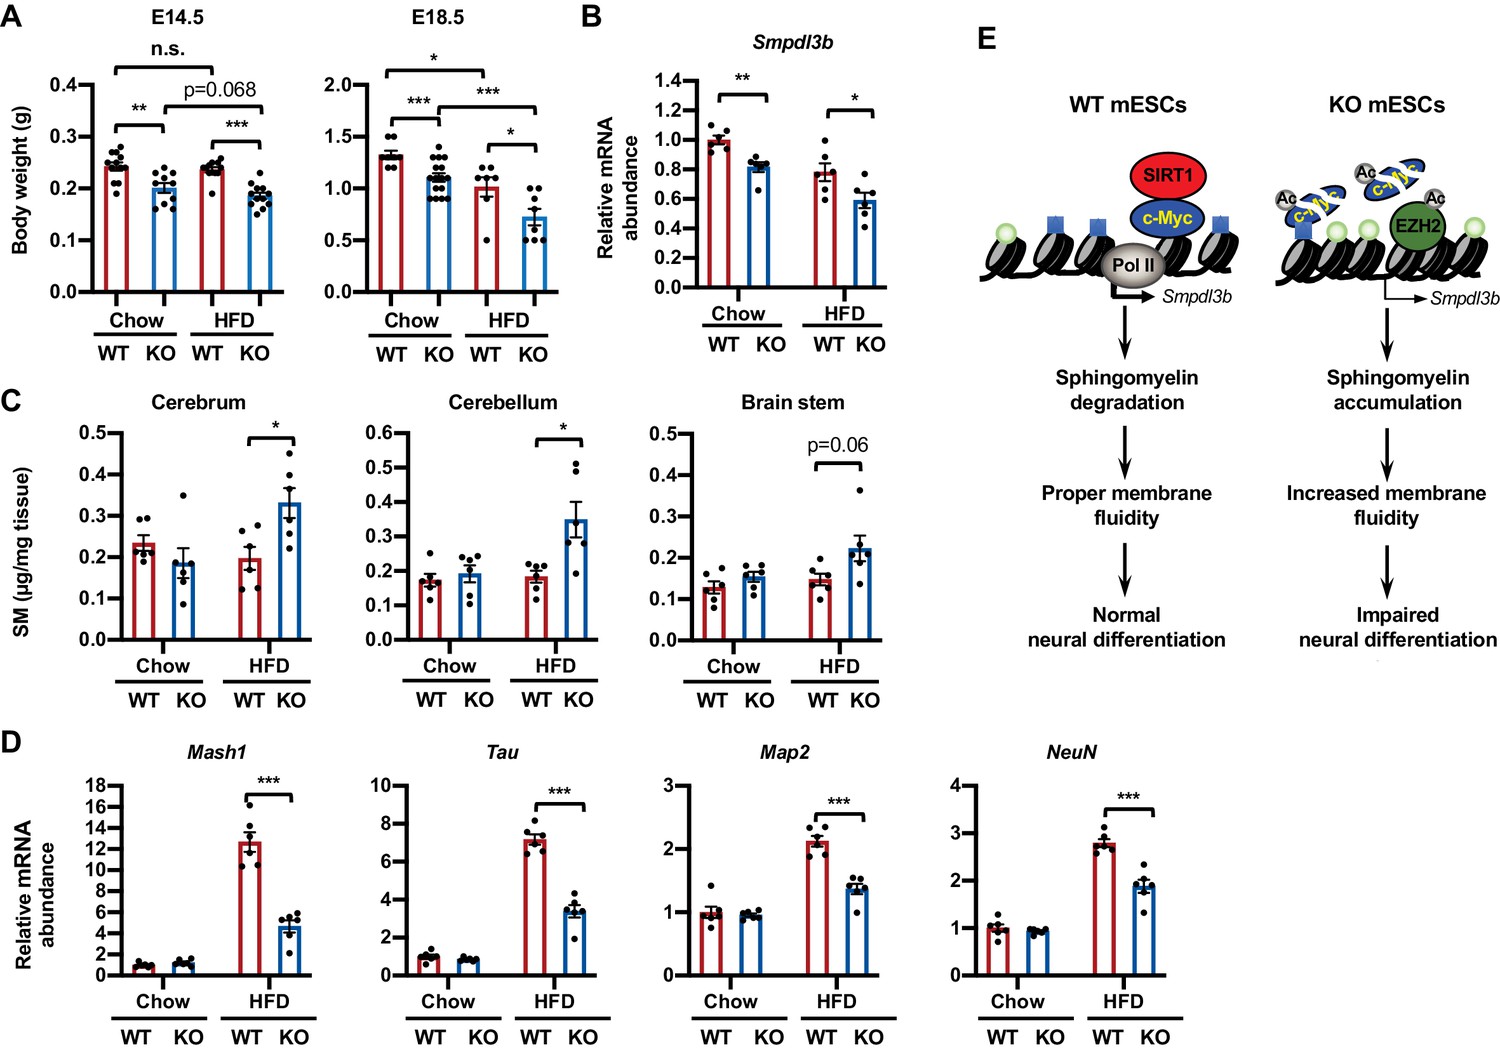
Maternal high-fat diet (HFD) feeding impairs neural development in SIRT1 deficient embryos.
(A) Maternal HFD feeding reduces body weight of embryos. Maternal HFD feeding was performed 4-8 weeks before pregnancy (pre-feeding) as described in Materials and methods. Body weight of E14.5 and E18.5 embryos were measured (*p<0.05, **p<0.01, ***p<0.001). (B) SIRT1 KO embryos have reduced expression of Smpdl3b in brains. The mRNA levels of Smpdl3b in brain of E18.5 embryos from chow fed dams or HFD fed dams were analyzed by qPCR (n = 6 embryos, *p<0.05, **p<0.01). (C) Maternal HFD feeding induces sphingomyelin accumulation in brains of SIRT1 KO embryos. Maternal HFD feeding was performed 4-8 weeks before pregnancy (pre-feeding) as described in Materials and methods. Brains from E18.5 embryos were dissected into three parts and the endogenous sphingomyelins were extracted and measured (n = 6 embryos, *p<0.05). (D) Maternal HFD feeding induces defective expression of neural markers in brains of SIRT1 KO embryos. The mRNA levels of indicated neural markers in brain of E18.5 embryos from chow fed dams or HFD fed dams were analyzed by qPCR (n = 6 embryos, *p<0.05, **p<0.01, ***p<0.001). (E) SIRT1 regulates sphingomyelin degradation and neural differentiation of mESCs through c-Myc and EZH2. SIRT1 is highly expressed in mESCs cells, where it functions to promote association of c-Myc and recruitment of Pol II to activate transcription of Smpdl3b gene and subsequent sphingomyelin degradation. This action of SIRT1 is important for maintenance of a proper membrane fluidity for normal neural differentiation in response to nutritional/developmental cues. Deletion of SIRT1 causes hyperacetylation and instability of c-Myc, leading to Pol II depletion and transcriptional repression of Smpdl3b. SIRT1 deficiency-induced hyperacetylation and stabilization of EZH2 likely enforce this transcriptional suppression by adding H3K27me3 mark. This transcriptional repression of Smpdl3b is associated with accumulation of sphingomyelin, which increases membrane fluidity and impairs neural differentiation. Light blue squares: H3K4me3; Light green circles: H3K27me3; Ac: acetylation.
-
Figure 9—source data 1
Numerical data for bar graphs in A, B, C, and D.
- https://cdn.elifesciences.org/articles/67452/elife-67452-fig9-data1-v2.xlsx
Tables
Appendix 1—key resources table
| Reagent type (species) or resource | Designation | Source or reference | Identifiers | Additional information |
|---|---|---|---|---|
| Gene (M. musculus) | Sirt1 | MGI | 93759 | |
| Gene (M. musculus) | Smpdl3b | MGI | 100340 | |
| Gene (M. musculus) | Myc | MGI | 17869 | |
| Gene (M. musculus) | Ezh2 | MGI | 14056 | |
| Strain, strain background (M. musculus) | SIRT1 KO mouse line | Tang et al., 2014 | Whole body SIRT1 KO mice (SIRT1 KO) on C57BL/6J background | |
| Strain, strain background (Escherichia coli) | Stbl3 | ThermoFisher | C737303 | Competent cells |
| Cell line (M. musculus) | WT mESCs | A gift from McBurney et al., 2003 | WT R1 mouse embryonic stem cell line | |
| Cell line (M. musculus) | SIRT1 KO mESCs | A gift from McBurney et al., 2003 | SIRT1 KO R1 mouse embryonic stem cell line generated by gene targeting technology | |
| Cell line (M. musculus) | ES-E14TG2a (E14) | ATCC | CRL-1821; RRID:CVCL_9108 | Mouse embryonic stem cell line |
| Cell line (M. musculus) | ES-E14TG2a (E14), WT | This paper | WT E14 mouse embryonic stem cell line, generated with a CRISPR/Cas9 vector (pCRISPR-CG01) (Materials and Methods, Mammalian cell lines) | |
| Cell line (M. musculus) | ES-E14TG2a (E14), SIRT1 KO | This paper | SIRT1 KO E14 mouse embryonic stem cell line, generated with pCRISPR-CG01-mSirt1 (Materials and Methods, Mammalian cell lines) | |
| Cell line (M. musculus) | dCas9 mESCs | Liu et al., 2017 | Mouse embryonic stem cell line stably expressing a dox-inducible dCas9 and BirA-V5 | |
| Cell line (M. musculus) | dCas9 mESCs, WT | This paper | WT dCas9 mESCs generated with a CRISPR/Cas9 vector (pCRISPR-CG01) (Materials and Methods, Mammalian cell lines) | |
| Cell line (M. musculus) | dCas9 mESCs, SIRT1 KO | This paper | SIRT1 KO dCas9 mESCs generated with pCRISPR-CG01-mSirt1(Materials and Methods, Mammalian cell lines) | |
| Cell line (Homo sapiens) | mel1 hESCs | Dr. Andrew Elefanty and Edouard Stanley at the University of Queensland, Australia | NIH Registration number: 0139 | Human embryonic cell line |
| Cell line (Homo sapiens) | mel1 hESCs, SIRT1 KO | This paper | SIRT1 KO human embryonic cell line generated with Cas9WT-hSirt1(Materials and Methods, Mammalian cell lines) | |
| Transfected construct (M. musculus) | pCRISPR-CG01 | GeneCopoeia | RRID:Addgene_74293 | Backbone vector of all-in-one sgRNA clones for mouse Sirt1 gene |
| Transfected construct (M. musculus) | pCRISPR-CG01-mSirt1 | GeneCopoeia | MCP000956-CG01-3-B-a; b | All-in-one sgRNA constructs targeting mouse Sirt1 gene |
| Transfected construct (H. sapiens) | Cas9WT-hSirt1 | Horizon Discovery (gift) | All-in-one sgRNA construct targeting human Sirt1 gene | |
| Transfected construct (M. musculus) | pSLQ1651-sgRNA(F + E)-sgGal4 | Addgene (a gift from Liu et al., 2017) | http://n2t.net/addgene: 100549; RRID:Addgene_100549 | backbone vector of constructs of sgRNAs targeting the promoter region of Smpdl3b gene |
| Transfected construct (M. musculus) | pSLQ1651-sgRNA(F + E)-sgGal4-327; −426;+517;+528 | This paper | Constructs of sgRNAs targeting the promoter region of Smpdl3b gene (Materials and Methods, Mammalian cell lines) | |
| Transfected construct (M. musculus) | pLKo.1(plasmid) | Sigma | SHC001; RRID:Addgene_10879 | Backbone vector of Smpdl3b gene silencing shRNA plasmid constructs |
| Transfected construct (M. musculus) | pLKo.1-B11; B12; C1 (plasmid) | Sigma | TRCN0000099683; TRCN0000311166; TRCN0000304921 | Smpdl3b gene silencing shRNA plasmid constructs |
| Transfected construct (M. musculus) | pLenti-III-ef1α (plasmid) | Addgene (a gift from Zhang et al., 2011) | http://n2t.net/addgene: 27964; RRID:Addgene_27964 | Backbone vector of Sirt1WT and HY mutant, Smpdl3b and H135A mutant expression constructs |
| Transfected construct (M. musculus) | pLenti-III-ef1α-Sirt1 WT (plasmid) | This paper | Sirt1WT expression construct (Materials and Methods, Mammalian cell lines) | |
| Transfected construct (M. musculus) | pLenti-III-ef1α-Sirt1 H355Y (plasmid) | This paper | Sirt1 H335Y mutant expression construct (Materials and Methods, Mammalian cell lines) | |
| Transfected construct (M. musculus) | pLenti-III-ef1α-Smpdl3b (plasmid) | This paper | Smpdl3b expression construct (Materials and Methods, Mammalian cell lines) | |
| Transfected construct (M. musculus) | pLenti-III-ef1α- Smpdl3b H135A Mut (plasmid) | This paper | Smpdl3b H135A mutant expression construct (Materials and Methods, Mammalian cell lines) | |
| Transfected construct (M. musculus) | pHAGE-ef1α-HA-Puro | Zheng et al., 2016 (a gift from Guang Hu) | backbone vector of c-Myc WT, K323R and K323Q mutant constructs | |
| Transfected construct (M. musculus) | pHAGE-ef1α-HA-Puro-c-Myc-WT | This paper | c-Myc expression construct (Materials and Methods, Site-direct mutagenesis) | |
| Transfected construct (M. musculus) | pHAGE-ef1α-HA-Puro-c-Myc-K323R | This paper | c-Myc K323R mutant expression construct (Materials and Methods, Site-direct mutagenesis) | |
| Transfected construct (M. musculus) | pHAGE-ef1α-HA-Puro-c-Myc-K323Q | This paper | c-Myc K323Q mutant expression construct (Materials and Methods, Site-direct mutagenesis) | |
| Recombinant DNA reagent | pGL3 basic (plasmid) | Promega | E1751 | Backbone vector of luciferase assay plasmids constructs |
| Recombinant DNA reagent | pGL3-Smpdl3b (plasmid) | This paper | Smpdl3b gene promoter region luciferase assay plasmids construct (Materials and Methods, Luciferase assay) | |
| Recombinant DNA reagent | pGL3-Smpdl3b E-box Mut (plasmid) | This paper | Smpdl3b gene promoter region E-box mutation luciferase assay plasmids construct (Materials and Methods, Luciferase assay) | |
| Antibody | Anti-SIRT1(Rabbit polyclonal) | Cell Signaling | 2028; RRID:AB_1196631 | IF(1:400) WB(1:1000) |
| Antibody | Anti-SIRT1(Rabbit polyclonal) | Cell Signaling | 2493; RRID:AB_2188359 | IF(1:200) WB(1:1000) |
| Antibody | Anti-SMPDL3B (Mouse monoclonal) | Santa Cruz | sc-137113; RRID:AB_2193525 | IF (1:400) WB(1:1000) |
| Antibody | Anti-SMPDL3B (Rabbit polyclonal) | Thermo Fisher Scientific | PA5-40798; RRID:AB_2606294 | IF(1:400) |
| Antibody | Anti-Nanog (Rabbit polyclonal) | Millipore | ab5731; RRID:AB_2267042 | WB(1:1000) |
| Antibody | Anti-OCT3/4(Goat polyclonal) | Santa Cruz | sc8628; RRID:AB_653551 | WB(1:1000) |
| Antibody | Anti-NESTIN (Mouse monoclonal) | Thermo Fisher Scientific | MA1-110; RRID:AB_2536821 | IF(1:400) WB(1:1000) |
| Antibody | anti-Sox1(Rabbit polyclonal) | Thermo Fisher Scientific | PA5-23370; RRID:AB_2540893 | IF(1:400) |
| Antibody | Anti-Tau (Mouse monoclonal) | Abcam | ab80579; RRID:AB_1603723 | IF(1:400) |
| Antibody | Anti-Tyrosine Hydroxylase (Rabbit polyclonal) | Abcam | ab137721; RRID:AB_2891220 | IF(1:400) |
| Antibody | Anti-beta III Tubulin (Rabbit polyclonal) | Abcam | ab18207; RRID:AB_444319 | IF(1:400) FACS: 1:400 |
| Antibody | Anti-GABA (Mouse monoclonal) | Millipore Sigma | SAB4200721; RRID:AB_2891218 | IF(1:400) FACS: 1:400 |
| Antibody | Anti-CNPase Monoclonal Antibody (Mouse monoclonal) | Thermo Fisher Scientific | MA5-31374; RRID:AB_2787011 | FACS(1:400) |
| Antibody | Anti-Neurofilament heavy polypeptide (Rabbit polyclonal) | Abcam | ab8135; RRID:AB_306298 | IF(1:400) |
| Antibody | Anti-CRISPR/Cas9 (Mouse monoclonal) | Millipore Sigma | SAB4200701; RRID:AB_2891217 | WB (1:1000) |
| Antibody | Anti-Ezh2 (Rabbit monoclonal) | Cell Signaling | 5246; RRID:AB_10694683 | CHIP(1:100) WB(1:1000) |
| Antibody | Anti-C-Myc (Rabbit monoclonal) | Cell Signaling | 5605; RRID:AB_1903938 | CHIP(1:100) |
| Antibody | Anti-C-Myc (Mouse monoclonal) | Abcam | ab32; RRID:AB_303599 | IF(1:400) |
| Antibody | Anti-Pol II (Mouse monoclonal) | Santa Cruz | sc-56767; RRID:AB_785522 | ChIP(1:100) |
| Antibody | Anti-H3K9Me2 (Rabbit polyclonal) | Active Motif | 39753; RRID:AB_2793331 | ChIP (1:100) |
| Antibody | Anti-H3K4Me3(Rabbit polyclonal) | Active Motif | 39159; RRID:AB_2615077 | ChIP (1:100) |
| Antibody | Anti-H3K27Me3 (Rabbit polyclonal) | Active Motif | 39155; RRID:AB_2561020 | ChIP (1:100) |
| Antibody | Anti-SGMS1 (Rabbit polyclonal) | Sigma -Aldrich | SAB2102133; RRID:AB_10604972 | IF(1:400) |
| Antibody | Anti-SGMS2 (Rabbit polyclonal) | Thermo Fisher Scientific | PA5-26744; RRID:AB_2544244 | IF (1:400) |
| Antibody | Anti-SMPD2 (Rabbit polyclonal) | Proteintech | 15290–1-AP; RRID:AB_2891221 | IF (1:400) |
| Antibody | Anti-SMPD4 (Rabbit polyclonal) | Abcam | Ab133935; RRID:AB_2891216 | IF (1:400) |
| Antibody | Anti-Actin (Mouse monoclonal) | Millipore Sigma | MAB1501; RRID:AB_2223041 | WB(1:10,000) |
| Antibody | Anti-GAPDH (Rabbit monoclonal) | Cell Signaling | 2118S; RRID:AB_561053 | WB(1:5000) |
| Antibody | Goat anti-Rabbit IgG (H + L) | Invitrogen | A-11008; RRID:AB_143165 | Secondary antibody Alexa Fluor 488 IF and FACS (1:1000) |
| Antibody | Goat anti-Mouse IgG (H + L) | Invitrogen | A-11032; RRID:AB_2534091 | Secondary antibody Alexa Fluor 594 IF (1:1000) |
| Antibody | Goat anti-Mouse IgG (H + L) | Invitrogen | A-21052; RRID:AB_2535719 | Secondary antibody Alexa Fluor 633 FACS (1:1000) |
| Sequence-based reagent | Please see Supplementary file 4 | |||
| Peptide, recombinant protein | murine bFGF | Sigma | SRP4038-50UG | Growth factor supplement for In vitro neural differentiation of mESCs |
| Commercial assay or kit | Sphingomyelin Assay Kit | Abcam | Ab133118 | Endogenous SM enzymatic detection |
| Commercial assay or kit | Alkaline Phosphatase staining kit II | Stemgent | 00–0055 | Alkaline phosphatase staining |
| Commercial assay or kit | RNeasy mini-kit | Qiagen | 74104 | RNA isolation |
| Commercial assay or kit | High-Capacity cDNA Reverse Transcription Kits | ABI | 4374967 | cDNA synthesizes |
| Commercial assay or kit | iQ SYBR Green Supermix | Biorad | 1708887 | Quantitative real-time PCR detection systems |
| Commercial assay or kit | North2SouthTM Biotin Random Prime Labeling Kit | Thermo | 17075 | Northern blot hybridization probes generation |
| Commercial assay or kit | S and S TurboBlotter Rapid Downward Transfer System | DAIGGER SCIENTIFIC | Northern blot RNA transblotting | |
| Commercial assay or kit | North2South Chemiluminescent Hybridization and Detection Kit | Thermo | 17097 | Northern blotting hybridization |
| Commercial assay or kit | Chemiluminescent Nucleic Acid Detection Module | Thermo | 89880 | Northern blotting detection |
| Commercial assay or kit | TruSeq Stranded/Ribo kit | Illumina | RNA-seq libraries preparation kits | |
| Commercial assay or kit | Fisher BioReagents SurePrep Nuclear or Cytoplasmic RNA Purification Kit | Fisher Scientific | BP280550 | Nuclear and cytoplasmic RNA separation |
| Commercial assay or kit | Ezh2 siRNA | Thermofisher | 4390771-s65775 siNeg:4390843 | Ezh2 knockdown |
| Commercial assay or kit | C-Myc siRNA | Santa Cruz | sc-29227; siNeg: siRNA-A sc-37007 | C-Myc knockdown |
| Commercial assay or kit | Lipofectamine RNAiMAX | ThermoFisher | 13778075 | RNAi Transfection Reagent |
| Commercial assay or kit | Lipofectamine 3000 | Invitrogen | L3000001 | Transfection Reagent |
| Commercial assay or kit | QuickChange II Site-Directed Mutagenesis Kit | Agilent Technologies | 200522–5 | Site-specific mutagenesis |
| Commercial assay or kit | Dual-Luciferase Reporter Assay System | Promega | E1960 | Luciferase activity detection |
| Commercial assay or kit | BODIPY FL C5-Sphingomyelin | Invitrogen | D3522 | Dye for Sphingolipid analysis |
| Commercial assay or kit | BODIPY FL C5-Ceramide | Invitrogen | D3521 | Dye for Sphingolipid analysis |
| Chemical compound, drug | di-4-ANEPPDHQ | ThermoFisher | D36802 | Measurement of membrane fluidity |
| Chemical compound, drug | Sphingomyelin | Sigma-Aldrich | S0756 | Sphingomyelin |
| Chemical compound, drug | MβCD | Sigma-Aldrich | C4555 | Methyl-β-cyclodextrin |
| Chemical compound, drug | Tazemetostat; EPZ-6438 | MCE | HY-13803 | EZh2 inhibitor |
| Chemical compound, drug | CAS 403811-55-2–Calbiochem; 10058-F4 | Millipore Sigma | 475956 | c-Myc Inhibitor |
| Software, algorithm | Trim Galore (v0.4.4) | Krueger, 2021 | RRID:SCR_011847 | RNA-seq analysis |
| Software, algorithm | STAR aligner (v2.5.3a) | Dobin et al., 2013 | RRID:SCR_004463 | RNA-seq analysis |
| Software, algorithm | RSEM (v1.2.28) | Li and Dewey, 2011 | RRID:SCR_013027 | RNA-seq analysis |
| Software, algorithm | DEseq2 | Love et al., 2014 | RRID:SCR_015687 | RNA-seq analysis |
| Software, algorithm | FeatureCounts (version 1.4.6) | Liao et al., 2014 | RRID:SCR_012919 | RNA-seq analysis |
| Software, algorithm | g:Profiler | https://biit.cs.ut.ee/gprofiler/gost | RRID:SCR_006809 | RNA-seq analysis, Pathway enrichment |
| Software, algorithm | Gene set enrichment analysis (GSEA) (v4.1.0) | https://www.gsea-msigdb.org | RNA-seq analysis, Pathway enrichment | |
| Software, algorithm | Match | geneXplain (genexplain.com) | Promoter analysis of Smpdl3b gene | |
| Software, algorithm | Metabolon Laboratory Information Management System (LIMS) | Metabolon, Inc | Metabolomic analysis | |
| Software, algorithm | Microsoft Office Excel (version 16.16.27) | Microsoft | RRID:SCR_016137 | Data graphing and statistical analysis |
| Software, algorithm | Prism 9 (v9.0.0) | Graphpad | RRID:SCR_000306 | Data graphing and statistical analysis |
| Others | VECTASHIELD Antifade Mounting Media | Vector Laboratory | H-1800 | Contains DAPI |
| Others | DRAQ5 Fluorescent Probe Solution | Thermal Fisher | 62251 | Cells nuclei counterstaining |
Additional files
-
Supplementary file 1
Lipid alterations in WT and SIRT1 KO mESCs analyzed by metabolomics.
- https://cdn.elifesciences.org/articles/67452/elife-67452-supp1-v2.xlsx
-
Supplementary file 2
Accumulation of sphingomyelin in both SIRT1 KO hESCs and mESCs.
- https://cdn.elifesciences.org/articles/67452/elife-67452-supp2-v2.xlsx
-
Supplementary file 3
Significantly differentially expressed genes between SIRT1 KO vs WT mESCs.
- https://cdn.elifesciences.org/articles/67452/elife-67452-supp3-v2.xlsx
-
Supplementary file 4
Oligonucleotides used in the study.
- https://cdn.elifesciences.org/articles/67452/elife-67452-supp4-v2.xlsx
-
Transparent reporting form
- https://cdn.elifesciences.org/articles/67452/elife-67452-transrepform-v2.docx
Download links
A two-part list of links to download the article, or parts of the article, in various formats.
Downloads (link to download the article as PDF)
Open citations (links to open the citations from this article in various online reference manager services)
Cite this article (links to download the citations from this article in formats compatible with various reference manager tools)
SIRT1 regulates sphingolipid metabolism and neural differentiation of mouse embryonic stem cells through c-Myc-SMPDL3B
eLife 10:e67452.
https://doi.org/10.7554/eLife.67452


