Kinesin-6 Klp9 orchestrates spindle elongation by regulating microtubule sliding and growth
- Institut Curie, PSL Research University, Sorbonne Université CNRS, UMR 144, France
- Institut de Recherche Saint Louis,U976 Human Immunology Pathophysiology Immunotherapy (HIPI), CytoMorpho Lab, University of Paris, INSERM, CEA, France
- Interdisciplinary Research Institute of Grenoble, Laboratoire de Physiologie Cellulaire & Végétale, CytoMorpho Lab, University of Grenoble-Alpes, CEA, CNRS, INRA, Grenoble, France
- Department of Cell and Developmental Biology, University of Pennsylvania, United States
Figures
Figure 1 with 2 supplements
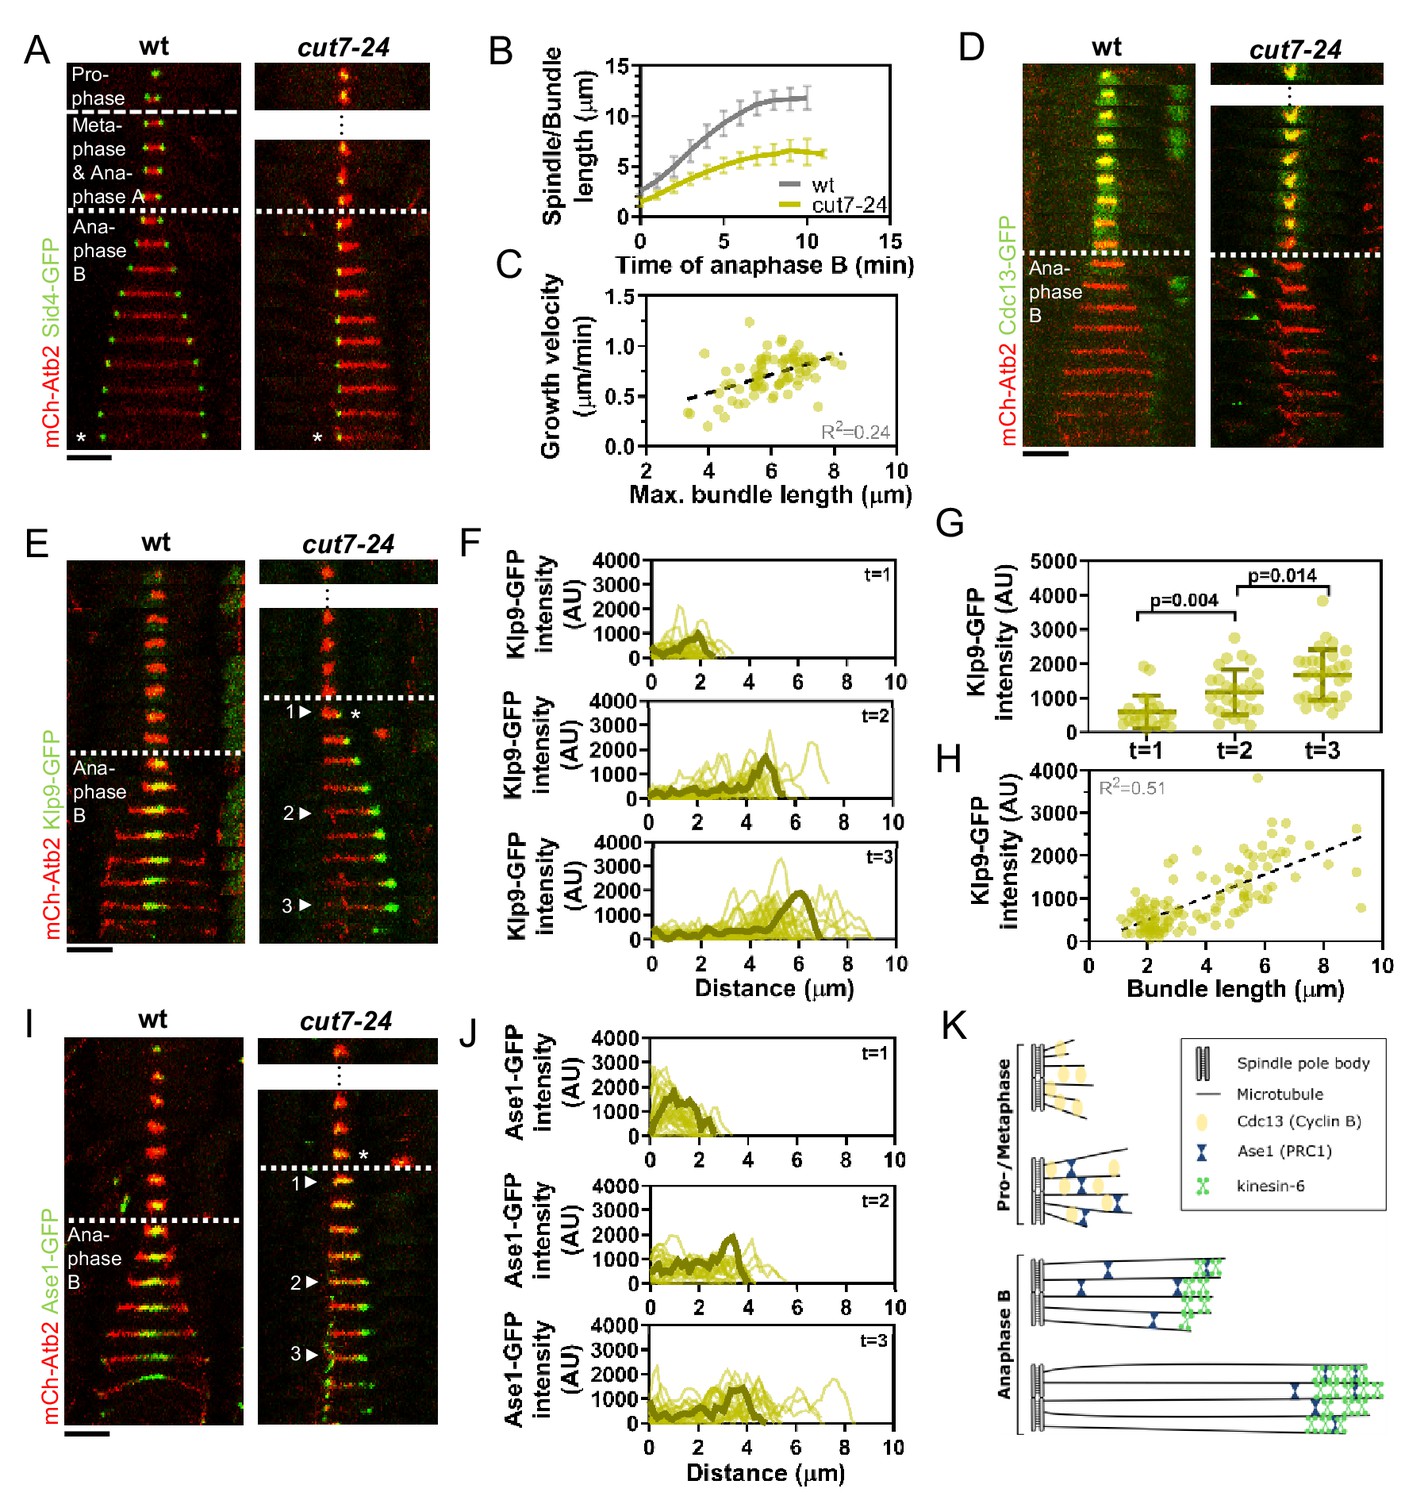
Cut7-24 monopolar spindle as a tool to study microtubule dynamics during anaphase B.
(A) Time-lapse images of wild-type and cut7-24 cells expressing mCherry-Atb2 (tubulin) and Sid4-GFP (SPBs) at 37°C. The dashed line denotes the transition from prophase to metaphase. Dotted line denotes the transition to anaphase B. Asterisk marks spindle disassembly. (B) Comparative plot of anaphase B spindle dynamics of wild-type (n = 40) and bundle dynamics of cut7-24 cells (n = 40) at 37°C. Bold curves correspond to the mean and error bars to the standard deviation. (C) Microtubule bundle growth velocity in cut7-24 cells plotted against final bundle length. n = 79 microtubule bundles (D) Time-lapse images of wild-type and cut7-24 cells expressing mCherry-Atb2 (tubulin) and Cdc13-GFP (cyclin B) at 37°C. (E) Time-lapse images of wild-type and cut7-24 cells expressing mCherry-Atb2 (tubulin) and Klp9-GFP (kinesin-6) at 37°C. Asterisk marks the appearance of the Klp9-GFP signal on the microtubule bundle. Arrowheads 1, 2, and 3 correspond to the time points used for linescan analyses at t = 1 (first time point of anaphase B), t = 2 (5 min after anaphase onset), and t = 3 (last time point of anaphase B). (F) Intensity spectra obtained by linescan analysis of Klp9-GFP signals along the microtubule bundles of cut7-24 cells at time points 1, 2, and 3. 0 µm on the x-axis marks the origin of the microtubule bundle at spindle pole bodies. Dark green lines display an exemplary spectrum. (G) Dot plot comparison of the Klp9-GFP intensity on microtubule bundles of cut7-24 cells at time points 1 (n = 22), 2 (n = 28), and 3 (n = 30). Dark green lines display the mean and standard deviation. p-values were calculated using Mann–Whitney U test. (H) Klp9-GFP intensities along microtubule bundles of cut7-24 cells plotted against bundle length. n = 122 (I) Time-lapse images of wild-type and cut7-24 cells expressing mCherry-Atb2 (tubulin) and Ase1-GFP at 37°C. Asterisk marks the appearance of the Ase1-GFP signal on the microtubule bundle. Arrowheads 1, 2, and 3 correspond to the time points used for linescan analysis at t = 1 (first time point of anaphase B), t = 2 (5 min after anaphase onset), and t = 3 (last time point of anaphase B). Scale bar, 5 µm. (J) Intensity spectra obtained by linescan analysis of Ase1-GFP signals along microtubule bundles at time points 1, 2, and 3. 0 µm on the x-axis marks the origin of the microtubule bundle at spindle pole bodies. Dark green lines display an exemplary spectrum. (K) Model of cut7-24 monopolar spindles displaying phase I, termed pro-metaphase, and phase II corresponding to anaphase B as judged by the absence of the Cdc13-GFP signal and the presence of Klp9-GFP and Ase1-GFP in the long microtubule bundles. In (A, D, E) and (I), each frame corresponds to 1 min interval. Dotted lines denote the transition to anaphase B. Scale bar, 5 µm. In (C) and (H), data was fitted by linear regression (dashed line), showing the regression coefficient (R2) and the slope m. Data from n cells was collected from at least three independent experiments.
-
Figure 1—source data 1
Numerical data used for Figure 1B, C, F, G, H, and J.
- https://cdn.elifesciences.org/articles/67489/elife-67489-fig1-data1-v2.xlsx
Figure 1—figure supplement 1
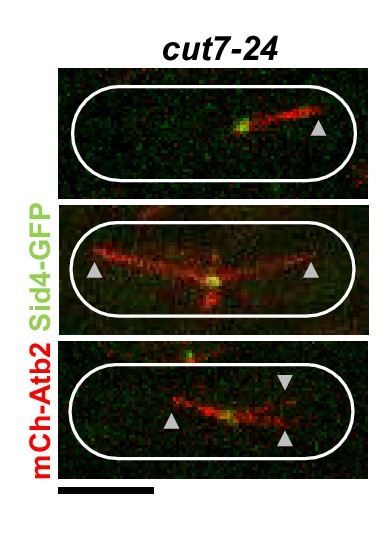
Cut7-24 cells expressing mCherry-Atb2 (tubulin) and Sid4-GFP (SPBs) at 37°C.
Arrowheads depict the tip of microtubule bundles growing from the unseparated spindle poles during anaphase B.
Figure 1—figure supplement 2
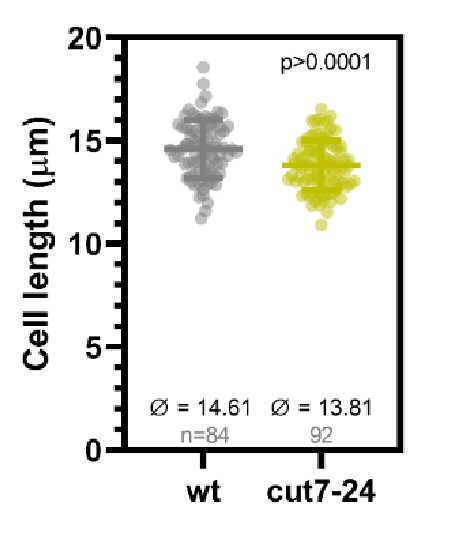
Dot plot comparison of cell length (µm) of wild-type and cut7-24 cells at mitosis onset.
-
Figure 1—figure supplement 2—source data 1
Numerical data used for Figure 1—figure supplement 2.
- https://cdn.elifesciences.org/articles/67489/elife-67489-fig1-figsupp2-data1-v2.xlsx
Figure 2
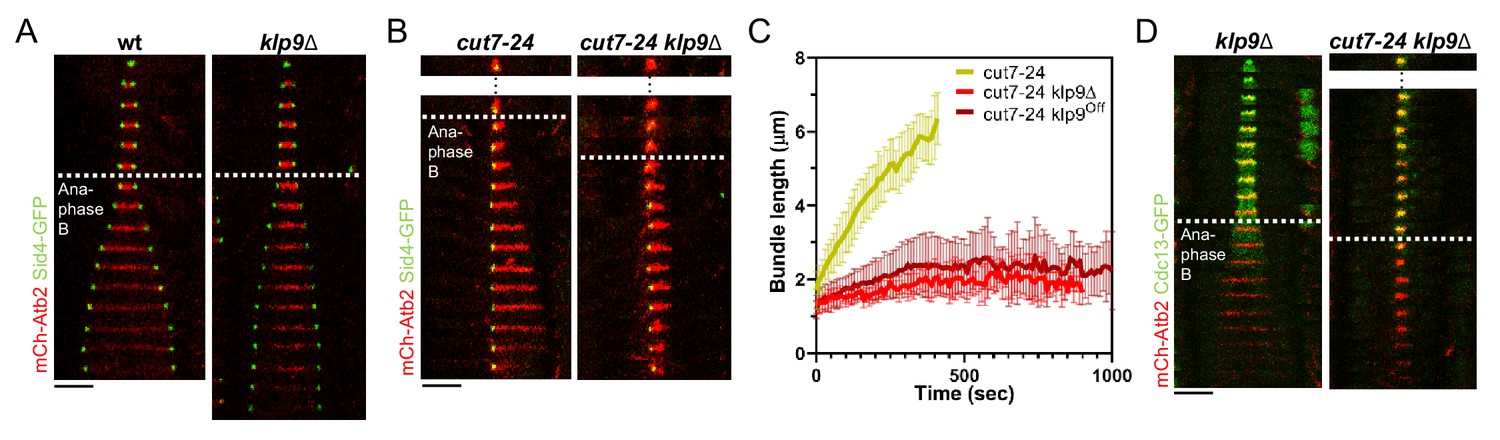
Klp9 promotes microtubule growth during anaphase B in monopolar spindles.
(A) Time-lapse images of wild-type and klp9Δ cells expressing mCherry-Atb2 (tubulin) and Sid4-GFP (SPBs) at 37°C. (B) Time-lapse images of cut7-24 and cut7-24 klp9Δ cells expressing mCherry-Atb2 (tubulin) and Sid4-GFP (SPBs) at 37°C. (C) Comparative plot of microtubule bundle dynamics in cut7-24 (n = 40), cut7-24 klp9Δ (n = 40), and cut7-24 klp9Off (n = 40) at 37°C. Bold curves correspond to the mean and error bars to the standard deviation. (D) Time-lapse images of klp9Δ and cut7-24 klp9Δ cells expressing mCherry-Atb2 (tubulin) and Cdc13-GFP (cyclin B) at 37°C. In (A–B) and (D), each frame corresponds to 1 min interval. Dotted lines denote the transition to anaphase B. Scale bar, 5 µm. Data from n cells was collected from at least three independent experiments.
-
Figure 2—source data 1
Numerical data used for Figure 2C.
- https://cdn.elifesciences.org/articles/67489/elife-67489-fig2-data1-v2.xlsx
Figure 3 with 5 supplements
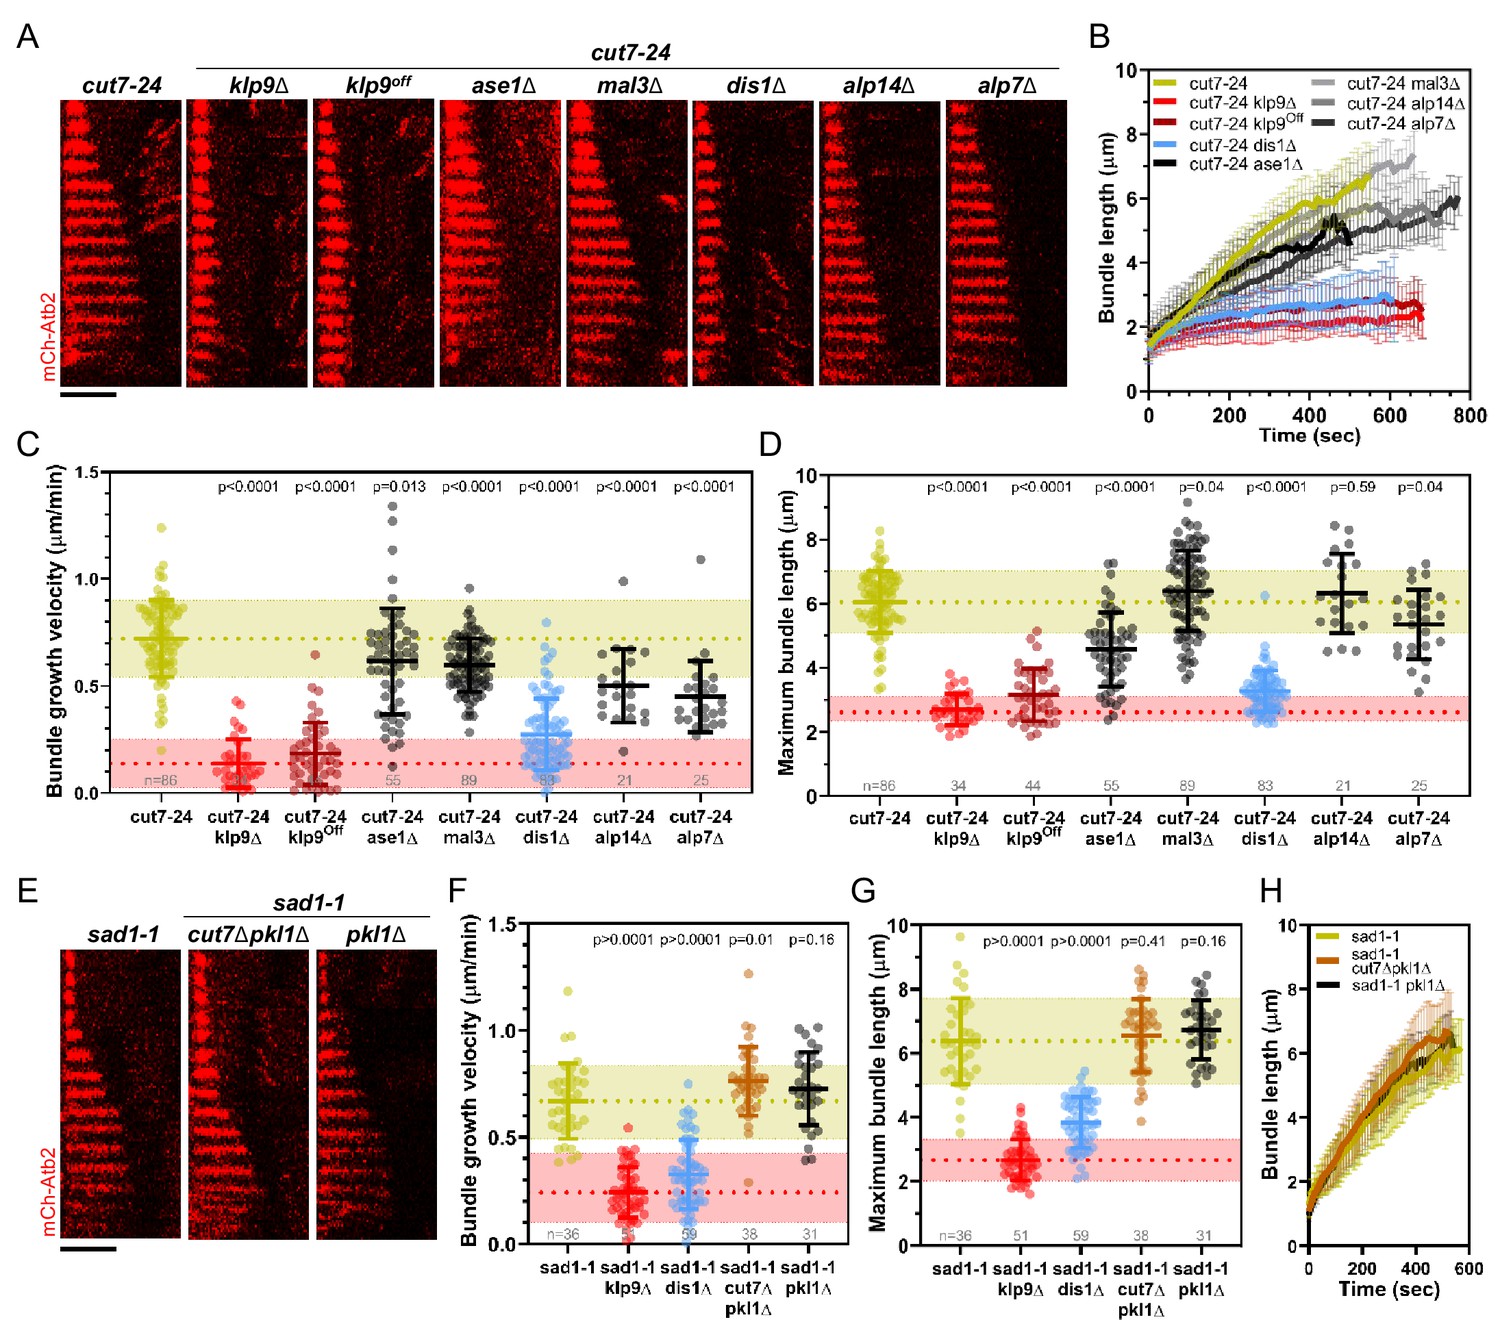
Deletion of dis1 decreases microtubule bundle growth velocity and bundle length during anaphase B in monopolar spindles.
(A) Time-lapse images of cut7-24, cut7-24 klp9Δ, cut7-24 klp9Off, klp9Off ase1Δ, cut7-24 mal3Δ, cut7-24 dis1Δ, cut7-24 alp14Δ, and cut7-24 alp7Δ cells expressing mCherry-Atb2 (tubulin) at 37°C. (B) Comparative plot of microtubule bundle dynamics in cut7-24 (n = 40), cut7-24 klp9Δ (n = 40), cut7-24 klp9Off (n = 40), cut7-24 ase1Δ (n = 39), cut7-24 mal3Δ (n = 40), cut7-24 dis1Δ (n = 39), cut7-24 alp14Δ (n = 20), and cut7-24 alp7Δ cells (n = 25) at 37°C. (C) Dot plot comparison of microtubule bundle growth velocity during anaphase B. (D) Dot plot comparison of maximum microtubule bundle length during anaphase B. (E) Time-lapse images of sad1-1, sad1-1 cut7Δpkl1Δ and sad1-1 pkl1Δ cells expressing mCherry-Atb2 (tubulin) at 37°C. (F) Dot plot comparison of microtubule bundle growth velocity during anaphase B. (G) Dot plot comparison of maximum microtubule bundle length during anaphase B. (H) Comparative plot of microtubule bundle dynamics in sad1-1 (n = 39), sad1-1 cut7Δpkl1Δ (n = 38), and sad1-1 pkl1Δ (n = 31) at 37°C. In (A) and (E), each frame corresponds to 1 min interval. Scale bar, 5 µm. In (C) and (H), bold curves correspond to the mean and error bars to the standard deviation. In (C, D) and (F, G), lines correspond to mean and standard deviation. p-values were calculated using Mann–Whitney U test. Data from n cells was collected from at least three independent experiments.
-
Figure 3—source data 1
Numerical data used for Figure 3B,C,D,F,G, and H.
- https://cdn.elifesciences.org/articles/67489/elife-67489-fig3-data1-v2.xlsx
Figure 3—figure supplement 1
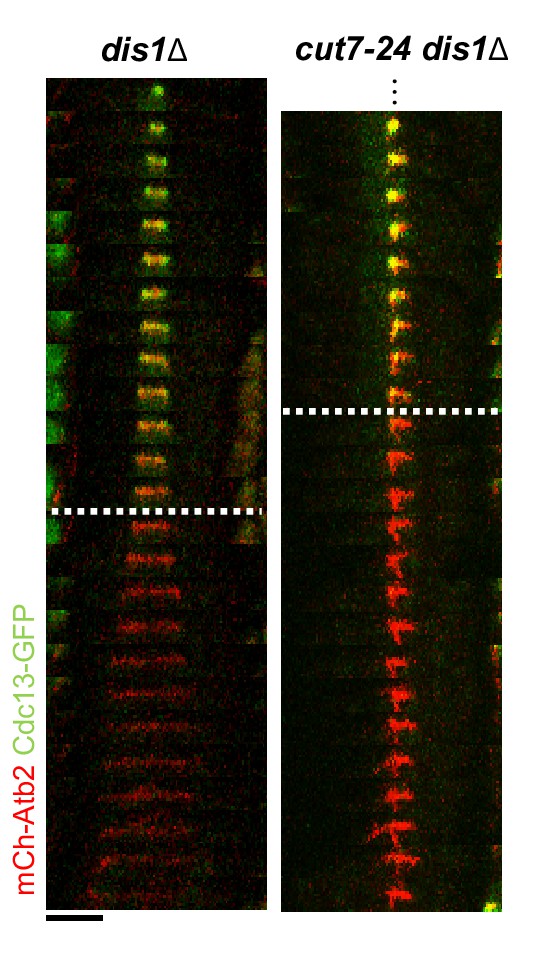
Time-lapse images of dis1Δ and cut7-24 dis1Δ cells expressing mCherry-Atb2 (tubulin) and Cdc13-GFP (cyclin B) at 37°C.
Dotted line denotes the metaphase-to-anaphase B transition. Each frame corresponds to 2 min interval. Scale bar, 5 µm.
Figure 3—figure supplement 2
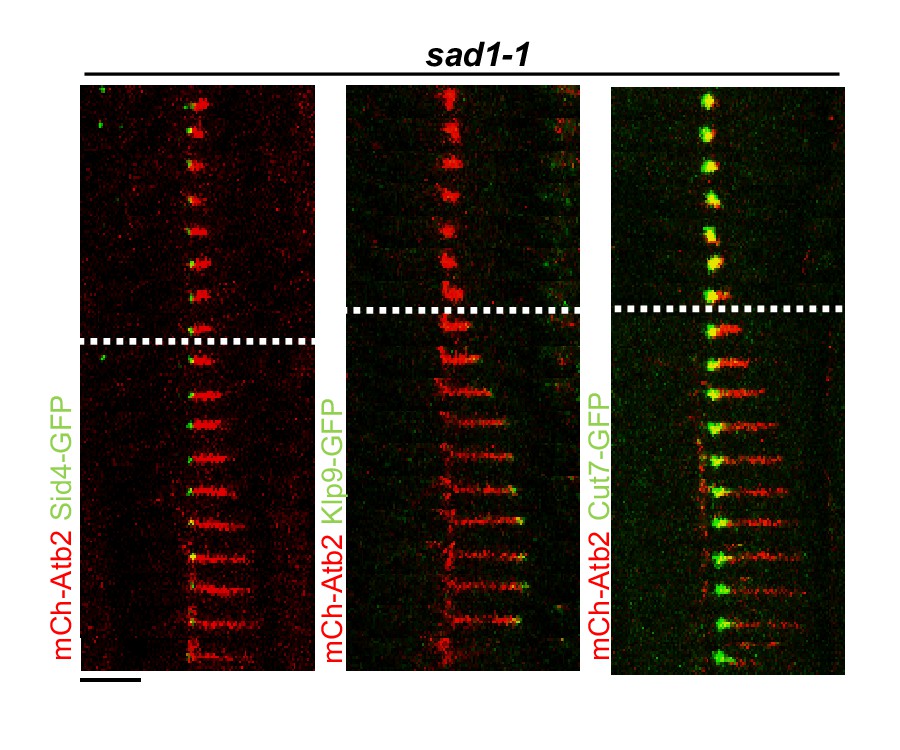
Time-lapse images of sad1-1 cells expressing mCherry-Atb2 (tubulin) and Sid1-GFP (SPBs), Klp9-GFP or Cut7-GFP at 37°C.
Dotted line denotes the metaphase-to-anaphase B transition. Each frame corresponds to 1 min interval. Scale bar, 5 µm.
Figure 3—figure supplement 3
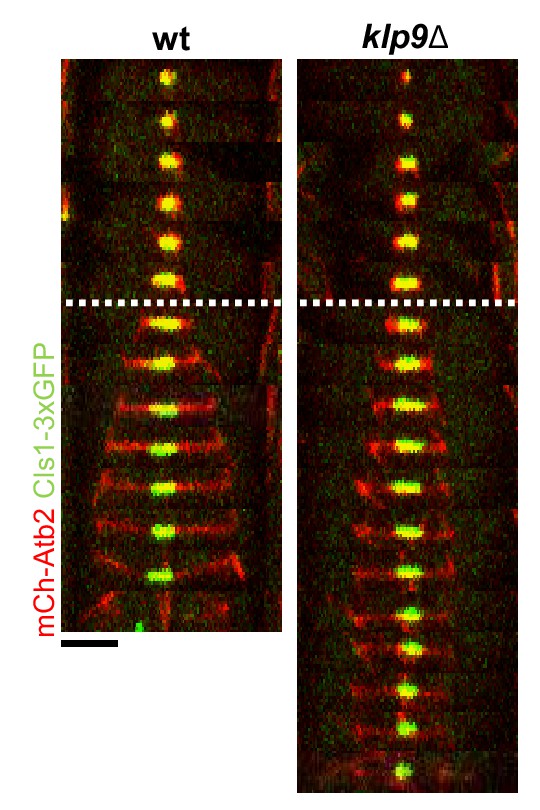
Time-lapse images of wild-type and klp9Δ cells expressing mCherry-Atb2 (tubulin) and Cls1-3xGFP (CLASP) at 25°C.
Dotted line denotes the metaphase-to-anaphase B transition. Each frame corresponds to 2 min interval. Scale bar, 5 µm.
Figure 3—figure supplement 4
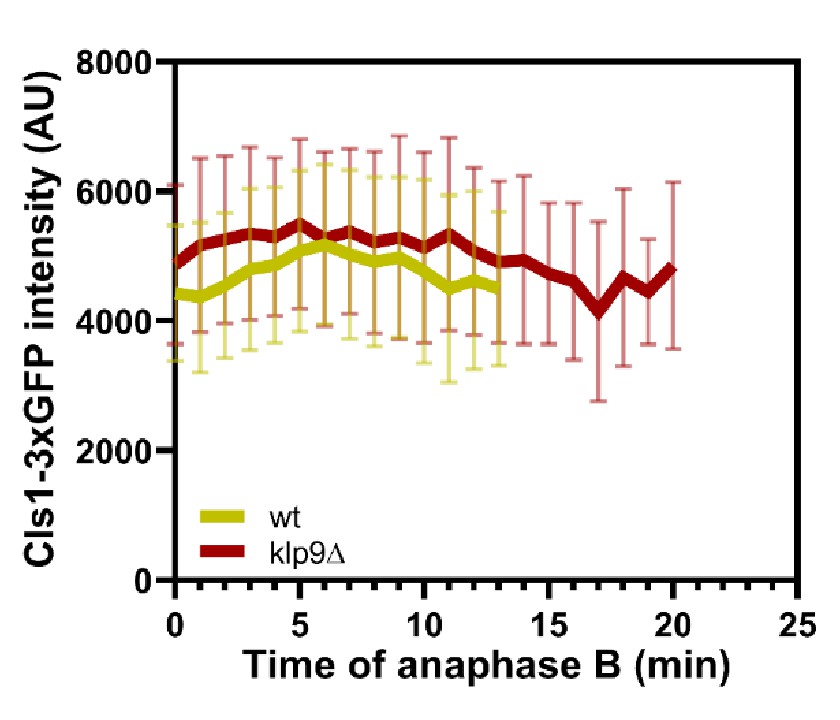
Comparative plot of Cls1-3xGFP intensity throughout anaphase B spindle elongation of wild-type (n = 20) and klp9Δ (n = 20).
Bold curves correspond to the mean and error bars to the standard deviation.
-
Figure 3—figure supplement 4—source data 1
Numerical data used for Figure 3—figure supplement 4.
- https://cdn.elifesciences.org/articles/67489/elife-67489-fig3-figsupp4-data1-v2.xlsx
Figure 3—figure supplement 5
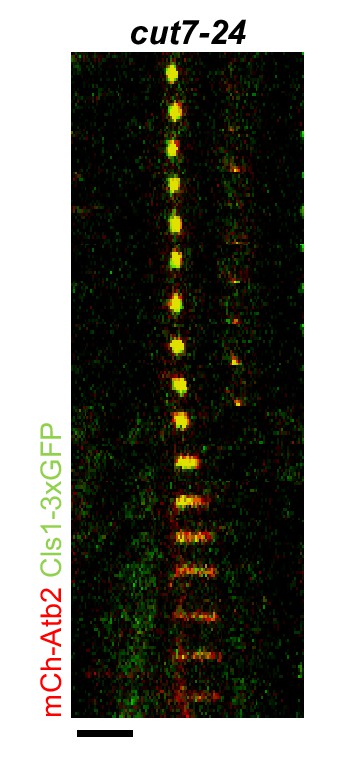
Time-lapse images of cut7-24 cells expressing mCherry-Atb2 (tubulin) and Cls1-3xGFP (CLASP) at 37°C.
Dotted line denotes the metaphase-to-anaphase B transition. Each frame corresponds to 2 min interval. Scale bar, 5 µm.
Figure 4 with 6 supplements

Dis1 deletion impairs Klp9 recruitment to the anaphase B spindle.
(A) Comparative plot of anaphase B spindle dynamics of wild-type (n = 35), dis1Δ (n = 75), klp9Δ (n = 38), and dis1Δklp9Δ (n = 90) at 25°C. (B) Dot plot comparison of spindle elongation velocity in wild-type, dis1Δ, klp9Δ, and dis1Δklp9Δ cells. (C) Dot plot comparison of final anaphase B spindle length in wild-type, dis1Δ, klp9Δ, and dis1Δklp9Δ cells. (D) Time-lapse images of wild-type and dis1Δ cells expressing mCherry-Atb2 (tubulin) and Klp9-GFP at 25°C. Arrowheads 1 and 2 correspond to the time points used for linescan analysis at t = 1 (2 min after anaphase B onset), t = 2 (2 min before spindle disassembly). Circles mark the Klp9 pool that remained in the nucleoplasm. Scale bar, 5 µm. (E) Comparative plot of Klp9-GFP intensity throughout anaphase B spindle elongation of wild-type (n = 30) and dis1Δ cells (n = 33). (F) Intensity spectra obtained by linescan analysis of Klp9-GFP signals along the anaphase B spindle at early (t = 1) and late anaphase (t = 2). In (A), (E), and (F), bold curves correspond to the mean and error bars to the standard deviation. In (B) and (C), lines correspond to mean and standard deviation. Data from n cells was collected from at least three independent experiments.
-
Figure 4—source data 1
Numerical data used for Figure 4A,B,C,E, and F.
- https://cdn.elifesciences.org/articles/67489/elife-67489-fig4-data1-v2.xlsx
-
Figure 4—source data 2
Numerical data used for Figure 4—figure supplements 1, 2, 4, 5, and 6.
- https://cdn.elifesciences.org/articles/67489/elife-67489-fig4-data2-v2.xlsx
Figure 4—figure supplement 1
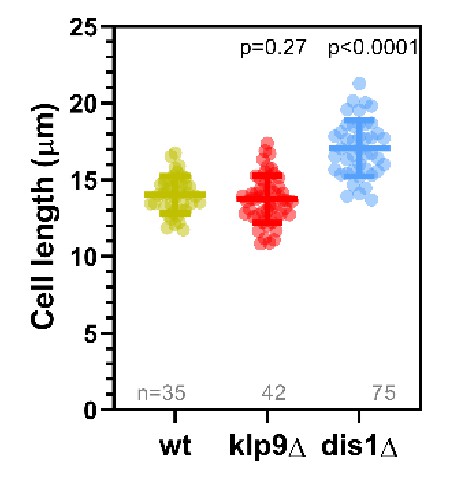
Dot plot comparison of cell length (µm) of wild-type, klp9Δ, and dis1Δ cells at mitosis onset.
Figure 4—figure supplement 2
Dis1 recruitment to the anaphase B spindle is not impaired upon klp9 deletion.
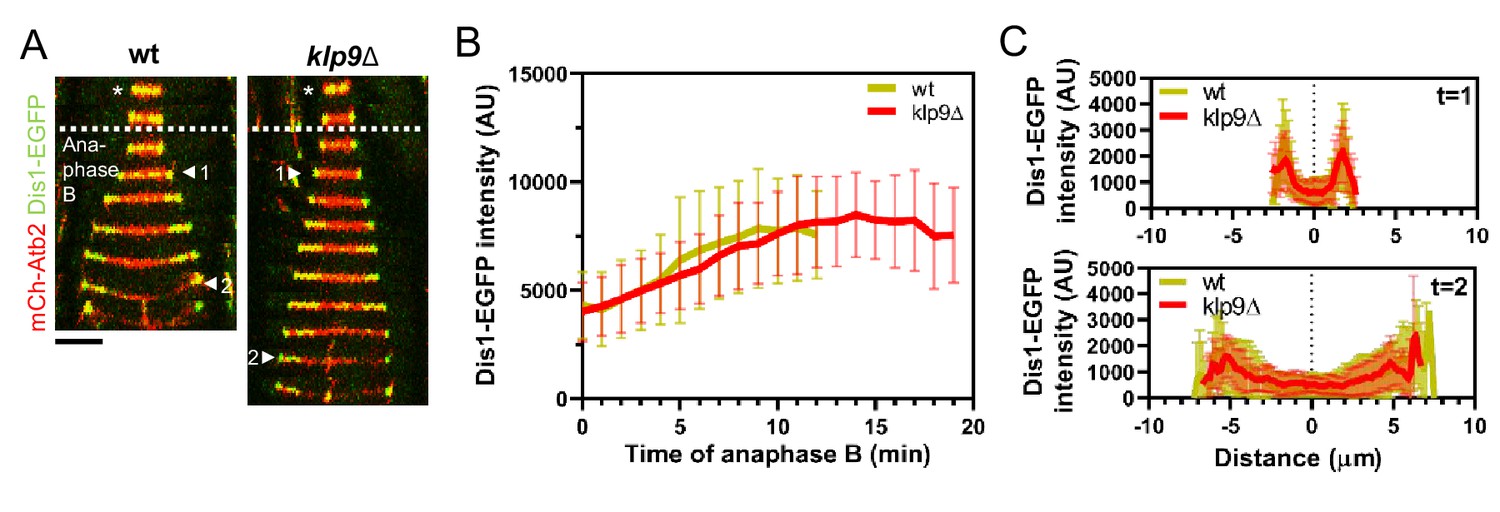
(A) Time-lapse images of wild-type and klp9Δ cells expressing mCherry-Atb2 (tubulin) and Dis1-EGFP at 25°C. Each frame corresponds to 2 min interval. Dotted denotes the transition to anaphase B. Arrowheads 1 and 2 correspond to the time points used for linescan analysis at t = 1 (2 min after anaphase B onset), t = 2 (2 min before spindle disassembly). Scale bar, 5 µm. (B) Comparative plot of Dis1-EGFP intensity throughout anaphase B spindle elongation of wild-type (n = 29) and klp9Δ (n = 29). Bold curves correspond to the mean and error bars to the standard deviation. (C) Intensity spectra obtained by linescan analysis of Dis1-EGFP signals along the anaphase spindle at early (t = 1) and late anaphase (t = 2). Bold curves correspond to the mean and error bars to the standard deviation.
Figure 4—figure supplement 3
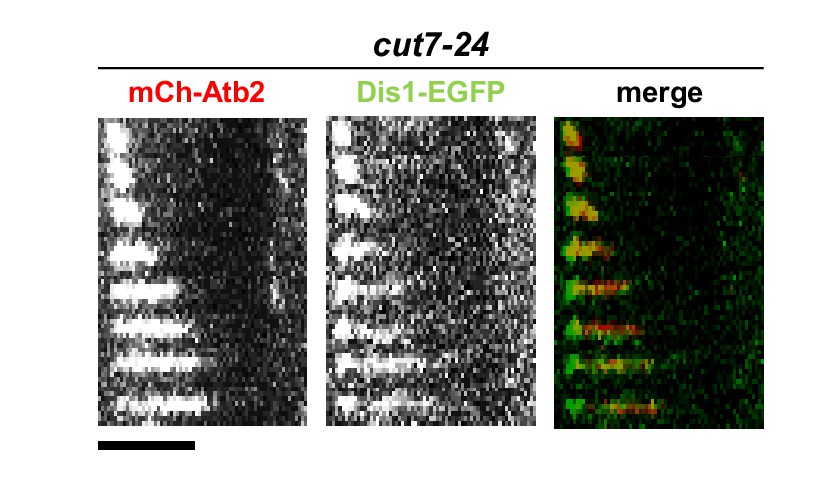
Time-lapse images of cut7-24 cells expressing mCherry-Atb2 (tubulin) and Dis1-EGFP at 37°C.
Each frame corresponds to 2 min interval. Scale bar, 5 µm.
Figure 4—figure supplement 4
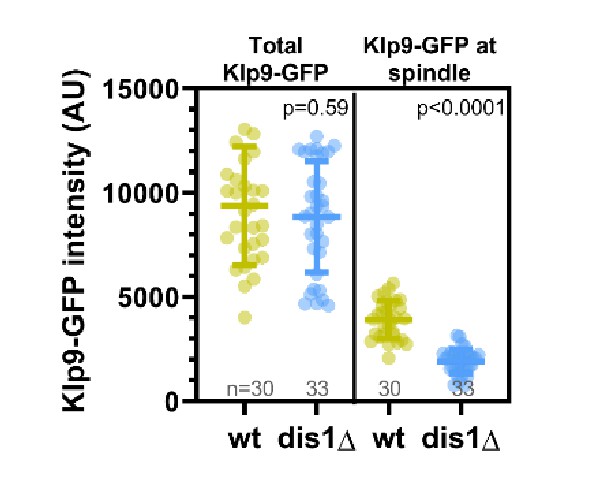
Dot plot comparison of Klp9-GFP intensity in the nucleoplasm at mitosis onset and mean Klp9-GFP intensity at the spindle midzone during anaphase B in wild-type and dis1Δ cells.
Lines correspond to mean and standard deviation. p-values were calculated using Mann–Whitney U test.
Figure 4—figure supplement 5
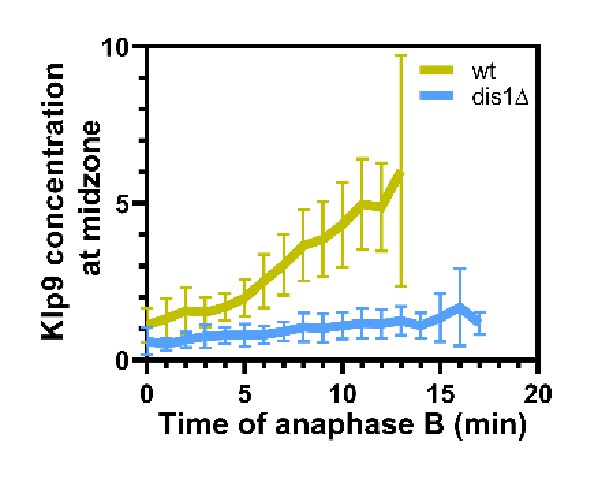
Comparative plot of the relative Klp9 concentration at the spindle midzone (Klp9-GFP intensity normalized with the mCherry-Atb2 intensity) throughout anaphase B spindle elongation of wild-type (n = 29) and dis1Δ (n = 28).
Bold curves correspond to mean spindle dynamics and error bars to the standard deviation.
Figure 4—figure supplement 6
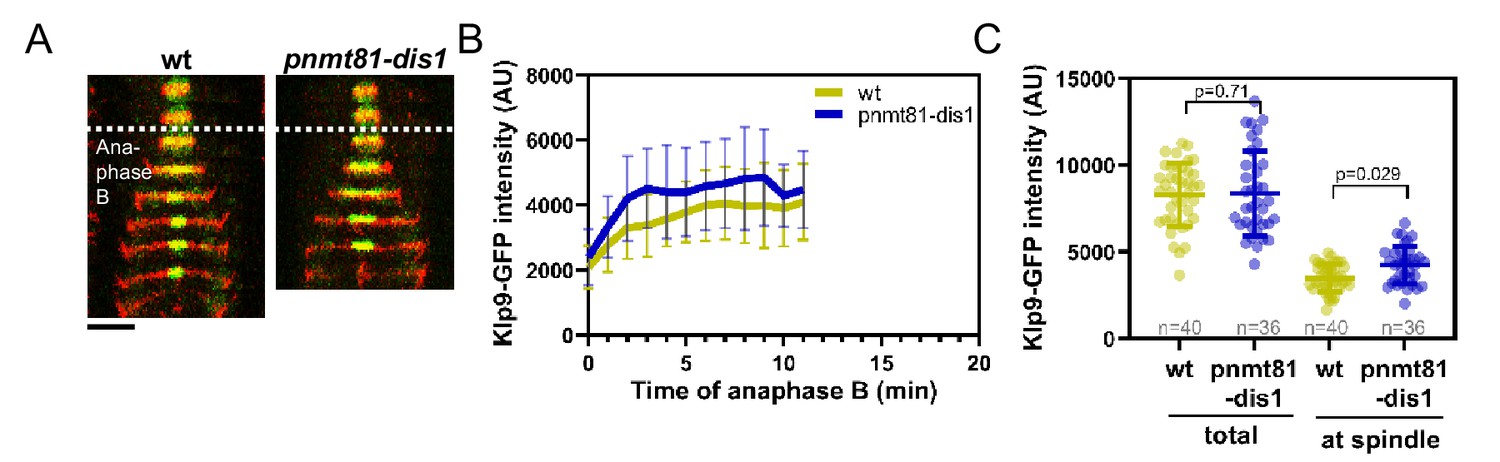
Mild overexpression of dis1 increases Klp9-GFP levels at the spindle midzone during anaphase B.
(A) Time-lapse images of wild-type and pnmt81-dis1 cells expressing mCherry-Atb2 (tubulin) and Klp9-GFP at 25°C. Dotted line corresponds to transition to anaphase B. (B) Comparative plot of Klp9-GFP intensity throughout anaphase B spindle elongation of wild-type (n = 40) and pnmt81-dis1 cells (n = 36). Bold curves correspond to the mean and error bars to the standard deviation. (C) Dot plot comparison of Klp9-GFP intensity in wild-type and pnmt81-dis1 cells in total, measured in the nucleoplasm before anaphase B onset and at the spindle midzone during anaphase B. Lines correspond to mean and standard deviation. p-values were calculated using Mann–Whitney U test.
Figure 5 with 4 supplements
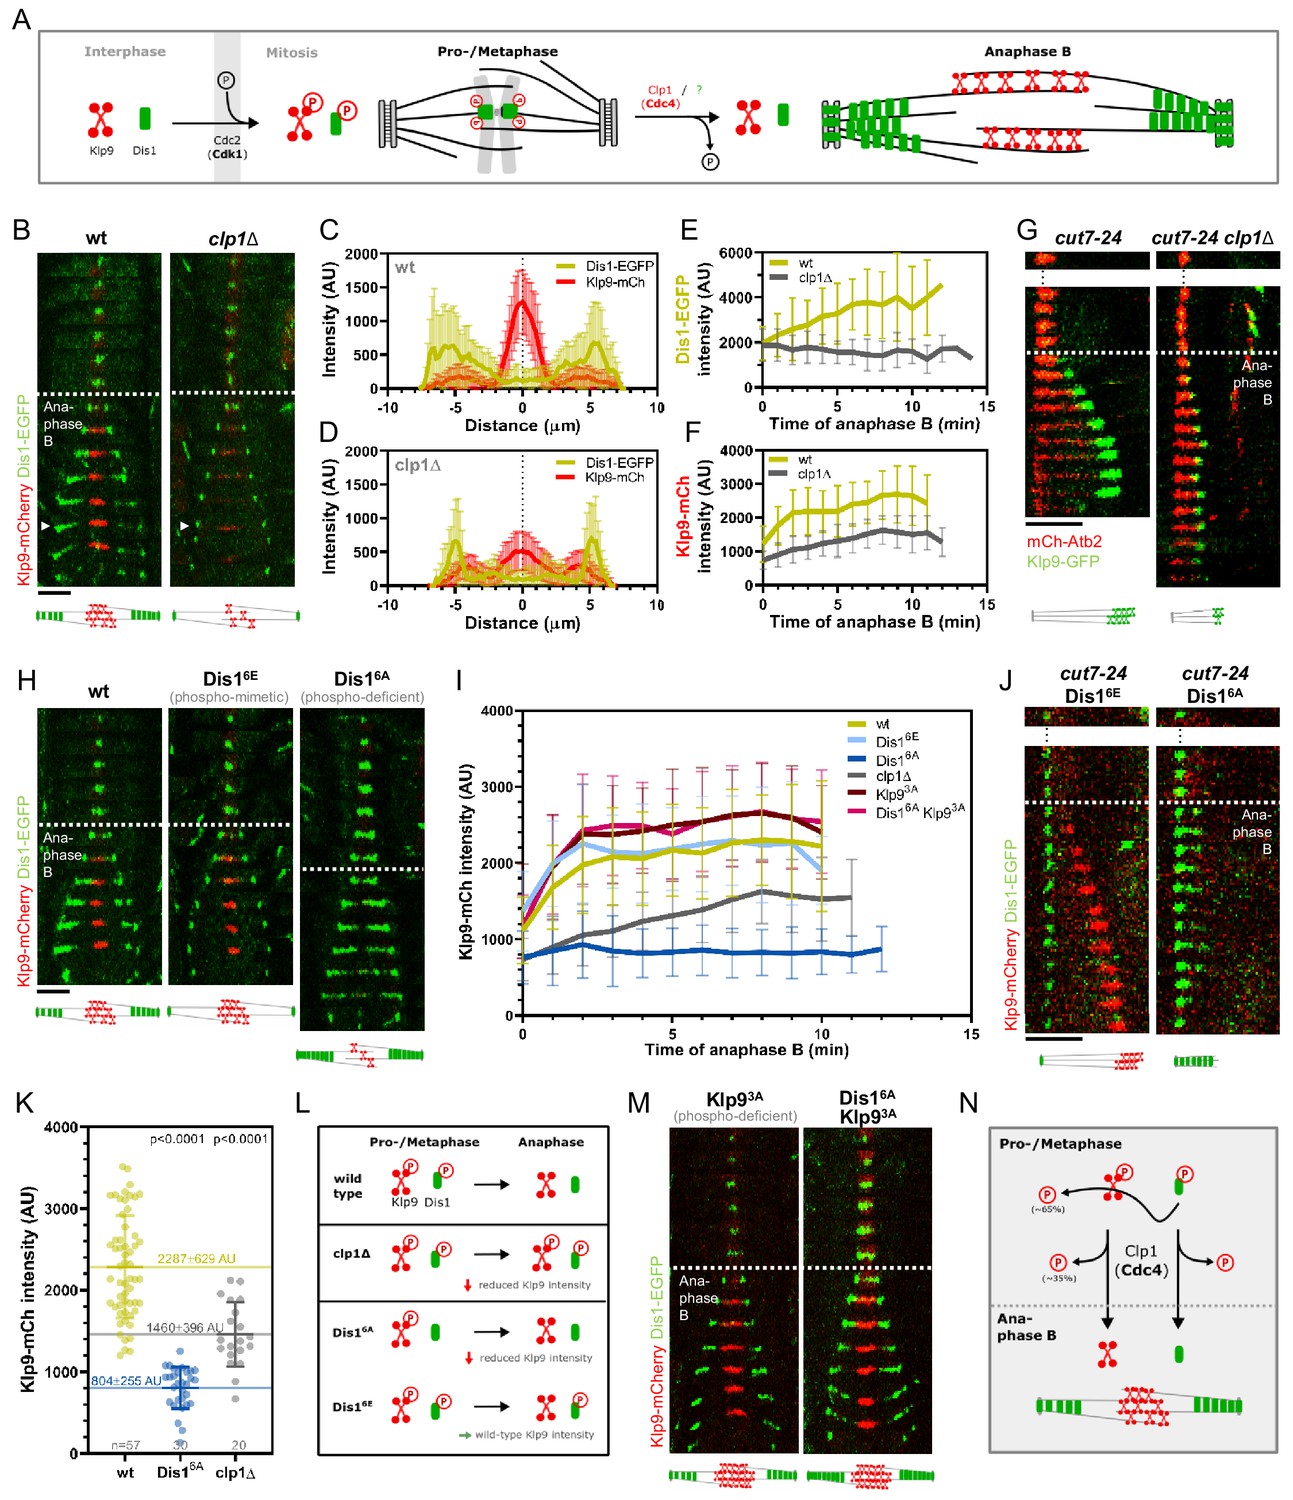
Phospho-dependent regulation of Dis1-mediated Klp9 recruitment.
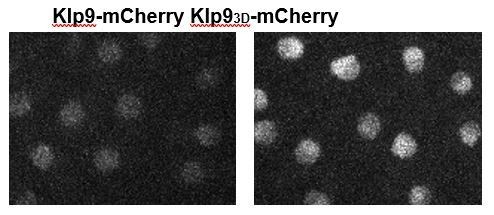
(A) Model of phosphorylation-dependent localization of Klp9 (red) and Dis1 (green) throughout mitosis mediated by the cyclin-dependent kinase Cdc2 (homolog of Cdk1) and the phosphatase Clp1 (homolog of Cdc14). (B) Time-lapse images of wild-type and clp1Δ cells expressing Klp9-mCherry and Dis1-EGFP at 25°C. Arrowhead depicts the time point used for linescan analysis (2 min before spindle disassembly). Schemes of anaphase B spindles, illustrating the localization pattern of Klp9 (red) and Dis1 (green) along the spindle (gray). (C) Intensity spectra obtained by linescan analysis of Dis1-EGFP and Klp9-mCherry signals along the anaphase spindle at late anaphase in wild-type cells (n = 30). X = 0 µm equals the cell center. (D) Intensity spectra obtained by linescan analysis of Dis1-EGFP and Klp9-mCherry signals along the anaphase spindle at late anaphase in clp1Δ cells (n = 30). (E) Comparative plot of Dis1-EGFP intensity throughout anaphase B spindle elongation of wild-type (n = 30) and clp1Δ (n = 30). (F) Comparative plot of Klp9-mCherry intensity throughout anaphase B spindle elongation of wild-type (n = 30) and clp1Δ (n = 30). (G) Time-lapse images of cut7-24, and cut7-24 clp1Δ cells expressing Klp9-GFP and mCherry-Atb2. Time interval corresponds to 1 min. Schemes of monopolar anaphase B spindles, illustrating the localization pattern of Klp9 (green) along the spindle (grey). (H) Time-lapse images of cells expressing wild-type Dis1-GFP, phospho-mimetic Dis16E-GFP or phospho-deficient Dis16A-GFP together with Klp9-mCherry at 25°C. (I) Comparative plot of Klp9-mCherry intensity throughout anaphase B spindle elongation of wild-type cells (n = 30) and cells expressing Dis16E-GFP (n = 30), Dis16A-GFP (n = 30), Klp93A-mCherry (n = 30), Dis16A-EGFP and Klp9SA-mCherry (n = 30), and clp1Δ cells (n = 20). Schemes of anaphase B spindles, illustrating the localization pattern of Klp9 (red) and Dis1 (green) along the spindle (gray). (J) Time-lapse images of cut7-24 cells expressing Klp9-mCherry and Dis16E-EGFP or Dis16A-EGFP. Time interval corresponds to 1 min. Schemes of monopolar anaphase B spindles, illustrating the localization pattern of Klp9 (red) and Dis1 (green) along the spindle (gray). (K) Dot plot comparison of the Klp9-mCherry intensity (AU) in wild-type, Dis16A, clp1Δ and Dis16Eclp1Δ cells. Lines correspond to mean and standard deviation. Long lines depict the mean for each cell type. p-values were calculated using Mann-Whitney U test. (L) Summary of the results obtained upon clp1 deletion and expression of phospho-deficient Dis16A or phosphoimimetic Dis16E. (M) Time-lapse images of cells expressing phospho-deficient Klp93A-mCherry with wild-type Dis1-GFP, and phospho-deficient Klp93A-mCherry with phospho-deficient Dis16A-EGFP at 25°C. Schemes of anaphase B spindles, illustrating the localization pattern of Klp9 (red) and Dis1 (green) along the spindle (gray). (N) Model of dephosphorylation-dependent regulation of Klp9 and Dis1 localization to the anaphase B spindle. In (B), (H), and (M), each frame corresponds to 2 min interval. Dotted lines denote the transition to anaphase B. Scale bar, 5 µm. In (C–F) and (I), bold curves correspond to the mean and error bars to the standard deviation. Data from n cells was collected from at least three independent experiments.
-
Figure 5—source data 1
Numerical data used for Figure 5C,D,E,F,I, and K.
- https://cdn.elifesciences.org/articles/67489/elife-67489-fig5-data1-v2.xlsx
-
Figure 5—source data 2
Numerical data used for Figure 5—figure supplements 1, 2, and 4.
- https://cdn.elifesciences.org/articles/67489/elife-67489-fig5-data2-v2.xlsx
Figure 5—figure supplement 1
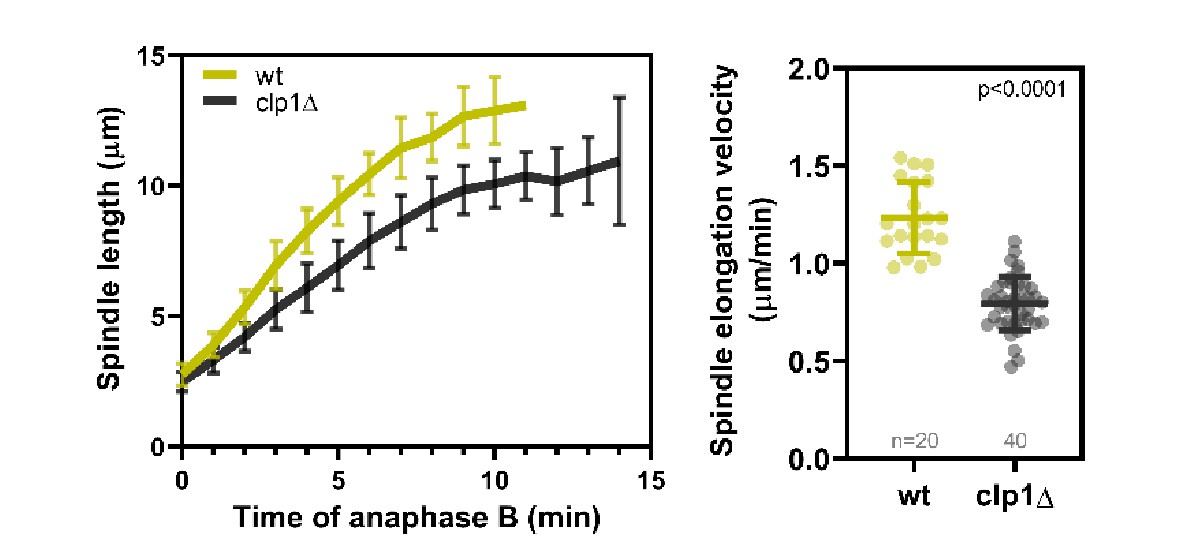
Comparative plot of spindle length dynamics during anaphase B and dot plot compairison of anaphase B spindle elongation velocity of wild-type (n = 20) and clp1Δ cells (n = 40).
Bold curves correspond to the mean and error bars to the standard deviation. Lines correspond to mean and standard deviation. p-values were calculated with Mann–Whitney U test.
Figure 5—figure supplement 2
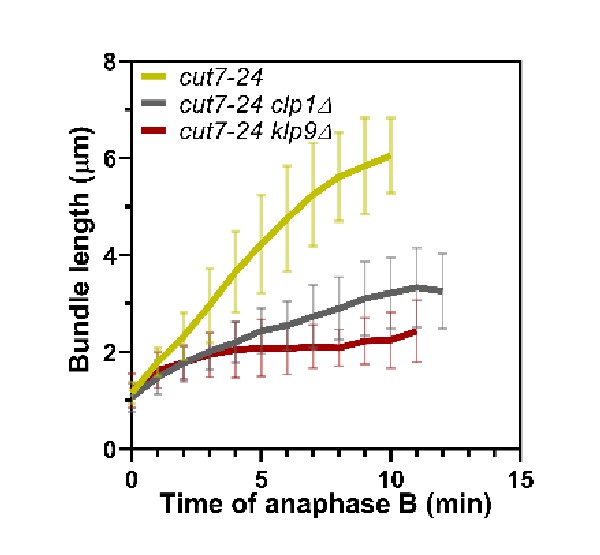
Comparative plot of microtubule bundle dynamics in cut7-24 (n = 39), cut7-24 clp1Δ (n = 35), and cut7-24 klp9Δ (n = 40) at 37°C.
Figure 5—figure supplement 3
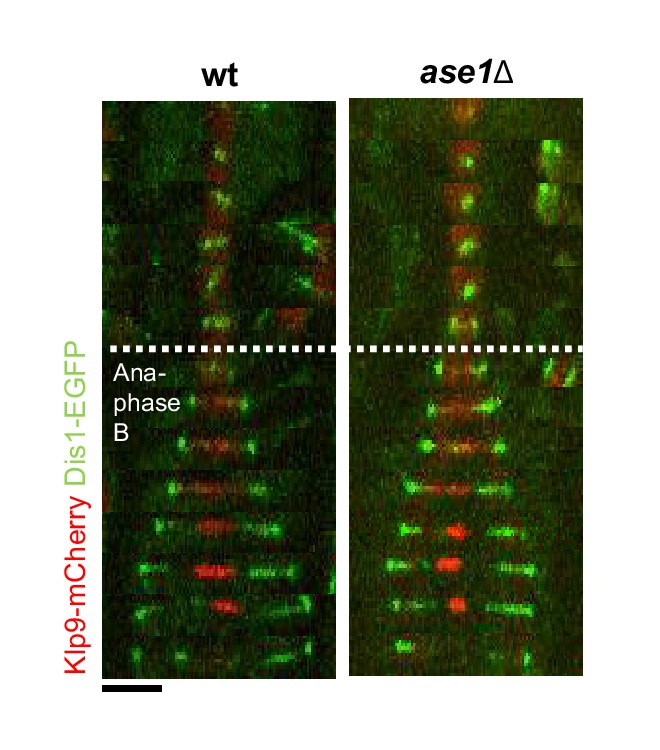
Time-lapse images of wild-type and ase1Δ cells expressing Klp9-mCherry and Dis1-EGFP at 25°C.
Each time frame corresponds to 2 min interval. Scale bar, 5 µm.
Figure 5—figure supplement 4
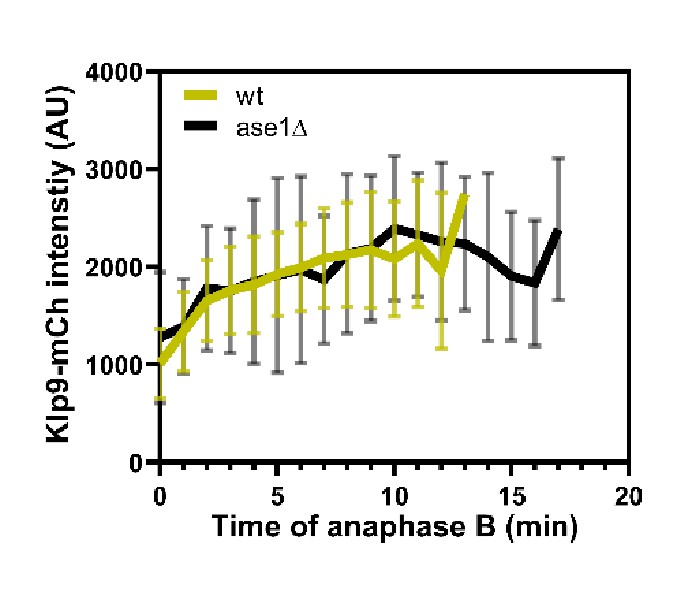
Comparative plot of Klp9-mCherry intensity throughout anaphase B spindle elongation of wild-type (n = 30) and ase1Δ (n = 30).
Bold curves correspond to the mean and error bars to the standard deviation.
Figure 6 with 3 supplements
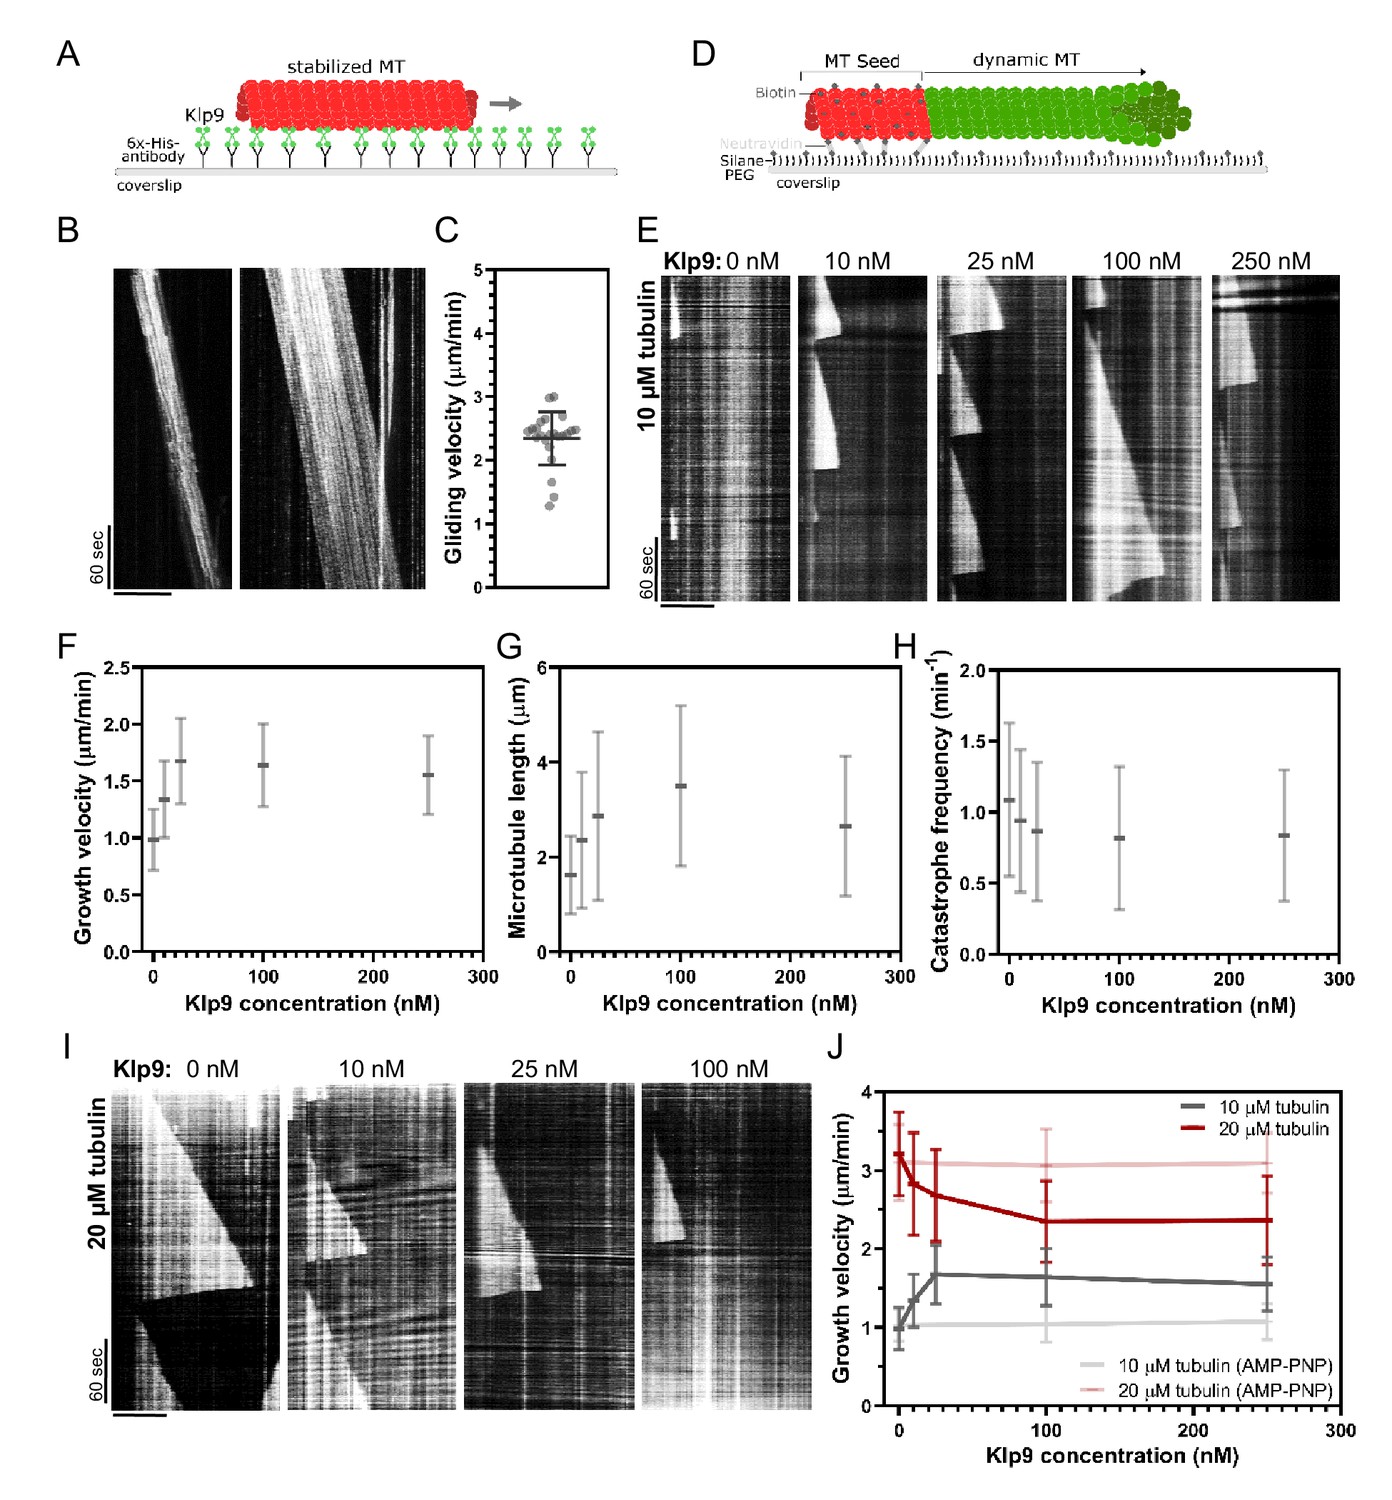
Recombinant Klp9 regulates the microtubule growth velocity in vitro.
(A) Schematic set up of the microtubule gliding assay. His6 antibodies are shown in gray, Klp9 molecules in green, and taxol-stabilized microtubules in red. (B) Kymographs of gliding microtubules with the time on the y-axis and space on the x-axis. Scale bar, 10 µm. (C) Dot plot of microtubule gliding velocities. (D) Schematic of microtubule polymerization assay: GMPCPP-stabilized, ATTO-647-labeled microtubule seeds are shown in red and the dynamic microtubule grown from free tubulin (80% unlabeled, 20% ATTO-488-labeled tubulin) in green. (E) Kymographs of dynamic microtubules grown in presence of 10 µM free tubulin and 0, 10, 25, 100, and 250 nM Klp9. Scale bar, 5 µm. (F) Microtubule growth velocity (µm/min) shown as a function of the Klp9 concentration (nM); n = 190–325 microtubules per condition. (G) Microtubule length (µm) shown as a function of the Klp9 concentration (nM); n = 157–325 microtubules per condition. (H) Catastrophe frequency (min−1) shown as a function of the Klp9 concentration (nM); n = 65–112 microtubules per condition. (I) Kymographs of dynamic microtubules grown in presence of 20 µM free tubulin (80% unlabeled, 20% ATTO-488-labeled tubulin), and 0, 10, 25, and 100 nM Klp9. Scale bar, 5 µm. (J) Microtubule growth velocity (µm/min) measured in the presence of 10 µM or 20 µM free tubulin, and ATP or AMP-PNP, shown as a function of the Klp9 concentration (nM); n = 190–399 microtubules per condition. For (F–H) and (J), mean values and standard deviations are shown. Data from n microtubules was collected from at least three independent experiments.
-
Figure 6—source data 1
Numerical data used for Figure 6C,F,G,H, and J.
- https://cdn.elifesciences.org/articles/67489/elife-67489-fig6-data1-v2.xlsx
-
Figure 6—source data 2
Numerical data used for Figure 6—figure supplements 2 and 3.
- https://cdn.elifesciences.org/articles/67489/elife-67489-fig6-data2-v2.xlsx
Figure 6—figure supplement 1
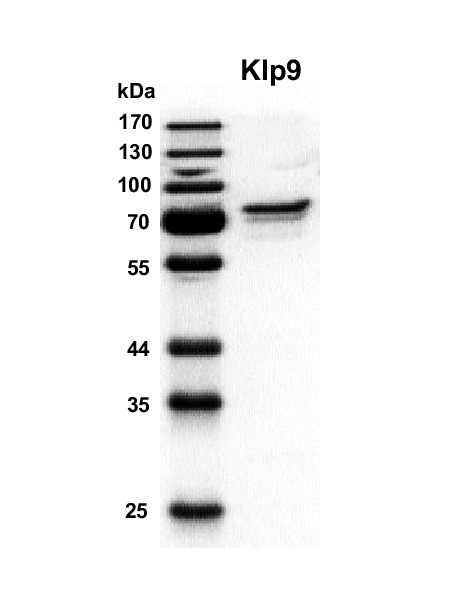
SDS-gel of purified full-length Klp9 (71 kDa) stained with Instant Blue (Euromedex).
Figure 6—figure supplement 2
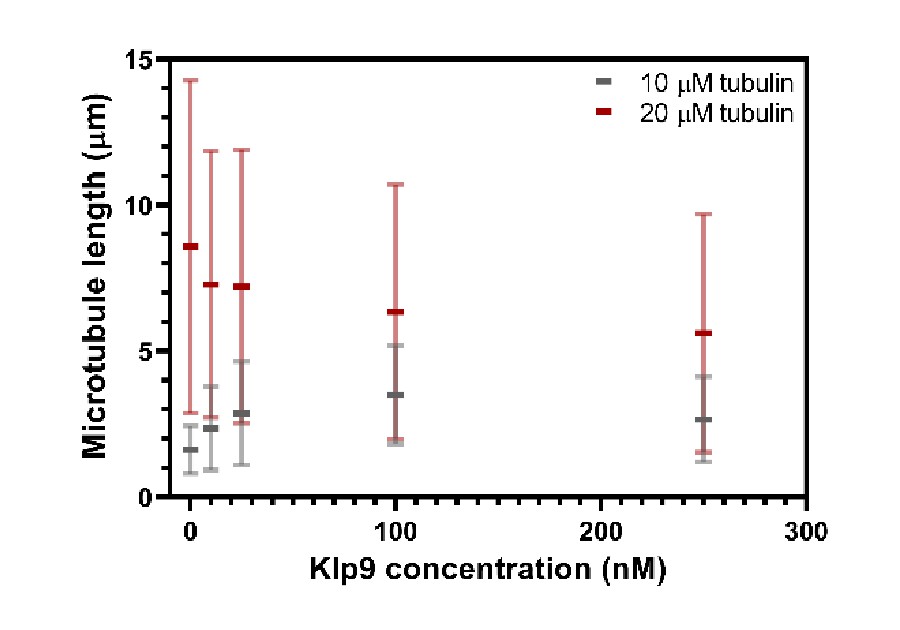
Microtubule length (µm) measured in the presence of 10 µM or 20 µM free tubulin shown as a function of the Klp9 concentration (nM); n = 190–399 microtubules per condition.
Mean values and standard deviations are shown.
Figure 6—figure supplement 3
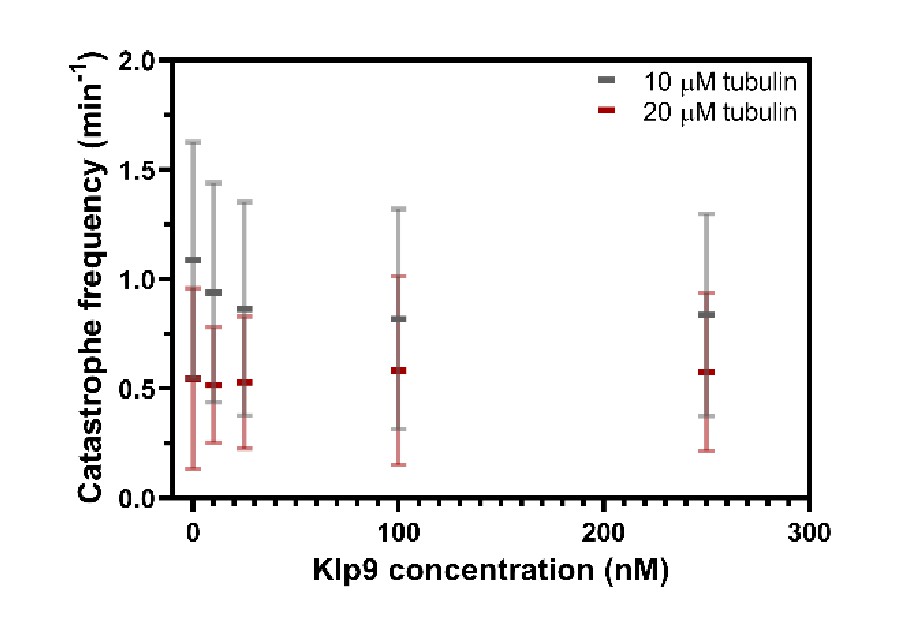
Catastrophe frequency (min−1) measured in presence of 10 µM or 20 µM free tubulin shown as a function of the Klp9 concentration (nM); n = 190–399 microtubules per condition.
Mean values and standard deviations are shown.
Figure 7 with 1 supplement

Model of Dis1-dependent Klp9 recruitment and Klp9 function during anaphase B spindle elongation.
(A) Upper: Wild-type, klp9Δ and dis1Δ cells at the end of anaphase B expressing mCherry-Atb2 treated or not treated with hydroxyurea (HU). Addition of HU allows to block the cells in S-Phase, resulting in increased cell size. Lower: Final anaphase B spindle length plotted against cell length of wild-type, klp9Δ, and dis1Δ cells. Unfilled circles correspond to cells not treated with HU and filled circles to cells treated with HU. Data was fitted by linear regression, showing the regression coefficient R2 and the slope m. (B) Schematic model of the link between spindle length and spindle elongation velocity scaling with cell size. In bigger cells the presence of higher Dis1 (blue) levels gives rise to the assembly of longer spindles as well as the recruitment of higher Klp9 (green) levels to the spindle midzone of anaphase B spindles, which subsequently results in faster spindle elongation of the longer spindles in bigger cells. (C) Model of Klp9 recruitment at anaphase onset and its function during anaphase B. Klp9 may promote spindle elongation by generating microtubule sliding forces and regulating the microtubule growth velocity.
-
Figure 7—source data 1
Numerical data used for Figure 7A.
- https://cdn.elifesciences.org/articles/67489/elife-67489-fig7-data1-v2.xlsx
Figure 7—figure supplement 1
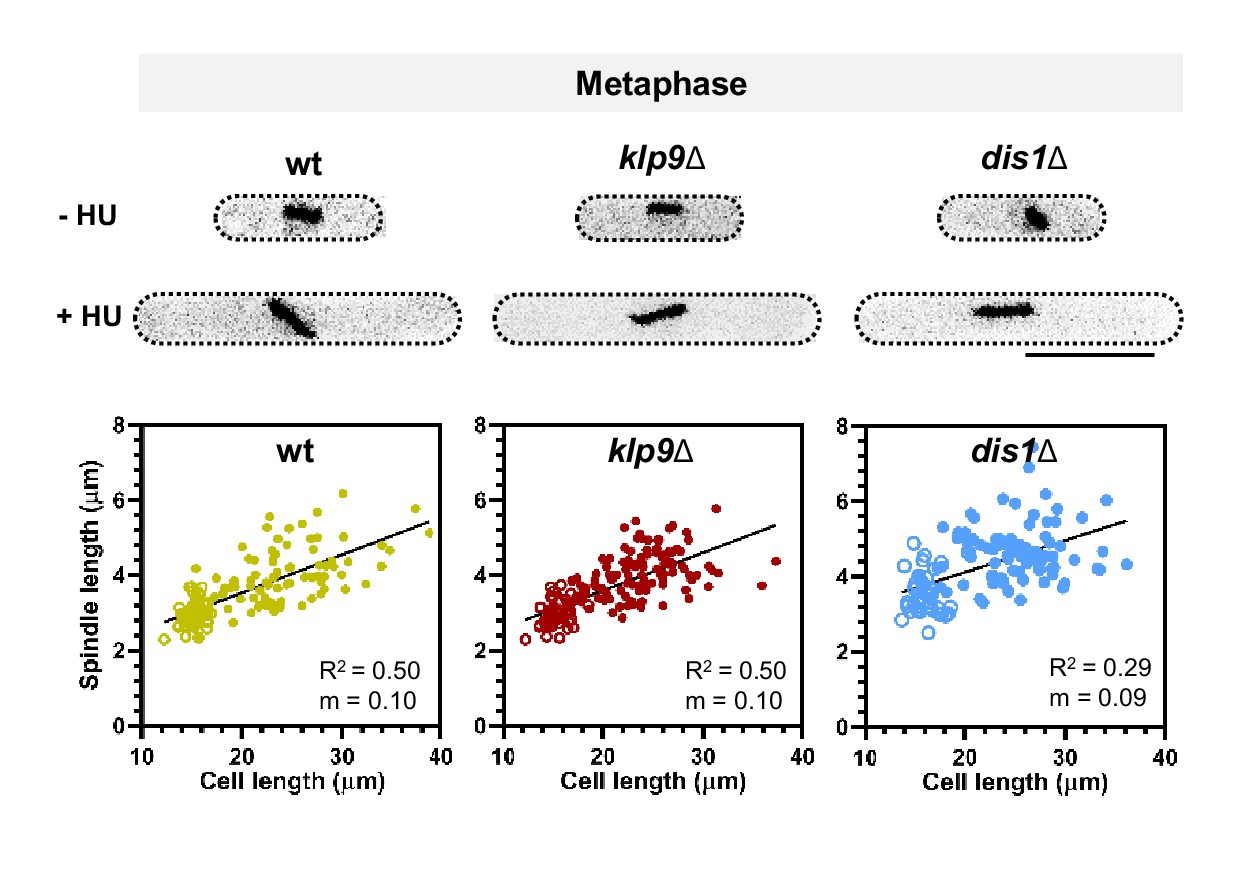
Wild-type, klp9Δ, and dis1Δ cells at the end of metaphase expressing mCherry-Atb2 treated or not treated with hydroxyurea (HU) and final metaphase spindle length plotted against cell length of wild-type, klp9Δ, and dis1Δ cells. .
Addition of HU allows to block the cells in S-Phase, resulting in increased cell size. Unfilled circles correspond to cells not treated with HU, filled circles to cells treated with HU. Data was fitted by linear regression, showing the regression coefficient R2 and the slope m.
-
Figure 7—figure supplement 1—source data 1
Numerical data used for Figure 7—figure supplement 1.
- https://cdn.elifesciences.org/articles/67489/elife-67489-fig7-figsupp1-data1-v2.xlsx
Author response image 1
Additional files
-
Supplementary file 1
List of S. pombe strains used in this study.
- https://cdn.elifesciences.org/articles/67489/elife-67489-supp1-v2.xlsx
-
Transparent reporting form
- https://cdn.elifesciences.org/articles/67489/elife-67489-transrepform-v2.docx
Download links
A two-part list of links to download the article, or parts of the article, in various formats.
Downloads (link to download the article as PDF)
Open citations (links to open the citations from this article in various online reference manager services)
Cite this article (links to download the citations from this article in formats compatible with various reference manager tools)
Kinesin-6 Klp9 orchestrates spindle elongation by regulating microtubule sliding and growth
eLife 10:e67489.
https://doi.org/10.7554/eLife.67489


