Two different cell-cycle processes determine the timing of cell division in Escherichia coli
- Microbial Morphogenesis and Growth Laboratory, Institut Pasteur, France
- Department of Environmental Microbiology, Switzerland
- Department of Environmental Systems Science, ETH Zürich, Switzerland
- IFOM, FIRC Institute of Molecular Oncology, Italy
- Physics Department, University of Milan, and INFN, Italy
- Département de Microbiologie, Infectiologie et Immunologie, Université de Montréal, Canada
Figures
Figure 1
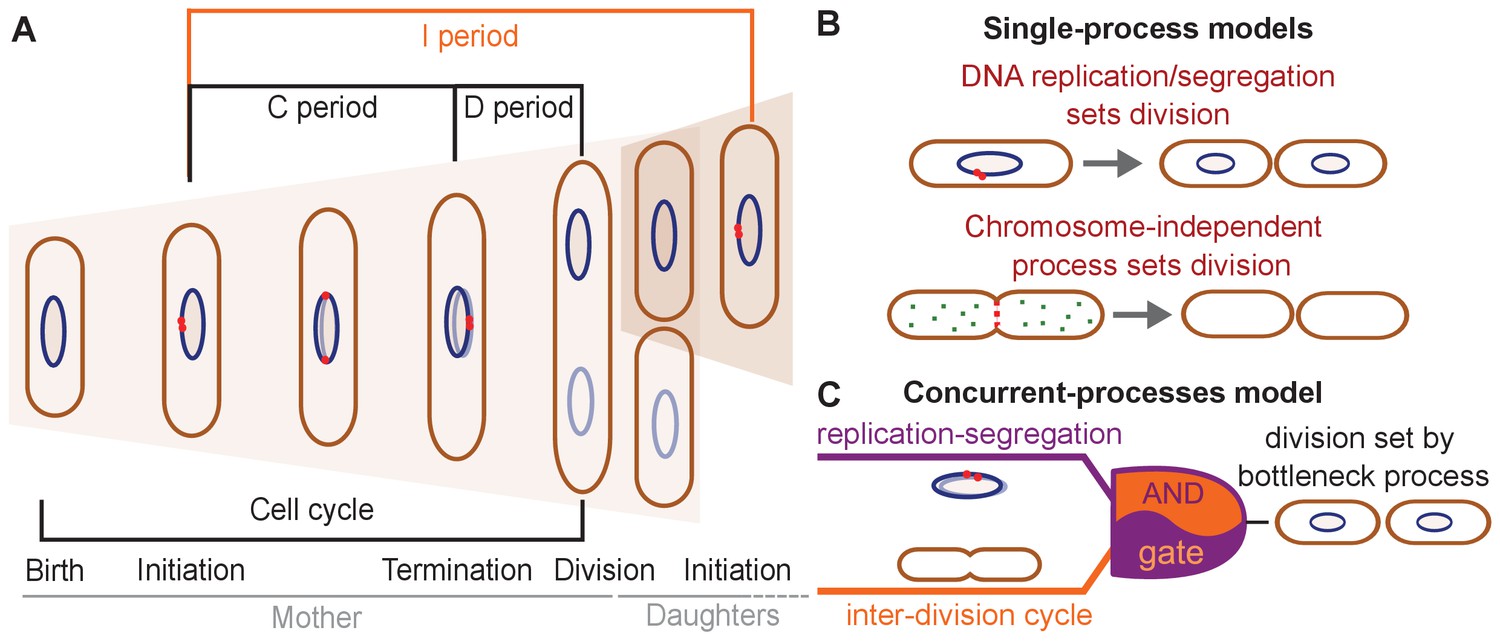
Different models have been suggested for cell-division control.
(A) Cartoon of the cell cycle and definition of C, D and I periods. The C period is the time between initiation and termination of chromosome replication, the D period is the time between replication termination and division, and the I period is the time between subsequent initiations. (B) Models of cell-division control based on a single limiting process. According to the first set of models cell division is controlled by DNA replication and subsequent segregation (Witz et al., 2019; Ho and Amir, 2015; Sompayrac and Maaloe, 1973). According to the second set of models, cell division is controlled by a chromosome-independent inter-division process between birth and division (Si et al., 2017; Si et al., 2019; Harris and Theriot, 2016; Harris and Theriot, 2018). (C) Scheme of the concurrent-processes model. According to this model, the time of cell division is set by the slowest of two process, an inter-division process and chromosome replication/segregation. When both processes are completed, the cell can go through division (analogous to an AND gate).
Figure 2 with 6 supplements
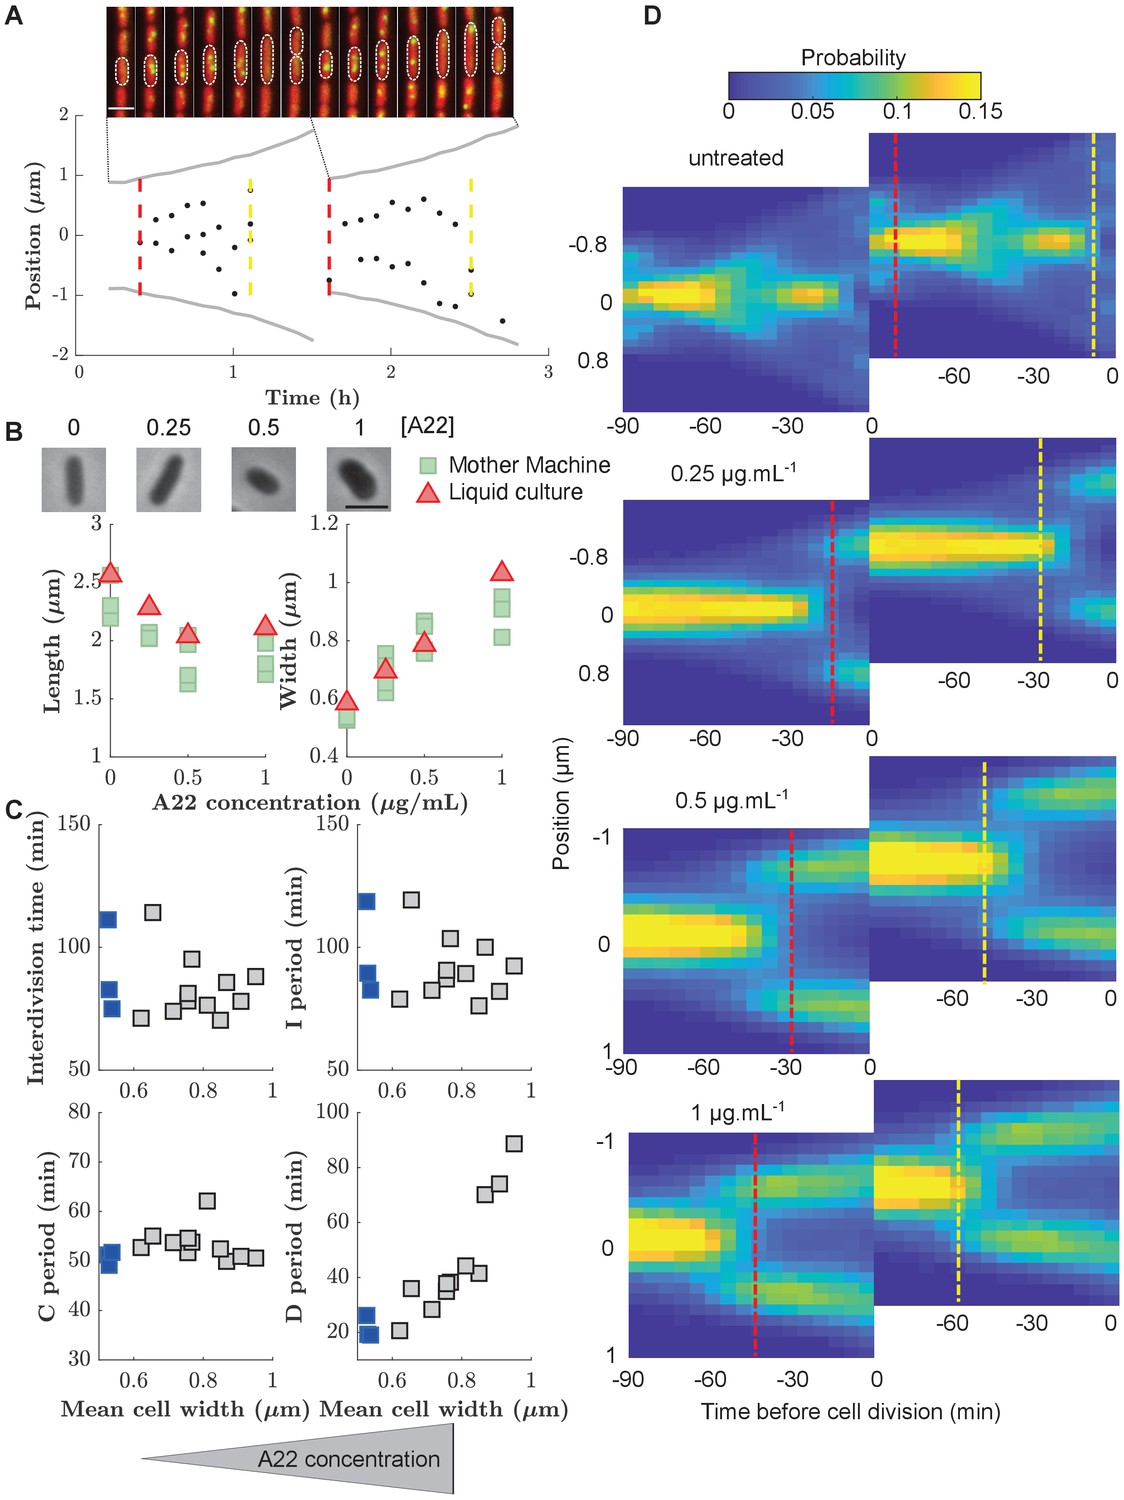
Increasing cell width through A22 increases the D period.
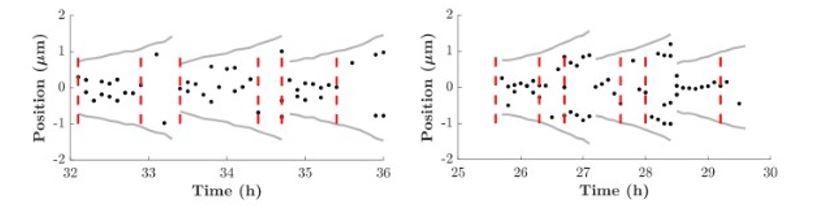
(A) Top: Snapshots of a single mother-machine channel. Interval between images is 12 min. Red: cytoplasmic mCherry, yellow: YPet-DnaN. The contours show a cell growing for two consecutive cell cycles. Bottom: Cell length (gray line), the position of YPet-DnaN foci along the long axis of the cell (black dots), initiation and termination times (red and yellow dashed lines, respectively) in the same cells shown in A. Scale bar: 2 μm. (B) Top: Snapshots of E. coli S233 (NCM3722, λ::P-mcherry, dnaN::Ypet-dnaN) treated with sublethal amounts of A22 (concentrations in μg.mL-1). Scale bar: 2 μm. Bottom: Effect of A22 treatment on average dimensions of cells grown in liquid or in mother machine for at least 6 hr of exponential growth. For cell-to-cell variations see Figure (C) Duration of inter-division time, I, C, and D periods as a function of average cell width measured in mother machines. Blue and gray squares represent unperturbed conditions and A22-treatment, respectively. Each symbol represents an independent biological replicate. (D) Conditional probability density of the occurrence of YPet-DnaN foci as a function of cell length (y-axis) for different time points before subsequent cell division (x-axis) for different A22 concentrations as indicated on top of the maps. Maps are duplicated for better visualization of the replication process. Vertical lines indicate the beginning and end of the probability peaks that correspond to replication initiation and termination, respectively. Note that these times do not strictly agree with average replication/termination times.
-
Figure 2—source data 1
Data used to generate Figure 2 and its supplements.
- https://cdn.elifesciences.org/articles/67495/elife-67495-fig2-data1-v2.xls
Figure 2—figure supplement 1
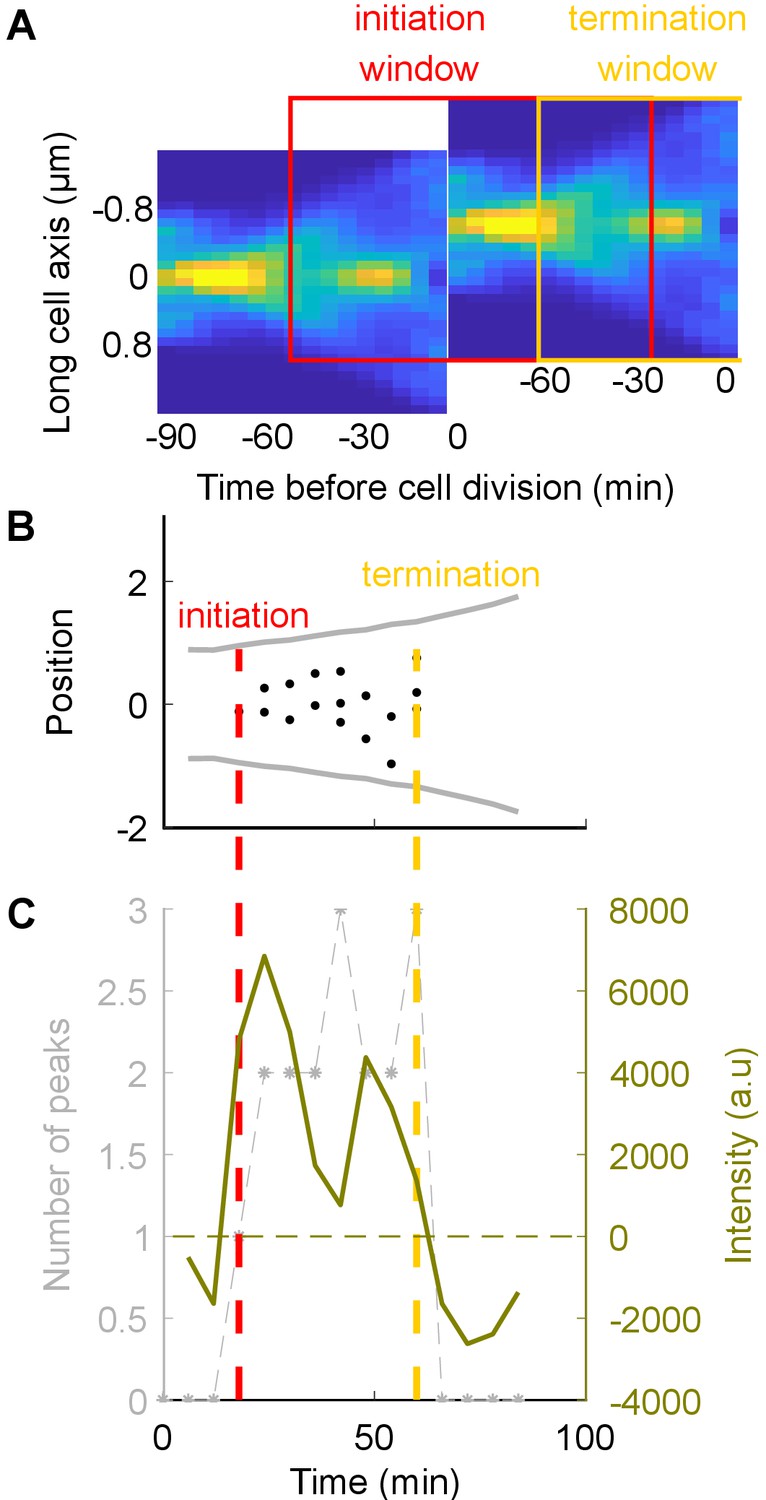
Detection of DNA replication in a single cell using the YPet-DnaN fusion.
(A) Conditional probability density of the occurrence of YPet-DnaN foci as a function of cell length (-axis) as a function of time before subsequent cell division (-axis) for untreated cells. Red and yellow squares represent the windows in which we are looking for initiation and termination respectively. (B, C) The DNA replication cycle can be detected based on the number of spots detected inside the cell, or, as chosen for this paper, based on the intensity distribution of the YPet-DnaN signal (see Materials and methods for details).
Figure 2—figure supplement 2
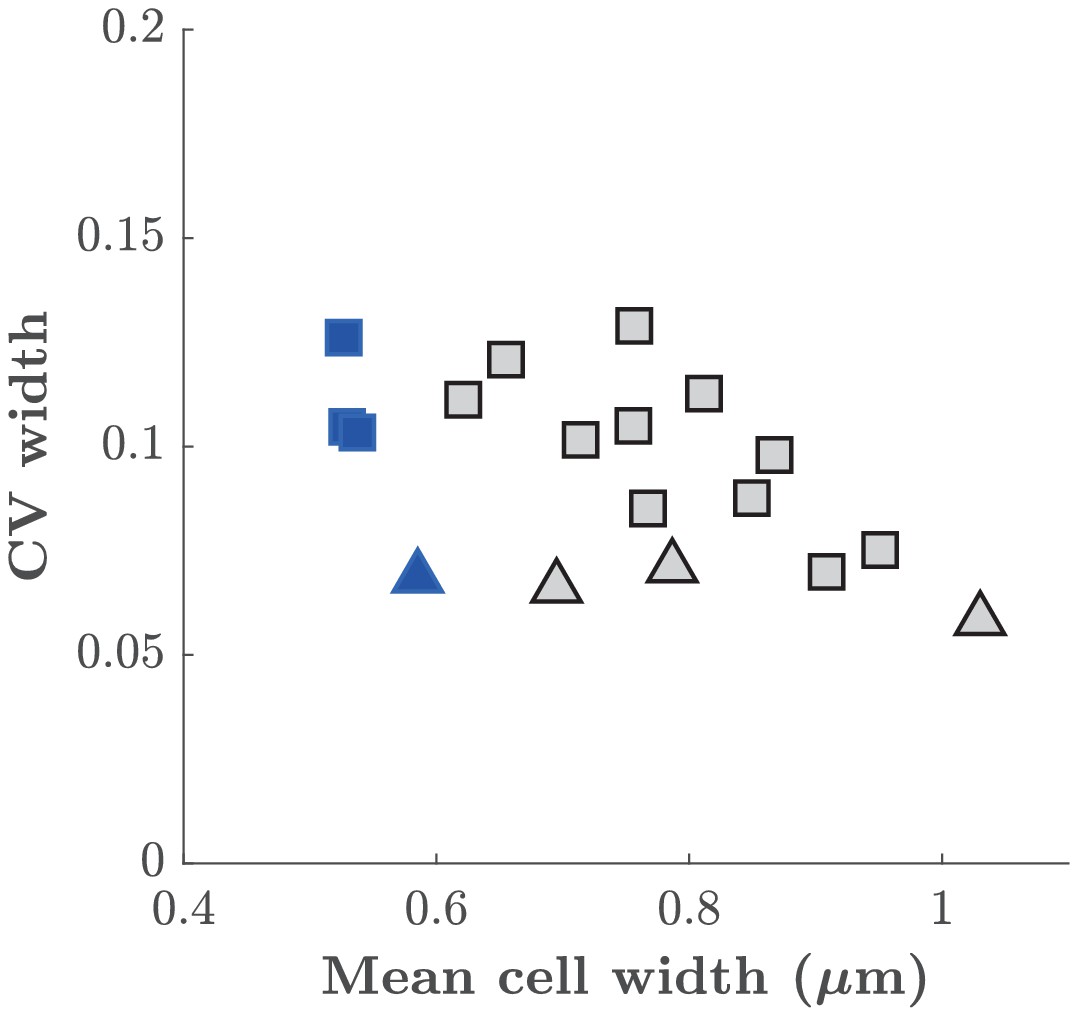
Cell-to-cell variation of cell width.
Coefficient of variation of cell width as a function of mean cell with obtained at different A22 concentrations. Squares and triangles represent measurements performed on cells grown in mother machine or in liquid culture, respectively. Blue color represent wild-type cells. Gray color represent cells treated with different A22 concentrations.
Figure 2—figure supplement 3
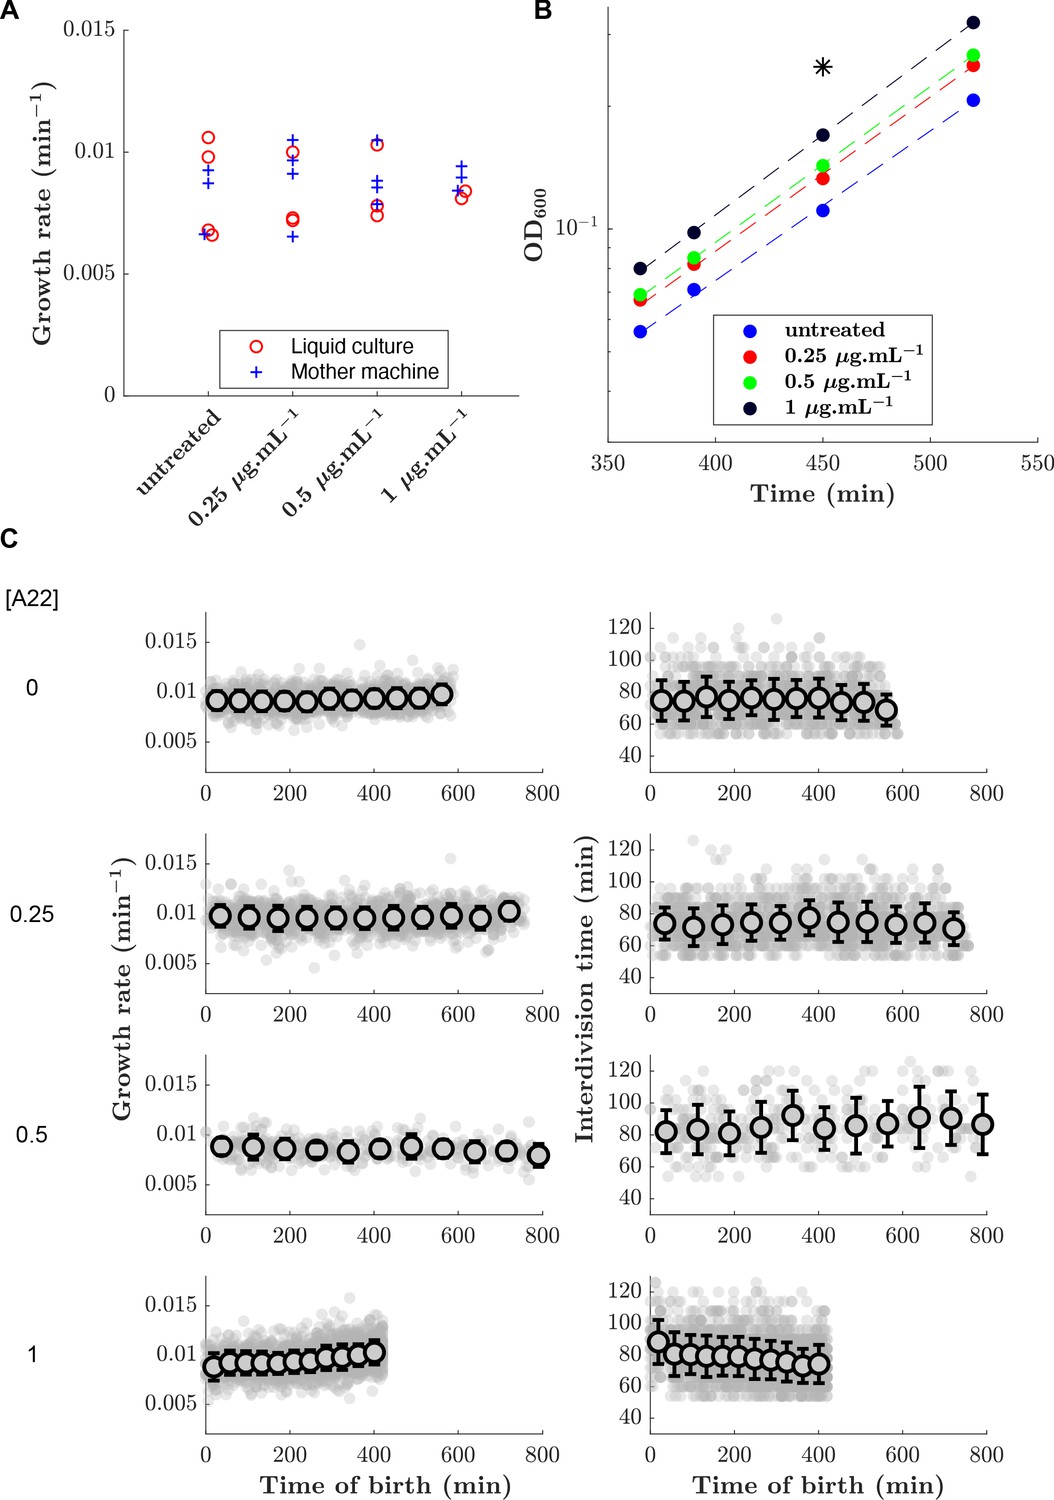
Growth rate and doubling time are maintained over time and upon A22 treatment.
(A) Effect of A22 treatment on growth rate measured in liquid culture and in mother machine. (B) Example of growth curves obtained in liquid culture. The star indicates the time at which the snapshots (Figure 2A) were taken. Dashed lines represent exponential fits. (C) Growth rate (left column) and doubling time (right column) remains approximately constant over time in the mother-machine experiments upon treatment with different A22 concentrations (with variations during the observation window).
Figure 2—figure supplement 4
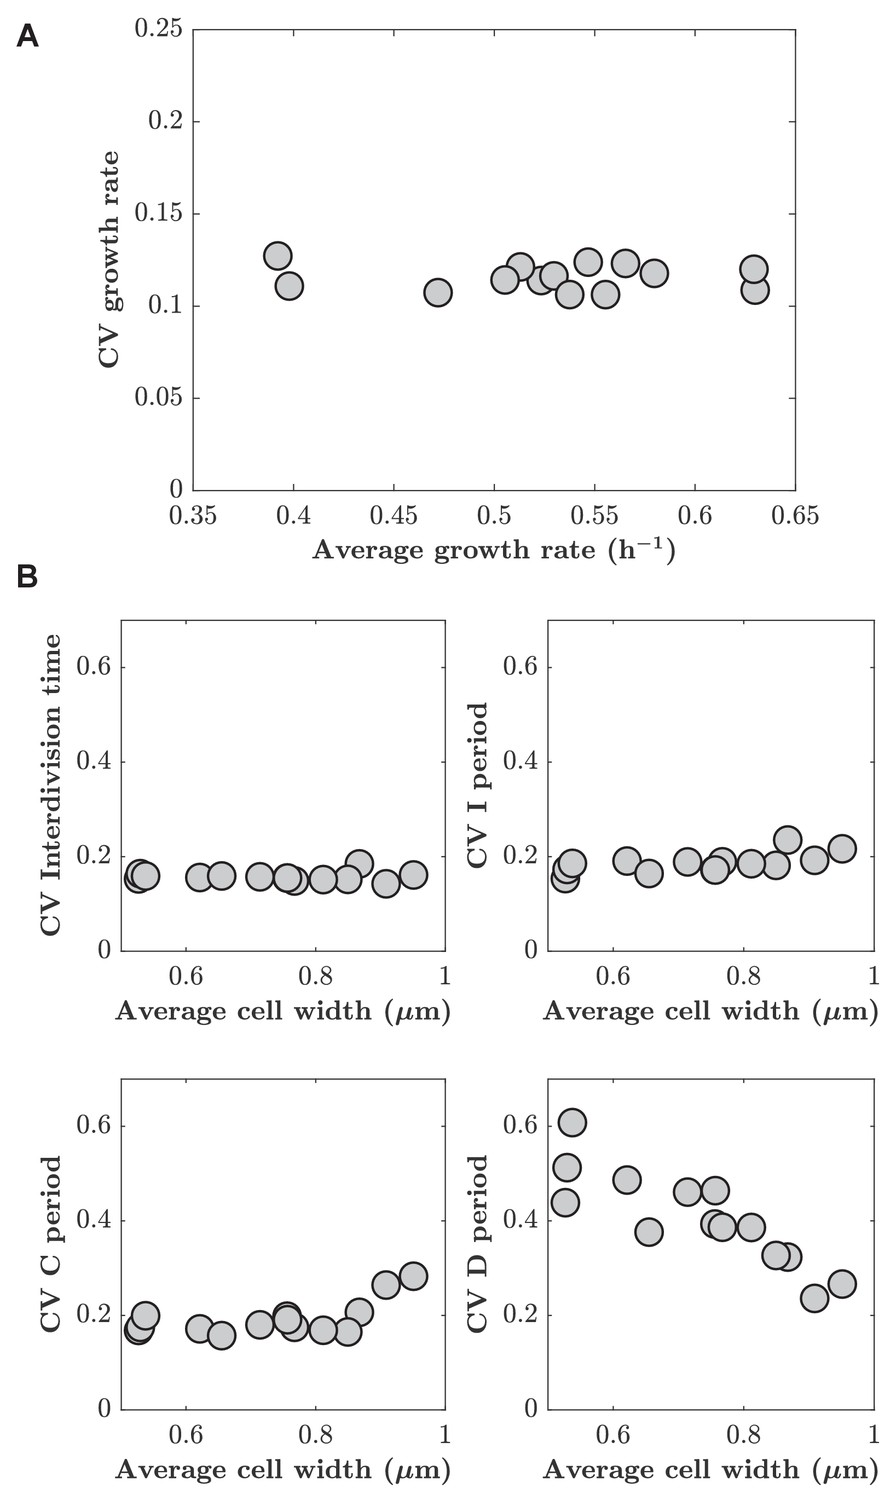
Cell-to-cell variations of different cell-cycle periods are independent of A22 treatment.
(A) Coefficient of variation of growth rate as a function of average growth rate. (B) Cell-to-cell variations (coefficient of variation) of inter-division time, I, C, and D period do not increase with increasing average cell width. Each point represents one biological replicate generated in mother machine.
Figure 2—figure supplement 5
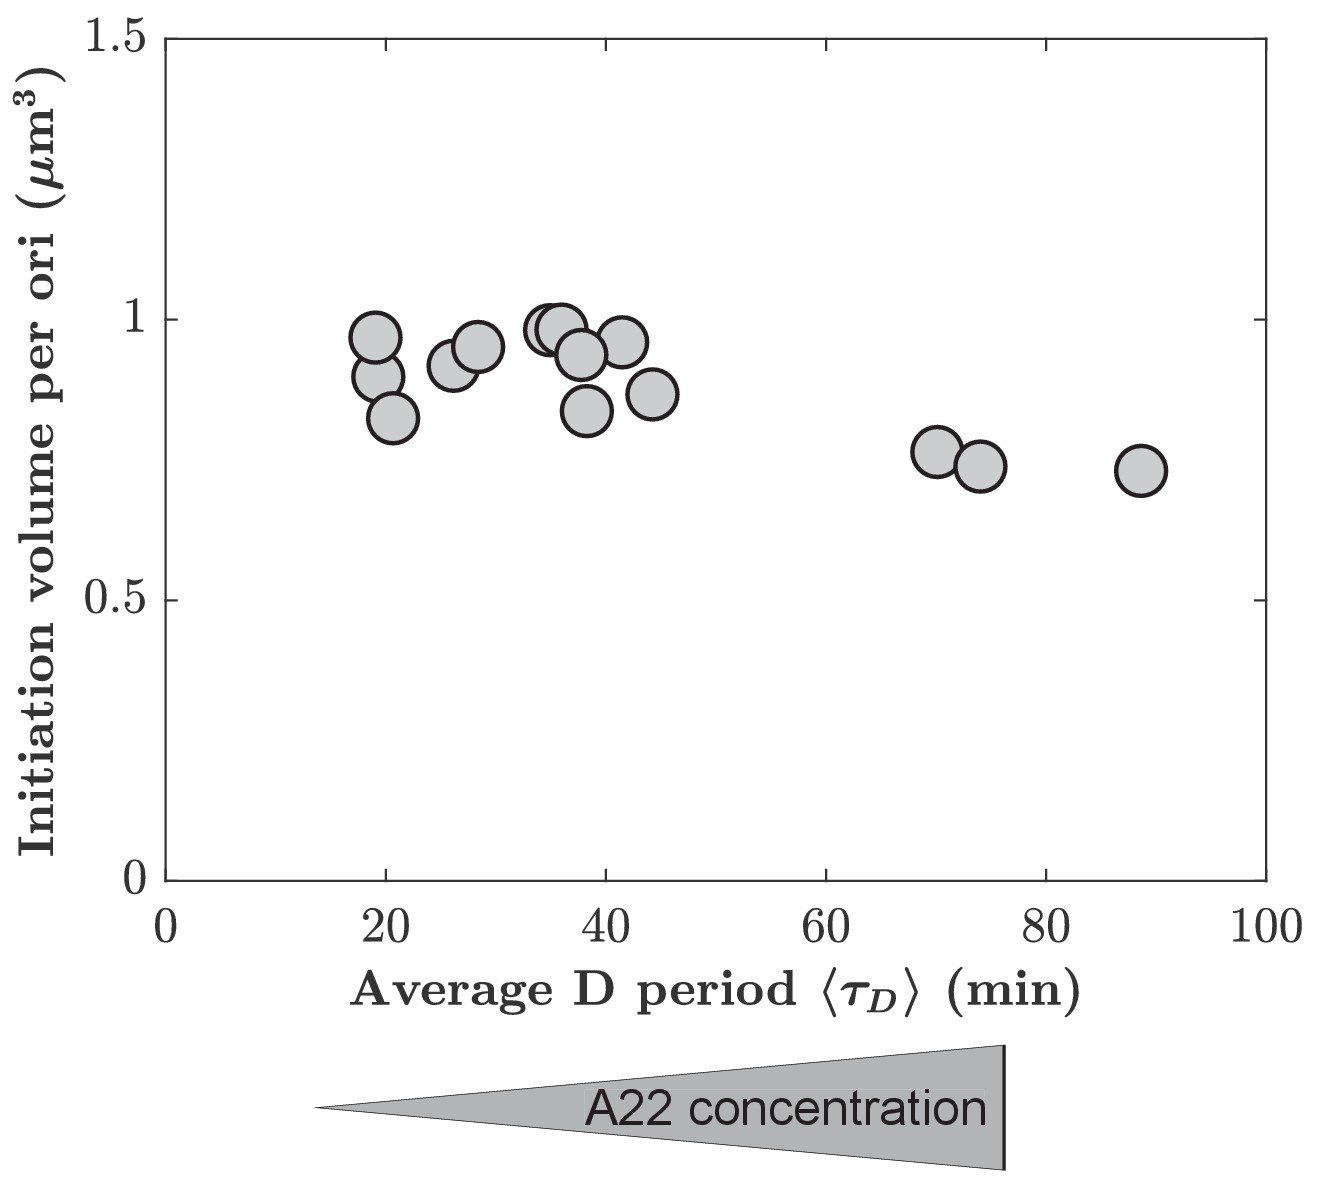
Mean initiation volume per ori as a function of average D period.
Mean initiation volume is computed from individual lengths and mean width at the time of replication initiation, assuming spherocylindrical cells.
Figure 2—video 1
Movie of cells grown in mother machine devices for different treatments with A22.
Red: cytoplasmic-mCherry. Green: YPet-DnaN. 1 image every 6 min. Scale bar is 5 μm.
Figure 3 with 3 supplements
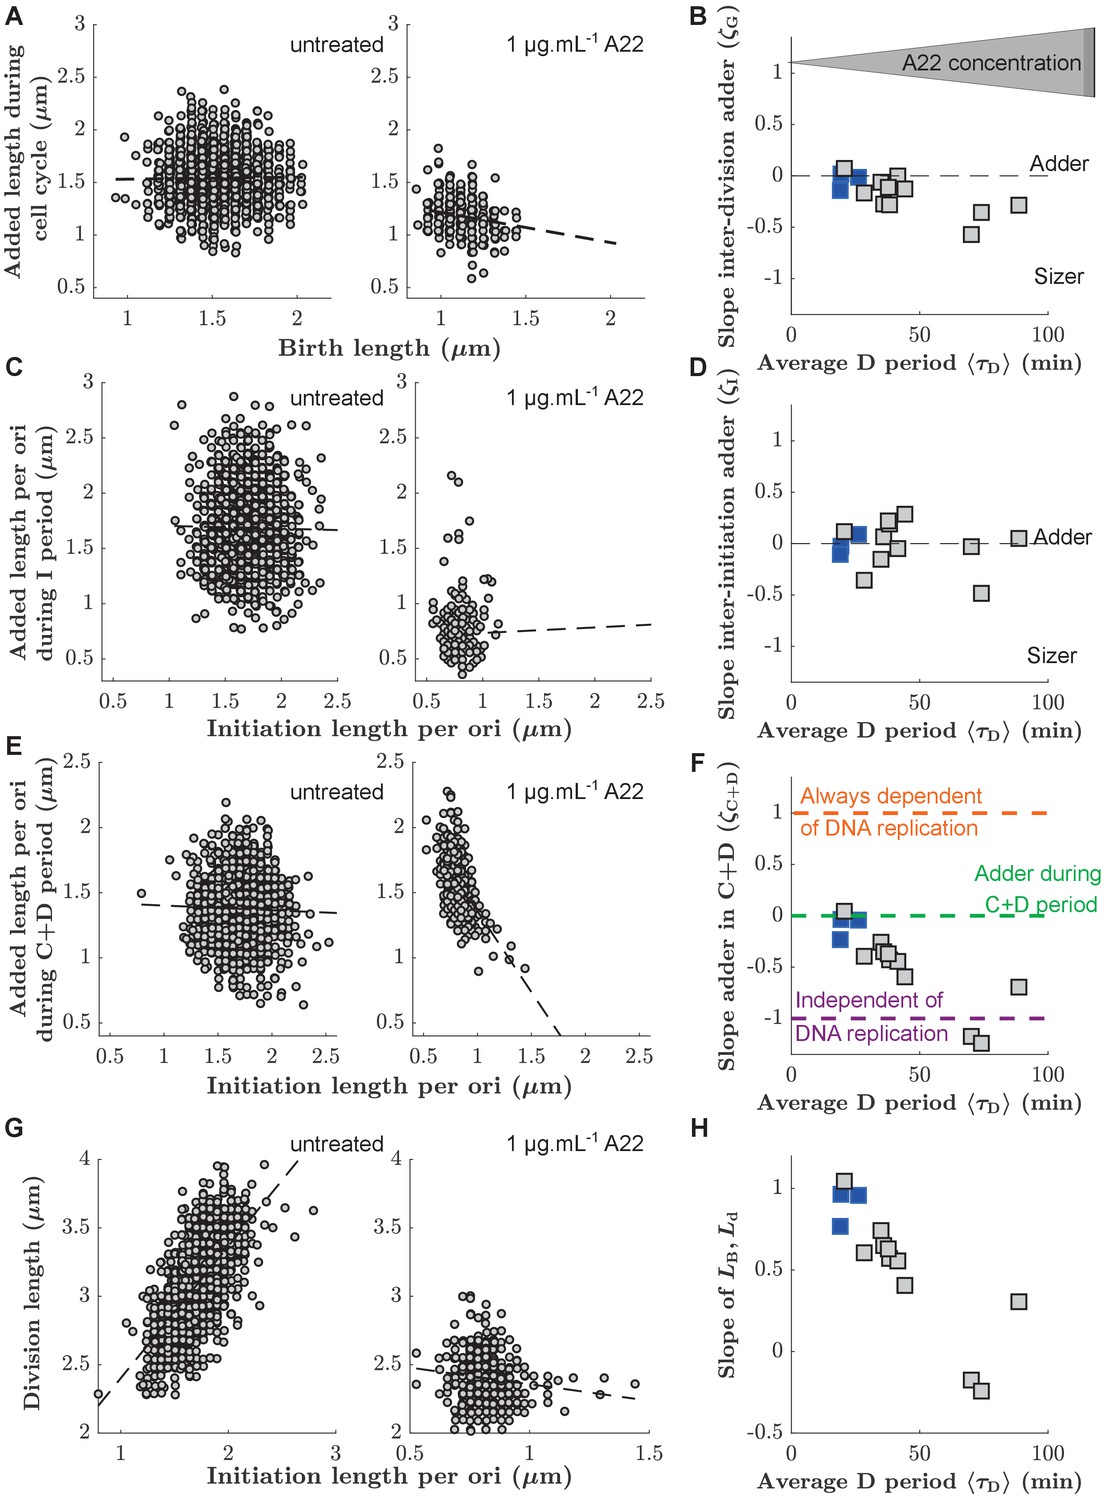
Single-cell correlations between division and DNA replication events.
(A,C,E) Added size between birth and division (A), between subsequent events of replication initiation (C), and during the C+D period (E), for untreated cells (left) and cells treated with 1 μg.mL-1 A22 (right). Points represent single cells. Dashed lines represent robust linear fits. All lengths are indicated in units of μm. (B,D,F) Slopes of the added sizes corresponding to A, C, E, respectively, as a function of the D period as obtained through sub-lethal A22 treatment (0–1 μg.mL-1). A slope of 0 represents adder behavior, while a slope of -1 represents independence on the size at the beginning of the sub-period (sizer behavior). Blue and gray squares represent unperturbed conditions and A22-treatment, respectively. Each symbol represents an independent biological replicate. (G,H) Division size as a function of initiation size per ori (G) and corresponding slopes (H) in analogy to panels A, B, respectively. The decreasing slope in H demonstrates decreasing dependency of division on DNA replication.
-
Figure 3—source data 1
Data used to generate Figure 3 and its supplements.
- https://cdn.elifesciences.org/articles/67495/elife-67495-fig3-data1-v2.xls
Figure 3—figure supplement 1
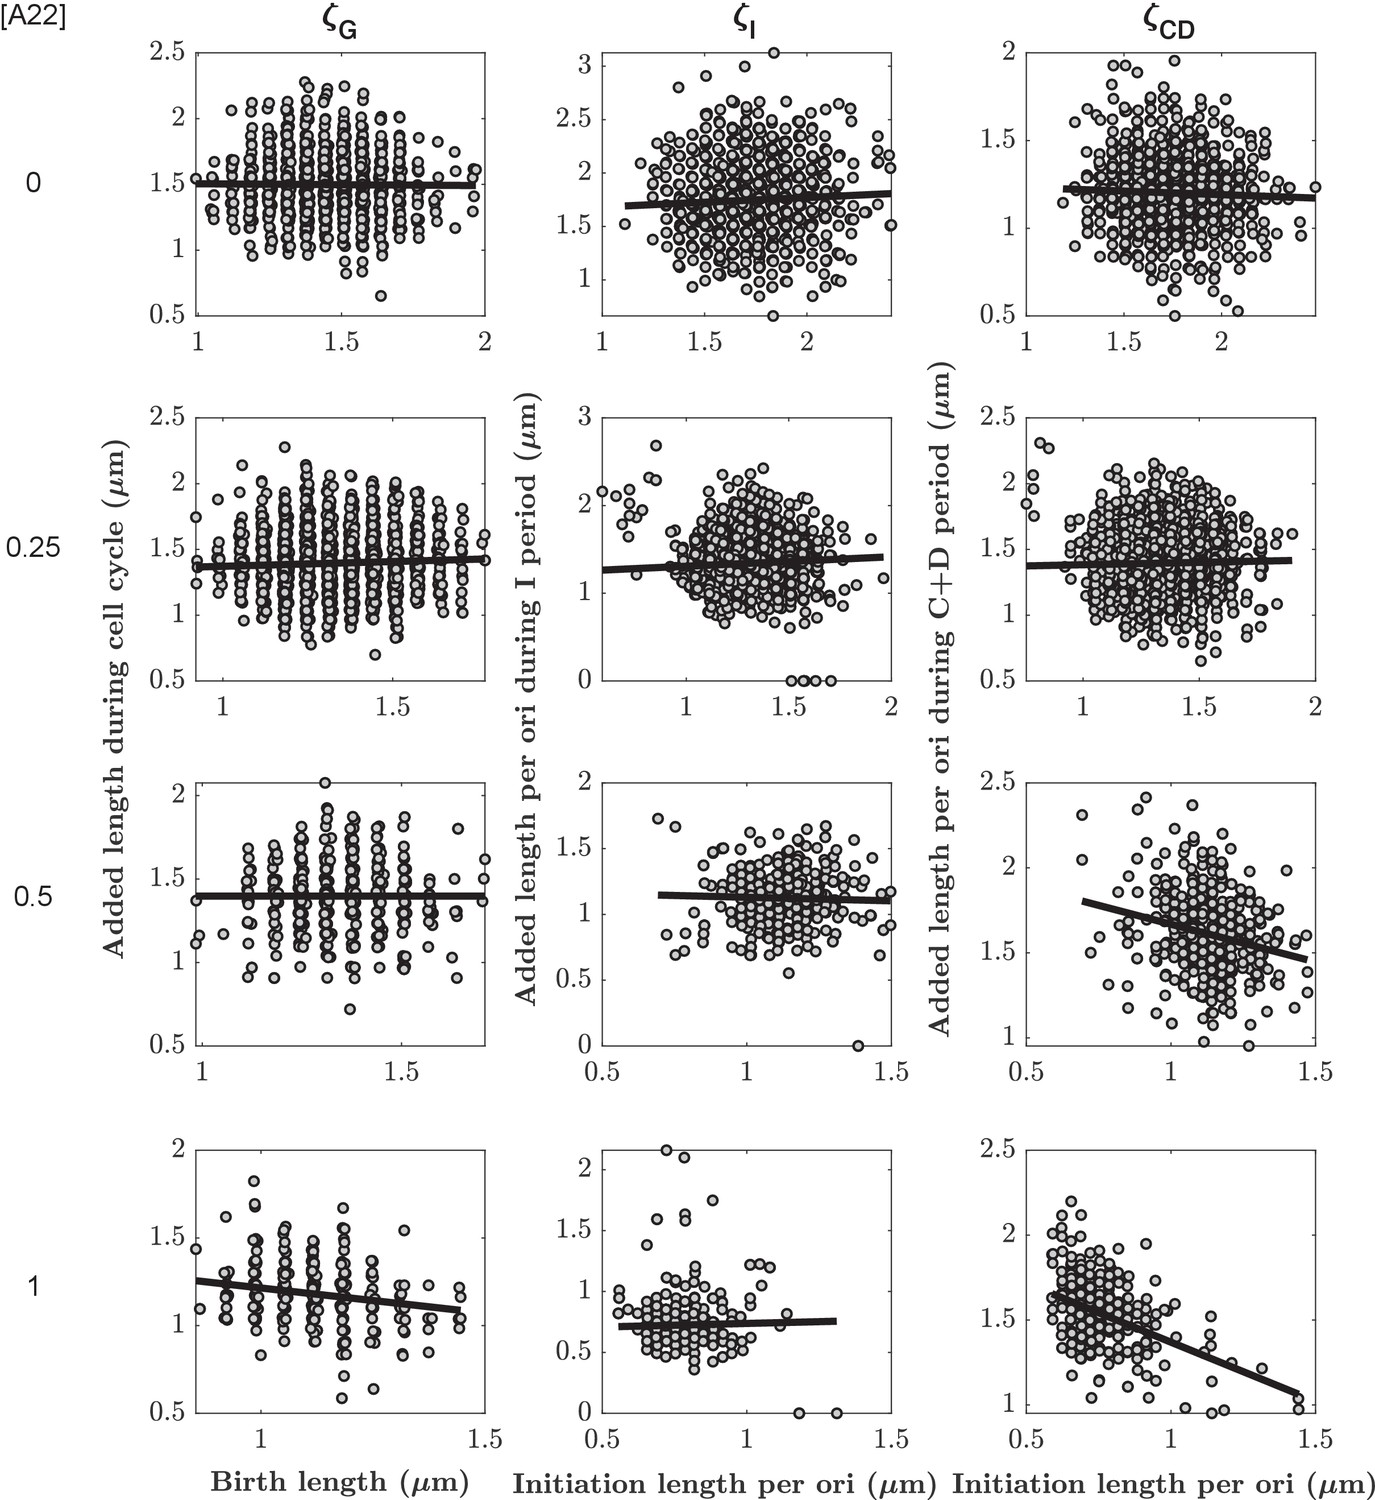
Added lengths during different subperiods as a function of the size at the beginning of the respective subperiod for different A22 concentrations.
The slopes , , and for different A22 concentrations are obtained from robust fits (black lines). Each cloud represents one of three biological replicates.
Figure 3—figure supplement 2
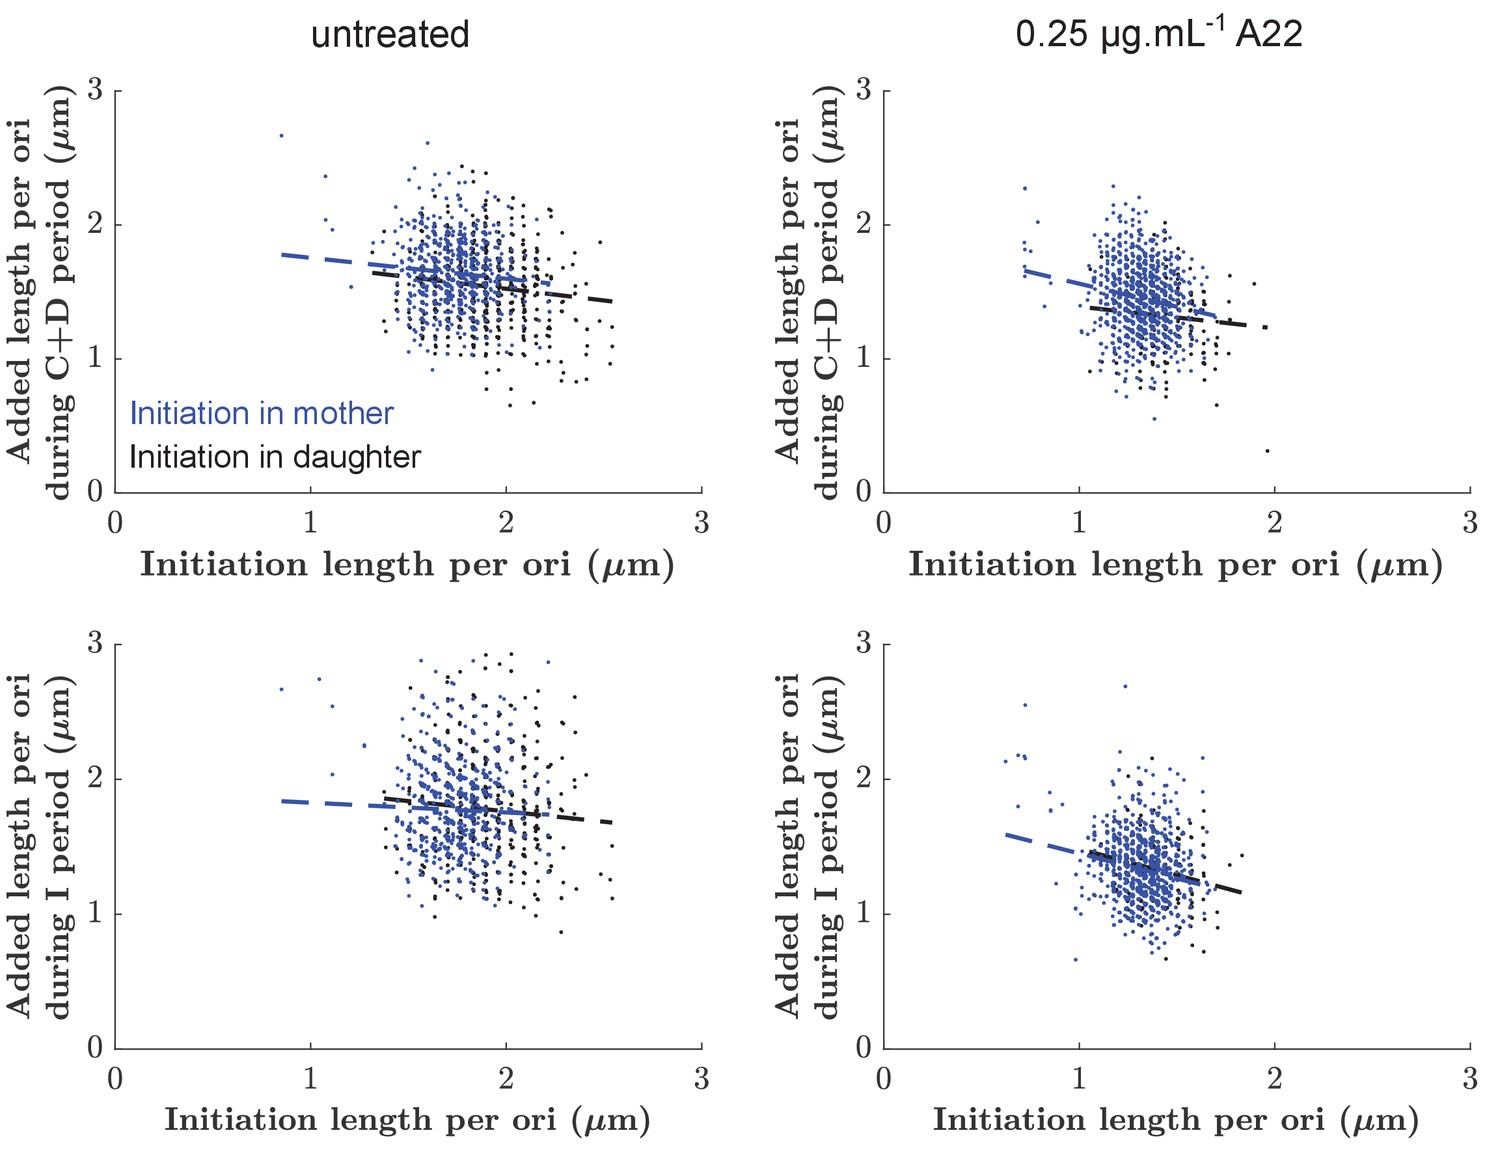
Added lengths during C+D period (top) or I period (bottom) as a function of the size at initiation for untreated cells (left) and cells treated with 0.25 µg/ml A22 (right).
Points are color-coded according to whether initiation happened in the mother (blue) or in the mother (black), respectively. Dashed lines represent the slopes of each cloud according to linear regression.
Figure 3—figure supplement 3
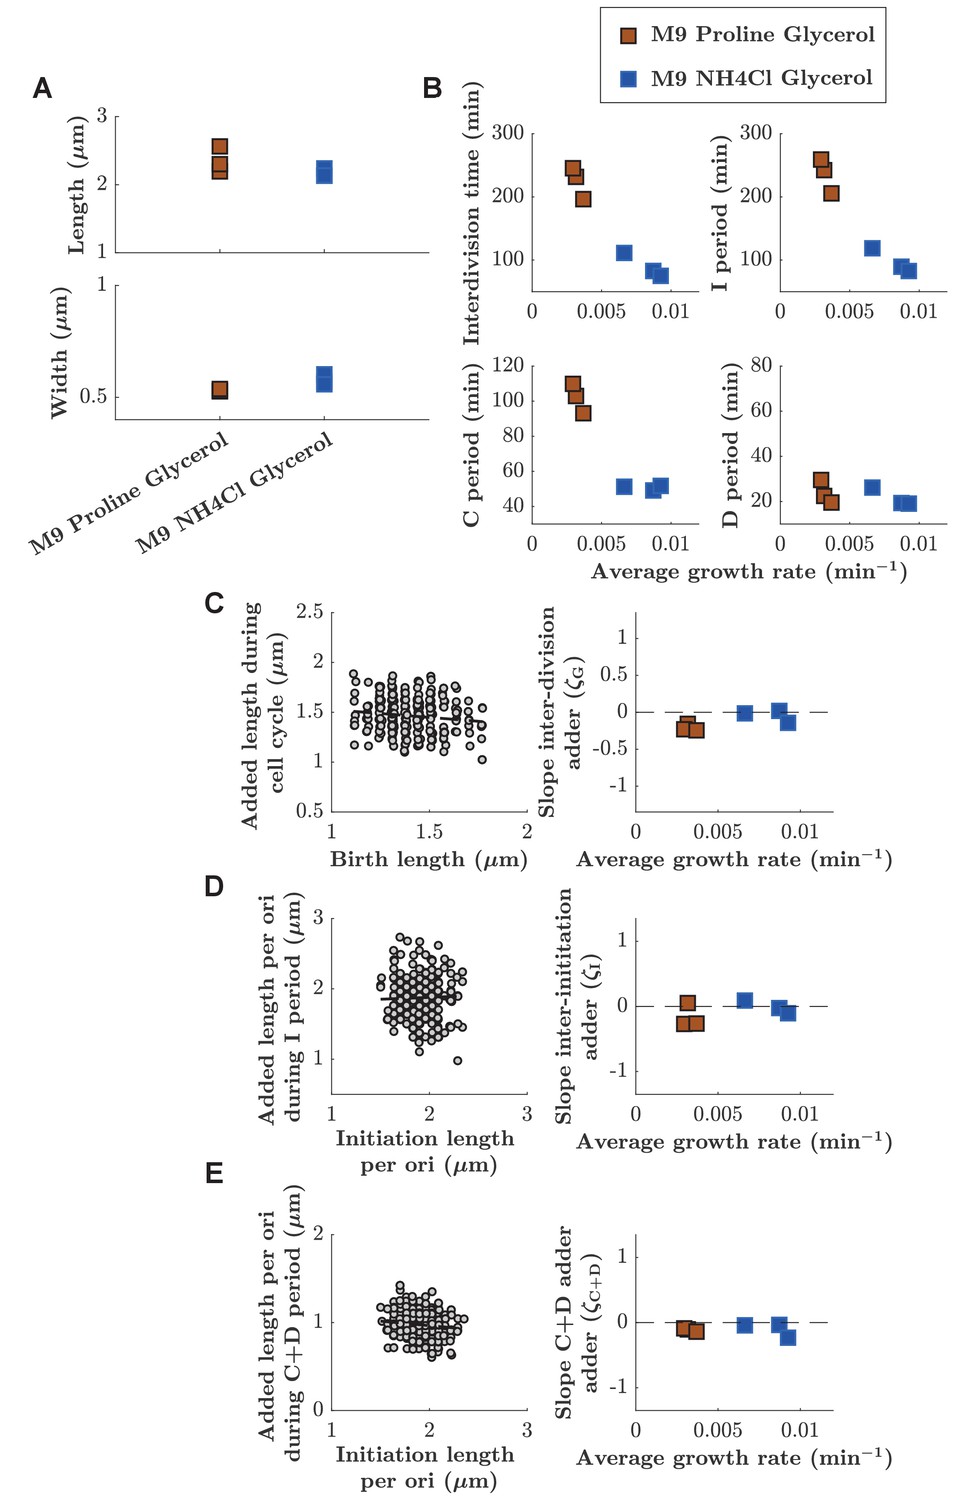
Adder behaviors for cell cycle, I period, and C+D period are robustly maintained at two different growth rates.
(A) Lengths and widths obtained for cells grown in two different growth media: M9 Glycerol NH4Cl (blue squares) or M9 Glycerol Proline (red squares). Symbols represent independent biological replicates. (B) Duration of inter-division time, I period, C period, and D period as a function of average growth rate measured in mother machines. (C, D, E) Left: Example of division, inter-initiation and C+D adder plots for cells grown at slower growth rate (M9 Proline Gycerol). Right: Slope of division, inter-initiation and C+D adder as a function of average growth rate for cells grown in the two different growth media (M9 Proline Glycerol and M9 NH4Cl Glycerol).
Figure 4 with 5 supplements
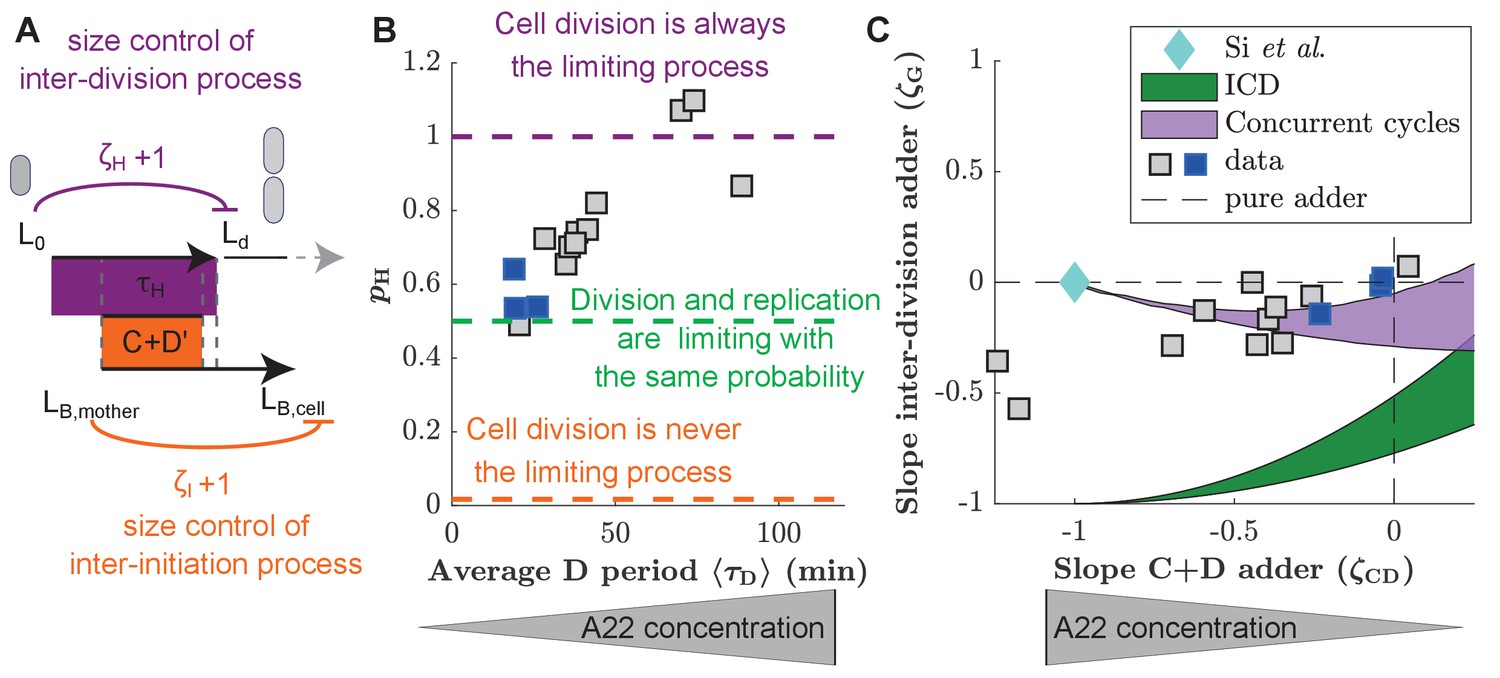
Experimental validation of the concurrent cycles model.
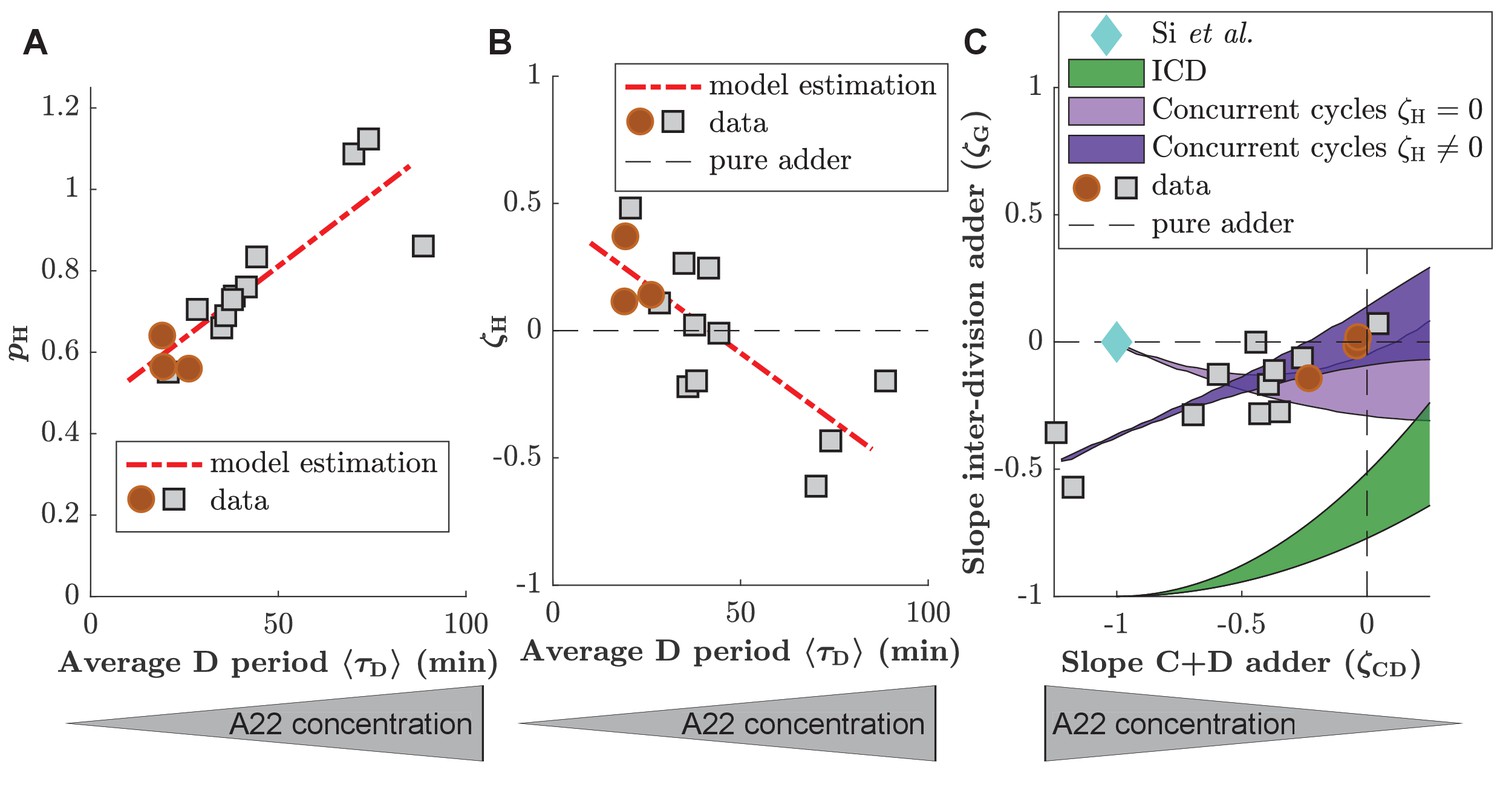
(A) Cartoon: Two independent inter-division and timer-like replication/segregation must be completed before division occurs. The inter-division process is assumed to exhibit adder-like behavior with control parameter , while the replication/segregation is a timer (see Materials and methods for details on the estimation). The adder-like inter-initiation processes with control parameter determines size at initiation. (B) Model-fitting to experimental data reveals the probability of the inter-division process to control cell division as a function of increasing D period (with increasing A22 concentration), assuming constant control parameters and . (C) Slopes of adder plots as a function . Blue diamond: prediction in Si et al., 2019. Dotted lines: Prediction of pure adder models. Green: Prediction from a general class of single-process chromosome-limited models ('ICD' models, see Supplementary Notes) (Micali et al., 2018b), where cells divide after completion of the replication/segregation process with variable . Purple: Prediction of the concurrent cycles model. Shaded areas represent the ranges of predictions using the maximum and minimum experimentally measured input parameters (ratio of variance of size at initiation over size at birth; ratio of mean size at division over size at birth). (B, C) Blue and gray squares represent unperturbed conditions and A22-treatment, respectively. Each symbol represents an independent biological replicate.
-
Figure 4—source data 1
Data used to generate Figure 4 and its supplements.
- https://cdn.elifesciences.org/articles/67495/elife-67495-fig4-data1-v2.xls
Figure 4—figure supplement 1
Predictions of the concurrent cycles model if is left as a free parameter.
(A, B) Probability for the cell division process to be limiting () (A) and strength of the inter-division control parameter () (B) for experimental data generated in this study (red circles and grey squares for untreated cells and cells treated with A22). Both and are allowed to vary and the values are estimated solving Equation (S20) for and . The linear fit for the different results is shown as red dashed line. (C) (division adder slope) as a function of (C+D adder slope) for data generated in this study (gray circles). Prediction of the replication-independent model by Si et al., 2019 (blue diamond), and of ICD model (green area). Two predictions of the concurrent cycles model are also plotted: light purple: prediction of concurrent cycles model assuming (see Figure 4). Dark purple: prediction of concurrent cycles model leaving as a free parameter of the fit (see (A,B)). The shaded areas represent the range of predictions using the maximum and minimum of experimentally measured ratio of variance of size at initiation over size at birth (both for ICD and concurrent cycles) and of the experimentally measured ratio of mean size at division over size at birth (concurrent cycles). The maximum and minimum values are taken over the experimental data reported in this picture, that is treated and untreated data acquired for this work.
Figure 4—figure supplement 2
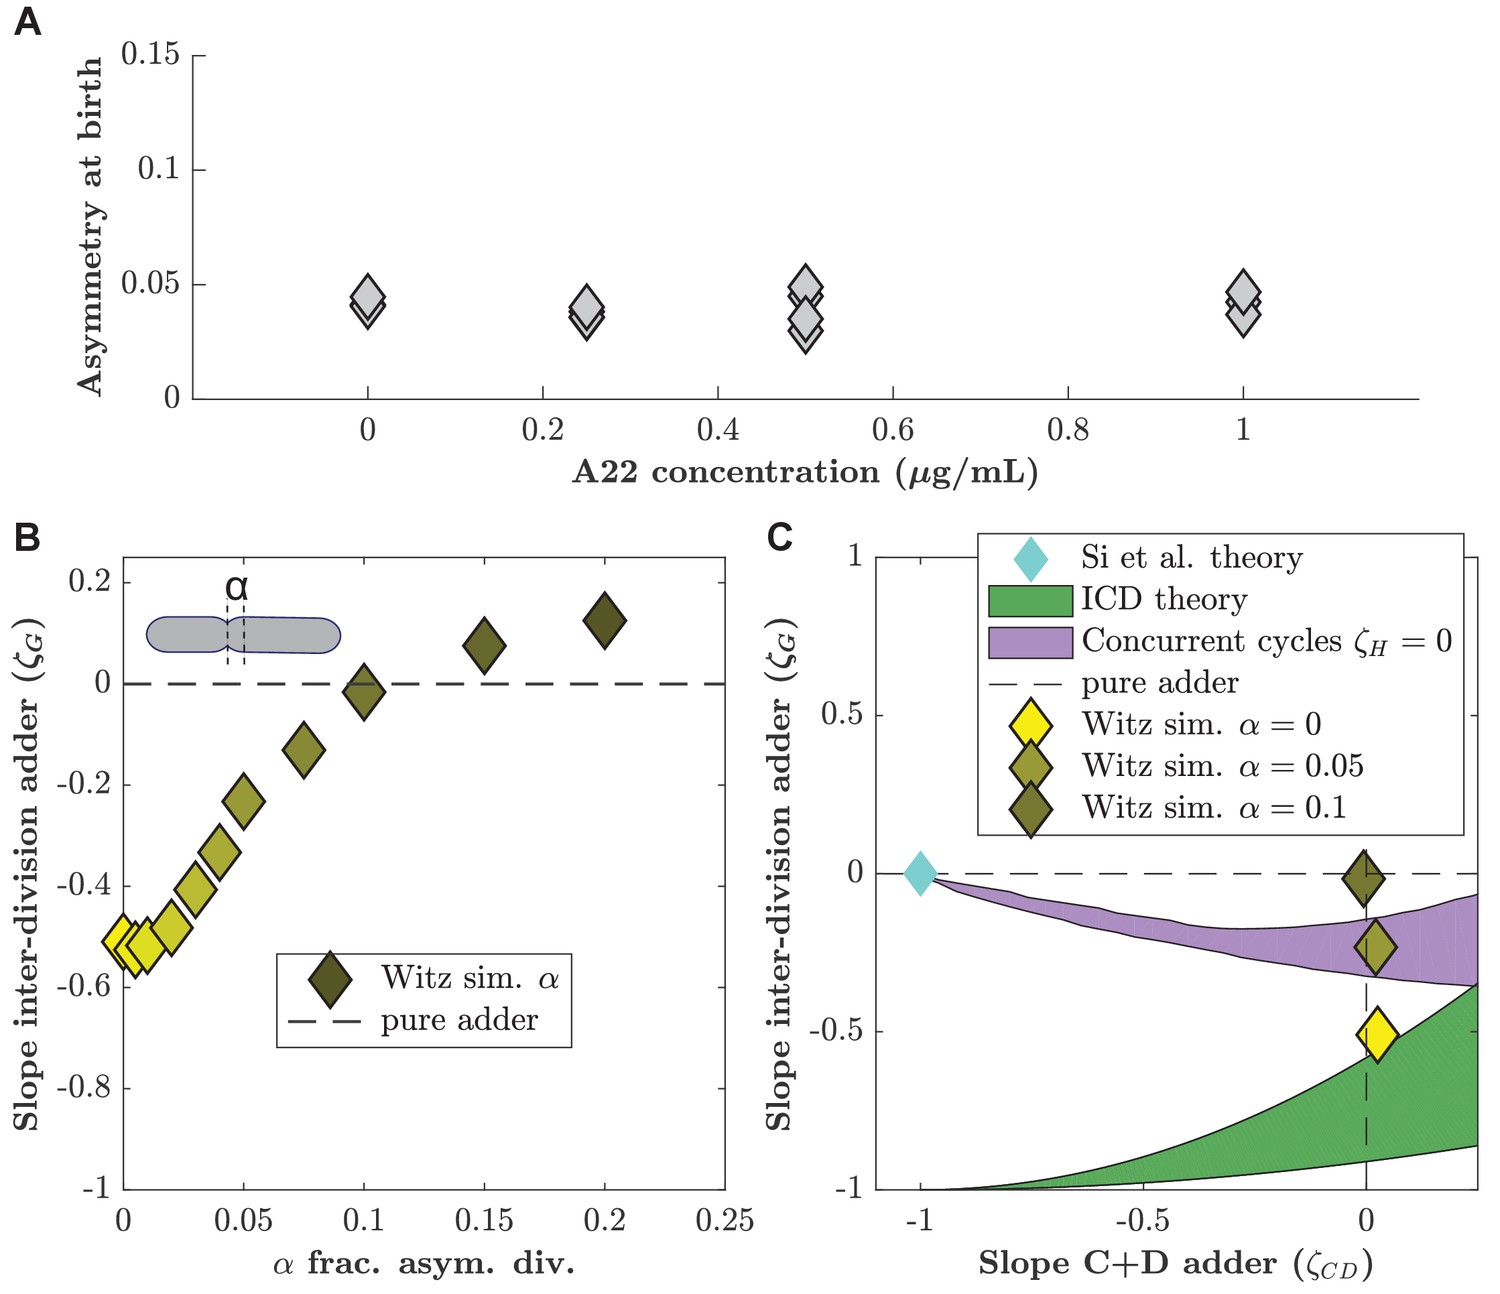
Asymmetric division drives C+D to adder behavior in ICD single-process models.
Witz and coworkers (Witz et al., 2019) proposed an ICD model (see methods) with an adder between consecutive initiations () and in the C+D period (), and asymmetric division, which we tested with our data. (A) The level of asymmetry at birth from our data is about 5%. The asymmetry is computed as (where cell 1 and cell 2 are two daughter cells) and averaged for each dataset. (B) Simulations of the Witz et al. 'double adder' ICD model as a function of the asymmetry in division (α). (Parameter set as in untreated conditions: , , , , , ). For increasing asymmetry, the model recapitulates the near-adder behavior between divisions (). (C) (division adder slope) as a function of the C+D adder slope for simulations at (bright yellow diamond), (bright yellow), and (dark yellow diamond). In our own experimental study find the division asymmetry to be about 5% (), consistent with previous reports . Blue diamond: prediction from the Si et al. model. Green shaded area: Prediction of the ICD model with no asymmetry in division. Purple shaded area: Prediction of the concurrent cycles model with the hypothesis that . The shaded areas represent the range of predictions using the maximum and minimum experimentally measured ratio of variance of size at initiation over size at birth (both for ICD and concurrent cycles models) and the experimentally measured ratio of mean size at division over size at birth (for the concurrent cycles model). The maximum and minimum values are taken over the untreated conditions acquired for this work as well as the published data from Si et al., 2019 and Witz et al., 2019.
Figure 4—figure supplement 3
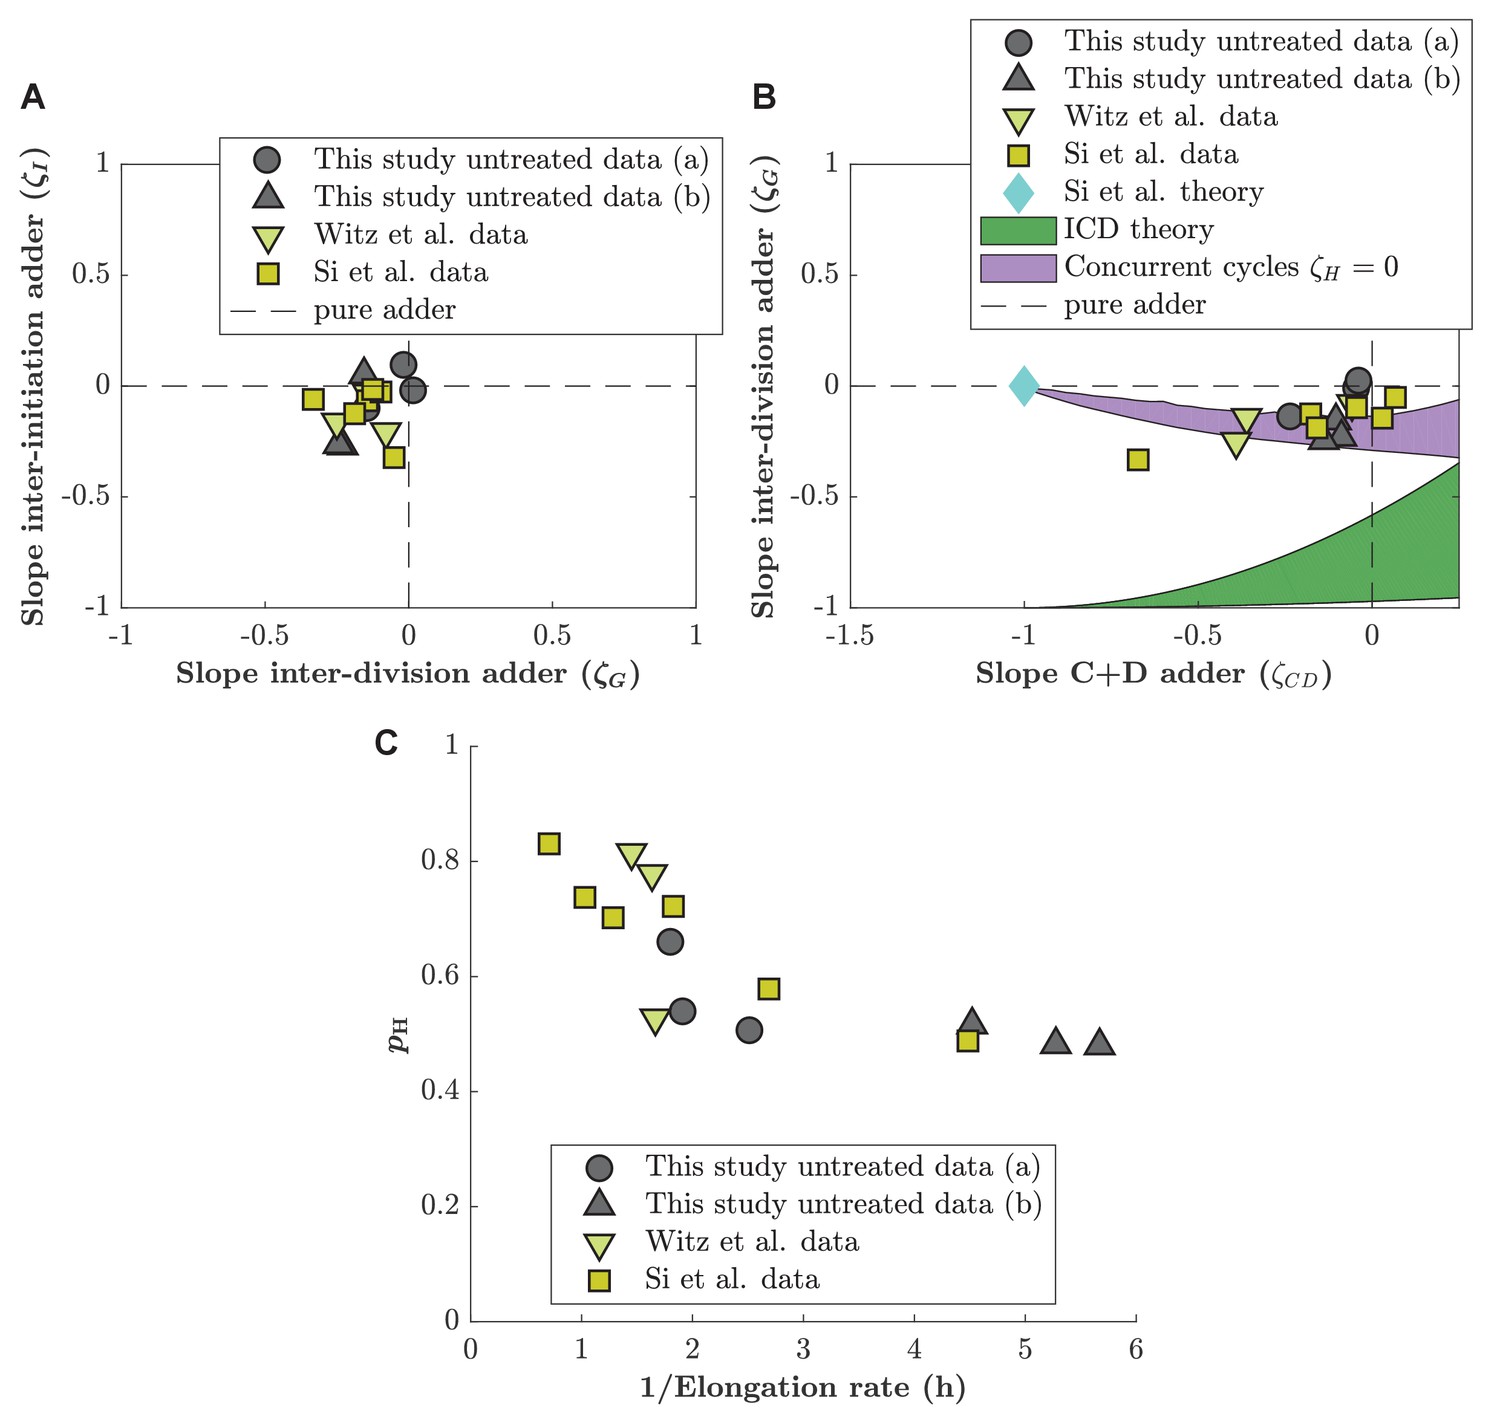
Comparison of adder slopes for data of unperturbed cells generated by different labs.
(A) Inter-division adder slope () plotted as a function of inter-initiation slope (). Gray circles: data generated in M9(NH4Cl) Glycerol medium. Gray triangles: data generated in M9(Proline) Glycerol medium (slow growth rate). Green triangle: data generated by Witz et al., 2019. Yellow square: data generated by Si et al., 2019. (B) Division adder slope () as a function of the C+D adder slope (). Same symbols as in (A) correspond to the same data. Additionally, we also display predictions from different models as in Figure 4—figure supplement 2. (C) Estimation of as a function of doubling time for data generated in this study, Witz et al., 2019 and Si et al., 2019.
Figure 4—figure supplement 4
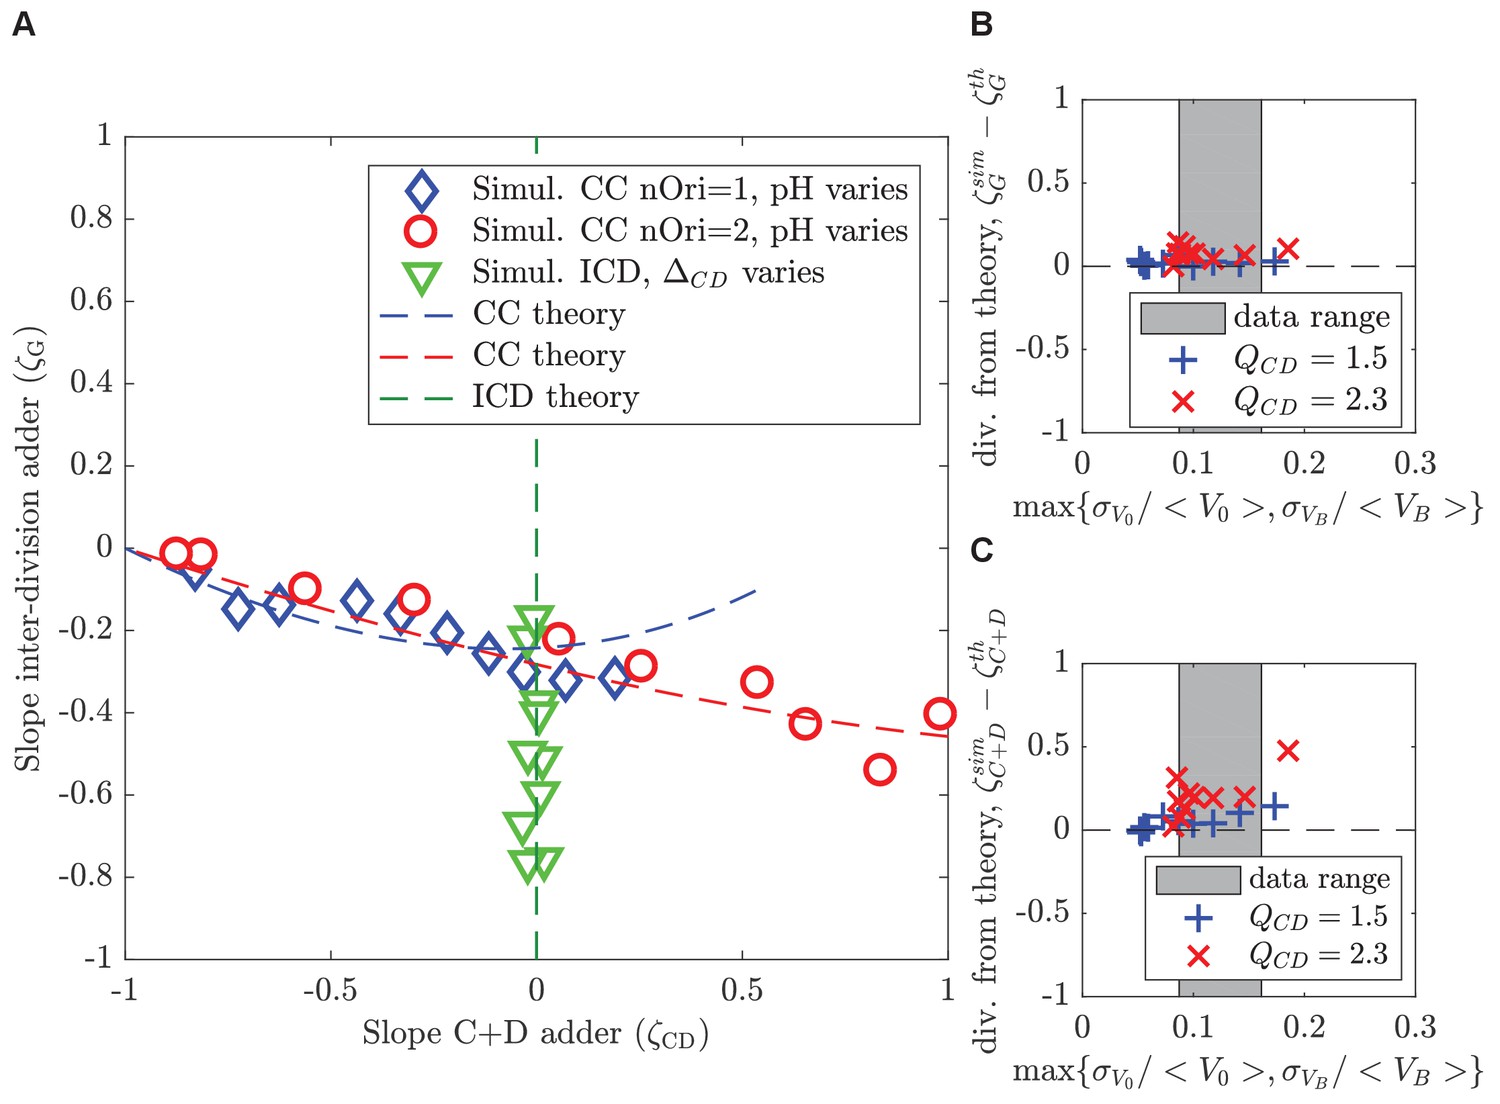
Theoretical predictions in the small-noise approximations agree with simulations at realistic noise levels.
(A) The plot shows the slope of the inter-division adder plot as a function of the slope of the adder plot in the period for both the concurrent cycles model (blue and red) and for the ICD model (green), respectively. Theoretical predictions in the small-noise approximation (dashed lines) agree with simulations (symbols). For concurrent cycles, simulation parameters are chosen to maintain noise levels comparable to untreated experimental conditions and to remain on average in the regime of no overlapping rounds (blue diamonds) or a single overlapping round (red circles), while varying . For ICD (green triangles), varies in conditions without overlapping rounds. The ratio ranges from 0.5 to 1.5. (B, C) The analytical predictions are robust with increasing noise levels. The plots show the difference between the analytical (small-noise) predictions and direct simulations of the size homeostasis parameter ζ (slope of the adder plot) for the inter-division cycle (B) and for the period (C) in the concurrent cycles model, as a function of the maximal relative noise level. Simulation parameters are set to explore the limits of the small noise approximation while maintaining constant and . The gray region indicates the regime of noise levels obtained from our experiments. The regime correspond to (blue + crosses), regime correspond to (red x crosses).
Figure 4—figure supplement 5
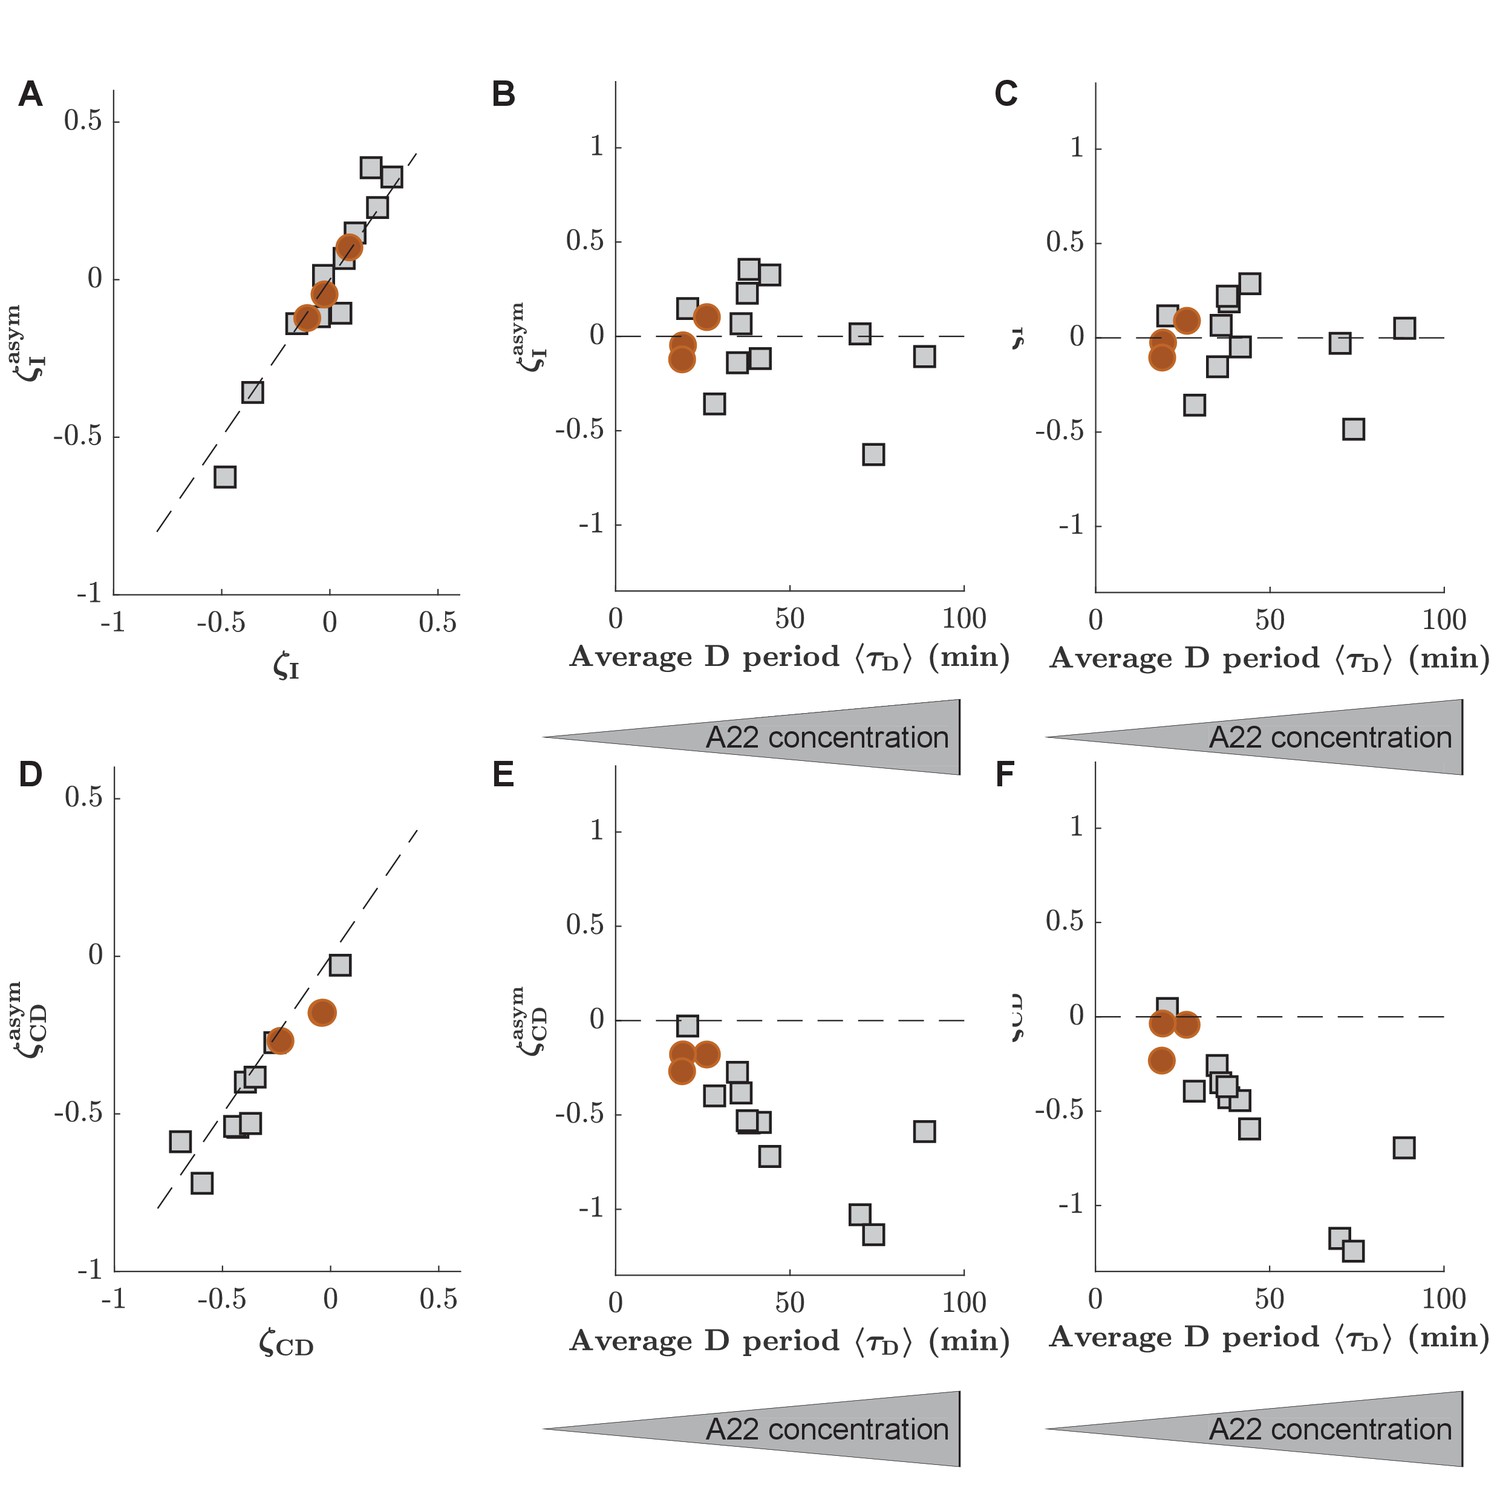
The consideration of asymmetry of cell division has no significant effect on slopes of inter-initiation adder and adder during C+D period.
(A) Comparison of inter-initation adder slope () calculated in two different ways, either by assuming symmetric cell division (-axis, obtained from , where is the number of origins at the time of replication initiation in the mother or cell), or by taking asymmetry into account (-axis, obtained through correction as indicated in Materials and methods). (B) as a function of the average D period, assuming symmetric division. C: as a function of the average D period, correcting for asymmetric division. (D-E) Comparison of the adder slopes during the C+D period generated while ignoring or considering division asymmetry. Panels are analogous to panels (A–C). Circles (red) and squares (gray) represent unperturbed conditions and A22-treatment, respectively. Each symbol represents an independent biological replicate.
Author response image 1
Tables
Key resources table
| Reagent type (species) or resource | Designation | Source or reference | Identifiers | Additional information |
|---|---|---|---|---|
| Strain, strain background (E. coli) | S233 | This work | NCM3722, λ::P127-mcherry, dnaN::Ypet-dnaN | Strain construction |
| Chemical compound, drug | A22 | Cayman Chemicals | 22816-60-0 | |
| Software, algorithm | MATLAB | The MathWorks, Inc. | ||
| Software, algorithm | Oufti | Paintdakhi et al., 2016 | ||
| Software, algorithm | Schnitzcells | Young et al., 2012 |
Additional files
-
Supplementary file 1
Characterization of different single-cell datasets.
Including Experiment Name, strain, growth medium, perturbation, Numberofcells: number of cells taken into account, Percentagekept: Percentage of cells kept after the DNA replication scoring, that is, cells in which we were able to detect initiation and termination, Growthrate, GrowthrateCV: exponential growth rate of the cell (obtained from an exponential fits on single-cell length; units: min-1) and CV (coefficient of variation), Width: Mean cell width (units: μm), BirthLength, BirthLengthCV: Mean length at birth (units: μm) and CV, InitiationLength, InitiationLengthCV: Mean initiation length per ori (units: μm) and CV, DivisionLength, DivisionLengthCV: Mean length at division (units: μm) and CV, taucycle, taucycleCV: Mean duration of the cell cycle (units: min) CV, tauI, tauI_CV: Mean duration of the inter-initiation time (units: min) and CV, tauC, tauC_CV: Mean C period (units: min) and CV, tauD, tauD_CV: Mean D period (units: min) and CV, slope_division_adder, slope_initiation_adder, slope_CD_adder: Slopes of the division-adder plot, initiation-adder plot, and C+D-adder plots, respectively.
- https://cdn.elifesciences.org/articles/67495/elife-67495-supp1-v2.csv
-
Supplementary file 2
Single-cell data used in this study.
ExperimentName: Label of the experiment (same as in the Supplementary file 1), grandmother: Cell ID of the grandmother cell, mother: Cell ID of the mother cell, cell: Cell ID of the cell, Linit_cell: Initiation length per ori of the cell (μm) (note that this initiation can happen in the mother cell), Linit_mother: Initiation length per ori of the mother (μm) (note that this initiation can happen in the grandmother cell), Lterm_cell: Termination length per ori of the cell (μm), Lterm_mother: Termination length per ori of the mother (μm), Tinit_cell: Initiation time of the cell (min), Tinit_mother: Initiation time of the mother (min), Tterm_cell: Termination time of the cell (min), Tterm_mother: Termination time of the mother (min), Tbirth_grandmother: Birth time of the grandmother (min), Tbirth_cell: Birth time of the cell (min), Tbirth_mother: Birth time of the mother (min), Tdivision_mother: Division time of the mother (min), growthrate_mother: Growth rate of the mother cell (min-1), growthrate_grandmother: Growth rate of the grandmother cell (min-1), Tdivision_cell: Division time of the cell (min), growthrate_cell: Growth rate of the cell (min-1), Lbirth_cell: Birth length of the cell (μm), Ldivision_cell: Division length of the cell (μm), Width_cell: Width of the cell (μm).
- https://cdn.elifesciences.org/articles/67495/elife-67495-supp2-v2.csv
-
Transparent reporting form
- https://cdn.elifesciences.org/articles/67495/elife-67495-transrepform-v2.docx
Download links
A two-part list of links to download the article, or parts of the article, in various formats.
Downloads (link to download the article as PDF)
Open citations (links to open the citations from this article in various online reference manager services)
Cite this article (links to download the citations from this article in formats compatible with various reference manager tools)
Two different cell-cycle processes determine the timing of cell division in Escherichia coli
eLife 10:e67495.
https://doi.org/10.7554/eLife.67495


