Paths and pathways that generate cell-type heterogeneity and developmental progression in hematopoiesis
- Department of Molecular, Cell and Developmental Biology, University of California, Los Angeles, United States
- Molecular Biology Institute, University of California, Los Angeles, United States
- Department of Biological Chemistry, University of California, Los Angeles, United States
- Eli and Edythe Broad Center of Regenerative Medicine and Stem Cell Research, University of California, Los Angeles, United States
Figures
Figure 1 with 3 supplements
Analysis of subzonal patterning of the lymph gland by RNA-Seq.
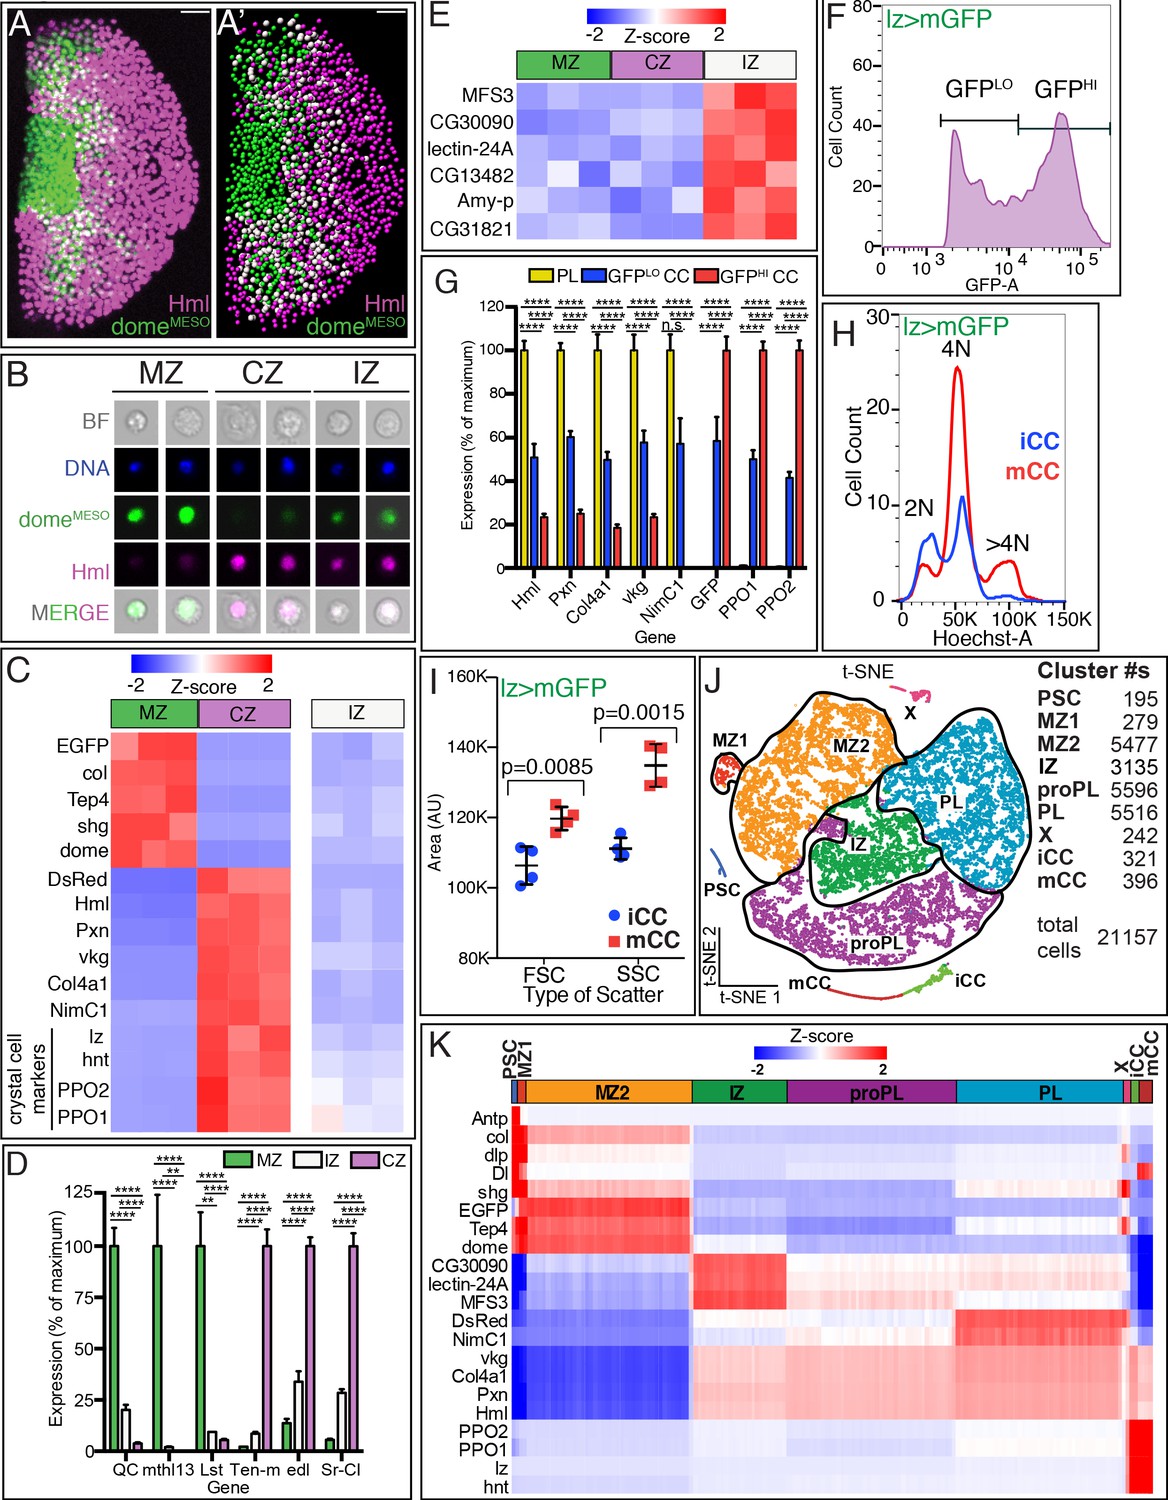
(A–E) Genotype of glands used is domeMESO-GFP.nls, HmlΔ-DsRed.nls GFP (dome) is in green and DsRed (Hml) is in magenta. (A) Confocal image shows the zonal pattern of an early third instar lymph gland. Progenitors of the medullary zone (MZ, green), differentiated cells of the cortical zone (CZ, magenta), and cells in the intermediate zone (IZ, white due to colocalization of green and magenta) are seen as distinct cell types. (A’) A digital rendering of the confocal image is shown in (A). Nuclei are pseudo-colored based on their fluorescence: MZ (green), CZ (magenta), and IZ double positive cells (white). (A–A’) Scale bars, 20 μm. (B) Images of individual dissociated lymph gland cells. Brightfield (BF), DAPI/DNA (blue), MZ cells (green), CZ cells (magenta), and IZ cells (green [weak] and magenta). (C–E) Gene expression profiles from bulk RNA-Seq analysis of dissociated and sorted cells in three biological replicates. (C) The sorted MZ and CZ cells express high levels of their corresponding hallmark genes while IZ cells show low to moderate levels of expression of these genes. MZ progenitors are validated by their expression of: domeMESO-EGFP, col (collier), Tep4, shg (shotgun; E-Cad), and dome (domeless); CZ plasmatocytes (PLs) by: HmlΔ-DsRed, Hml (Hemolectin), Pxn (Peroxidasin), vkg (viking), Col4a1, and NimC1; and the crystal cells (CC; also part of CZ) by: lz (lozenge), hnt (hindsight/pebbled), PPO2, and PPO1. (D) Newly identified zone-enriched genes for MZ include QC, mthl13, and Lst. For CZ, these include Ten-m, edl, and Sr-Cl. In general, IZ cells show low to moderate levels of these MZ and CZ-specific markers. (p-values shown are from GSA analysis. Mean with SD shown.) (E) Expression of six newly identified IZ-enriched marker genes is not enriched in MZ or CZ. (F–I) Genotype: lz-GAL4, UAS-mGFP; HmlΔ-DsRed.nls. CCs expressing lz-GAL4 are marked by GFP whereas PLs express DsRed only. Lymph glands are dissociated and the cells are subjected to flow cytometric and/or bulk RNA-Seq analysis. (F) Flow cytometry identifies two distinct populations of CCs, expressing either low GFP (GFPLO) or high GFP (GFPHI). These two CC populations are referred to as iCCs and mCCs, respectively (see text). (G) PLs show high expression of Hml, Pxn, Col4a1, vkg, and NimC1 and no expression of lz> mGFP, PPO1, and PPO2. GFPLO CCs (iCCs) show moderate levels of both PL and CC specific genes. GFPHI CCs (mCCs) show high PPO1 and PPO2, no expression of NimC1 and low expression of other PL markers. (p-values shown are from GSA analysis. Mean with SD shown.) (H) DNA (Hoechst-A) measurement shows that iCCs have 2 N or 4 N DNA content, while mCCs have a significant number of cells with >4 N DNA content indicative of endoreplication. (I) Quantitation of data from four individual experiments. mCCs have higher mean FSC-A (cell size) and mean SSC-A (cellular complexity) values than iCCs. (p-values shown are from unpaired t-test. Mean with SD shown.) (J, K) Single-cell RNA-Seq analysis of dissociated cells from domeMESO-GFP.nls, HmlΔ-DsRed.nls lymph glands. (J) 2D t-SNE visualization of graph-based clustering identifies nine clusters: PSC (dark blue), MZ1 (red), MZ2 (orange), IZ (green), proPL (purple), PL (light blue), X (pink), iCC (light green), and mCC (dark red). The number of cells in each cluster is indicated on the right. (K) Expression analysis of hallmark genes shows enrichment in appropriate clusters. PSC (Antp, col, and dlp), MZ (shg, EGFP, Tep4, and dome), IZ (CG30090, lectin-24A, and MFS3), CZ (DsRed, vkg, Col4a1, Pxn, and Hml), mature PLs (NimC1), and CCs (PPO2, PPO1, lz and hnt). Delta (Dl), shg, dlp, and col show the highest enrichment in the PSC followed by MZ1. iCC, immature crystal cell; mCC, mature crystal cell.
-
Figure 1—source data 1
Source data for Figure 1D and G, and Figure 1—figure supplement 1D.
- https://cdn.elifesciences.org/articles/67516/elife-67516-fig1-data1-v2.xlsx
Figure 1—figure supplement 1
Resolving heterogeneity in sorted populations.
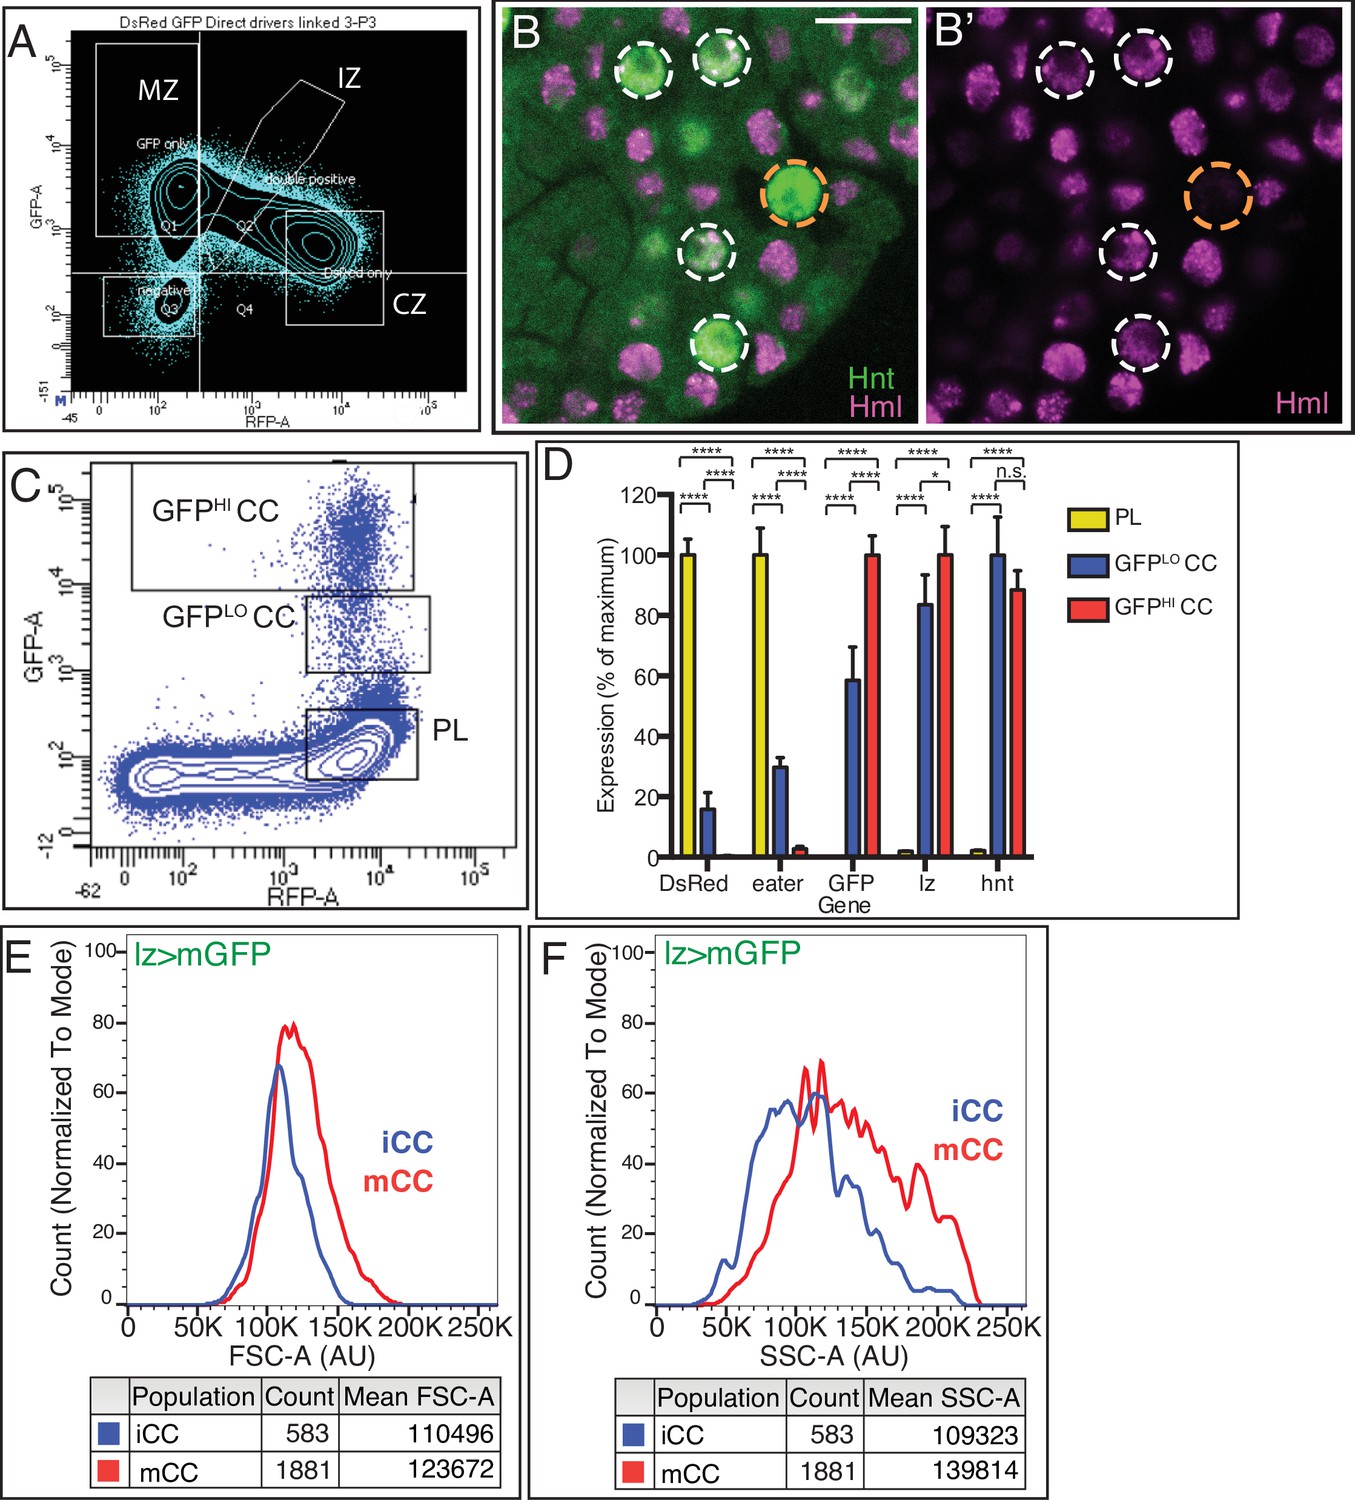
(A) Flow cytometric analysis of dissociated lymph gland cells gated into four populations: MZ (high GFP, low DsRed), CZ (low GFP, high DsRed), IZ (intermediate levels of both GFP and DsRed), and double negatives (low GFP, low DsRed). (B, B’) Confocal image of HmlΔ-DsRed.nls (magenta) lymph gland stained with anti-Hnt antibody (green). As is more clearly evident in (B’), several Hnt+ crystal cells (CCs) express low levels of Hml (white circles). Hml is not seen in the highest Hnt expressing CCs (orange circle). Genotype in (C–F): lz-GAL4, UAS-mGFP, HmlΔ-DsRed.nls. (C) Flow cytometry gates employed to distinguish between GFPHI CC, GFPLO CC, and PL populations used for data are shown in Figure 1F–I. (D) Gene expression analysis from bulk RNA-Seq. HmlΔ-DsRed and eater are high, but lz and hnt are missing in PL. All CCs are characterized by expression of lz> mGFP, lz, and hnt. (E, F) Plots representing source data for Figure 1I for FSC-A (E) and SSC-A (F). CZ, cortical zone; IZ, intermediate zone; MZ, medullary zone.
Figure 1—figure supplement 2
Reproducibility and validity of scRNA-Seq results.
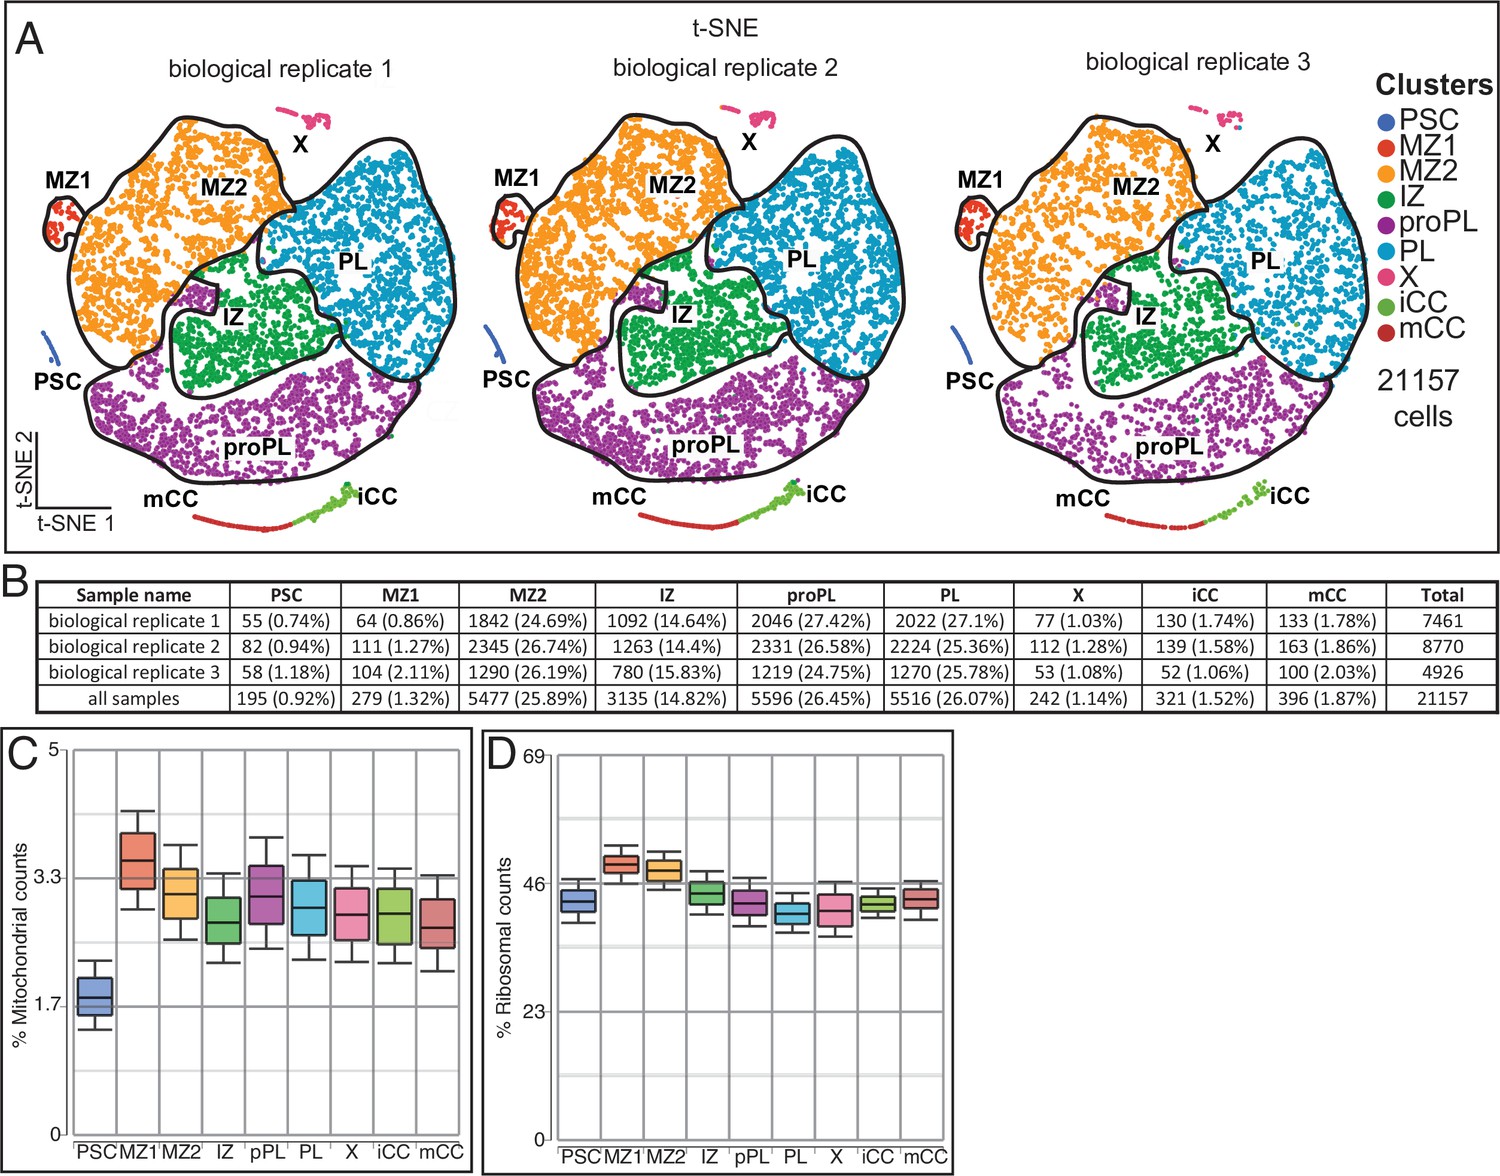
(A, B) scRNA-Seq clusters broken down by individual biological replicates. (A) 2D t-SNE of scRNA-Seq data as in Figure 1J but split by each of the three independent biological replicates used in this study. (B) Each biological replicate contributes a comparable percentage of cells to a specific cluster, despite differences in total cell numbers. (C, D) Quality control data show that the percentage of mitochondrial (C) and ribosomal (D) counts is similar for all clusters, including cluster X cells that express DNA damage-related genes.
Figure 1—figure supplement 3
Gene/pathway enrichment analysis of scRNA-Seq results.
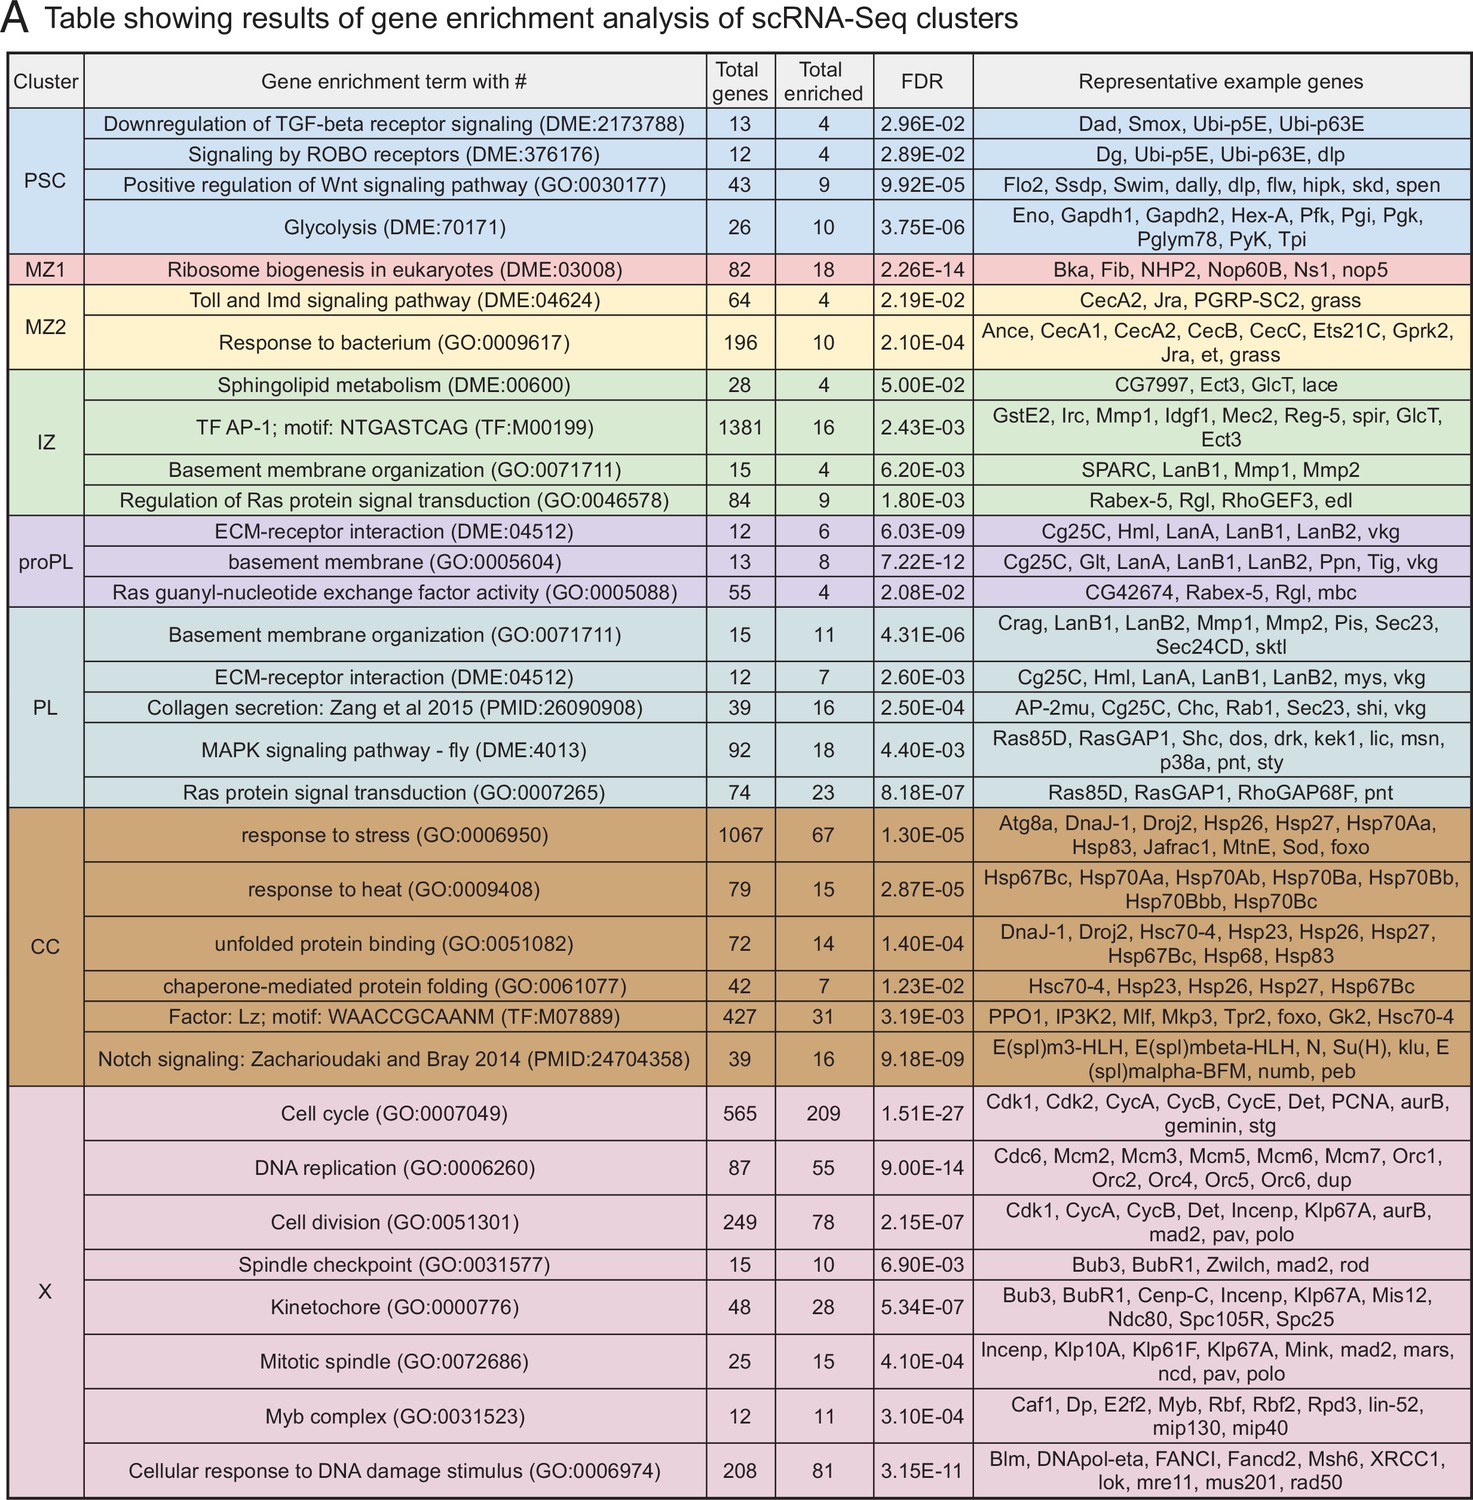
(A) Enrichment of pathways/functional categories of genes (such as GO terms and other gene set enrichment categories) in each cluster. Differentially expressed gene sets (Supplementary file 1) are generated by ANOVA and entered into gene set enrichment databases to identify pathways/categories that are specifically enriched in a statistically significant manner (false discovery rate [FDR] is shown). Gene set enrichment categories and their corresponding identifying numbers are shown along with the total number of genes that are included in each cited category (Total genes). The column ‘Total enriched’ refers to the number of genes from each set that is detected as enriched in our transcriptomic data. ‘Representative example genes’ are a subset of the ‘Total enriched’ genes for each category.
Figure 2 with 3 supplements

Developmental trajectory predicted by single-cell RNA-Seq data.
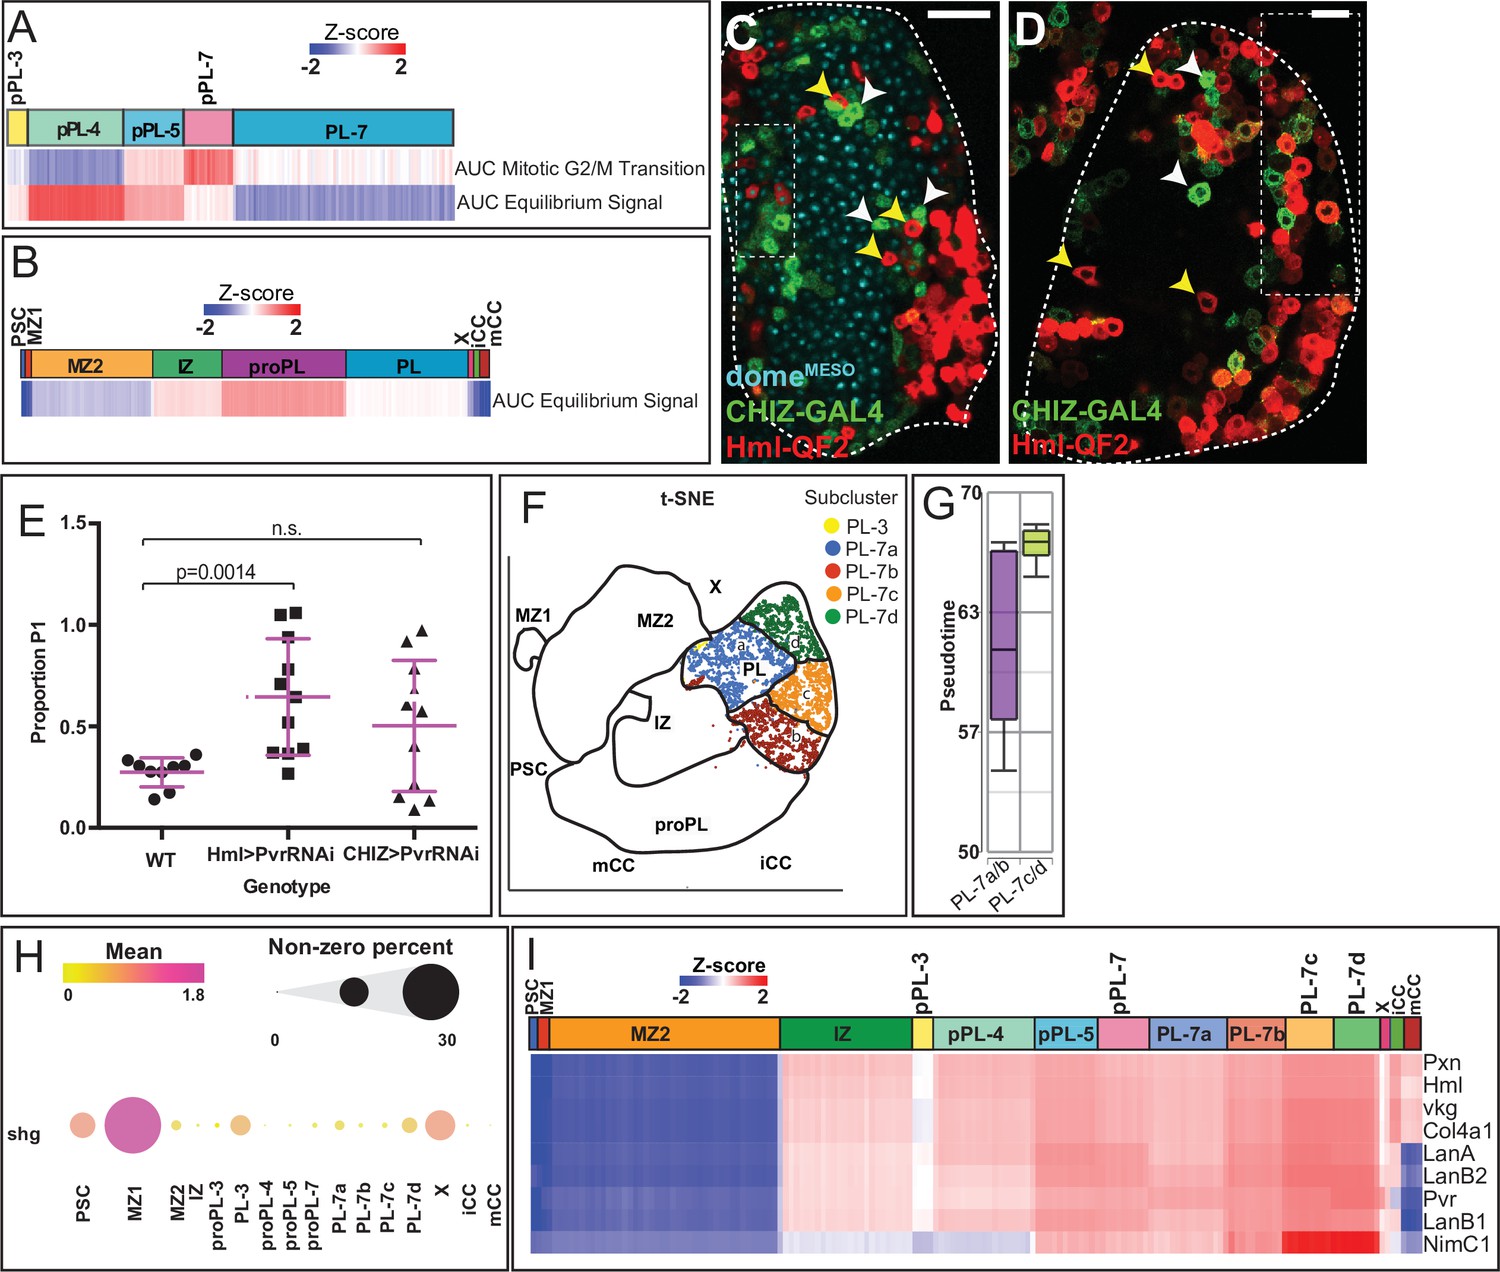
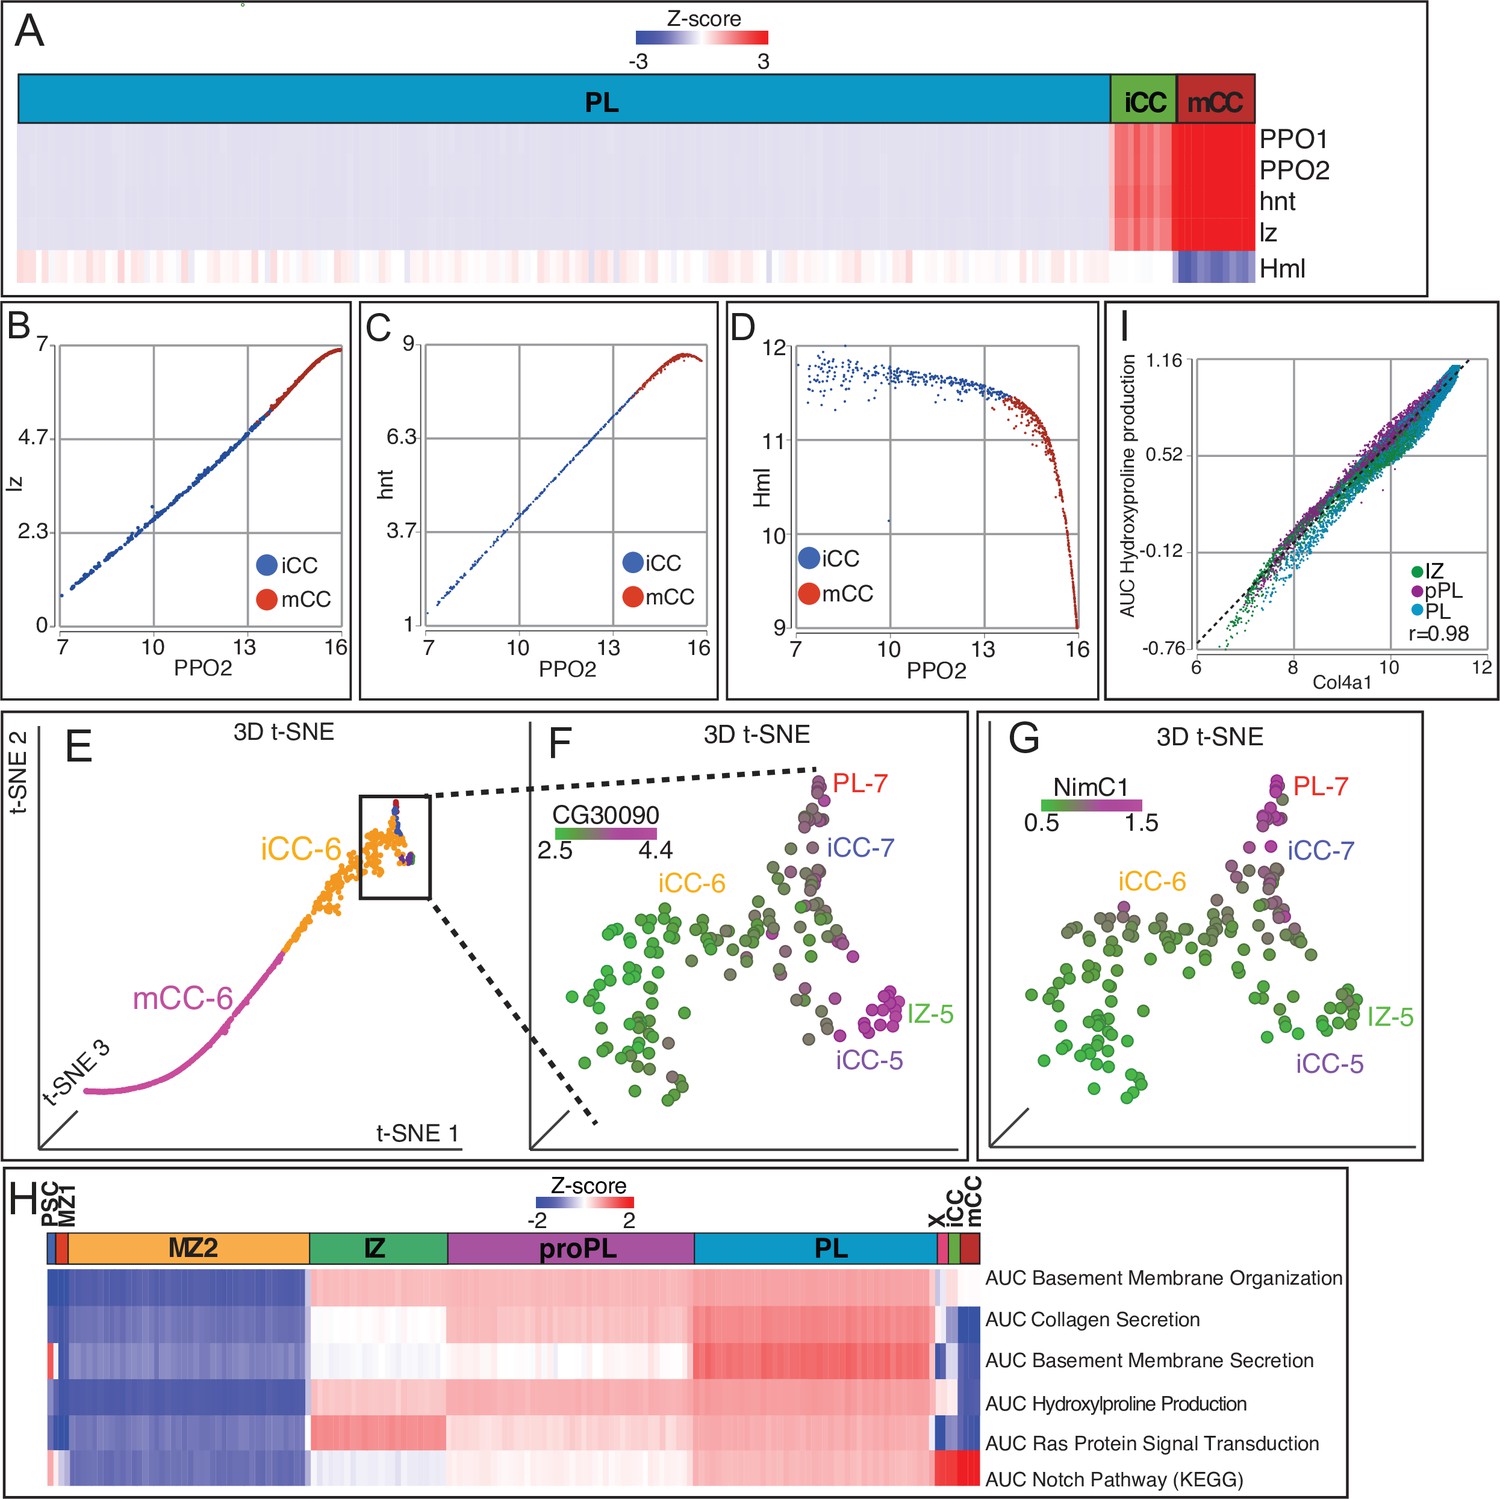
(A–C) Trajectory diagram shows the progression of lymph gland cells from the earliest progenitors (left) to the most mature cell types. (A) Earlier points in pseudotime (green) progress to later (magenta) developmental stages. (B) Superposition of graph-based clusters onto the trajectory shows that MZ1 appears at the beginning of the trajectory, and proceeds through MZ2, IZ/proPL, and ultimately onto the differentiated cell types iCC, mCC, and PL. (C) Trajectory diagram showing seven states, each separated by branch points of the trajectory. State 1 (MZ1 and early MZ2), state 2 (late MZ2), state 3 (late MZ2, IZ, and proPL), states 4 and 5 (IZ and proPL), state 6 (terminal CCs), and state 7 (terminal PLs). (D) Trajectory states overlaid on the 2D t-SNE plot. State 1 (dark blue) contains all MZ1 cells as well as MZ2 cells adjacent to MZ1. State 2 (dark red) is a very minor component of MZ2. State 3 (orange) lies at the border between MZ2 progenitors and the more developmentally advanced clusters (IZ, proPL, and PL). States 4 (green) and 5 (purple) represent the majority of IZ and proPL cells. State 6 (light blue) contains the majority of CCs. State 7 (pink) contains most PL cells as well as IZ and proPL cells adjacent to the PL cluster. A small number of iCC cells are in states 5 and 7, which map to the tip of the CC cluster (see M). PSC and X cells are colored gray as they were not used for trajectory analysis. (E) Volcano plot depicting the results of an ANOVA comparison between the IZ and proPL clusters. Each gene expressed in the scRNA-Seq data is represented by a dot. The X-axis depicts the magnitude of the difference in expression of each gene in IZ compared to proPL. The Y-axis indicates the statistical significance of each difference in gene expression, the false discovery rate (FDR) value for each comparison, where magenta lines represent the significance thresholds beyond which the difference in gene expression is statistically significant. IZ upregulated genes (red); proPL upregulated genes (blue); Selected statistically significant genes (black labels). (F) 3D t-SNE emphasizes that IZ (green) and proPL (purple) are distinct clusters that show little adjacency to each other because of their different 3D-planar locations. IZ and proPL possess separate connections between MZ (tan) (compare green arrow vs. purple arrow) and PL (gray) (compare green arrowhead vs. purple arrowhead). The data strongly suggest that IZ and proPL are two distinct means to connect MZ with PL. For a better view of the 3D-tSNE, see Video 1. (G) Representation of the fraction of cells from individual clusters at each pseudotime point. MZ1 (red) is found at the earliest pseudotime, while MZ2 (orange) is found in states 1, 2, and 3, slightly later in pseudotime. IZ (green) and proPL (purple) are placed primarily at intermediate pseudotime in states 3, 4, and 5. The placement of the states relative to pseudotime is indicated at the top of the graph and reveal that states 4 and 5 overlap considerably in pseudotime, indicating that spatially distinct clusters can overlap in pseudotime. Similarly, states 6 and 7 overlap and include a number of cell types. (H) Image of an early third instar lymph gland expressing CHIZ-GAL4, UAS-mGFP (green) to mark IZ cells, and domeMESO-EBFP2 (cyan) with HmlΔ-QF2, QUAS-mCherry (red) to mark proPL cells. IZ and proPL cells display distinct non-overlapping expression patterns. proPL cells can be distinguished here from PLs (which also express HmlΔ-QF2, QUAS-mCherry) by their expression of domeMESO-EBFP2. Scale bar, 10 μm. Full lobe shown in Figure 2—figure supplement 2C. (I) CHIZ-GAL4, UAS-mGFP (green) and HmlΔ-QF2, QUAS-mCherry (red) are expressed in distinct cells of the lymph gland with little colocalization. Scale bar, 10 μm. Full lobe shown in Figure 2—figure supplement 2D. (J–L) Loss of equilibrium signal with PvrRNAi increases P1 staining when driven with HmlΔ-GAL4 (L) but not with CHIZ-GAL4 (K) compared to wild-type (J). Scale bar, 20 μm. Quantifications found in Figure 2—figure supplement 2E. (M) A magnified view of the CC island from the 3D t-SNE. The boxed area is further magnified to show the identity of individual cells. iCC-6 and mCC-6 make up the majority of CCs. However, the base of the CC island (boxed part) includes small populations of iCC-5 and iCC-7 in close proximity to IZ-5 and PL-7, respectively, from which they are derived. (N) Dot plot showing the expression pattern of lz (lozenge) in iCCs and their immediate IZ-5 and PL-7 neighbors compared with IZ-5 and PL-7 cells that are not on the CC island. The ‘subpopulations’ are as follows: 1. IZ-5 cells not on the CC island. 2. IZ-5 cells on the CC island. 3. iCC-5 cells. 4. PL-7a/b cells not on CC island. 5. PL-7a/b cells on the CC island. And 6. iCC-7 cells. In each population, dot color reflects the mean level of lz expression (mean) and the dot size indicates the percentage of cells that express lz (non-zero percent). The data show that the IZ and PL cells that map to the CC island are enriched for lz unlike the rest of the IZ and PL cells. CZ, cortical zone; iCC, immature crystal cell; IZ, intermediate zone; mCC, mature crystal cell; PL, plasmatocyte; t-SNE, t-distributed stochastic neighbor embedding.
-
Figure 2—source data 1
Source data for Figure 2E and Figure 2—figure supplement 2E.
- https://cdn.elifesciences.org/articles/67516/elife-67516-fig2-data1-v2.xlsx
Figure 2—figure supplement 1
Cluster characteristics for MZ1, MZ2, X, and IZ.
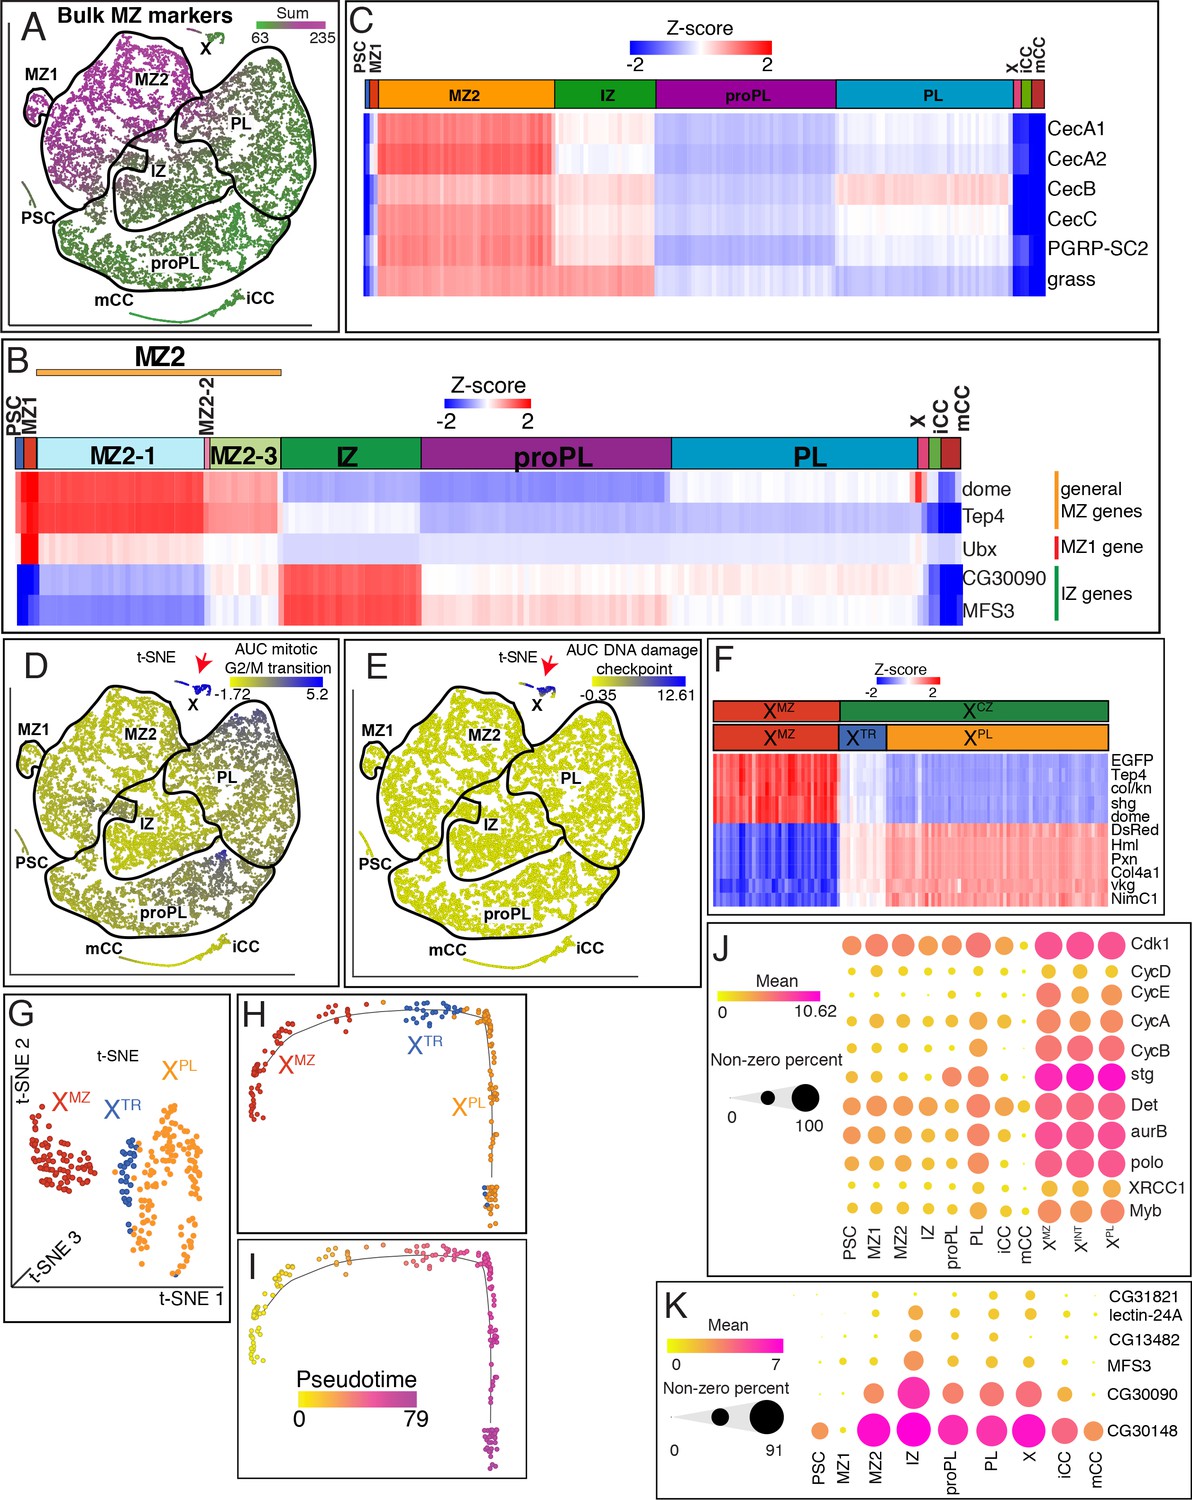
(A) The combined expression values for all MZ-enriched genes identified in bulk RNA-Seq are mapped here onto the t-SNE plot obtained from the scRNA-Seq analysis. MZ1 and MZ2 clusters robustly match the expression of the MZ-enriched genes from the bulk data. (B) Comparison of MZ clusters and their developmental states with all other clusters highlights a progressive decline of Tep4 and dome expression from MZ1 onwards through IZ. Whereas, IZ-enriched markers CG30090 and MFS3 show the opposite trend. Unexpectedly, Ubx is most highly enriched in MZ1 compared with all other clusters. (C) Heatmap demonstrates the enrichment of individual immunity-related genes in MZ2 compared with their expressions in MZ1 and other clusters. (D, E) Cluster X cells (red arrow) show the highest enrichment of mitotic G2/M transition genes (z=4.7; p<0.0001) (D), and intra-S DNA damage checkpoint genes (z=8.6; p<0.0001) (E). (F) The two islands of X seen on the t-SNE (XMZ and XCZ), split into three subclusters (XMZ, XTR, and XPL) with distinct expression of hallmark MZ and PL enriched genes. XTR cells exhibit intermediate levels of both MZ and PL genes. (G) Graph-based subclustering of X shown on a three-dimensional t-SNE plot. X is broken up into three clusters: XMZ, XTR, and XPL. (H, I) Trajectory analysis of isolated cluster X cells. Superimposed graph-based clustering (H) and pseudotime analysis (I) show that the trajectory of X follows the sequence XMZ, XTR, then XPL. (J) Dot plot showing examples of cell cycle-related gene expression in the main clusters and in the three subclusters of X. Dot color represents the mean gene expression and dot size indicates the percentage of cells that express each gene. Genes associated with G1 (Cdk1, CycD, and CycE), G2 (CycA, CycB, and stg), Mitosis (Det, aurB, and polo), and DNA damage checkpoint (XRCC1, Myb) are enriched in X relative to the other clusters. Their expression is varied amongst the main clusters, however, they are uniformly distributed across the three subclusters of X. (K) Dot plot showing expression of the six IZ-enriched genes from bulk RNA-Seq analysis that are detected in scRNA-Seq data. Mean gene expression is represented by the dot color and the percentage of cells that express each gene is indicated by the dot size. All but one (CG31821) are enriched in the IZ relative to the other clusters. IZ, intermediate zone; MZ, medullary zone; PL, plasmatocyte; t-SNE, t-distributed stochastic neighbor embedding.
Figure 2—figure supplement 2
Expression profiling of proPL and PL.
(A, B) Heatmaps derived from AUC values for equilibrium signal gene set (A, B) as well as mitotic G2/M transition genes (A). The proPL cluster shows higher AUCell activity over others with a small bias for proPL-4 and proPL-7 for the two gene sets, respectively. (C–D) Lower magnification view showing a single slice of the entire lymph gland primary lobes from Figure 2H (shown in C) and Figure 2I (shown in D). Boxed portions delineate regions shown in Figure 2H–I. CHIZ-GAL4+ IPs of the IZ (green, white arrowheads) are largely distinct from HmlΔ-QF2+ cells (red, yellow arrowheads). domeMESO-EBFP (cyan) in (C); Scale bars: 50 μm. (E) Quantitation of the genetic data in Figure 2J–L. P1 proportion is calculated for individual lymph gland primary lobes and shows a significant increase in HmlΔ> PvrRNAi compared to wild-type (WT). WT: n=9; HmlΔ>PvrRNAi and CHIZ>PvrRNAi: n=11. (F) Subclusters of PL. The PL cluster is split by graph-based clustering into four subclusters (designated PL-7a, PL-7b, PL-7c, and PL-7d), and are visualized on the 2D t-SNE plot along with the neighboring PL-3 cells. (G) Graphical representation of pseudotime comparing PL subclusters based on the trajectory in Figure 2A–C. PL-7a/b cells are earlier in pseudotime than PL-7c/d. (H) Dot plot showing the mean expression of the MZ marker shg (represented by dot color) and the percentage of cells that express shg (represented by dot size) in different populations. shg (E-Cad) is uncharacteristically high in certain subpopulations of PL. PL-3, PL-7a, and PL-7d each express similar shg levels as MZ2. (I) Heatmap showing expression of individual CZ marker genes in subpopulations of proPL (pPL) and PL compared with the other clusters. CZ-related markers in general, and NimC1 in particular, are most highly enriched in mature PL-7c/d subclusters and generally have reduced expression in proPL and IZ clusters. CZ, cortical zone; MZ, medullary zone; PL, plasmatocyte; t-SNE, t-distributed stochastic neighbor embedding.
Figure 2—figure supplement 3
Crystal cell (CC) genes and comparative enrichment of genes in differentiating cells.
(A) Heatmap showing distribution of CC markers PPO1, PPO2, lz, and hnt, which are high in CCs (especially mCCs), contrasted with the low level of Hml in mCCs. (B, C) PPO2 positively correlates with lz (B; r=1) and hnt (C; r=0.99) in both iCCs and mCCs. (D) Hml negatively correlates with PPO2, especially in mCCs (r=–0.91). (E) 3D t-SNE of the CC island showing the locations of iCC-5, -6, and -7 as well as adjacent IZ-5 and PL-7, and mCC-6 cells. (F, G) Expression of zone-enriched genes in cells shown in the boxed part of (E). (F) The IZ marker CG30090 is expressed in IZ-5 and iCC-5, but not iCC-6 cells. (G) The PL marker NimC1 is expressed in PL-7 and iCC-7, but not iCC-6 cells. (H) Heatmap depicting AUCell analysis of gene sets enriched in specific populations of differentiating cells. See text for details. (I) Col4a1 expression highly correlates with hydroxyproline production in IZ, proPL, and PL (r=0.98). iCC, immature crystal cell; IZ, intermediate zone; mCC, mature crystal cell; PL, plasmatocyte; t-SNE, t-distributed stochastic neighbor embedding.
Figure 3 with 2 supplements
Developmental metabolism of the lymph gland by single-cell analysis.
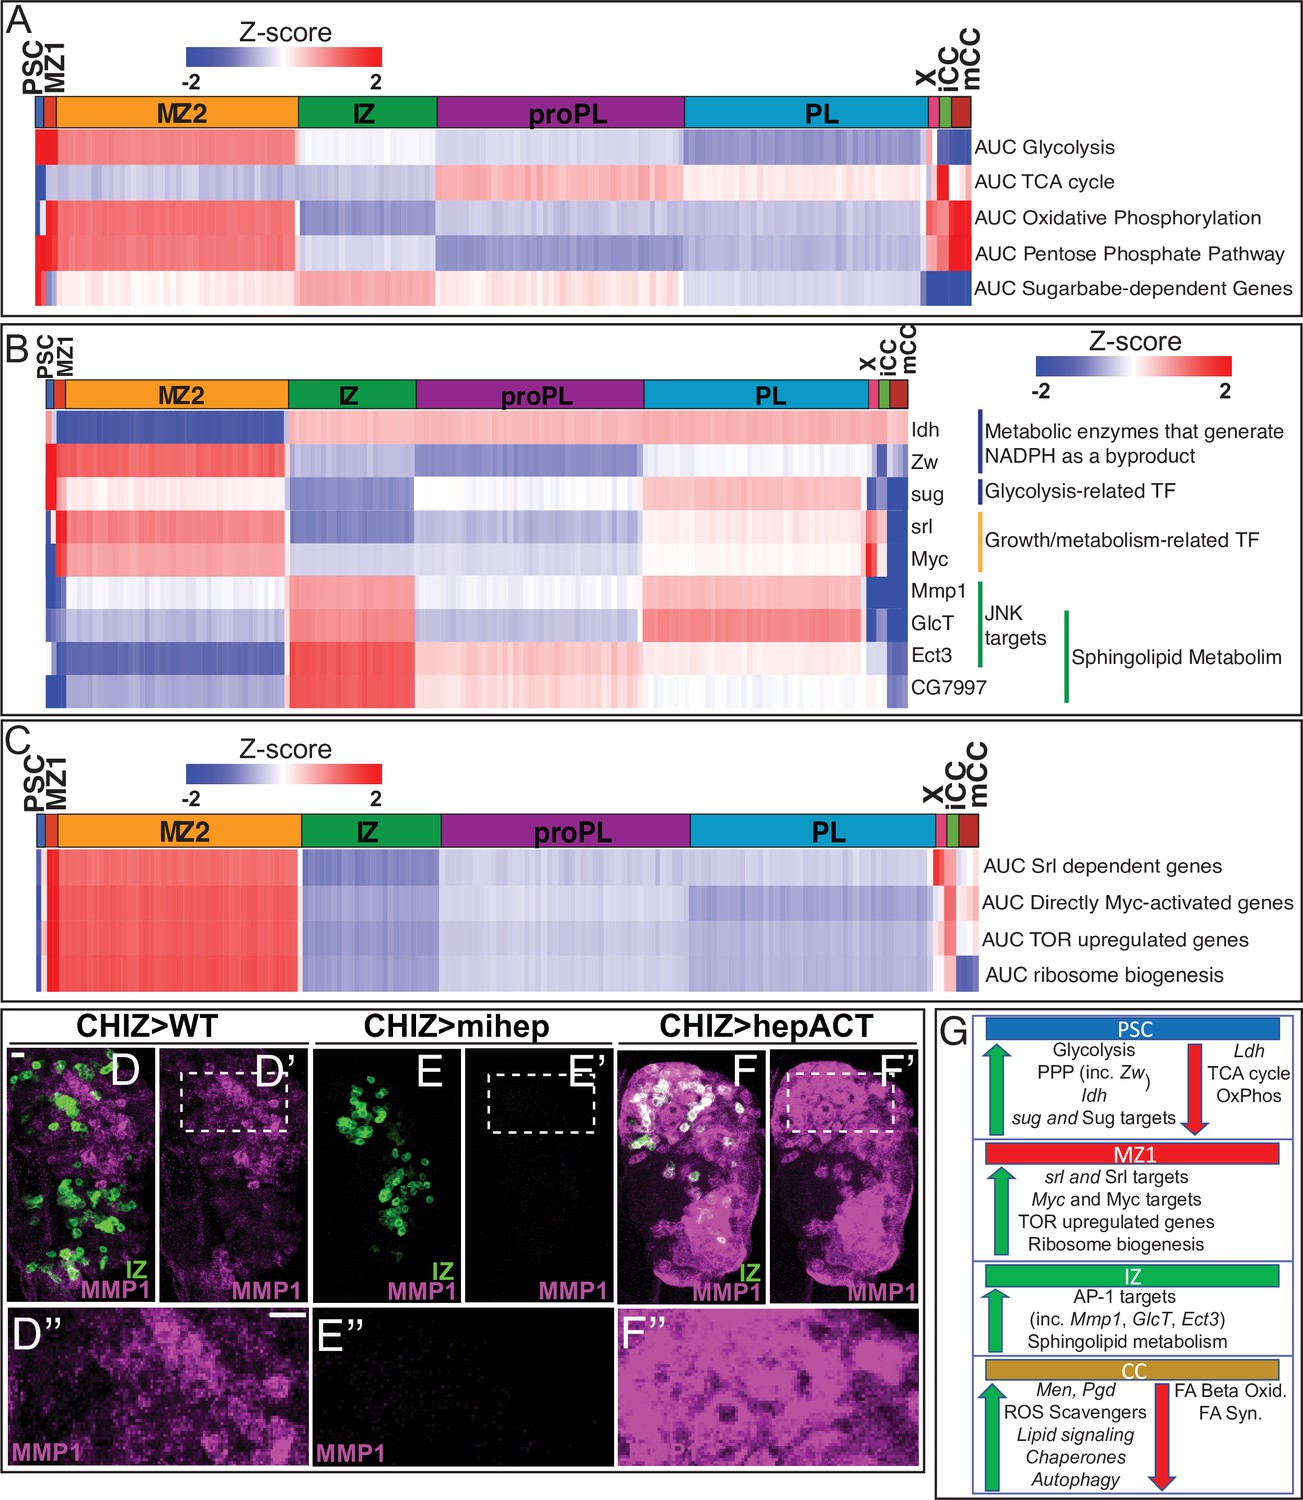
Expression analysis of either single genes (B) or groups of genes scored as AUCell (A, C) displayed in heatmaps with z-scores ranging from –2 (blue) to 2 (red). (A) Glycolysis pathway: enriched in PSC (z-score=5.7; corresponds to p<0.0001) and MZ1 (z-score=2.5; p=0.006). Other clusters: not statistically significant (n.s.). TCA cycle enzymes: not enriched in PSC (z-score=–4.1; p<0.0001). Other clusters: n.s. Oxidative phosphorylation: not enriched in PSC (z-score=–2.2; p=0.015), slightly enriched in MZ1 (z-score=2.0; p=0.026). Other clusters: n.s. Pentose phosphate pathway (PPP): enriched in PSC (z-score=2.4; p=0.008), slightly enriched in MZ1 (z-score=1.9; p=0.02), and mCC (z-score=2.6; p=0.004). Other clusters: n.s. Sugarbabe-dependent genes: enriched in PSC (z-score=3.4; p=0.0004). Other clusters: n.s. (B) Heatmap showing expression of assorted metabolic genes. PSC is enriched for Zw, Idh, and sug. MZ1 is enriched for srl and Myc. IZ is enriched for Mmp1, GlcT, Ect3, and CG7997. (C) Heatmap of AUCell analysis of growth-related pathways. MZ1 is slightly enriched in: srl dependent genes (z-score=2.06; p=0.020), and enriched for Myc target genes (z-score=2.44; p=0.007), TOR upregulated genes (z-score=2.64; p=0.004), and ribosome biogenesis genes (z-score=2.40; p=0.008). (D–F’’) Manipulation of the JNK pathway using CHIZ-GAL4, UAS-mGFP (green) that marks IZ cells (Spratford et al., 2020). Immunolocalization of MMP1 is shown in magenta. Images are maximum intensity projections of the middle third of a confocal z-stack of lymph glands from wandering third instar larvae. The regions boxed in (D’–F’) are shown at a higher magnification in (D”–F”). Scale bars, 10 μm. (D–D”) MMP1 protein expressed in close proximity to IZ cells in wild-type (WT). (E–E”) A microRNA-based depletion of JNKK/hep in the IZ cells results in loss of MMP1 throughout the lymph gland (including in the region neighboring the IZ). (F–F’’) Overactivation of JNK by a constitutively active isoform of JNKK/hep causes a large increase in MMP1 staining throughout the lymph gland. (G) Summary of the metabolic gene expression signatures found in the PSC, MZ1, IZ, and CC clusters. Green (up) arrows indicate enrichment of genes/pathways while red (down) arrows indicate the absence of enrichment. CC, crystal cell; IZ, intermediate zone; MZ, medullary zone.
Figure 3—figure supplement 1
Unique metabolic signatures of the PSC and CCs.
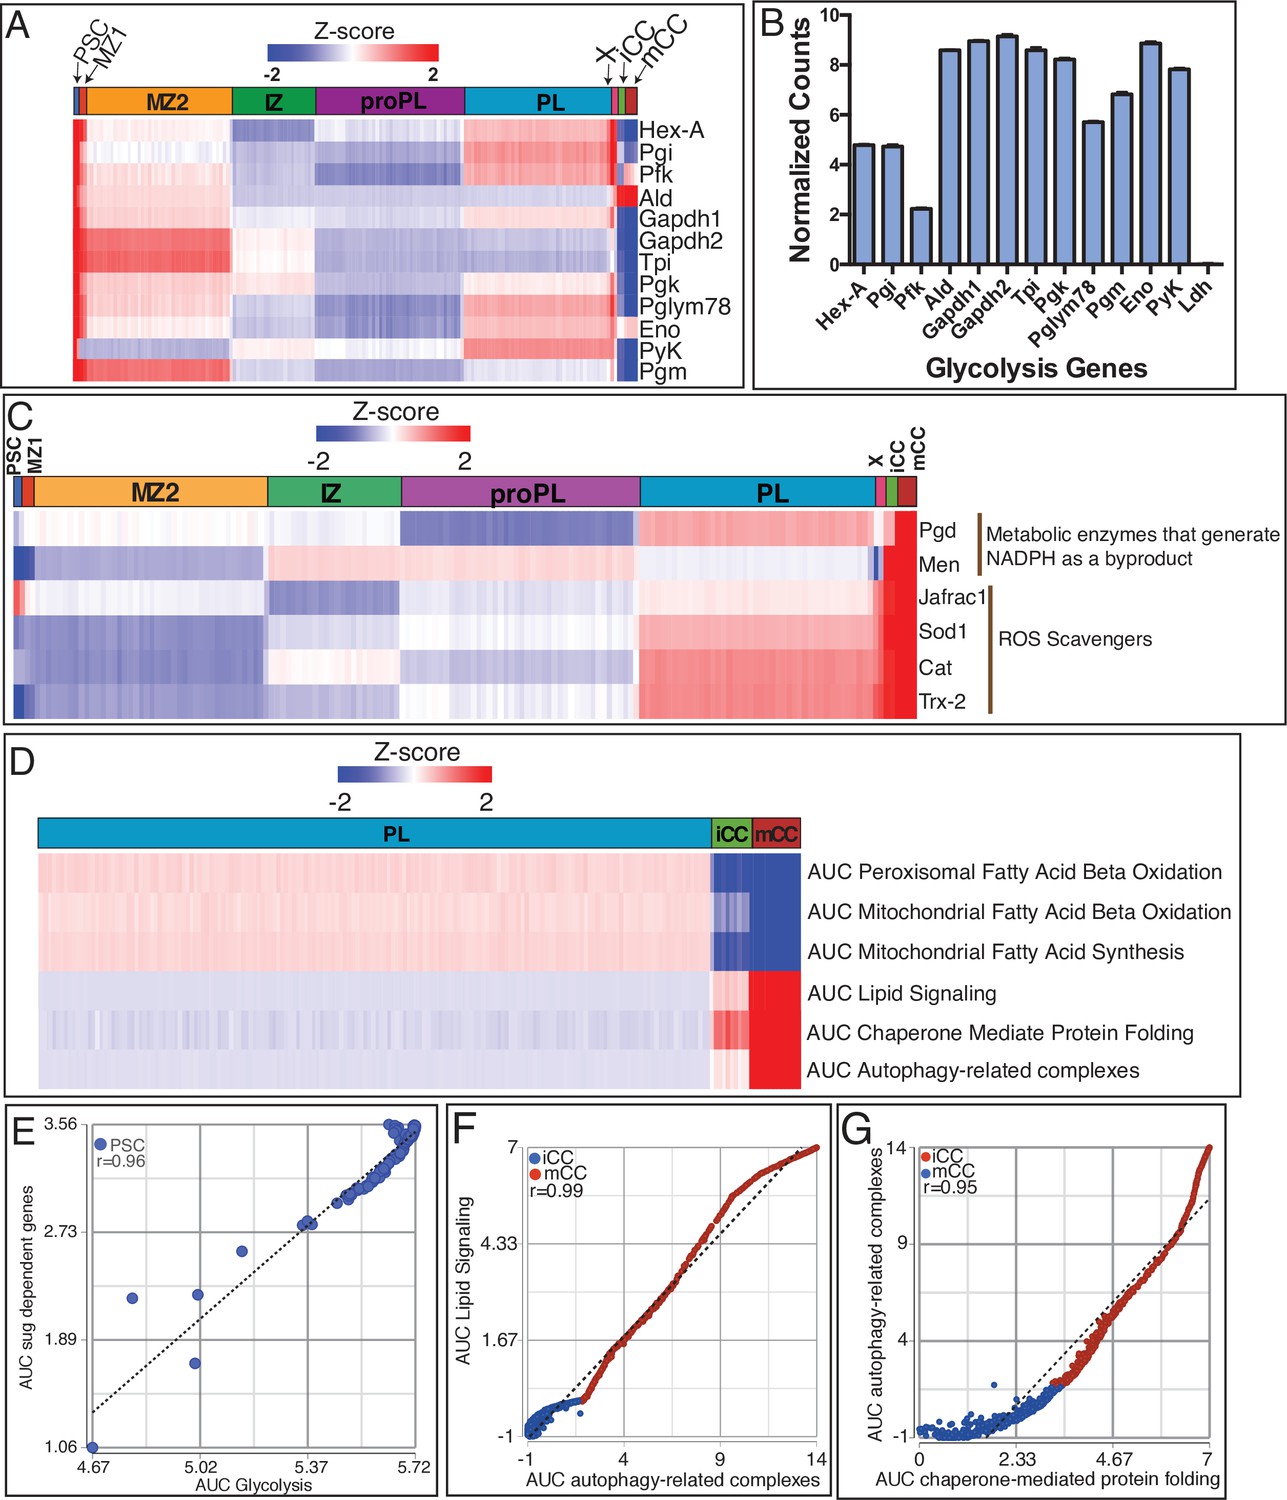
(A) All glycolytic genes (except Ldh; see text), are highly enriched in the PSC. Only subsets are enriched in the other clusters. MZ1 is the most similar to PSC. (B) Average normalized counts within the PSC cluster highlights the lack of Ldh expression when compared with other genes in the glycolytic pathway. (C) Men, Pgd, Sod1, Catalase (Cat), Jafrac1, and Trx-2 are highly enriched in mCCs. (D) Heatmap comparing the activity (AUCell) of various fatty acid pathways. Peroxisomal fatty acid beta oxidation (FAO): not enriched in mCC (z-score=–3.8; p<0.0001) and iCC (z-score=–2.2; p=0.01). PL: n.s. Mitochondrial FAO: not enriched in mCC (z-score=–5.2; p<0.0001). PL: n.s. Mitochondrial fatty acid synthesis: not enriched in mCC (z-score=–6.0; p<0.0001) and iCC (z-score=–3.1; p=0.00097). PL: n.s. Glycerolipid remodeling/Lipid signaling: enriched in mCCs (z-score=6.2; p<0.0001). Other clusters: n.s. Chaperone-mediated protein folding: enriched in mCC (z-score=5.2; p<0.0001) and iCC (z-score=2.3; p=0.01). PL: n.s. Autophagy-related complexes: enriched in mCC (z-score=5.7; p<0.0001). (E) Sugarbabe target genes show a strong positive correlation with AUC scores for glycolysis in PSC cells (r=0.96). (F, G) AUC scores for autophagy related genes correlate strongly and positively in iCCs and mCCs with that for glycerolipid remodeling/lipid signaling (r=0.99) (F) and chaperone-mediated protein folding (r=0.95) (G). iCC, immature crystal cell; mCC, mature crystal cell; PL, plasmatocyte.
Figure 3—figure supplement 2
Metabolic signatures of the MZ and IZ.
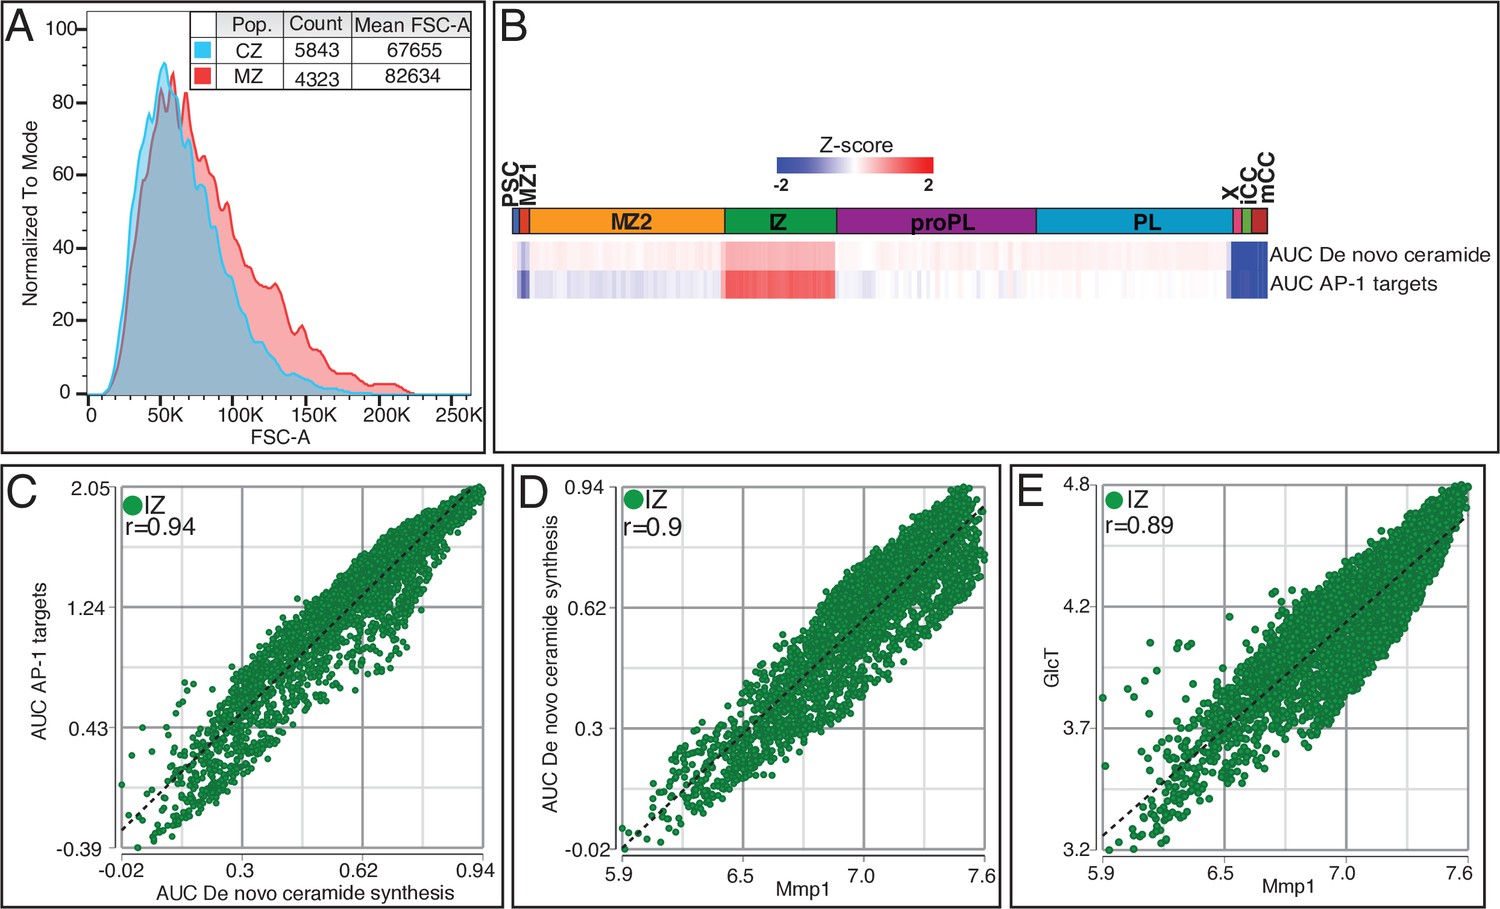
(A) Flow cytometric analysis of domeMESO-GAL4, UAS-EGFP, HmlΔ-DsRed lymph glands shows that on average, MZ cells are higher in forward scatter (FSC-A; a measure of cell size) than CZ cells. (B) AUCell analysis shows that the IZ is most prominent in the activities of de novo ceramide synthesis and predicted AP-1 targets compared to the other clusters. (C–E) Positive correlation within the IZ is seen in comparisons of AUC scores for predicted AP-1 transcriptional targets with de novo ceramide synthesis (C; r=0.94), as well as the AUC scores for de novo ceramide synthesis with Mmp1 (D; r=0.9), and between Mmp1 and GlcT (E; r=0.89). CZ, cortical zone; IZ, intermediate zone; MZ, medullary zone.
Figure 4 with 1 supplement
Role of Pnt in lymph gland development.
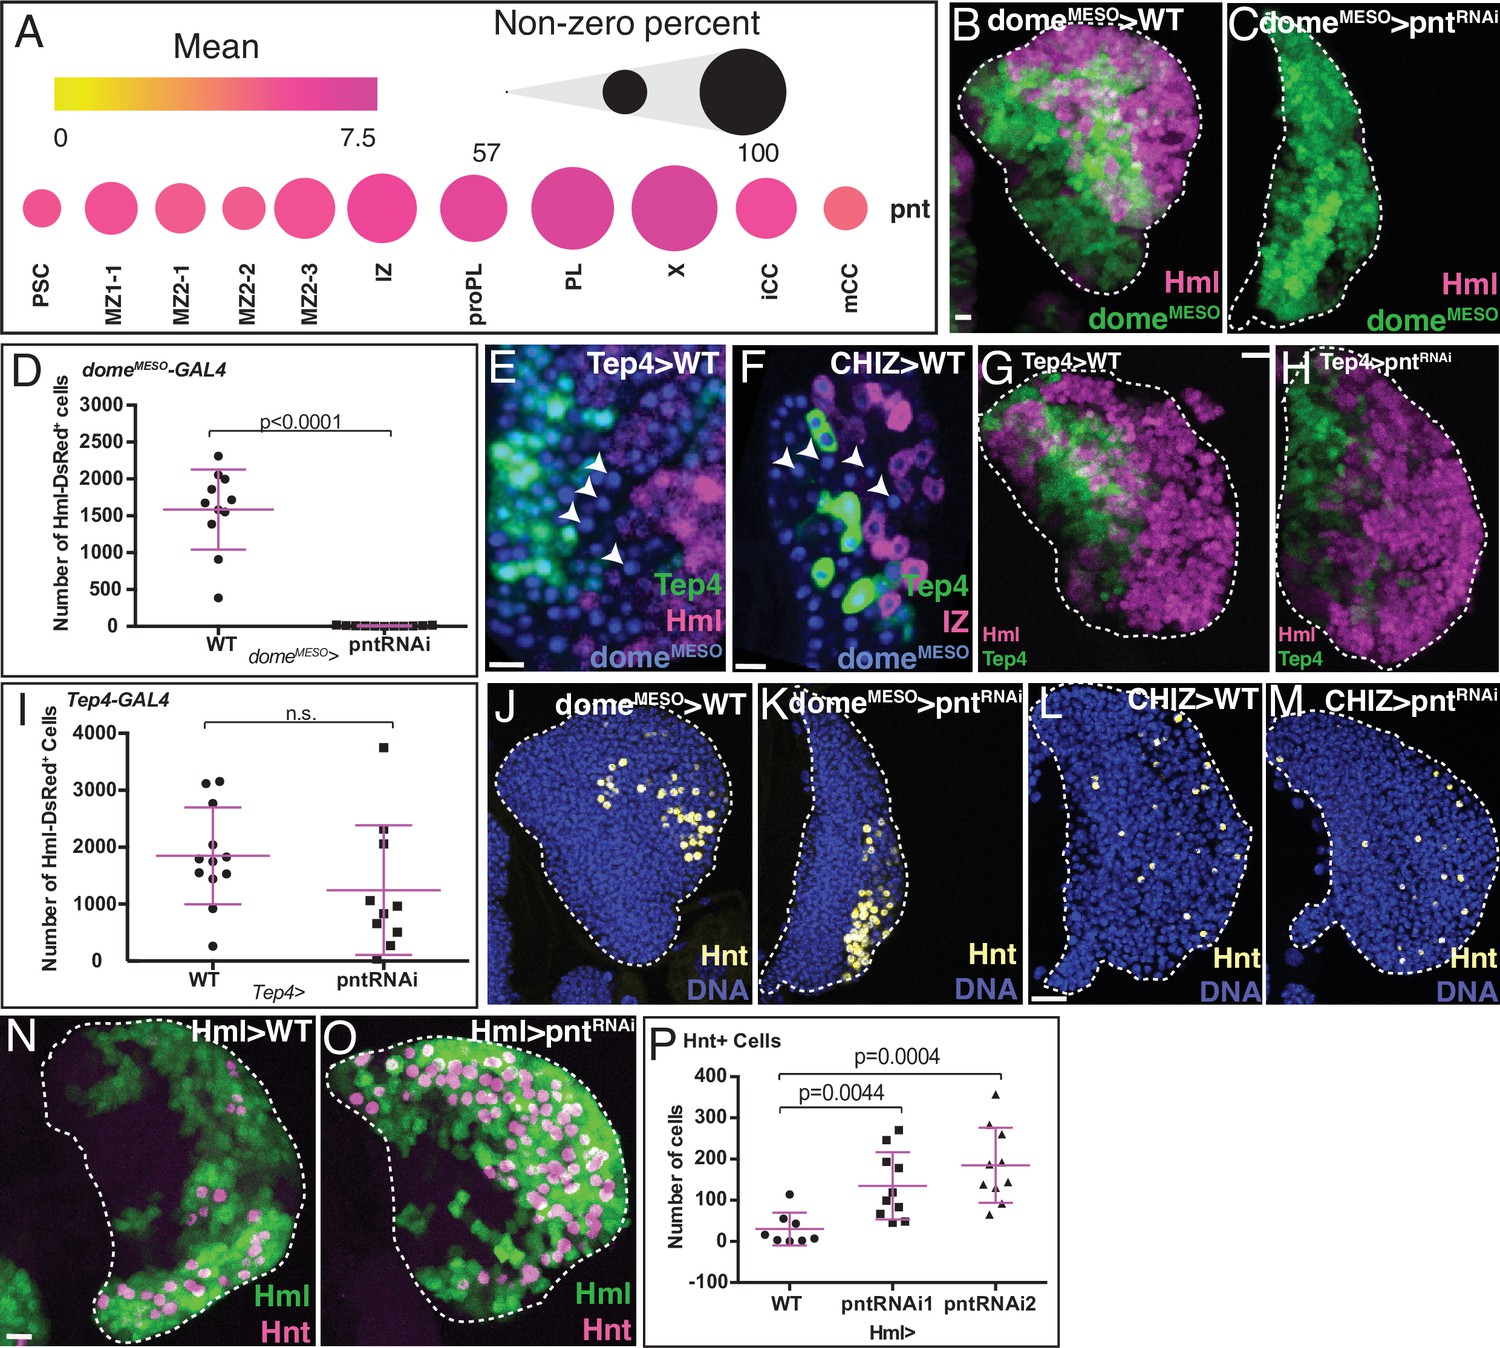
(B, C, G, H, and J–O) are maximum intensity projections of the middle third, and (E, F) are single confocal slices. Lymph glands are from wandering (B, C, G, H, J–M) or early (E, F, N, O) third instar larvae. Scale bars: 10 μm. (A) scRNA-Seq analysis shows graded pnt expression in different subpopulations (see text for details). The mean level of pnt expression is represented by the dot color and the percentage of cells that expresses pnt is indicated by the dot size. (B–D) Genetic analysis of domeMESO-GAL4, UAS-GFP, HmlΔ-DsRed lymph glands. (B) Control lymph gland. domeMESO marks MZ (reported by GFP, green) and HmlΔ marks IZ and CZ (reported by DsRed, magenta). (C) Expression of pntRNAi in the MZ cells that are domeMESO positive prevents the formation of IZ and CZ cells. (D) Quantitation of data shown in (B, C) reveals a complete loss of HmlΔ-DsRed+ cells (IZ, proPL, or PL) in domeMESO-GAL4, UAS-pntRNAi. n=11. (E) Genotype, Tep4-GAL4, UAS-GFP, domeMESO-EBFP2, HmlΔ-DsRed. Late progenitors marked by arrowheads are positive for domeMESO (blue) but negative for Tep4 (green) and HmlΔ (red).(F) Genotype, CHIZ-GAL4, UAS-mGFP, domeMESO-EBFP2, Tep4-QF2, QUAS-mCherry. A population of pre-IZ late progenitors marked by arrowheads are positive for domeMESO (blue), but negative for Tep4 (green) and CHIZ (red). (G–I) Genotype, Tep4-GAL4, UAS-GFP, HmlΔ-DsRed.(G) Control lymph gland. Tep4 (green) is expressed in a subset of MZ progenitors. Hml (magenta) marks IZ/CZ. (H) pntRNAi expressed in Tep4+ MZ cells has no effect on the formation of IZ/CZ cells. (I) Quantitation of the data in (G, H) shows no significant difference in the number of HmlΔ-DsRed+ cells when pntRNAi is expressed using Tep4-GAL4 (contrast with D). WT: n=12; pntRNAi: n=10. (J, K) Genotype is the same as in (B, C). (J) Control shows nuclei (DNA, blue) and crystal cells (CCs; Hnt, yellow). (K) Depletion of pnt in domeMESO positive MZ cells does not prevent formation of Hnt+ CCs. Quantitation in Figure 4—figure supplement 1E. (L, M) Genotype, CHIZ-GAL4, UAS-mGFP (GFP not shown). (L) Control shows DNA (blue) and Hnt (yellow). (M) Depletion of pnt in IZ cells does not prevent formation of Hnt+ CCs. Quantitation in Figure 4—figure supplement 1F. (N–P) Genotype, HmlΔ-GAL4, UAS-2xEGFP. HmlΔ (green) and Hnt (magenta). (N) Control. (O) pntRNAi expressed in HmlΔ-GAL4+ cells increases the number of Hnt+ CCs. (P) Quantitation of the data in (N, O) shows a significant increase in the number of Hnt+ CCs with pntRNAi using two independent RNAi lines driven by HmlΔ-GAL4. WT: n=8; pntRNAi 1 & 2: n=10. CZ, cortical zone; IZ, intermediate zone; MZ, medullary zone; PL, plasmatocyte.
-
Figure 4—source data 1
Source data for Figure 4D and P and Figure 4—figure supplement 1A-F.
- https://cdn.elifesciences.org/articles/67516/elife-67516-fig4-data1-v2.xlsx
Figure 4—figure supplement 1
Quantification of pntRNAi phenotypes.
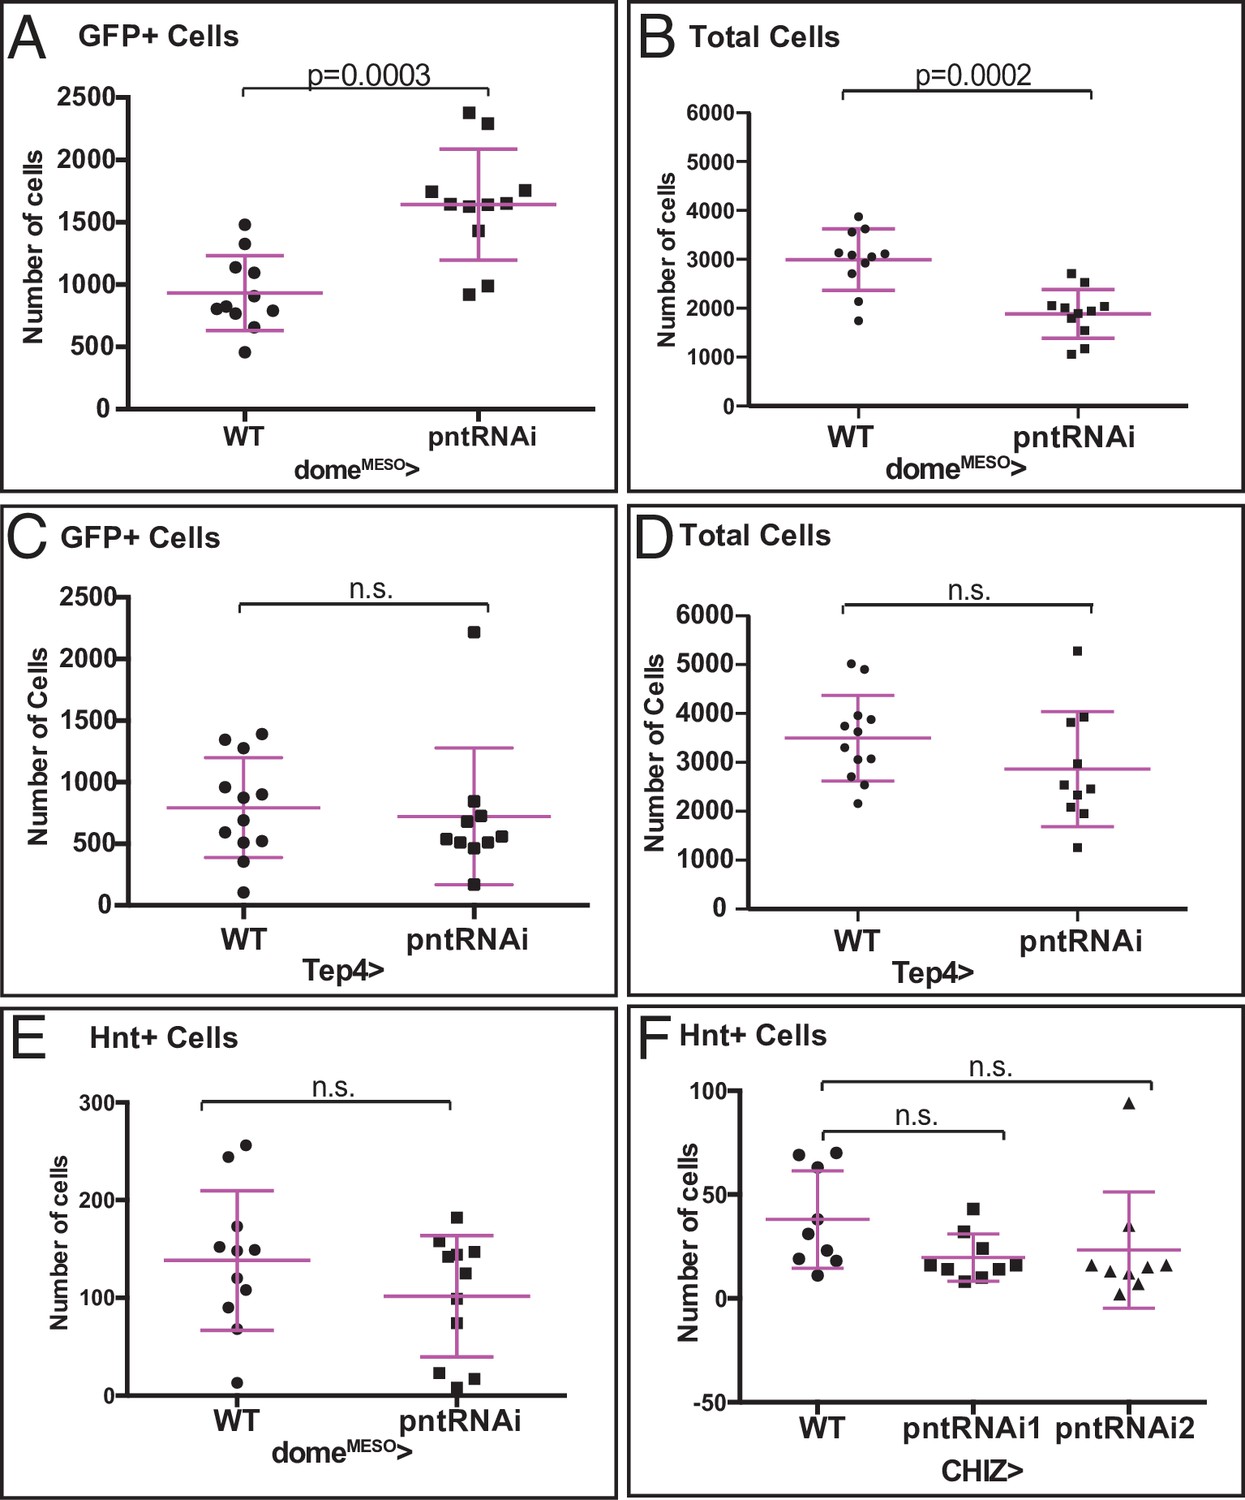
(A, B) Quantitation of data shown in Figure 4B–C. Genotype, domeMESO>EGFP, HmlΔ-DsRed. n=11. (A) Depletion of pnt in domeMESO>EGFP+ cells using pntRNAi significantly increases the number of GFP+ cells, indicating a higher number of progenitors. (B) Knockdown of pnt results in significantly fewer total lymph gland cells (marked by DAPI). (C, D) Quantitation of data shown in Figure 4G–H. Genotype, Tep4>EGFP, Hml-DsRed. WT: n=12; pntRNAi: n=10. (C) Depletion of pnt in Tep4+ progenitors has no effect on the number of progenitors. (D) Knockdown of pnt in Tep4+ progenitors does not affect the total lymph gland cell number. (E) Quantitation of data shown in Figure 4J–K. Depletion of pnt in domeMESO+ cells using pntRNAi does not affect the number of CCs (Hnt+). n=11. (F) Quantitation of data shown in Figure 4L–M. Genotype, CHIZ>mGFP (n=9). Depletion of pnt in CHIZ+ IPs using two independent pntRNAi constructs does not affect the number of CCs. CC, crystal cell.
Figure 5 with 4 supplements
Numb promotes non-canonical Notch/Sima signaling.
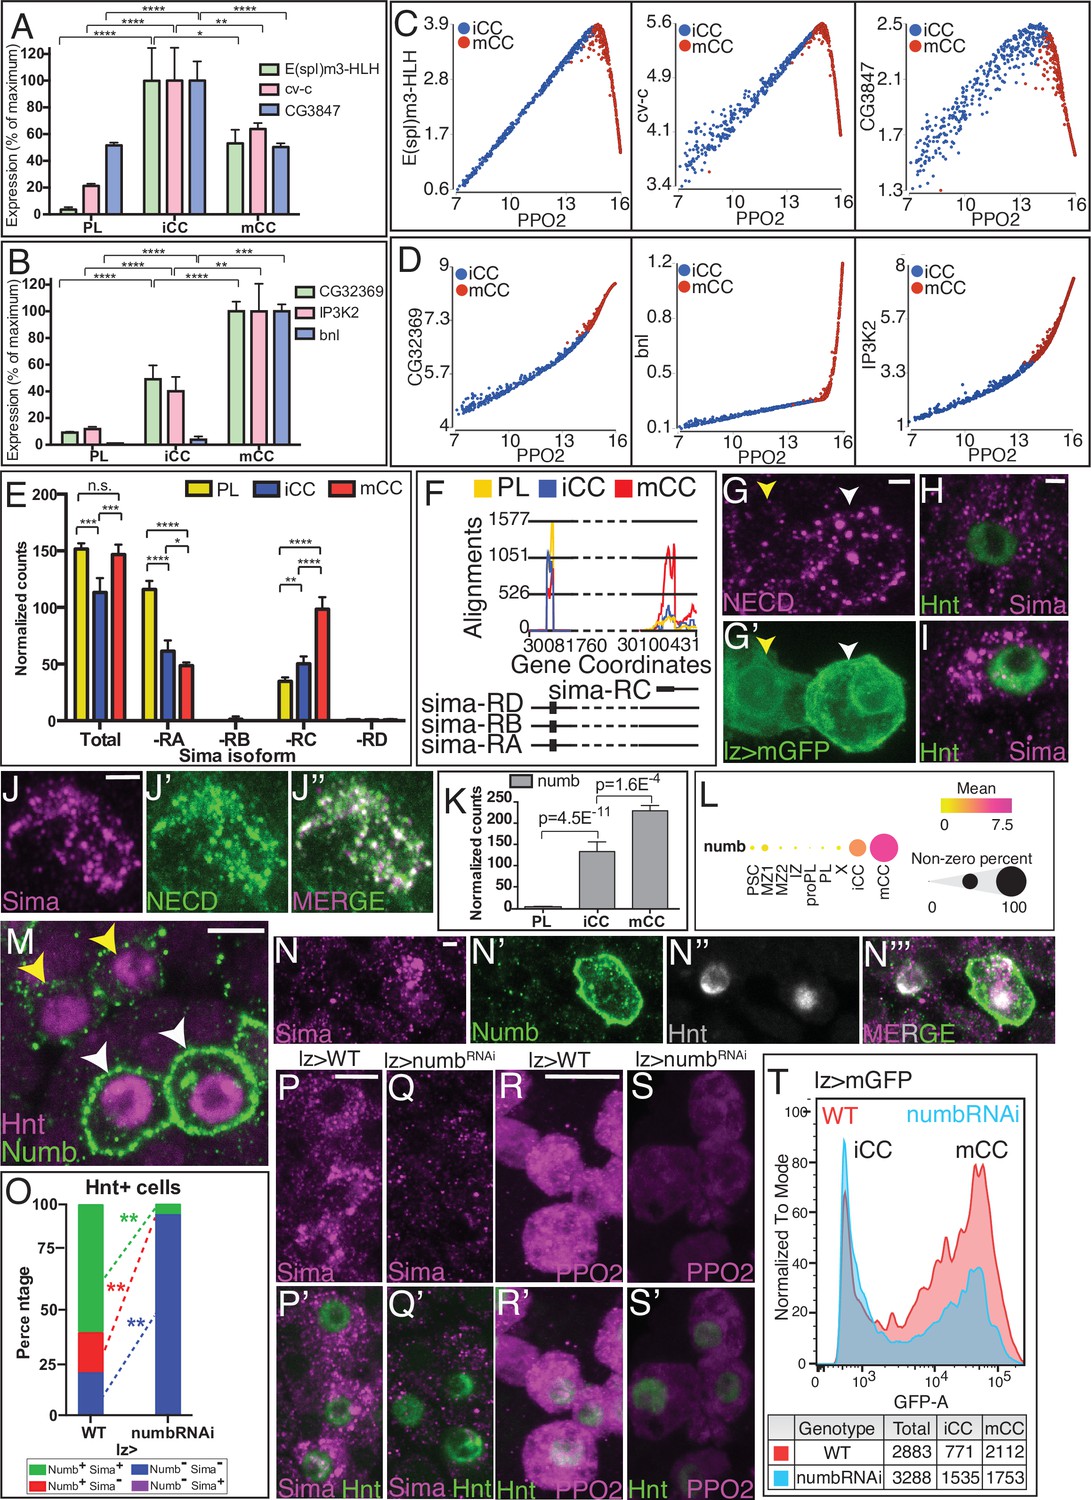
(A, B, E, F, K) are from bulk RNA-Seq whereas (C, D, L) are from single-cell RNA-Seq. (A) ‘Type I’ Notch targets with highest expression in iCC, lower in mCC, and lower still in PL. (B) ‘Type II’ Notch targets have their lowest expression in PLs, increase in iCCs, and are expressed highest in mCCs. (C) Type I Notch targets correlate positively with the CC maturity marker PPO2 in iCC and negatively in mCC. (D) Type II Notch targets correlate positively with PPO2 in both iCCs and with an even higher slope in mCCs. (E) Total sima transcript levels are similar in PL and mCC. The usually major splice variant, sima-RA decreases with CC maturity. The normally minor sima-RC isoform increases from PL to iCC and is higher still in mCC. (F) Alignment counts for an exon specific to sima-RC are highest in mCC (red). The FlyBase coordinates are in Figure 5—figure supplement 1D. (G–G’) Live internalization assay in lz-GAL4, UAS-mGFP lymph glands with an antibody against the extracellular domain of Notch (NECD, magenta) to visualize uptake and stabilization of full-length Notch protein. Large Notch punctae are specifically located in mCC (GFPHI; white arrowhead) but not in iCC (GFPLO; yellow arrowhead). (H, I) Protein staining for Hnt (green) and Sima (magenta) shows numerous large Sima punctae in mCC (I, high Hnt) but not in iCC (H, low Hnt). (J–J’’) Full-length endocytosed Notch protein is visualized in a live internalization assay with an antibody against NECD (green, J’) and then fixed and stained for Sima protein (magenta, J). Numerous large NECD and Sima punctae colocalize and therefore appear white in the merged image (J’’). (K) numb transcript level is minimal in PL, increases in iCC and further increases in mCC. (L) Dot plot showing the mean level of numb expression (indicated by dot color) and the percentage of cells that express numb in each population (indicated by dot size). Compared to all cells identified by scRNA-Seq, numb transcript levels are enriched in iCC and are even higher in mCC. (M) Strong Numb protein staining (green) is restricted to mCCs (white arrowheads), with stronger Hnt staining (magenta) and not in low Hnt-expressing iCCs (yellow arrowheads). (N–N’’’) Large Sima punctae (magenta) are only seen in Hnt (gray) positive crystal cells (CCs) with high Numb staining (green). (O) Quantitation of the data in (P–Q’) showing the percentage of Hnt+ CCs that are positive or negative for Sima and Numb in wild-type (WT) and upon knockdown of numb. No Numb negative Sima+ cells are evident in either genotype. Depletion of numb causes loss of nearly all Sima+CCs. n=221 total CCs from WT and n=111 CCs for numbRNAi. (P–P’) WT lymph glands display large Sima punctae (magenta) in Hnt+ (green) CCs. (Q–Q’) The large Sima punctae are eliminated when numb is depleted in CCs using lz-GAL4 UAS-numbRNAi. Quantitation in Figure 5—figure supplement 3F. (R–R’) PPO2 protein (magenta) is high in most Hnt+ (green) CCs in WT. (S–S’) PPO2 levels (magenta) are lower in Hnt+ (green) CCs when numb is depleted using lz-GAL4 UAS-numbRNAi. Quantitation in Figure 5—figure supplement 3I. (T) Flow cytometry shows that when numb is knocked down (Genotype: lz-GAL4 UAS-numbRNAi), a large proportion of the mCCs (GFPHI) are lost while the total number of CCs does not change significantly (2883 in WT vs. 3288 in numbRNAi). Scale bars: 2 μm in (G, H, J, N, P–Q’); 5 μm in (M, R–S’). See Figure 5—figure supplement 3 for lower magnification views of lymph glands shown in (P–S’). CC, crystal cell; iCC, immature crystal cell; mCC, mature crystal cell; PL, plasmatocyte.
Figure 5—figure supplement 1
Notch/Sima related gene expression in crystal cells (CCs).
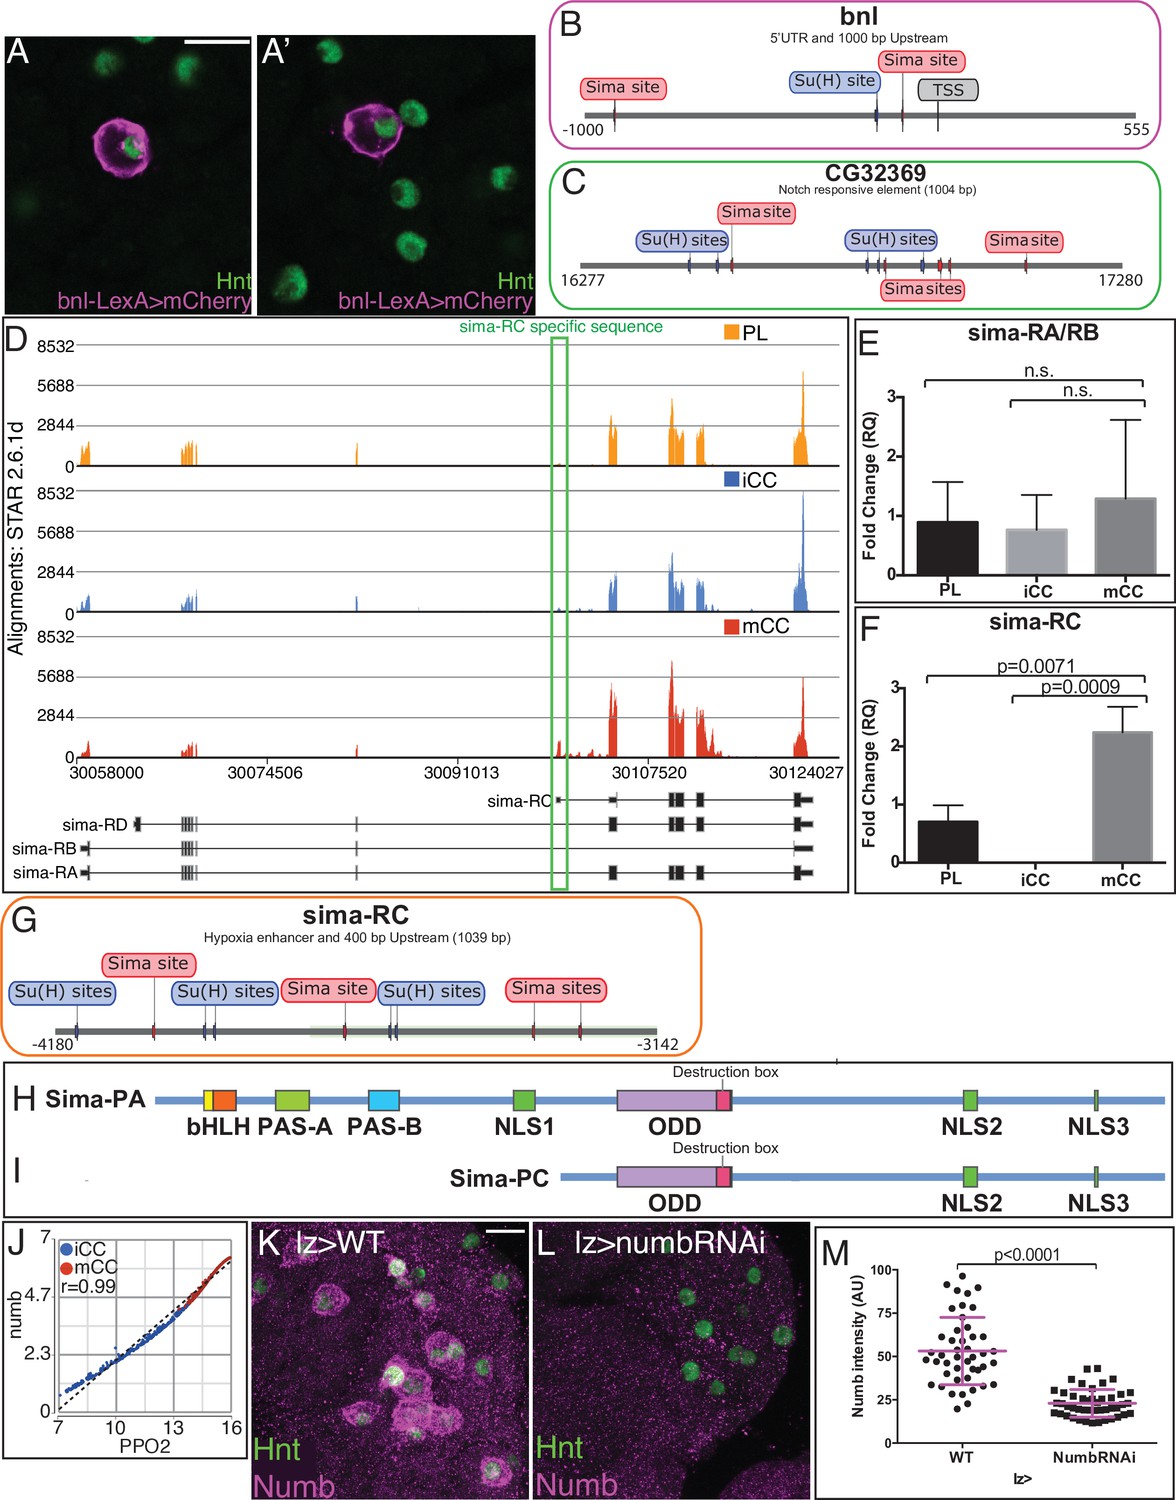
(A–A’) bnl-LexA driving mCherry (magenta) marks a subset of Hnt+ (green) CCs (two representative images shown). Scale bar: 10 μm. (B, C) Enhancer elements of Notch target genes based on published sequence analysis. TSS: transcription start site. All numbers are relative to TSS. (B) The bnl promoter region (5’ UTR and 1000 bp upstream of the TSS) (Du et al., 2017) shows potential Sima sites near potential Su(H) sites. (C) The validated Notch response element region of CG32369 (Terriente-Felix et al., 2013) shows multiple potential Sima and Su(H) binding sites. (D) sima gene model and predicted sima transcript isoforms from FlyBase r6.22 are indicated. sima-RC is specifically expressed in mCCs (lower track) with higher alignment counts than in PL (upper track) and iCCs (middle track) while sima-RA is highest in PL. (E–F) qRT-PCR assays on sorted PL and CC populations using isoform-specific primer sets for sima (n=3) show no difference in sima-RA/RB between PL and CC populations (E), while sima-RC is significantly higher in mCC than in iCC and PL (F). (G) The enhancer region of sima-RC (Kamps-Hughes et al., 2015) contains multiple Sima binding sites. Interestingly, several putative Su(H) binding sites are also found in this region. All numbers are relative to TSS. (H I) Schematic representation of predicted protein domains in Sima-PA (H) and Sima-PC (I). Sima-PC lacks the N-terminal bHLH and PAS domains required for DNA binding and dimerization with Tango, but retains the ODD domain that regulates protein stability under hypoxic conditions. (J) numb transcript levels strongly correlates with PPO2 (r=0.99) in iCCs and mCCs. (K–M) Genotype, lz-GAL4. Numb (magenta) and Hnt (green) protein in (K, L). Scale bar: 10 μm. (K) Wild-type. A subset of CCs expresses Numb protein. (L) Knockdown of Numb with UAS-NumbRNAi results in loss of Numb staining in CCs. (M) Quantification of the intensity of Numb protein staining in individual CCs. Depletion of numb significantly decreases the levels of Numb protein. n=45. CC, crystal cell; iCC, immature crystal cell; mCC, mature crystal cell; PL, plasmatocyte.
Figure 5—figure supplement 2
Numb levels are controlled by Notch signaling.
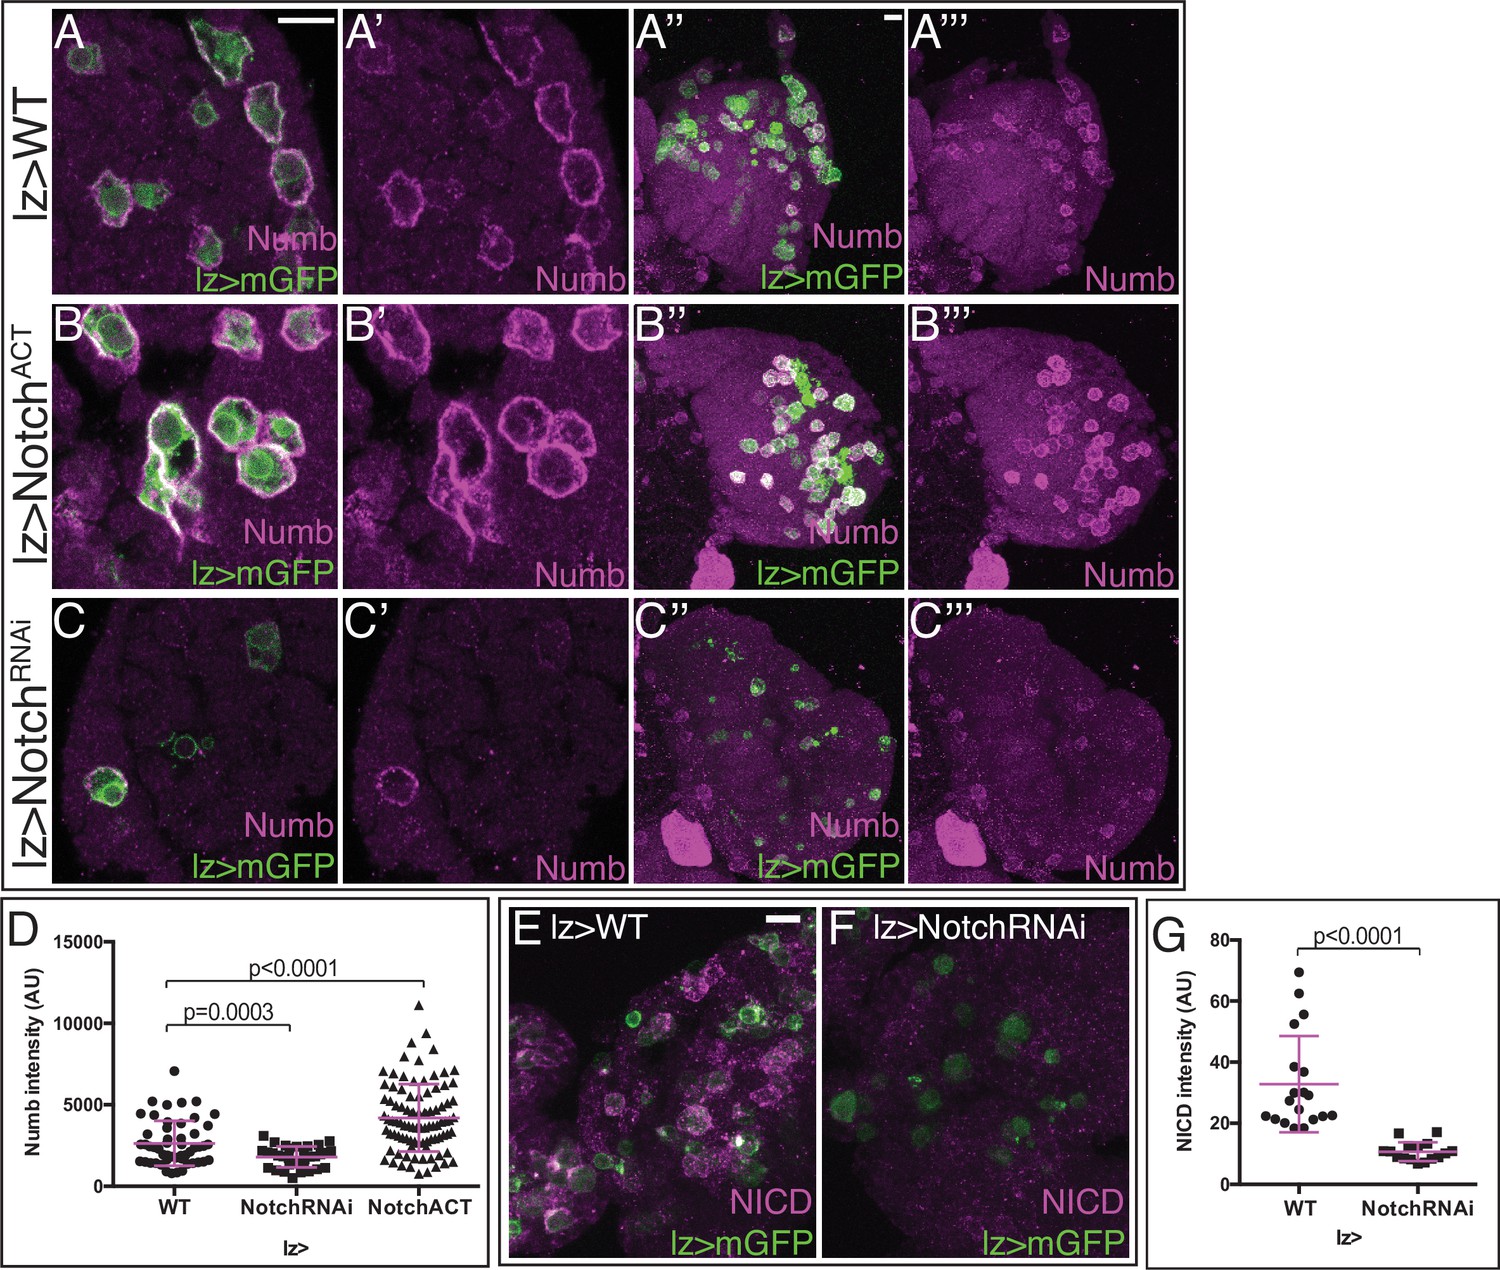
Genotype in (A–G): lz-GAL4, UAS-mGFP. Scale bars: 10 μm. (A–A’’’) Wild-type (WT). Numb (magenta) is expressed at moderate levels in many lz-GAL4, UAS-mGFP expressing crystal cells (CCs) (green). (B–B’’’) Overactivation of Notch signaling with lz-GAL4, UAS-NotchACT greatly increases Numb levels (magenta) in CCs (green). (C–C’’’) Loss of Notch signaling with UAS-NotchRNAi both decreases the number of CCs (green) and decreases Numb levels (magenta) in the remaining CCs. (D) Quantification of Numb intensity in individual CCs from genotypes shown in (A–C’’’) shows a statistically significant increase in Numb intensity when NotchACT is driven in CCs using lz-GAL4, whereas lz>NotchRNAi causes a significant decrease in Numb intensity in the CCs that remain in this background. WT: n=51; NotchRNAi: n=34; NotchACT: n=92. (E–G) NotchICD (magenta) expression decreases in individual CCs when NotchRNAi (F) is expressed in lz>mGFP+ CCs (green) compared with WT (E). (G) Quantitation of the data in (E, F). WT: n=19; NotchRNAi: n=16.
Figure 5—figure supplement 3
Numb promotes Notch/Sima signaling and crystal cell (CC) maturity.
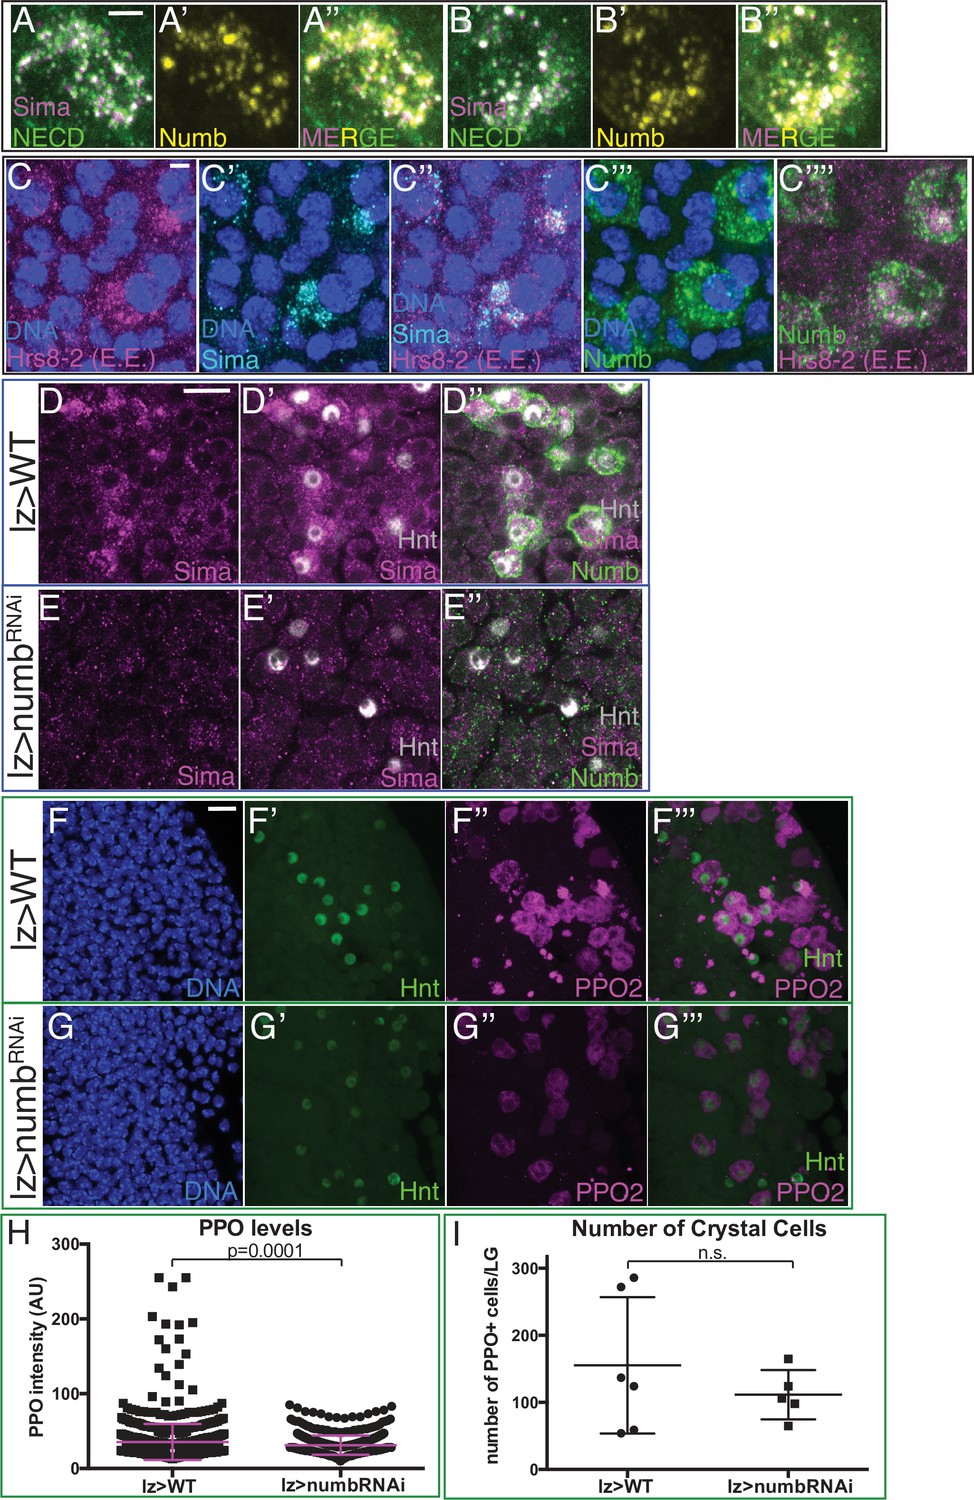
(A–B”) Two representative examples of cells showing co-localization of Numb punctae (yellow; (A’–A’’) and (B’–B’’)) with Sima (magenta) and NECD (green). Punctae appear white in (A) and (B) due to colocalization of magenta and green. (C–C’’’’) Large Sima punctae (cyan) colocalize with Hrs8-2 positive early endosomes (EE; magenta) in Numb+ CCs (green). DNA (blue). (A–C’’’’) Scale bar: 2 μm. (D–I) Genotype, lz-GAL4. (D–D”) Large Sima punctae (magenta) in Numb+ (green) Hnt+ (gray) CCs (CCs) are seen in wild-type (WT) lymph glands. (E–E’’) Sima punctae are virtually eliminated when numb is depleted in CCs with lz-GAL4 driving UAS-numbRNAi. (F–F’’’) PPO2 levels (magenta) are high in most Hnt+ (green) CCs in WT. (G–G’’’) PPO2 decreases in Hnt+ CCs upon depletion of numb. (D–G’’’) Scale bar: 10 μm. Lower magnification views of data from Figure 5P–Q’ (shown in D–E’’) and Figure 5R-S' (shown in F-–G’’’). (H) Quantitation of data shown in Figure 5 showing PPO2 levels in individual CCs. Virtually all high PPO2 expressing CCs are lost upon depletion of numb in lz-GAL4; UAS-numbRNAi. WT: n=923; numbRNAi: n=558. (I) Quantitation of data shown in Figure 5 showing the total number of PPO2+ CCs per lymph gland primary lobe does not change with numbRNAi. WT: n=6; numbRNAi: n=5.
Figure 5—figure supplement 4
Flow cytometric analysis of CC subclasses from lz-GAL4 (control) and lz-GAL4, UAS-numbRNAi lymph glands.
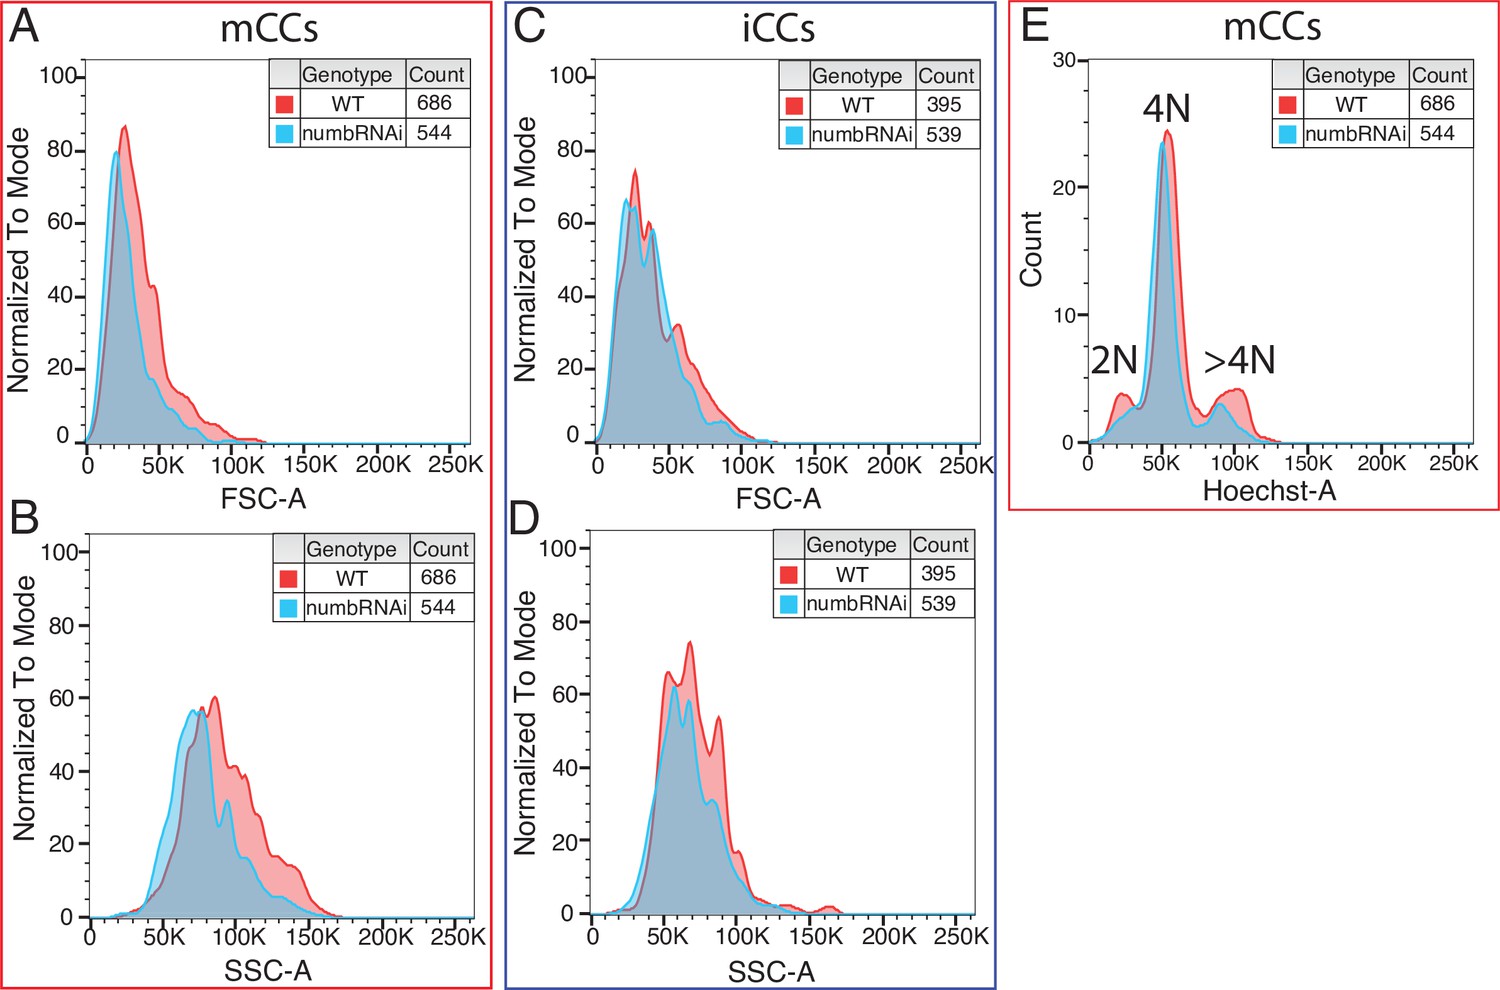
(A, B) Depletion of numb decreases cell size (forward scatter; FSC-A; A) and cellular complexity (side scatter; SSC-A; B) of mCCs. (C, D) Loss of numb does not change cell size (C) or cellular complexity (D) of iCCs. (E) The number of mCCs with >4N DNA content is reduced upon numbRNAi expression. CC, crystal cell; iCC, immature crystal cell.
Figure 6 with 1 supplement
Musashi (Msi) regulates Numb protein levels.
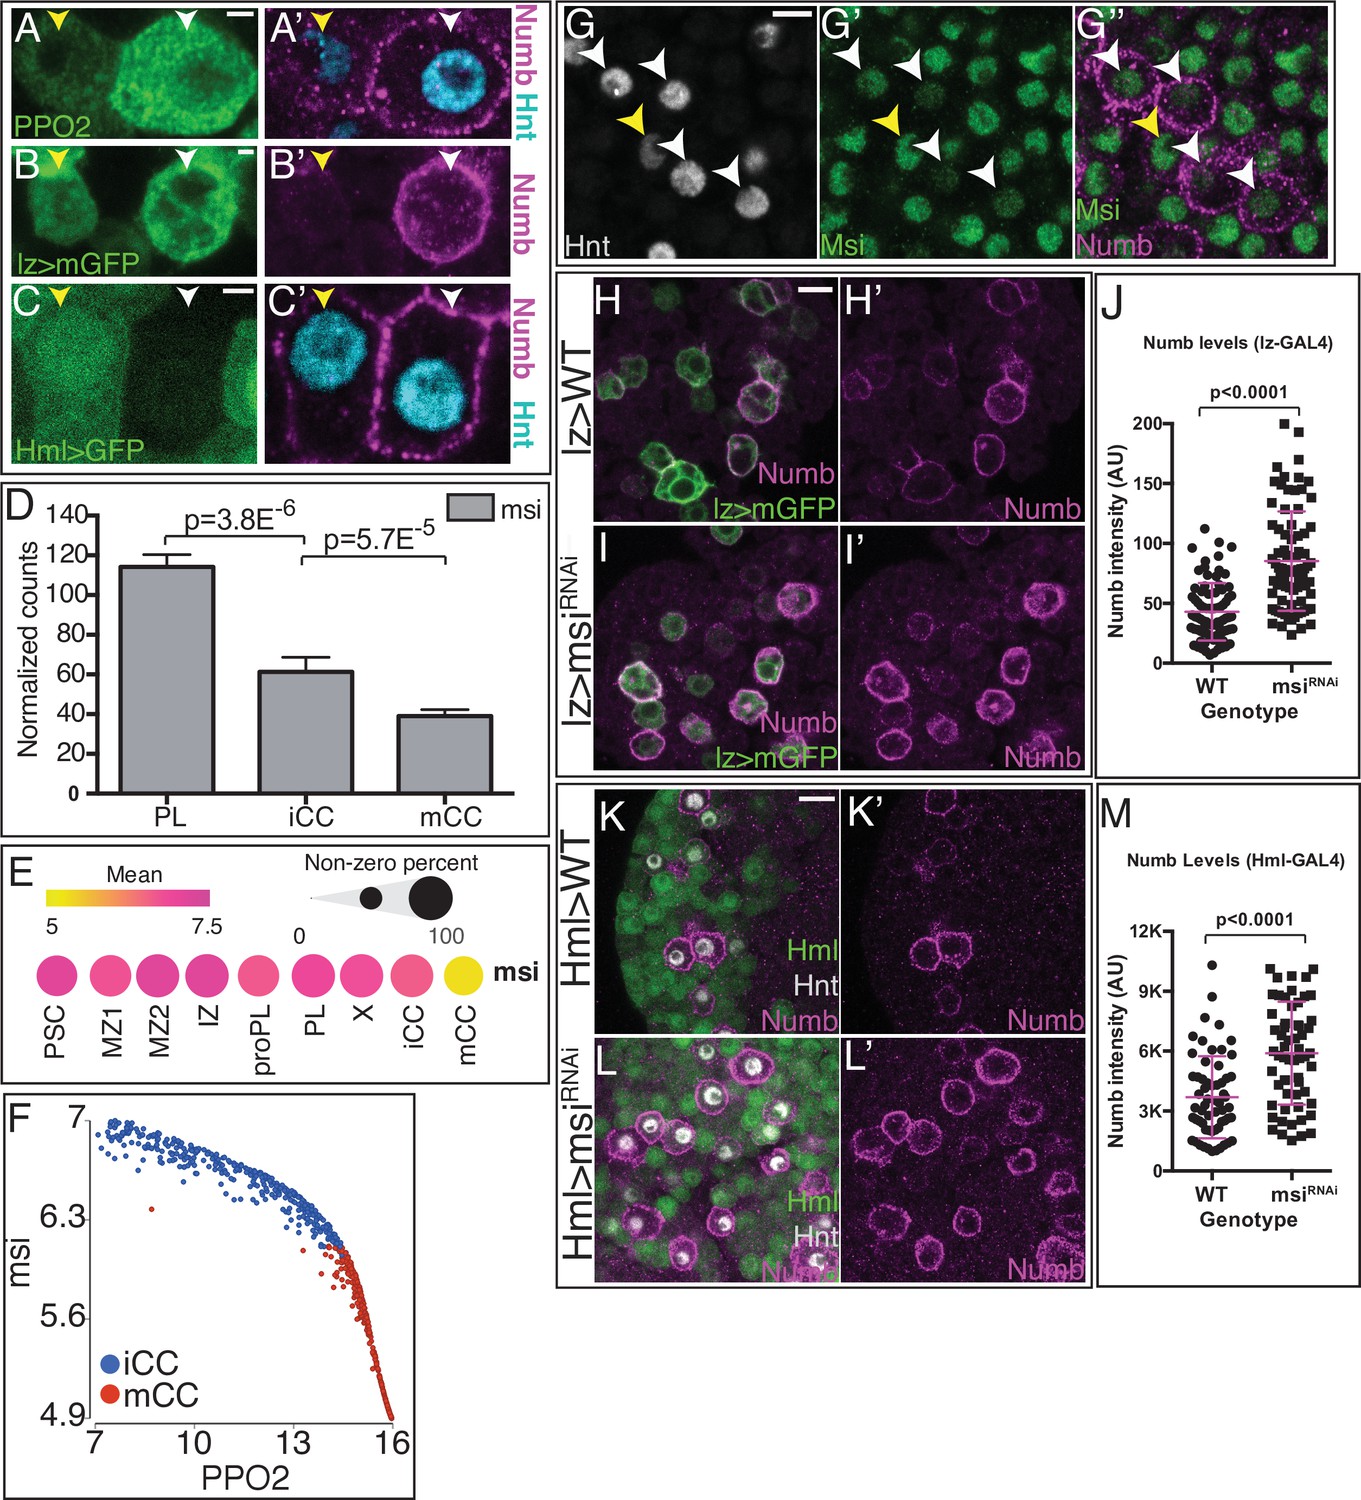
(A–C’) Three independent criteria distinguish iCCs from mCCs and validate Numb expression. A pair of cells is shown in each panel, and for each, the one on the left (yellow arrowhead) is iCC and the one on the right (white arrowhead) is mCC by the described criteria. (A–A’) iCC is low in Hnt (cyan) and PPO2 (green), whereas mCC is high for both. Numb (magenta) is only seen in mCCs. (B–B’) iCC is low and mCC high in lz> mGFP expression. Numb (magenta), is only seen in mCCs. (C–C’) iCC expresses and mCC is negative for HmlΔ>GFP (green) expression. Hnt (cyan) is lower in iCC than in mCC. Numb (magenta) is only detected in mCCs. (D) Bulk RNA-Seq shows msi transcript levels decrease with crystal cell (CC) maturity from PL to iCC to mCC. (E) Mean level of msi expression (indicated by dot color) and the percentage of cells that express msi in each population (indicated by dot size) are represented in a dot plot. scRNA-Seq shows reasonably uniform msi transcript level in all lymph gland cells with the exception of mCCs in which msi transcript is much lower. (F) msi expression negatively correlates with PPO2 levels in iCC and mCC populations. (G–G”) CCs (Hnt+; gray) with low levels of the fusion protein Msi-GFP (green; white arrowheads) have high Numb staining (magenta), indicating that they are mCCs. iCC with low Hnt staining (yellow arrowhead) shows higher levels of Msi-GFP and no Numb protein. (H–J) Genotype, lz-GAL4, UAS-mGFP. Numb (magenta) is expressed at moderate levels in wild-type (WT) lz>mGFP+ CCs (H–H’) and increases significantly with lz-GAL4, UAS-msiRNAi (I–I’). Quantitation of Numb levels in individual crystals, n=80 (J). (K–M) CCs are visualized with Hnt (gray) and HmlΔ-GAL4, UAS-2xEGFP is used as a driver. In WT (K–K’) HmlΔ>GFP positive cells (green) do not show high levels of Numb protein (magenta). Whereas upon expression of UAS-msiRNAi (L–L’), Numb protein greatly increases. Data quantitating Numb levels in individual CCs, n=60 (M). All images are single confocal slices. See Figure 6—figure supplement 1 for lower magnification views of lymph glands shown in (G–G’’, H–I’, K–L’). Scale bars: (A–C), 2 μm; (G), 5 μm; (H I, K, L), 10 μm. iCC, immature crystal cell; mCC, mature crystal cell; PL, plasmatocyte.
-
Figure 6—source data 1
Source data for Figure 6D, J and M and Figure 6—figure supplement 1G.
- https://cdn.elifesciences.org/articles/67516/elife-67516-fig6-data1-v2.xlsx
Figure 6—figure supplement 1
Numb protein level is controlled by Musashi.
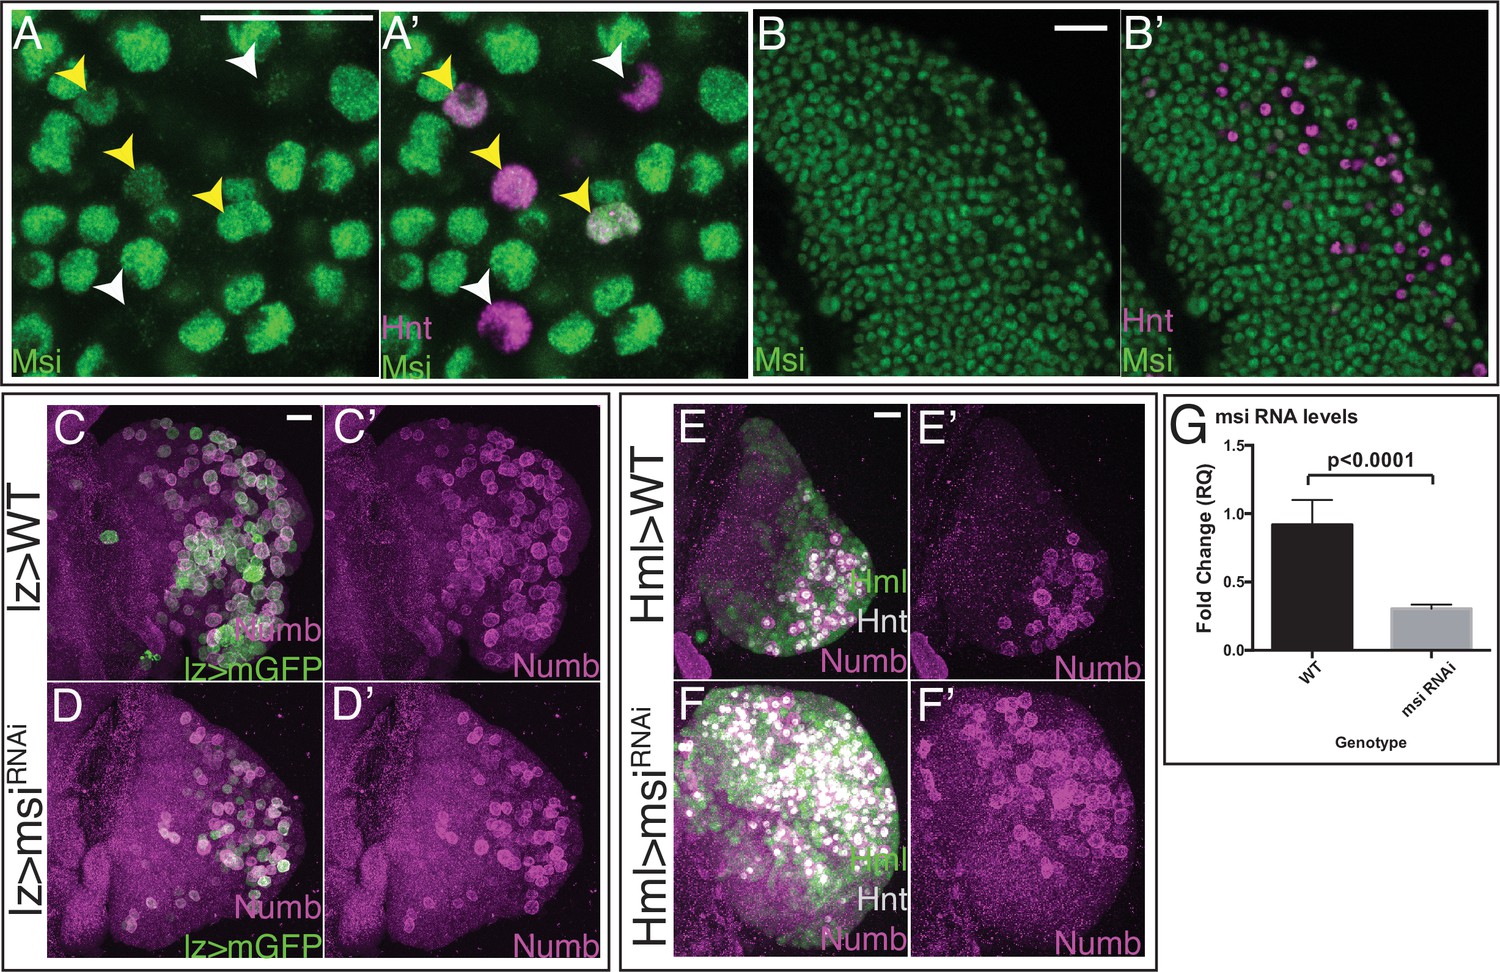
(A–B’) Wild-type (WT) lymph gland expressing GFP-tagged Msi (green) and stained for Hnt (magenta) shows that Msi is high in most cells, except in a subset of CCs with the highest Hnt levels (white arrowheads). Yellow arrowheads denote Hnt+ CCs with high Msi-GFP. Shown in high (A, A’) and low (B, B’) magnification. (C–F’) Lower magnification view showing middle third maximum intensity projections of the entire lymph gland primary lobes from Figure 6H (shown in C–C’); Figure 6I (shown in D–D’); Figure 6K (shown in E–E’); and Figure 6L (shown in F–F’). Scale bars: 20 μm. (G) qPCR results demonstrate a statistically significant drop in msi transcript levels in msiRNAi relative to WT (n=6). CC, crystal cell.
Figure 7
Summary of markers, case studies, and a model for the developmental progression of lymph gland cells.
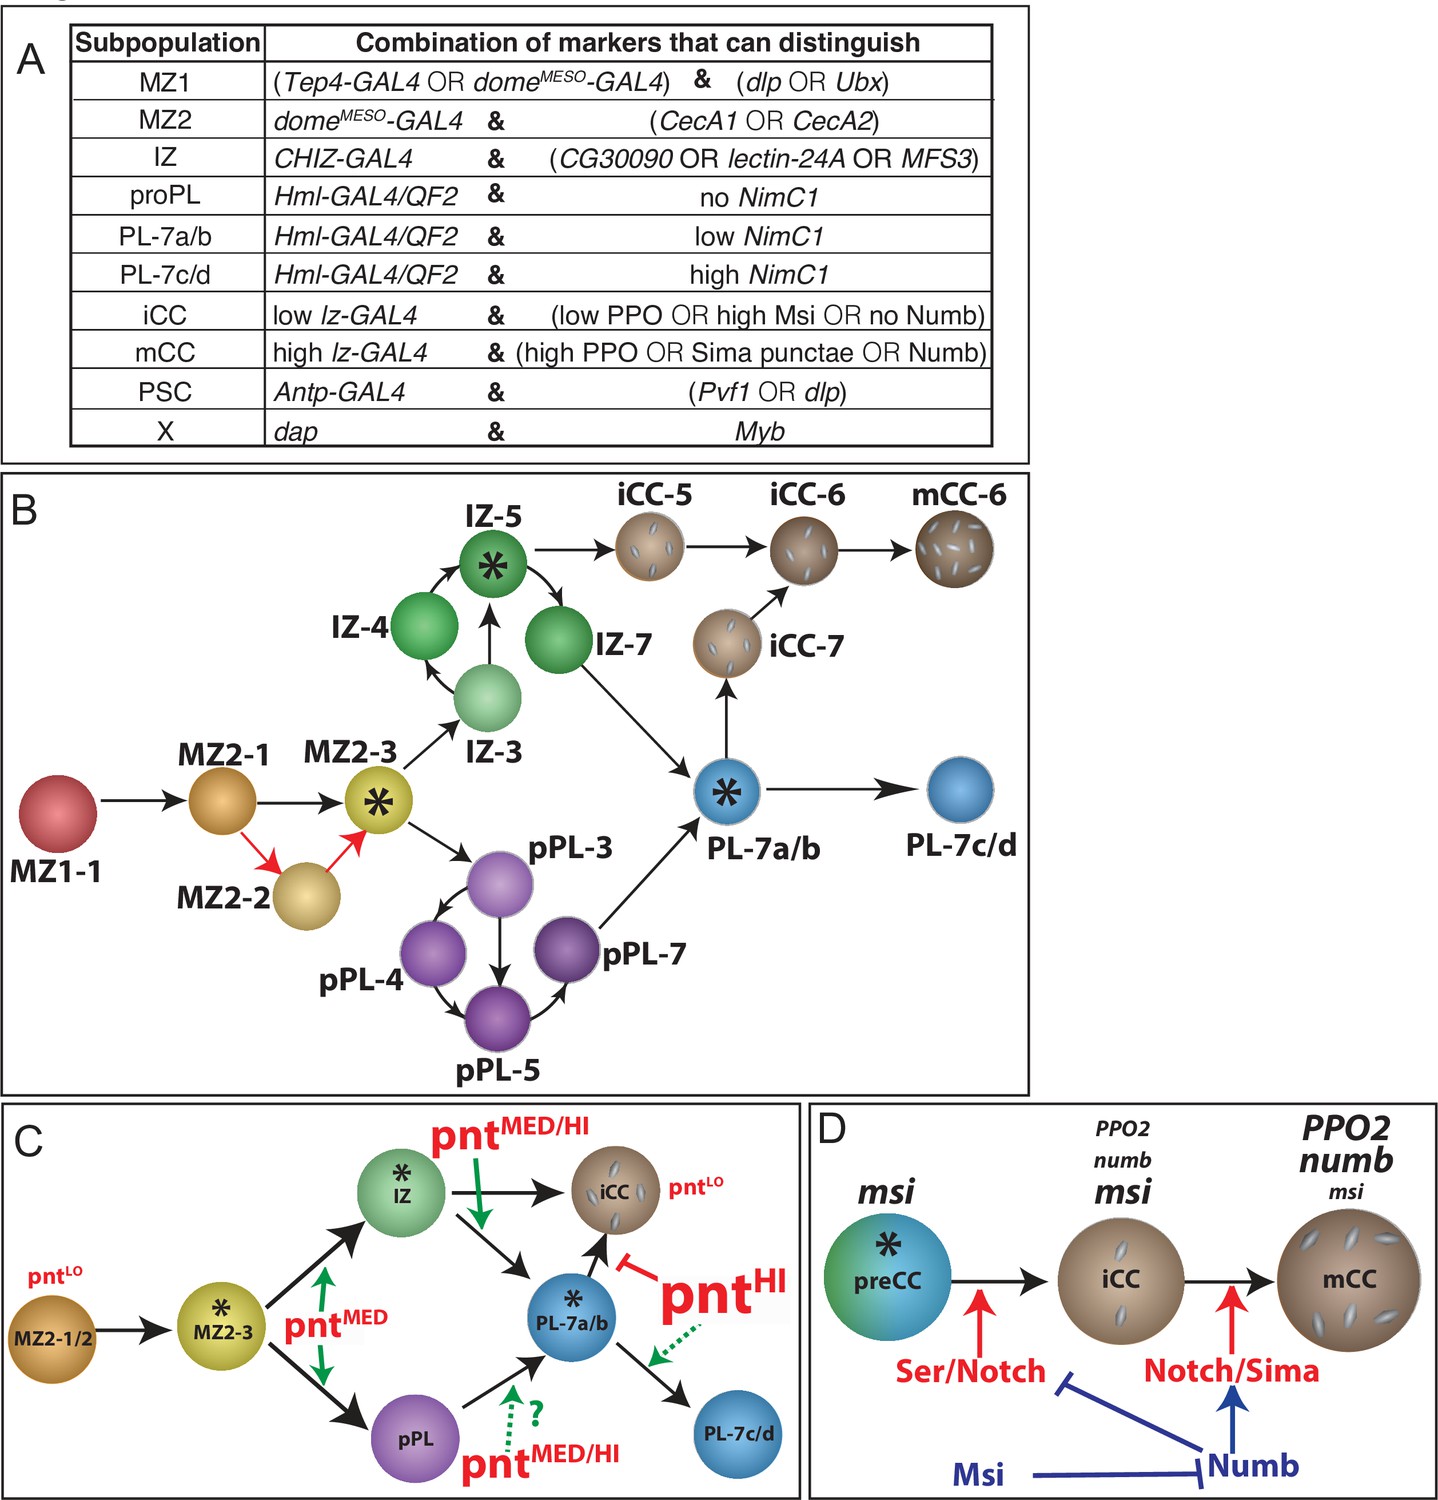
(A) Table showing representative combinations of markers that can be used to distinguish between the subpopulations of cells identified in this study. Markers specific to any one cell type or cluster are rare. The entire transcriptome contributes to cellular identities. The combinations listed here are useful identifiers of the subpopulations. Alternative marker combinations are separated by ‘OR.’ (B–D) LG developmental models. Nodes at which cells make alternate fate choices (FCs) are marked by asterisks. (B) A model demonstrating the complexity and developmental progression of cell types within the Drosophila lymph gland (see Discussion for details). PSC cells (not shown) have a developmental origin distinct from the rest of the primary lobe cells. The medullary zone (MZ) cells are found in clusters MZ1 (earliest in pseudotime state 1) and MZ2. The most mature subpopulation within the progenitors is MZ2-3, which is an FC point that leads to two alternate transitional zones IZ and proPL (pPL), each replete with its own set of temporally distinct states. IZ-5 is the second FC node that allows either a plasmatocyte (PL) or a CC fate choice. The third FC node is at PL-7a/b, a state where a choice between a CC fate is weighed against maturation to a terminally differentiated PL. Additional minor paths and variations thereof are discussed in the text. The model emphasizes flexibility as its central feature that is characterized by transitional and alternate paths connecting progenitors to differentiated cells. These routes are specified by gradual trends and combinations of gene expression rather than by quantal transitions between cell types maturing towards common or distinct fates. (C) Context-specific function of Pnt is determined by its graded expression pattern that increases progressively from low (pntLO) in the early MZ2-1/2, to medium (pntMED) in the later MZ2-3 progenitors. Pnt plays a role, indicated by green arrows, in differentiation of MZ2-3 progenitors into either the IZ or proPL (pPL) cell types. Transcript levels for pnt are higher in IZ/proPL (designated MED/HI) than in the MZ. Its function is required for both the entry into and exit from the IZ state. High levels of Pnt (pntHI) promote PL fate and inhibit CC formation. (D) A combination of results from bulk and scRNA-Seq, flow cytometry, and in vivo genetics is used here to depict the mechanism by which canonical and non-canonical Notch signaling define CC fate. Precursors of CCs (preCC) receive a Serrate-dependent canonical Notch signal to be specified as iCCs. The RNA-binding protein Musashi (Msi), expressed in all preCCs and iCCs, inhibits Numb translation, allowing canonical Notch signaling. Msi is not expressed in mCCs (we speculate it is repressed by high Lz), and therefore Numb is expressed in these cells. This allows a non-canonical ligand-independent Sima-PC/Notch signal while inhibiting any residual Ser-dependent canonical Notch signaling in the mature CCs. CC, crystal cell; iCC, immature crystal cell; IZ, intermediate zone; mCC, mature crystal cell.
Videos
Video 1
Movie of three-dimensional (3D) t-SNE visualization of scRNA-Seq data showing the same nine lymph gland populations and color scheme shown in Figure 1J.
In 3D, the IZ and proPL clusters are on separate planes that are largely non-adjacent to each other. However, both IZ and proPL each have adjacencies to the MZ2 and PL clusters.
Tables
Key resources table
| Reagent type (species) or resource | Designation | Source or reference | Identifiers | Additional information |
|---|---|---|---|---|
| Genetic reagent (Drosophila melanogaster) | domeMESO>GFP HmlΔ-DsRed | Banerjee Lab | domeMESO-GAL4, UAS-EGFP, HmlΔ-DsRed | |
| Genetic reagent (D. melanogaster) | lz-GAL4 | Gift from John Pollock, Lebestky et al., 2000 | ||
| Genetic reagent (D. melanogaster) | domeMESO-GFP.nls, HmlΔ-DsRed.nls | Banerjee Lab, Makhijani et al., 2011 | Recombinant of dmGFPnls (Banerjee Lab) and HmlDsRednls (Brückner Lab) | |
| Genetic reagent (D. melanogaster) | domeMESO-EBFP2 | Banerjee Lab, Evans et al., 2014 | ||
| Genetic reagent (D. melanogaster) | CHIZ-GAL4, UAS-mGFP | Banerjee Lab, Spratford et al., 2020 | IZ-specific split GAL4 | |
| Genetic reagent (D. melanogaster) | Tep4>GFP HmlΔ-DsRed | Banerjee Lab | Recombinant of Tep4-GAL4,UAS-EGFP, HmlΔ-DsRed | |
| Genetic reagent (D. melanogaster) | Tep4-QF2 G4H | This study | Tep4-GAL4 NP7374 line (DGRC Kyoto) was converted to QF2 using the HACK method (Lin and Potter, 2016) | |
| Genetic reagent (D. melanogaster) | HmlΔ>2xEGFP | Banerjee Lab | Recombinant of HmlΔ-GAL4, UAS-2xEGFP | |
| Genetic reagent (D. melanogaster) | UAS-NotchACT | Gift from Dr. Artavanis-Tsakonas, Artavanis-Tsakonas et al., 1999 | ||
| Genetic reagent (D. melanogaster) | lz-Gal4, UAS-mGFP | Bloomington Drosophila Stock Center | BDSC:6314RRID:BDSC_6314 | |
| Genetic reagent (D. melanogaster) | UAS-pntRNAi | Bloomington Drosophila Stock Center | BDSC:35038RRID:BDSC_35038 | |
| Genetic reagent (D. melanogaster) | UAS-pntRNAi | Bloomington Drosophila Stock Center | BDSC:31936RRID:BDSC_31936 | |
| Genetic reagent (D. melanogaster) | UAS-hepACT | Bloomington Drosophila Stock Center | BDSC:9306RRID:BDSC_9306 | |
| Genetic reagent (D. melanogaster) | UAS-mihep | Bloomington Drosophila Stock Center | BDSC:35210RRID:BDSC_35210 | |
| Genetic reagent (D. melanogaster) | UAS-numbRNAi | Bloomington Drosophila Stock Center | BDSC:35045RRID:BDSC_35045 | |
| Genetic reagent (D. melanogaster) | LexAop2-6XmCherry | Bloomington Drosophila Stock Center | BDSC:52271RRID:BDSC_52271 | |
| Genetic reagent (D. melanogaster) | UAS-NotchRNAi | Bloomington Drosophila Stock Center | BDSC:7077RRID:BDSC_7077 | |
| Genetic reagent (D. melanogaster) | Msi-GFP | Bloomington Drosophila Stock Center | BDSC:61750RRID:BDSC_61750 | MiMIC protein trap |
| Genetic reagent (D. melanogaster) | HmlΔ-QF2 | Bloomington Drosophila Stock Center | BDSC:66468RRID:BDSC_66468 | |
| Genetic reagent (D. melanogaster) | 10XQUAS-6XmCherry | Bloomington Drosophila Stock Center | BDSC: 52269RRID:BDSC_52269 | |
| Genetic reagent (D. melanogaster) | bnl-LexA | Gift from Dr. Roy, Du et al., 2017 | ||
| Genetic reagent (D. melanogaster) | UAS-msiRNAi, UAS-Dcr2 | Gift from Dr. Wappner, Bertolin et al., 2016 | ||
| Genetic reagent (D. melanogaster) | HmlΔ-DsRednls | Gift from Dr. Brückner, Makhijani et al., 2011 | ||
| Genetic reagent (D. melanogaster) | UAS-PvrRNAi | Gift from Dr. Shilo, Rosin et al., 2004 | ||
| Antibody | Anti-Notch extracellular domain (NECD) (Mouse monoclonal) | Developmental Studies Hybidoma Bank (DSHB) | Cat# ABS571, RRID:AB_528408 | IF(1:50) |
| Antibody | Anti-Hrs 8-2 (Mouse monoclonal) | Developmental Studies Hybidoma Bank (DSHB) | Cat#, Hrs 8-2 RRID:AB_722114 | IF(1:100) |
| Antibody | Anti-MMP1 (Mouse monoclonal) | Developmental Studies Hybidoma Bank (DSHB) | Cat#3B8D12,RRID:AB_579781; 3A6B4, RRID:AB_579780; and 5H7B1RRID:AB_579779, | IF(1:100 of a 1:1:1 mixture of 3B8D12, 3A6B4 and 5H7B1) |
| Antibody | Anti-Hnt(Mouse monoclonal) concentrate | Developmental Studies Hybidoma Bank (DSHB) | Cat#1G9-c,RRID:AB_528278 | IF(1:200) |
| Antibody | Anti-P1(Mouse monoclonal) | Gift from Dr. Ando, Kurucz et al., 2007 | IF(1:100) | |
| Antibody | Anti-PPO2(Rabbit polyclonal) | Gift from Dr. Asano, Asano and Takebuchi, 2009 | IF(1:200) | |
| Antibody | Anti-Numb(Guinea pig polyclonal) | Gift from Jan lab, Roegiers et al., 2001 | IF(1:200) | |
| Antibody | Anti-Numb(Rabbit polyclonal) preabsorbed | Gift of Jan lab, Rhyu et al., 1994 | IF(1:200) | |
| Antibody | Anti-Sima(Guinea pig polyclonal) | Banerjee Lab, Wang et al., 2016Rhyu et al., 1994 | preabsorbed; IF(1:100) | |
| Sequence-based reagent | Sima-RA/RB_F | This study | PCR primers | GCAGAACTTCAAGGTGCAATAA |
| Sequence-based reagent | Sima-RA/RB_R | This study | PCR primers | CACCGTTCACCTCGATTAACT |
| Sequence-based reagent | sima-RC_F | This study | PCR primers | GAGGCGCACTAGTGACAAA |
| Sequence-based reagent | sima-RC_R | This study | PCR primers | CGAGCGAGATAGCAACGG |
| Sequence-based reagent | msi_F | FlyPrimerBank | PP29850 | ACGTCGTCTGACAAGCTCAAG |
| Sequence-based reagent | msi_R | FlyPrimerBank | PP29850 | GAATGTGATGAAACCAAAGCCG |
Additional files
-
Supplementary file 1
Differentially expressed genes in scRNA-Seq data.
- https://cdn.elifesciences.org/articles/67516/elife-67516-supp1-v2.xlsx
-
Supplementary file 2
Comparison of clusters from this study with those identified as clusters by Cho et al., 2020.
- https://cdn.elifesciences.org/articles/67516/elife-67516-supp2-v2.pdf
-
Supplementary file 3
Differentially expressed genes in bulk RNA-Seq data.
- https://cdn.elifesciences.org/articles/67516/elife-67516-supp3-v2.xls
-
Supplementary file 4
Gene lists used in this study for AUCell analysis.
- https://cdn.elifesciences.org/articles/67516/elife-67516-supp4-v2.xlsx
-
Transparent reporting form
- https://cdn.elifesciences.org/articles/67516/elife-67516-transrepform1-v2.pdf
Download links
A two-part list of links to download the article, or parts of the article, in various formats.
Downloads (link to download the article as PDF)
Open citations (links to open the citations from this article in various online reference manager services)
Cite this article (links to download the citations from this article in formats compatible with various reference manager tools)
Paths and pathways that generate cell-type heterogeneity and developmental progression in hematopoiesis
eLife 10:e67516.
https://doi.org/10.7554/eLife.67516


