The structure of photosystem I from a high-light-tolerant cyanobacteria
- School of Molecular Sciences, Arizona State University, United States
- BiodesignCenter for Applied Structural Discovery, Arizona State University, United States
- Department of Chemistry, Purdue University, United States
- John M. Cowley Center for High Resolution Electron Microscopy, Arizona State University, United States
Figures
Figure 1
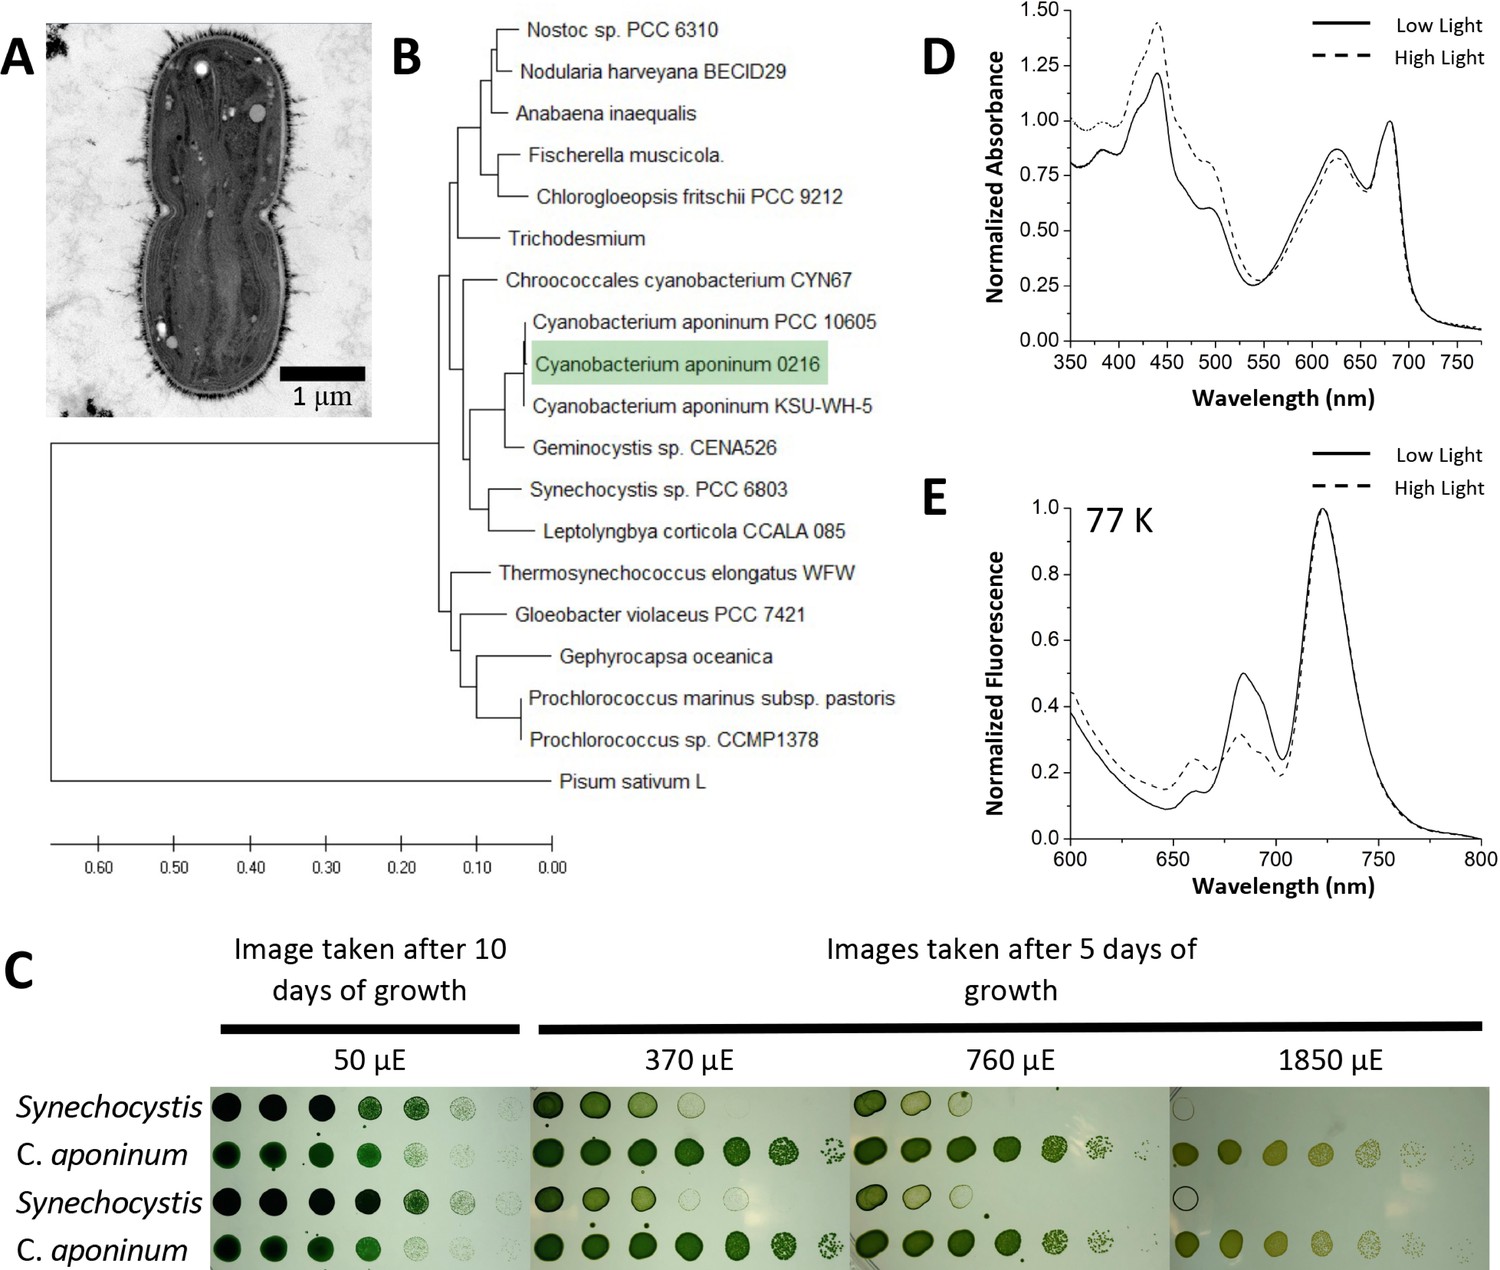
Isolation of a high-light-tolerant cyanobacteria.
(A) Cross-sectional negative stained image of C. aponinum fixed in acrylic medium. (B) Phylogenetic analysis based on C. aponinum 16 S rRNA. Evolutionary analyses were conducted in MEGA7. (C) Serial dilutions of Synechocystis and C. aponinum on BG11 plates. Cells were serially diluted in ¼ steps and incubated at 30°C for 5 days (light intensities > 370 µmol photons m–2s–1) and 10 days (light intensity = 50 µmol photons m–2s–1) (D) in vivo absorption spectra (normalized to the max wavelength of the Qy transition) of C. aponinum cells grown in low light (45 µmol photons m–2s–1) and high light (450 µmol photons m–2s–1). (E) 77 K fluorescence spectra (normalized to the max emission wavelength) of whole cells excited at 440 nm.
-
Figure 1—source data 1
Source data for Figure 1.
- https://cdn.elifesciences.org/articles/67518/elife-67518-fig1-data1-v2.zip
Figure 2 with 1 supplement
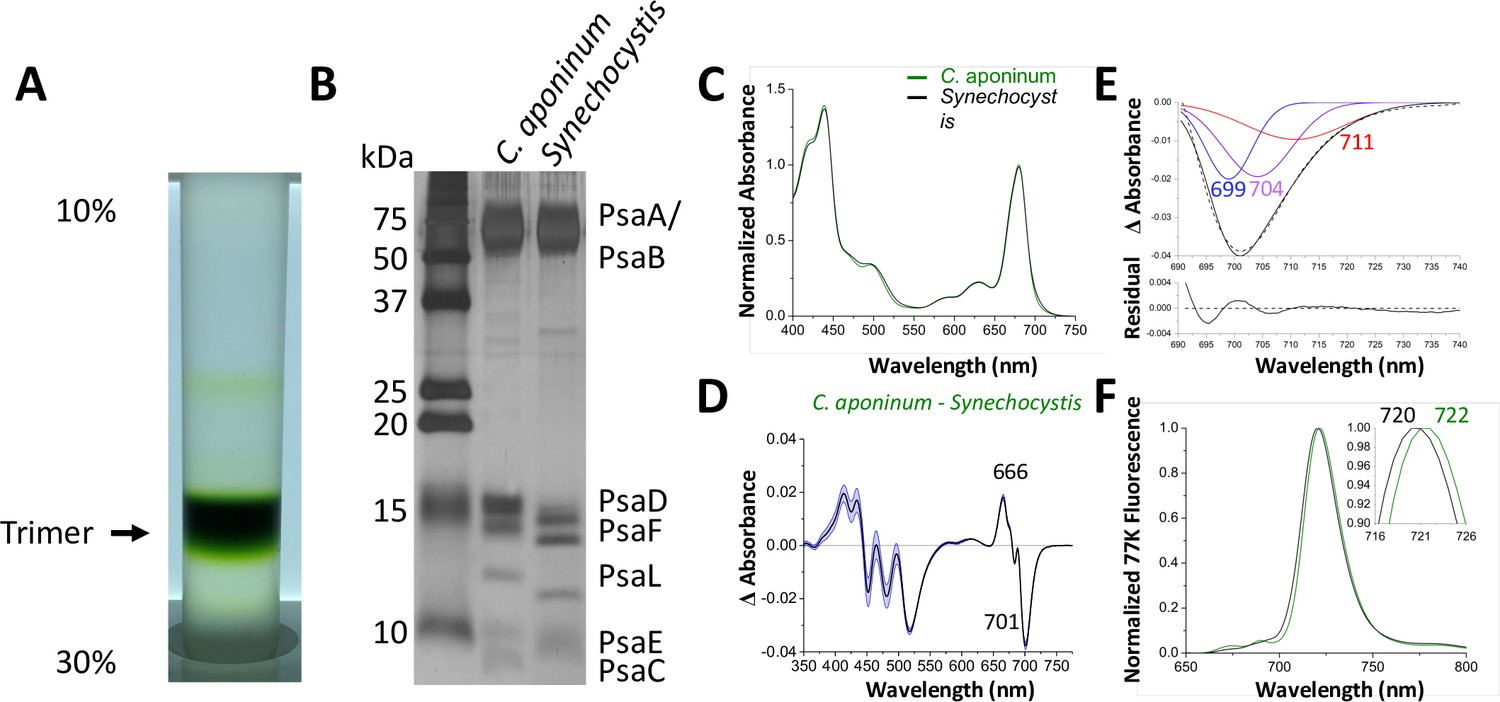
Isolation and characterization of trimeric PSI.
(A) Ten percent to 30% sucrose gradient of solubilized C. aponinum membranes following an anion exchange chromatography. (B) SDS–PAGE of the main sucrose gradient band (Trimer) compared to PSI isolated from Synechocystis. A notable difference between the PsaL bands is clearly observable around 13 kD. (C) Absorption spectra of the purified trimer of C. aponinum (green) and Synechocystis (black) normalized to the area between 550 and 775 nm (D) Difference of the C. aponinum – Synechocystis absorbance spectra, shown are averages of three biological replicas, blue edges indicate± SD. (E) The negative peak at 701 nm of the absorbance difference spectrum (dashed black line) is fitted to a sum of three gaussian components colored blue, purple, and red with the sum as a solid black line and the residual of the fit (F) 77 K fluorescence of C. aponinum (green) and Synechocystis (black) using an excitation wavelength of 440 nm. Samples were normalized to their max peak.
-
Figure 2—source data 1
Source data for Figure 2.
- https://cdn.elifesciences.org/articles/67518/elife-67518-fig2-data1-v2.zip
Figure 2—figure supplement 1
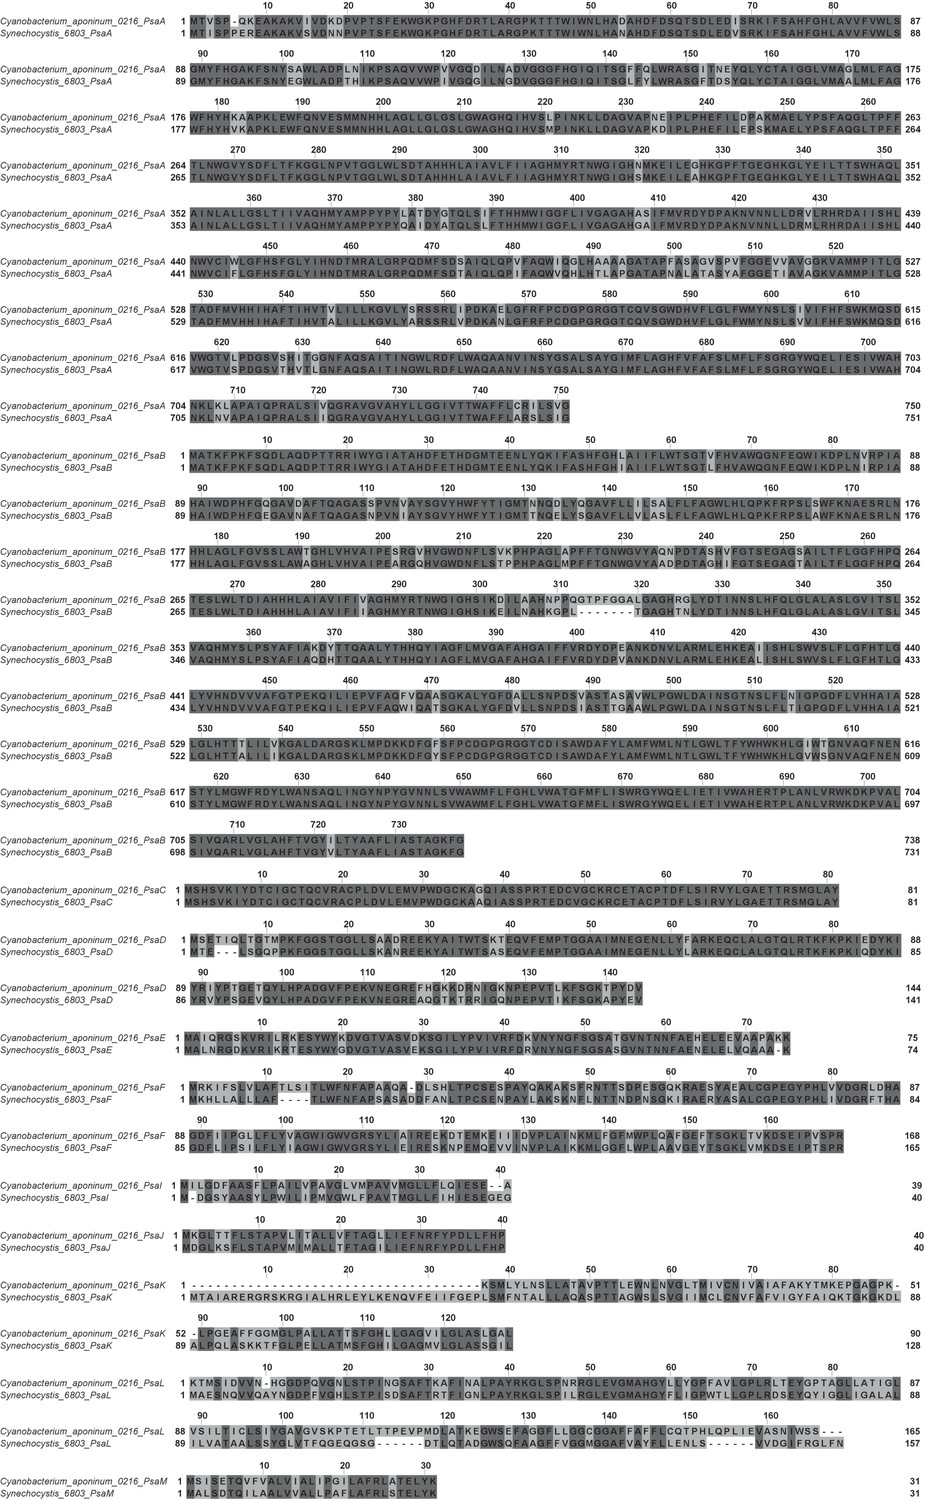
Photosystem I protein sequence alignment comparison between C.
aponinum and Synechocystis.
Figure 3 with 6 supplements

The structure of trimeric PSI from C. aponinum.
(A) C. aponinum trimeric PSI (B) chlorophyll B40 shifts its position due to the insertion seen in the PsaB subunit in C. aponinum (green) compared to Synechocystis (black). (C) The PsaL subunits of C. aponinum (green) and Synechocystis (black) showing the difference of the overall structure of the PsaL C-terminus. (D) The C-terminus of the PsaL subunit of C. aponinum (green) and Synechocystis (black) displaying the coordination to the Ca2+ in the adjacent monomer in Synechocystis, but is absent in C. aponinum and the Red_d mutant of Synechocystis. (E) C. aponinum and its electron density map compared to (F) Synechocystis (PDBID 5OY0, shown with 2Fo-Fc map) clearly depicting no density for the Ca2+ ion in the map for C. aponinum.
-
Figure 3—source data 1
Source data for Figure 3.
- https://cdn.elifesciences.org/articles/67518/elife-67518-fig3-data1-v2.zip
Figure 3—figure supplement 1
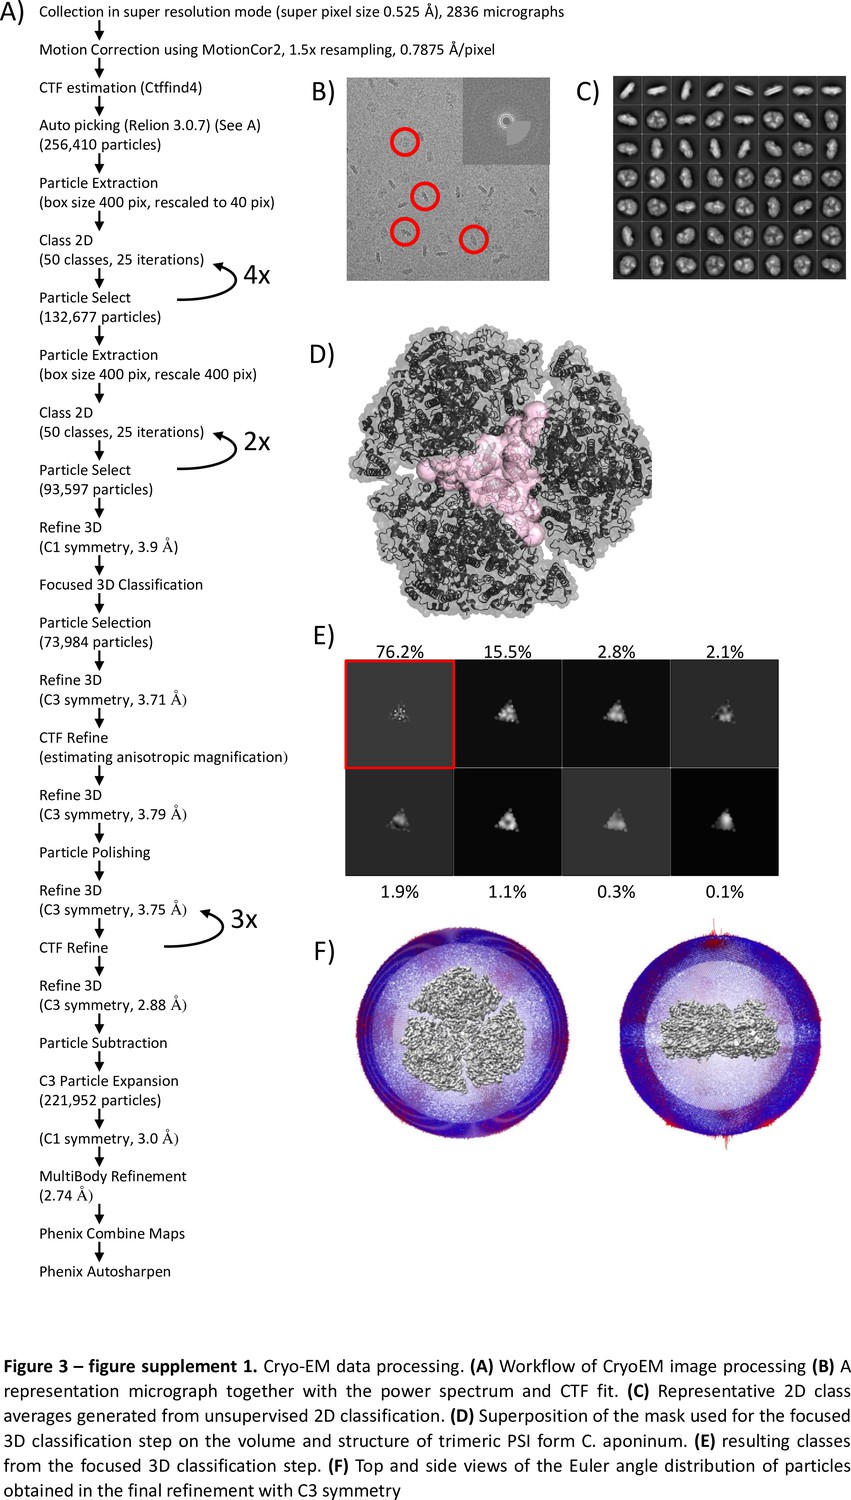
Cryo-EM data processing.
(A) Workflow of CryoEM image processing. (B) A representation micrograph together with the power spectrum and CTF fit. (C) Representative 2D class averages generated from unsupervised 2D classification. (D) Superposition of the mask used for the focused 3D classification step on the volume and structure of trimeric PSI form C. aponinum, (E) resulting classes from the focused 3D classification step. (F) Top and side views of the Euler angle distribution of particles obtained in the final refinement with C3 symmetry.
Figure 3—figure supplement 2
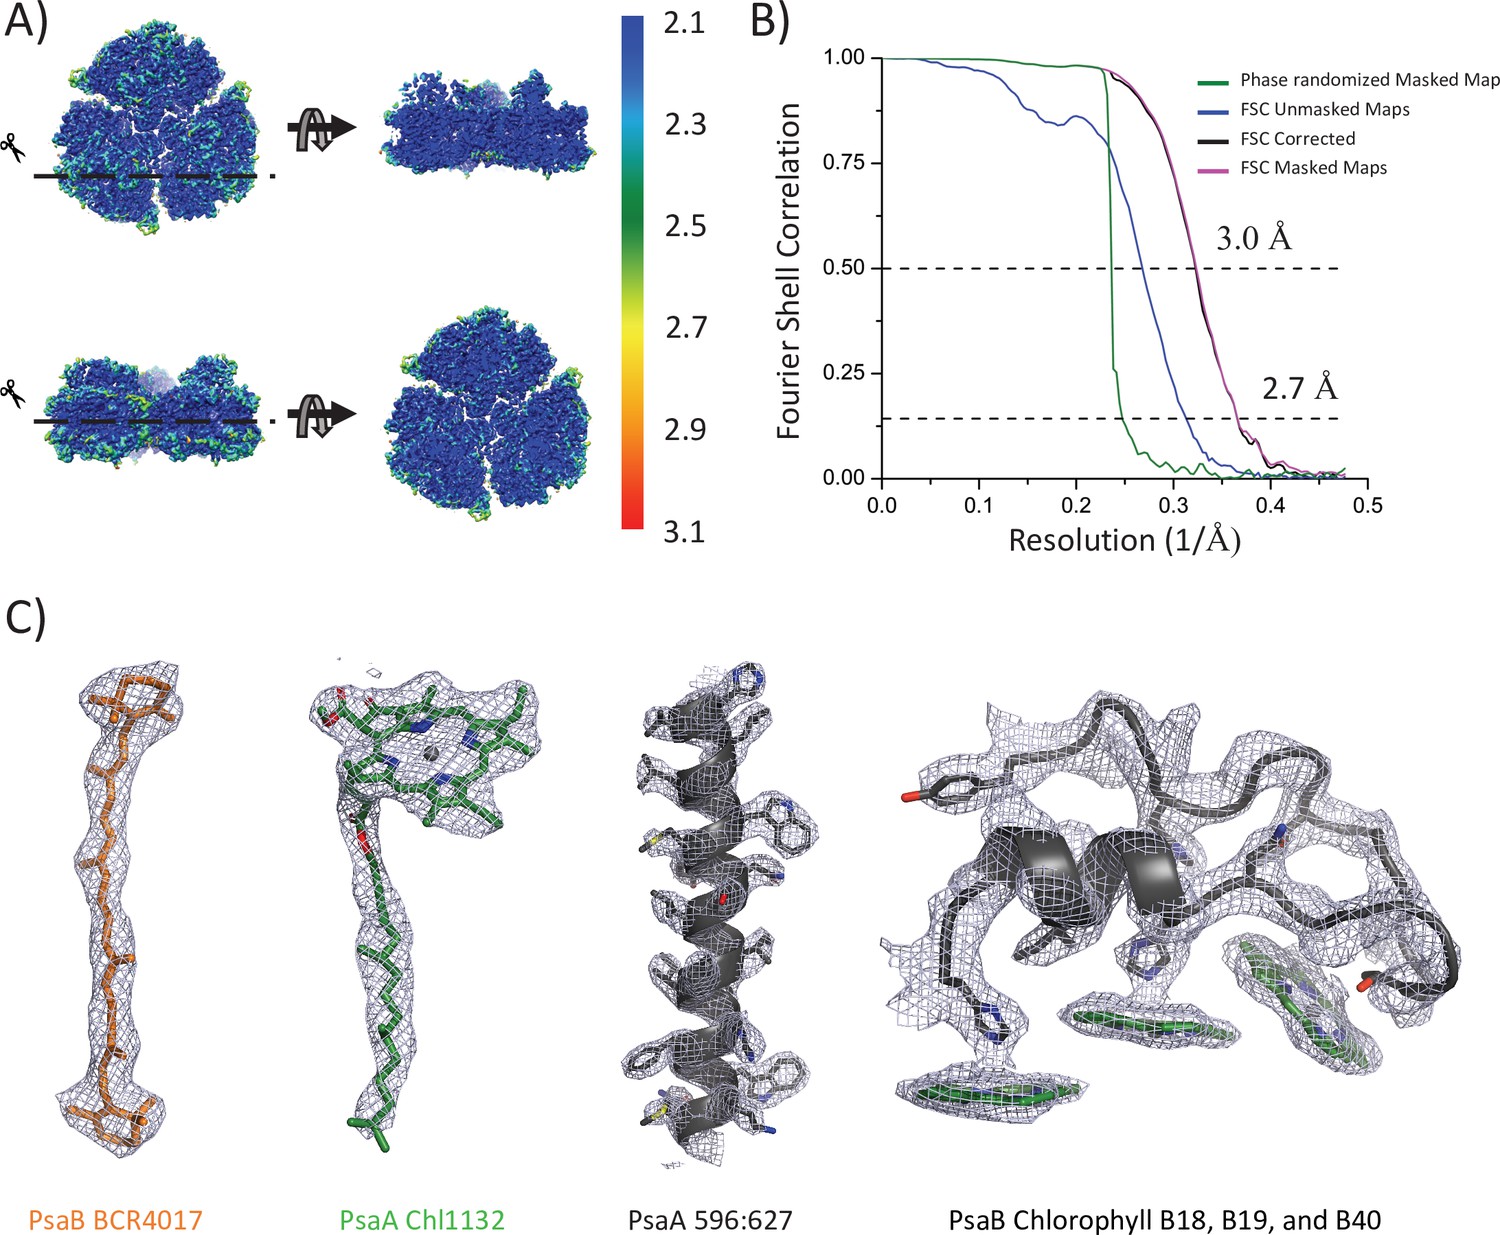
Model resolution and map examples.
(A) The final 3D map colored according to the local resolution estimates obtained from ResMap,. (B) Plots of the fourier shell correlation (FSC) against resolution. (C) Representative map sections showing carotenoid, chlorophyll, transmembrane helices, and the PsaB loop insertion. The identity of each is indicated.
Figure 3—figure supplement 3
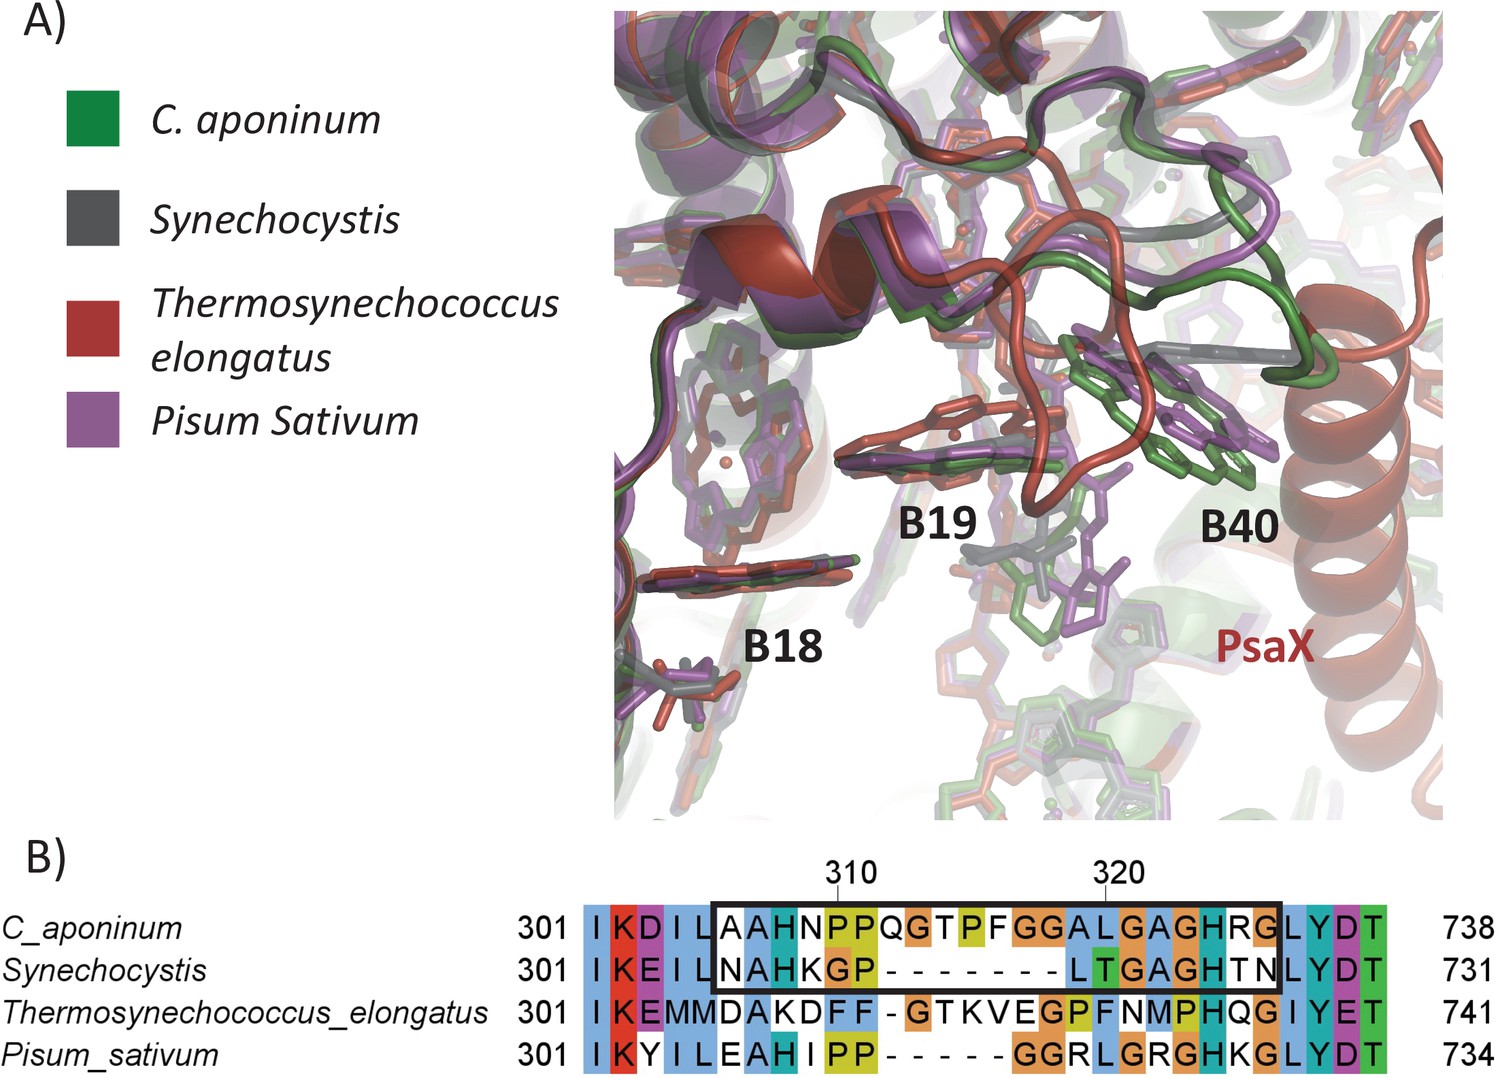
The local environment of Chl1240.
(A) Structural comparison surrounding the CHL1240 coordination across PSI from different species. (B) Protein sequence of the loop region. The mutation made into Synechocystis is outlined in black.
Figure 3—figure supplement 4
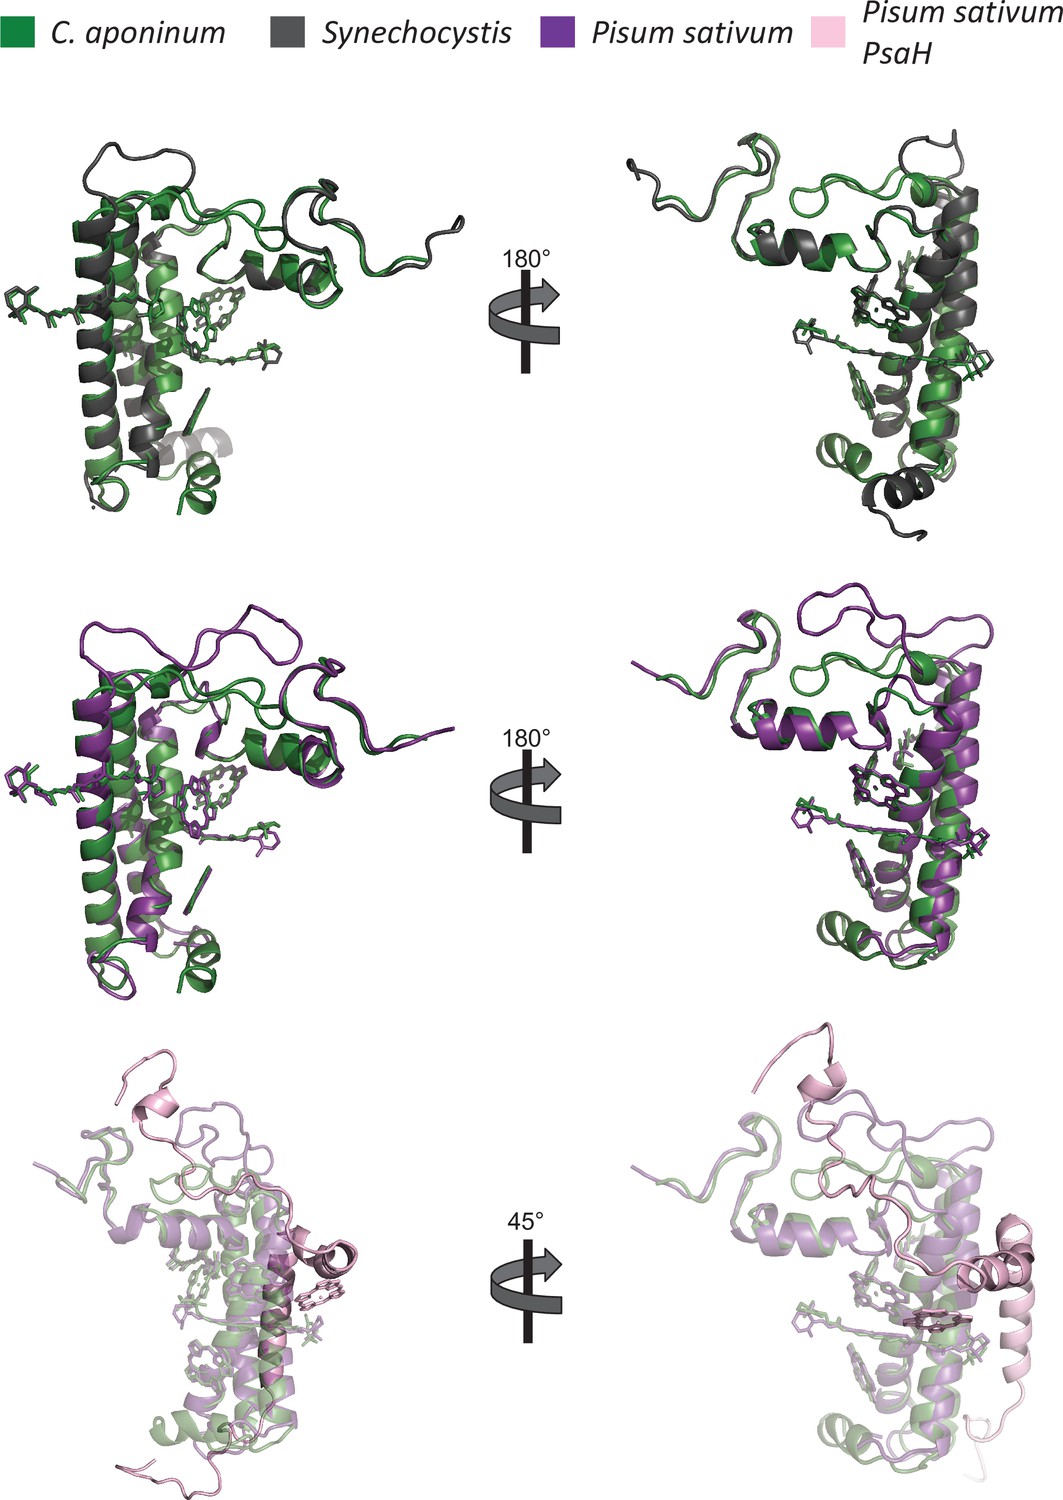
Comparison of the PsaL subunits from C.
aponinum (green), Synechocystis (black), and Pisum Sativum (purple) including the PsaH subunit (pink) in Pisum sativum.
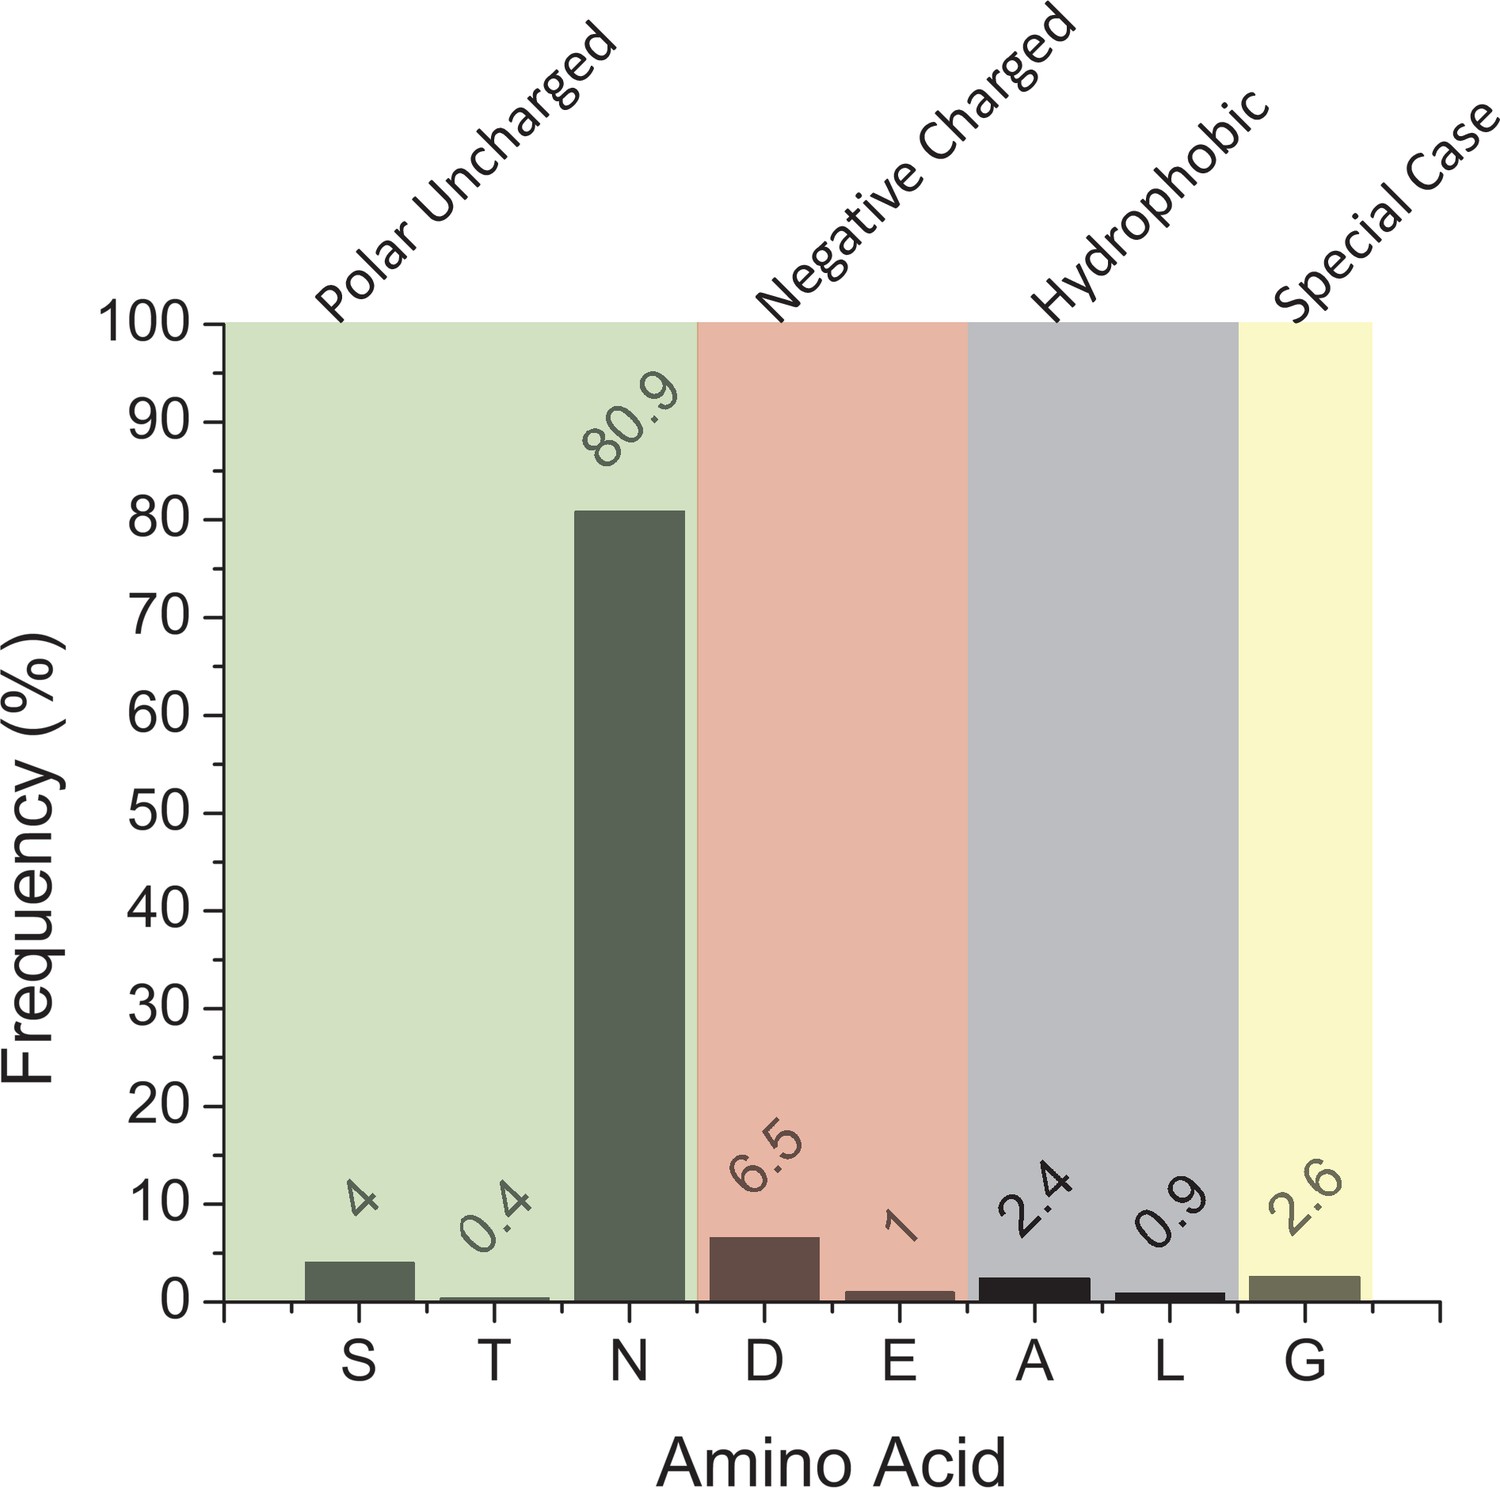
Figure 3—figure supplement 5
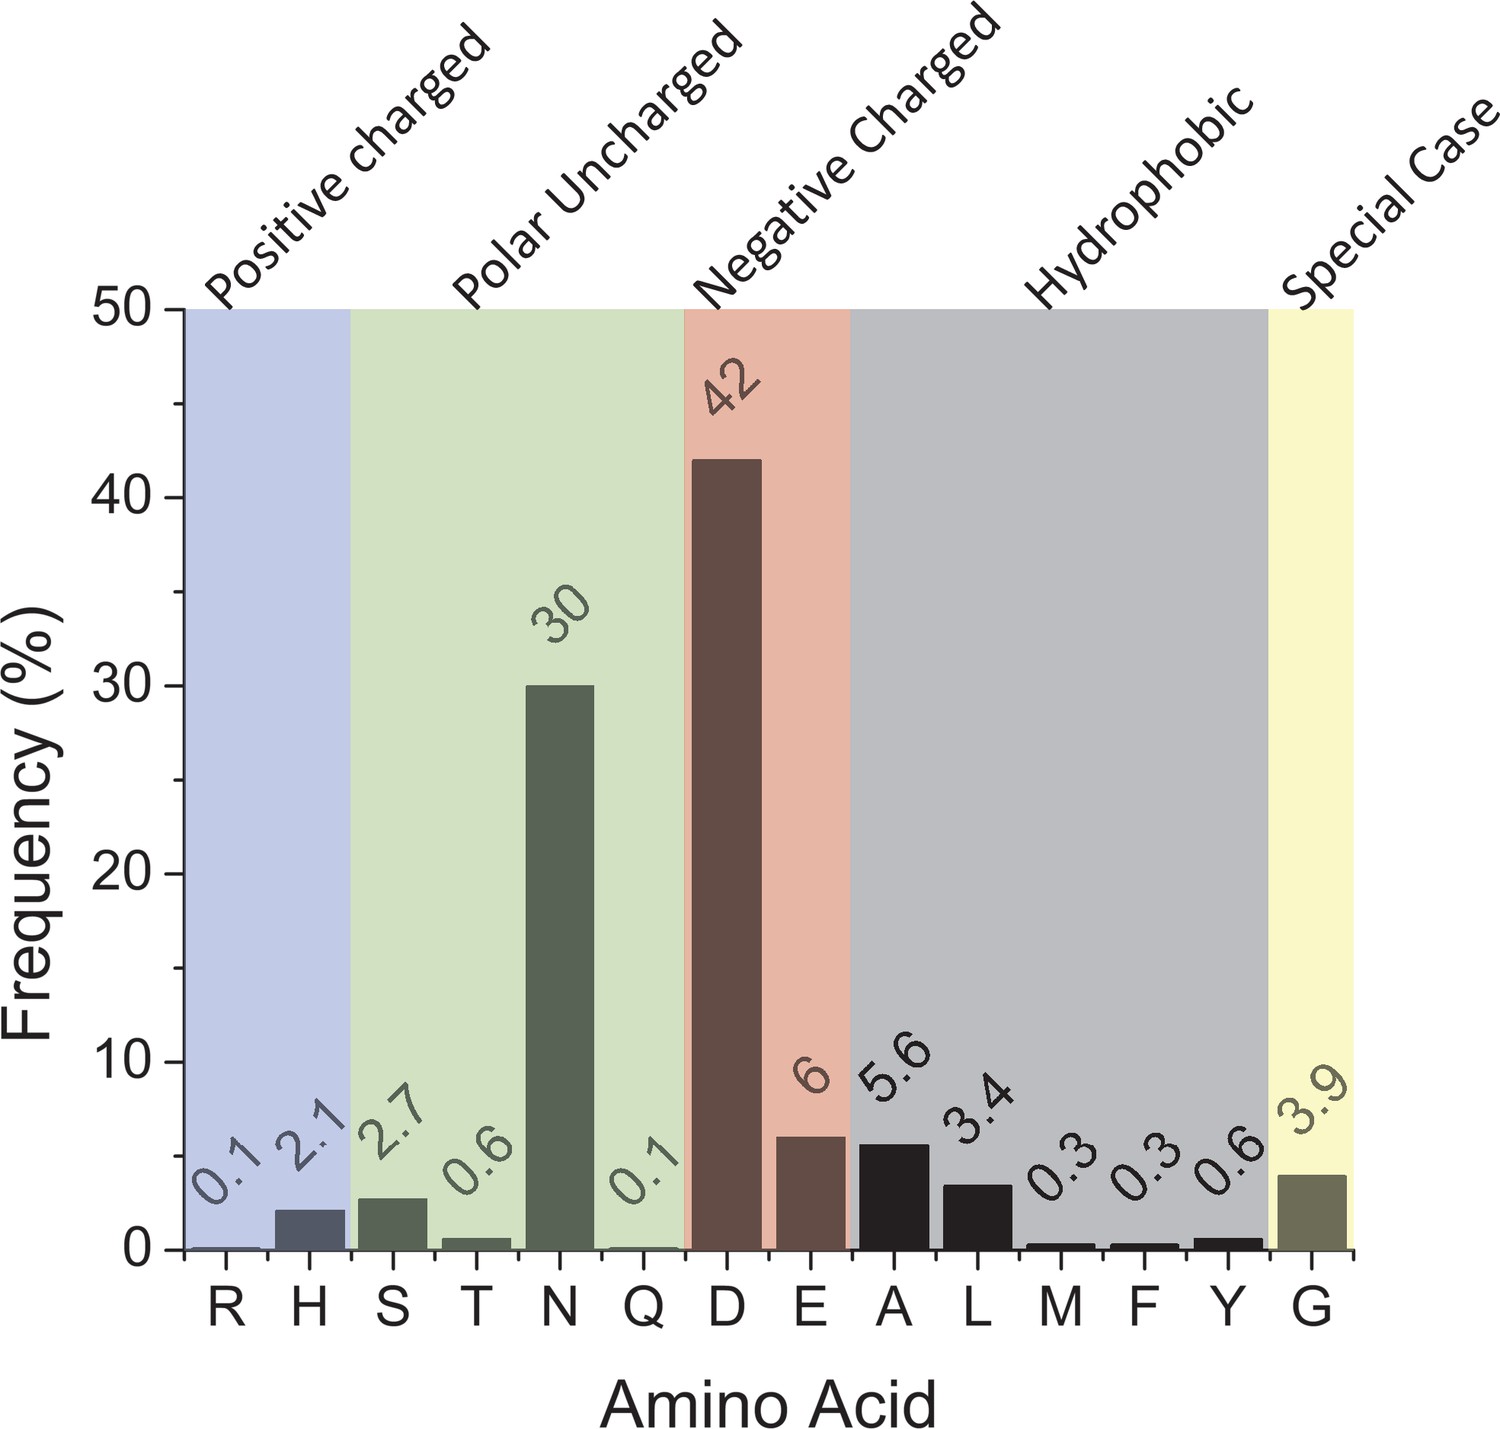
Ca2+ coordinating residue in prokaryotes.
A bar graph representing the frequency of different amino acids in cyanobacteria at the position corresponding to PsaL-D73 in Synechocystis. Negatively charged residues such as aspartate (D) or glutamate (E) probably correspond to Ca2+ coordination. The final alignment contained 680 nonredundant sequences.
Figure 3—figure supplement 6
A bar graph representing the frequency of different amino acids in eukaryotes, and their side chain properties, at the position which would coordinate the Ca2+ ion observed in early cyanobacteria structures.
This is made from 459 sequences.
Figure 4 with 1 supplement
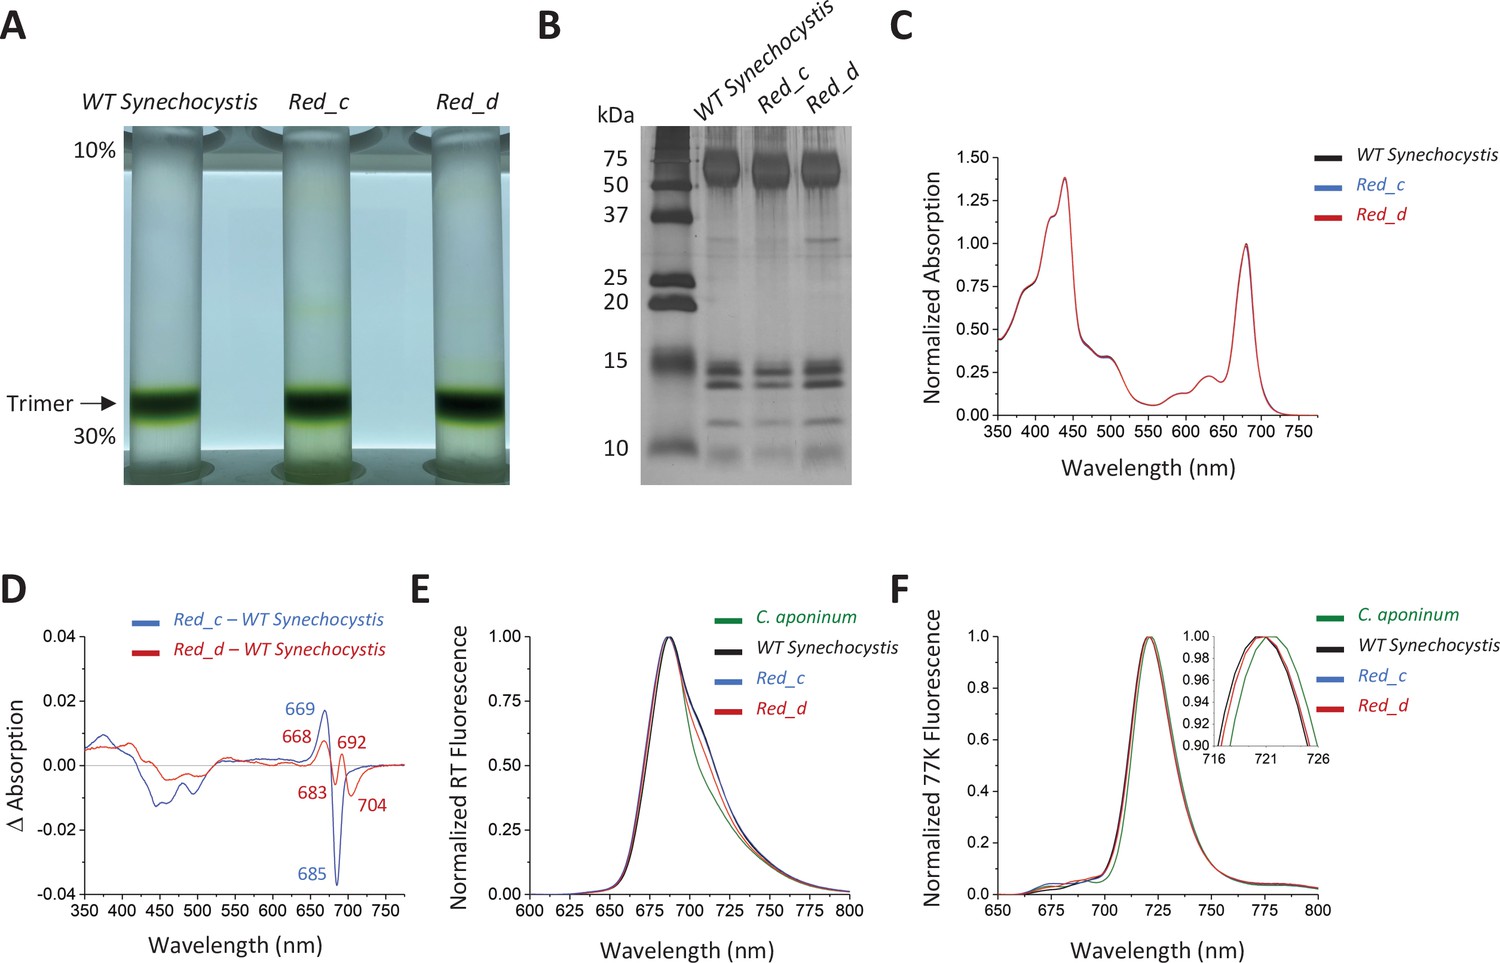
Spectroscopic analysis of Red_c.
(A) Ten percent to 30% sucrose gradient of solubilized membranes from WT Synechocystis, Red_c, and Red_d after purification by anion exchange. (B) SDS–PAGE of the main sucrose gradient bands in comparison with PSI isolated from WT Synechocystis. (C) Absorption spectra of the purified trimer of Red_c mutant (blue), Red_d (red), and WT Synechocystis (black) normalized to the area between 550 and 775 nm (D) Difference spectra of the Red_c – WT Synechocystis (blue) and the Red_d – WT Synechocystis absorbance spectra (red). (E) Room temperature emission using an excitation wavelength of 440 nm. Samples were normalized to their max peak. (F) 77 K fluorescence of C. aponinum (green), WT Synechocystis (black), Red_c (blue), and Red_d (red) using an excitation wavelength of 440 nm. Samples were normalized to their max peak.
-
Figure 4—source data 1
Source data for Figure 4.
- https://cdn.elifesciences.org/articles/67518/elife-67518-fig4-data1-v2.zip
Figure 4—figure supplement 1
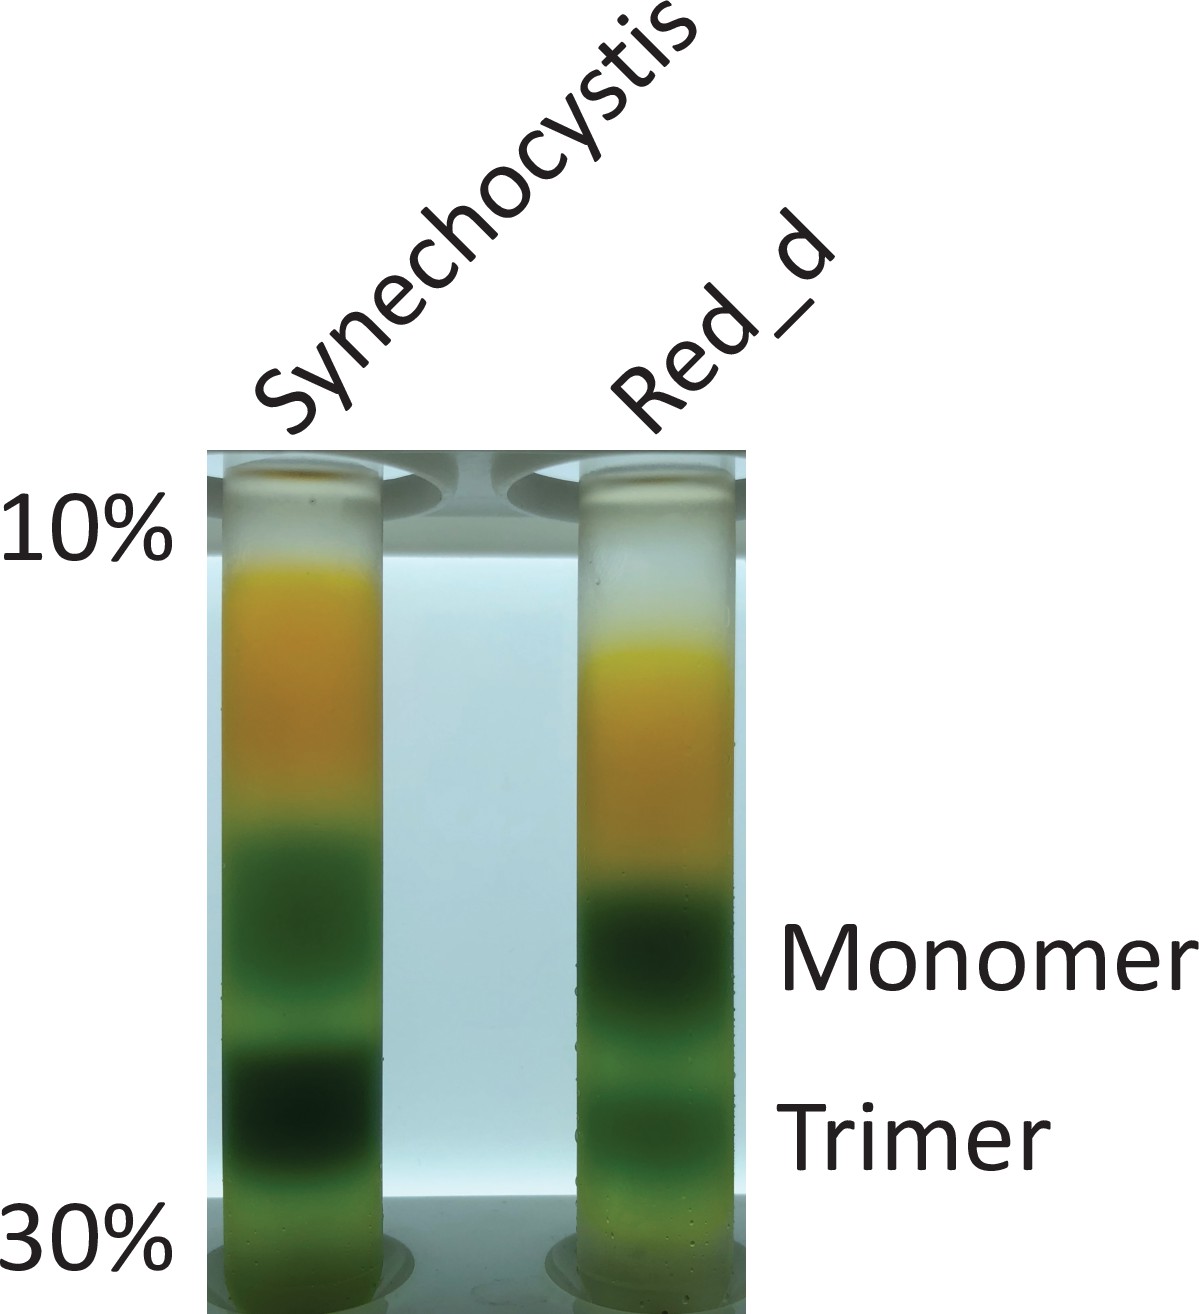
Solubilized membranes of WT Synechocystis and Red_d before anion exchange, displaying the increased relative ratio of PSI monomers to trimers in vivo in Red_d.
Figure 5
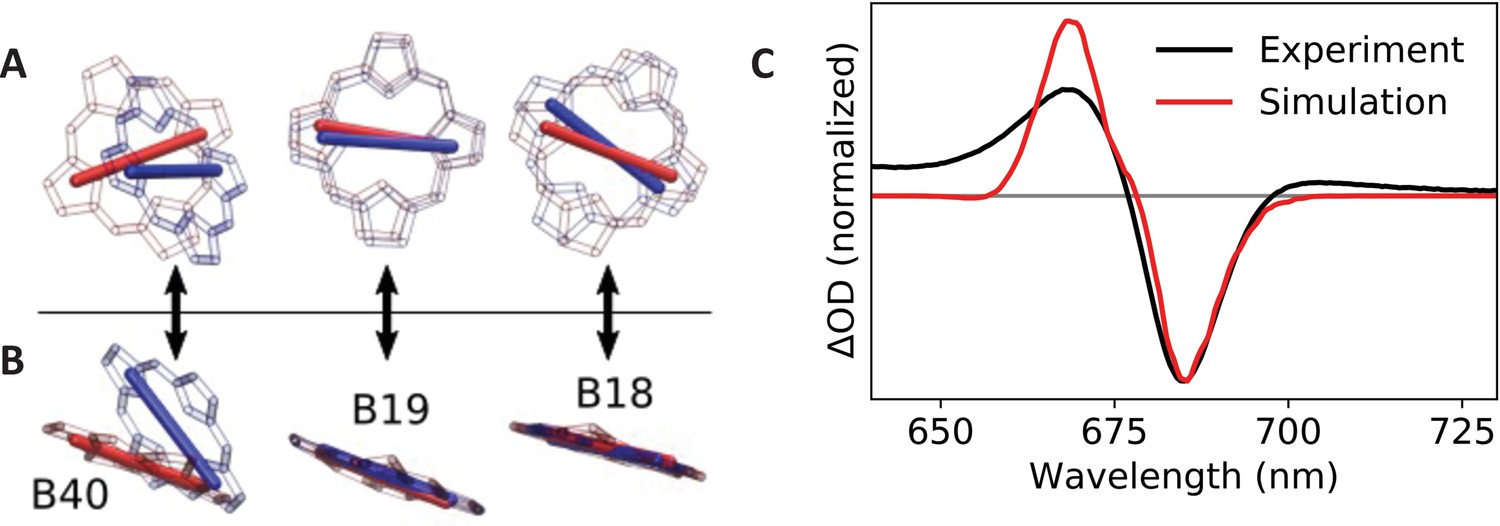
Calculated transition dipole vectors for chlorophylls B18, B19, and B40.
Viewed from above (A) or beside (B) the plane of pigment B19. The structures are aligned relative to the main ring atoms of chlorophylls B18 and B19. Red atoms/dipoles refer to WT Synechocystis, while blue atoms/dipoles refer to the Red_c mutant. (C) Simulated (red curve) Red_c – WT Synechocystis absorption difference spectra compared with the corresponding experimental spectrum (black curve).
Figure 6 with 4 supplements
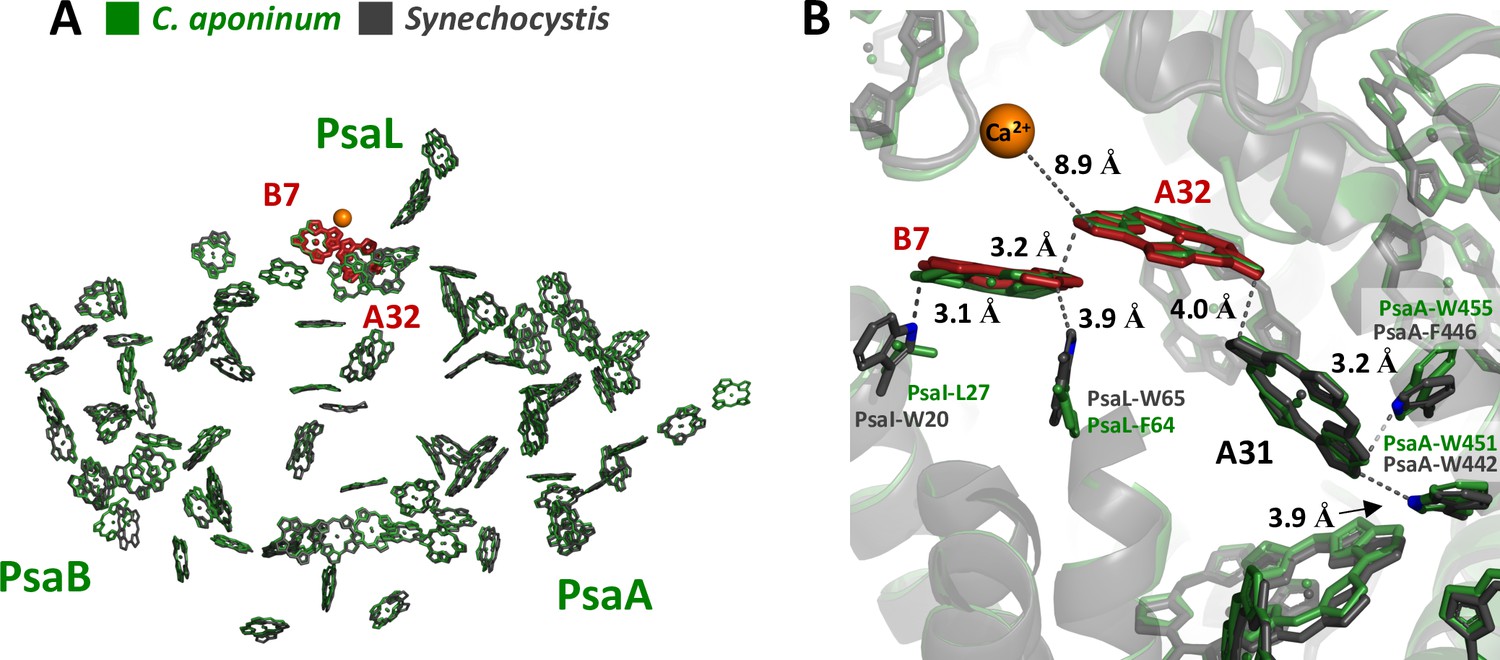
Local protein environment of predicted LWC.
(A) The location of chlorophyll B7 and A32 within each monomer, C. aponinum (green), and WT Synechocystis (gray, LWC in red). (B) The surrounding environment for chlorophyll B7 and A32 with C. aponinum (green) and WT Synechocystis (gray, LWC in red).
Figure 6—figure supplement 1
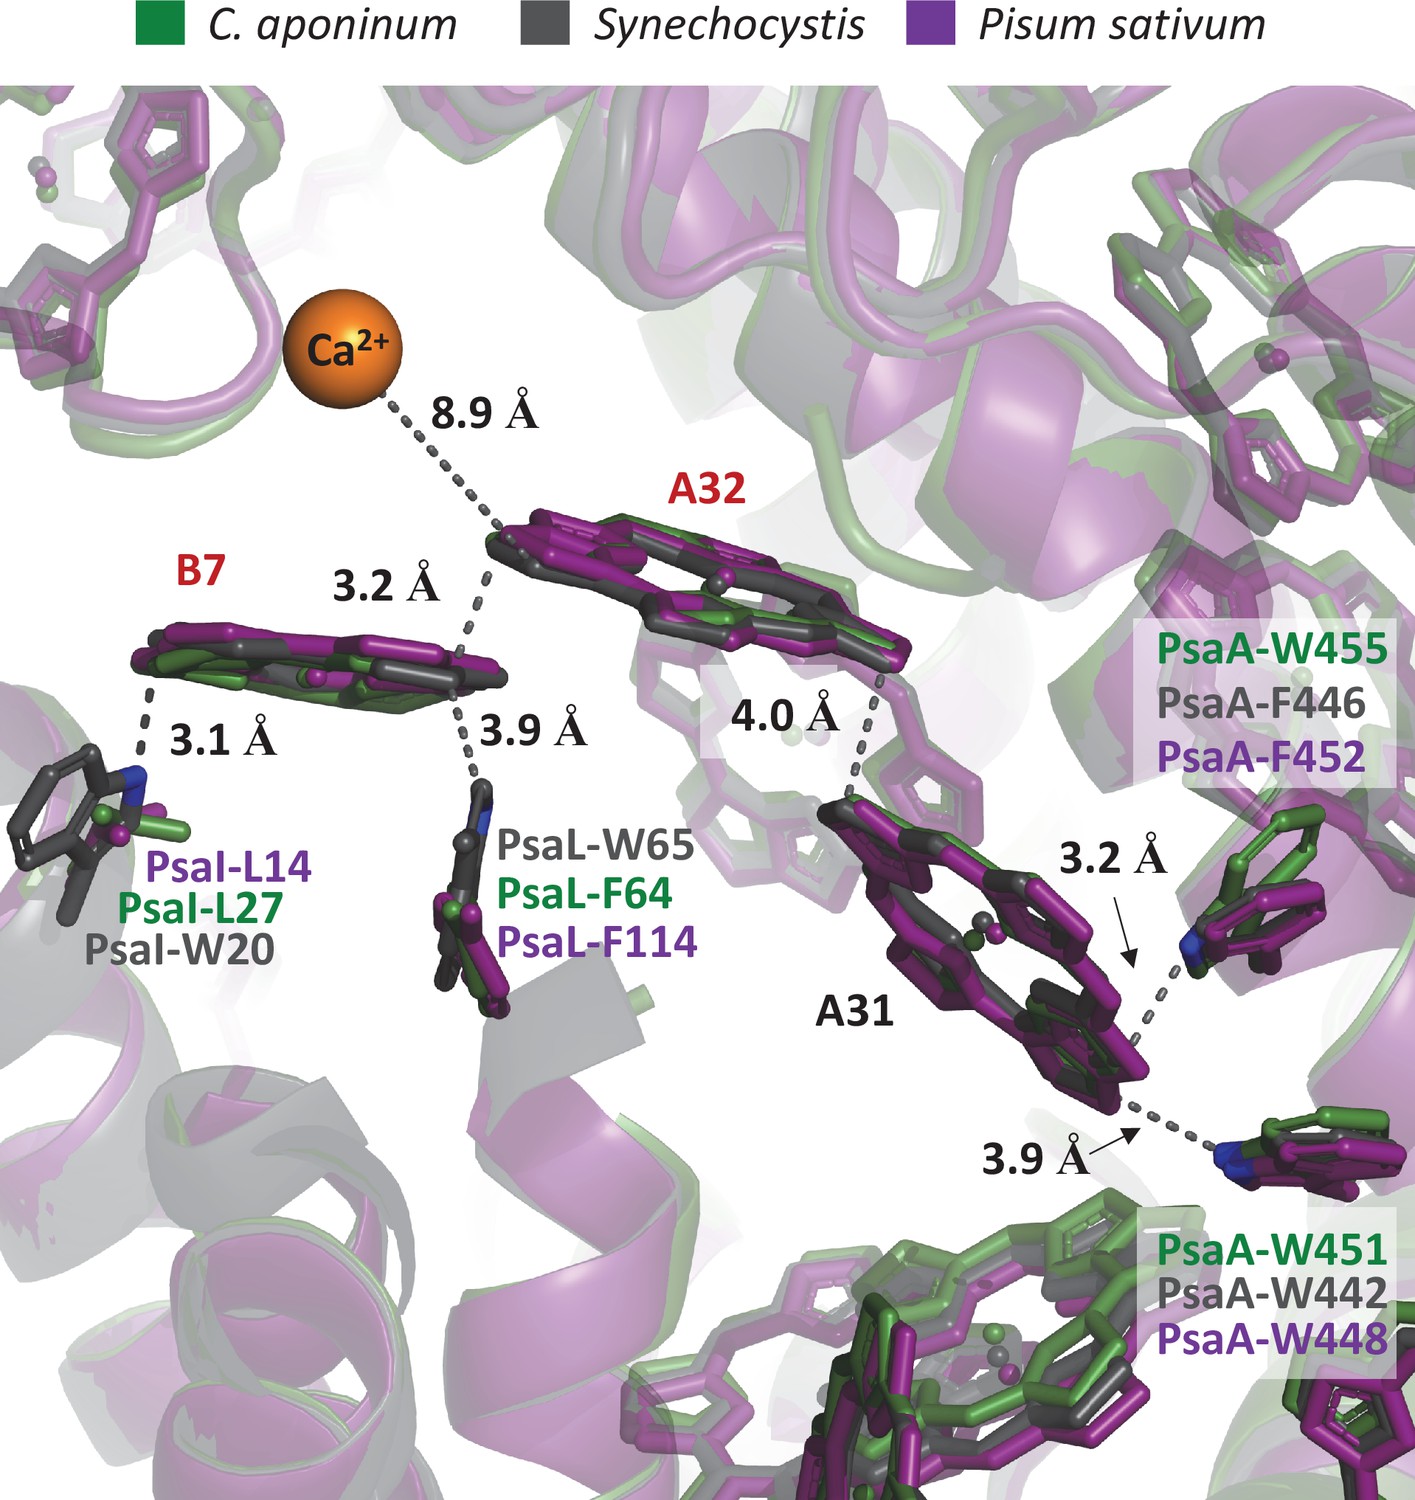
Overlay of C.
aponinum, Synechocystis, and Pisum Sativum showing the local protein environment around chlorophylls A31/A32/B7.
Figure 6—figure supplement 2
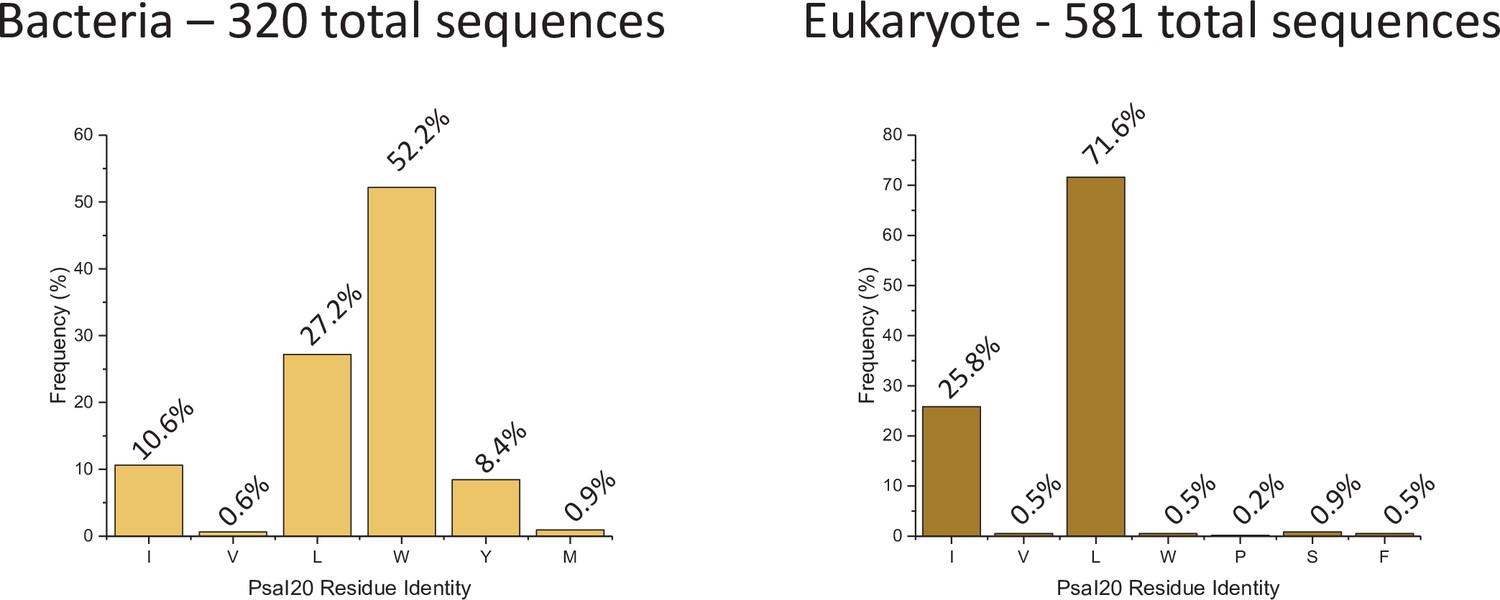
PsaI20 amino acid frequency among 320 bacteria sequences (left) and 581 eukaryote sequences (right).
-
Figure 6—figure supplement 2—source data 1
Source data for Figure 6—figure supplement 2.
- https://cdn.elifesciences.org/articles/67518/elife-67518-fig6-figsupp2-data1-v2.zip
Figure 6—figure supplement 3

PsaL65 amino acid frequency among 680 bacteria sequences (left) and 459 eukaryote sequences (right).
-
Figure 6—figure supplement 3—source data 1
Source data for Figure 6—figure supplement 3.
- https://cdn.elifesciences.org/articles/67518/elife-67518-fig6-figsupp3-data1-v2.zip
Figure 6—figure supplement 4
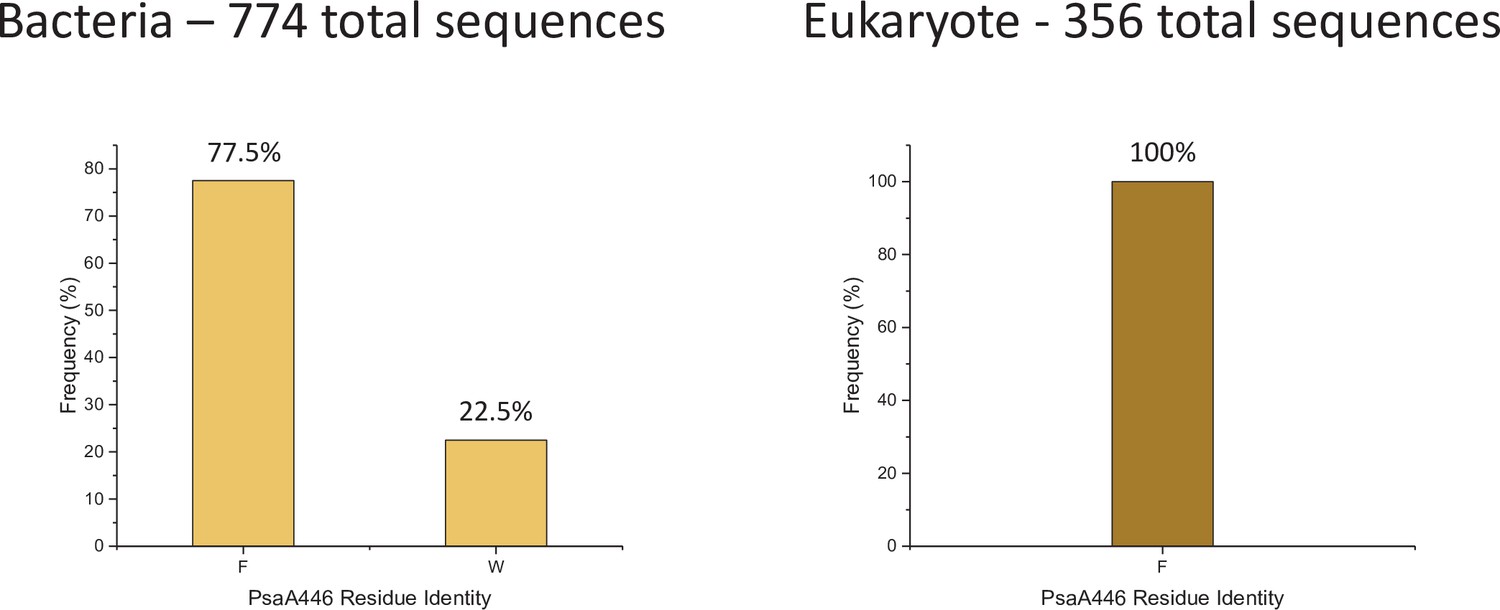
PsaA446 amino acid frequency among 774 bacteria sequences (left) and 356 eukaryote sequences (right).
-
Figure 6—figure supplement 4—source data 1
Source data for Figure 6—figure supplement 4.
- https://cdn.elifesciences.org/articles/67518/elife-67518-fig6-figsupp4-data1-v2.zip
Tables
Table 1
Cryo-EM data collection, refinement, and validation statistics.
| PSI complex(EMD-21320, PDB-6VPV) | |
|---|---|
| Data collection and processing | |
| Calibrated pixel size (Å)Detector, physical pixel size (µm) | 1.05K2 summit, 5 |
| Voltage (kV) | 300 |
| Total electron dose (e–/Å2) | 61 |
| Defocus range (μm) | –1.5 to – 3.0 |
| Super pixel size (Å) | 0.525 |
| Symmetry imposed | C3 |
| Initial particle images (no.) | 256,410 |
| Final particle images (no.) | 73,984 |
| Map resolution (Å) | 2.7 |
| FSC threshold | 0.143 |
| Map resolution range (Å) | 2.1–4.1 |
| Refinement | |
| Initial model used (PDB code) | 5OY0 |
| Model resolution (Å) | 2.7 |
| FSC threshold | 0.143 |
| Model resolution range (Å) | 2.1–4.1 |
| Map sharpening B factor (Å2) | –72.48 |
| Model composition | |
| Nonhydrogen atoms | 71,814 |
| Protein residues | 6,743 |
| Ligands | 384 |
| B factors (Å2) | |
| Protein | 50.00/137.33/86.61 |
| Ligand | 27.10/131.48/54.64 |
| R.m.s. deviations | |
| Bond lengths (Å) | 0.005 |
| Bond angles (°) | 0.894 |
| Validation | |
| MolProbity score | 1.82 |
| Clashscore | 10.36 |
| Poor rotamers (%) | 0.0 |
| Ramachandran plot | |
| Favored (%) | 95.89 |
| Allowed (%) | 4.11 |
| Disallowed (%) | 0 |
Table 2
Site energies and calculated coupling values amongst chlorophylls B18, B19, and B40 for WT Synechocystis and C. aponinum structures.
| B18 | B19 | B40 | |
|---|---|---|---|
| B18 | 14,600 | –71 | –20 |
| B19 | –59 | 14,950 | –106 |
| B40 | –10 | –70 | 14,950 |
Additional files
-
Supplementary file 1
(1a) Individual chains and ligand resolvability according to Q-scores.
Scores were calculated using the MapQ plugin in UCSFChimera. (1b). Primer list used for mutant construction.
- https://cdn.elifesciences.org/articles/67518/elife-67518-supp1-v2.docx
-
Transparent reporting form
- https://cdn.elifesciences.org/articles/67518/elife-67518-transrepform1-v2.docx
Download links
A two-part list of links to download the article, or parts of the article, in various formats.
Downloads (link to download the article as PDF)
Open citations (links to open the citations from this article in various online reference manager services)
Cite this article (links to download the citations from this article in formats compatible with various reference manager tools)
The structure of photosystem I from a high-light-tolerant cyanobacteria
eLife 10:e67518.
https://doi.org/10.7554/eLife.67518


