Mechanically transduced immunosorbent assay to measure protein-protein interactions
- Department of Biochemistry and Biophysics, The University of North Carolina School of Medicine, United States
- UNC Lineberger Comprehensive Cancer Center, University of North Carolina, United States
- Department of Chemistry, University of the Pacific, United States
- Department of Biological Engineering, University of the Pacific, United States
- Department of Mechanical Engineering, University of the Pacific, United States
Figures
Figure 1 with 3 supplements
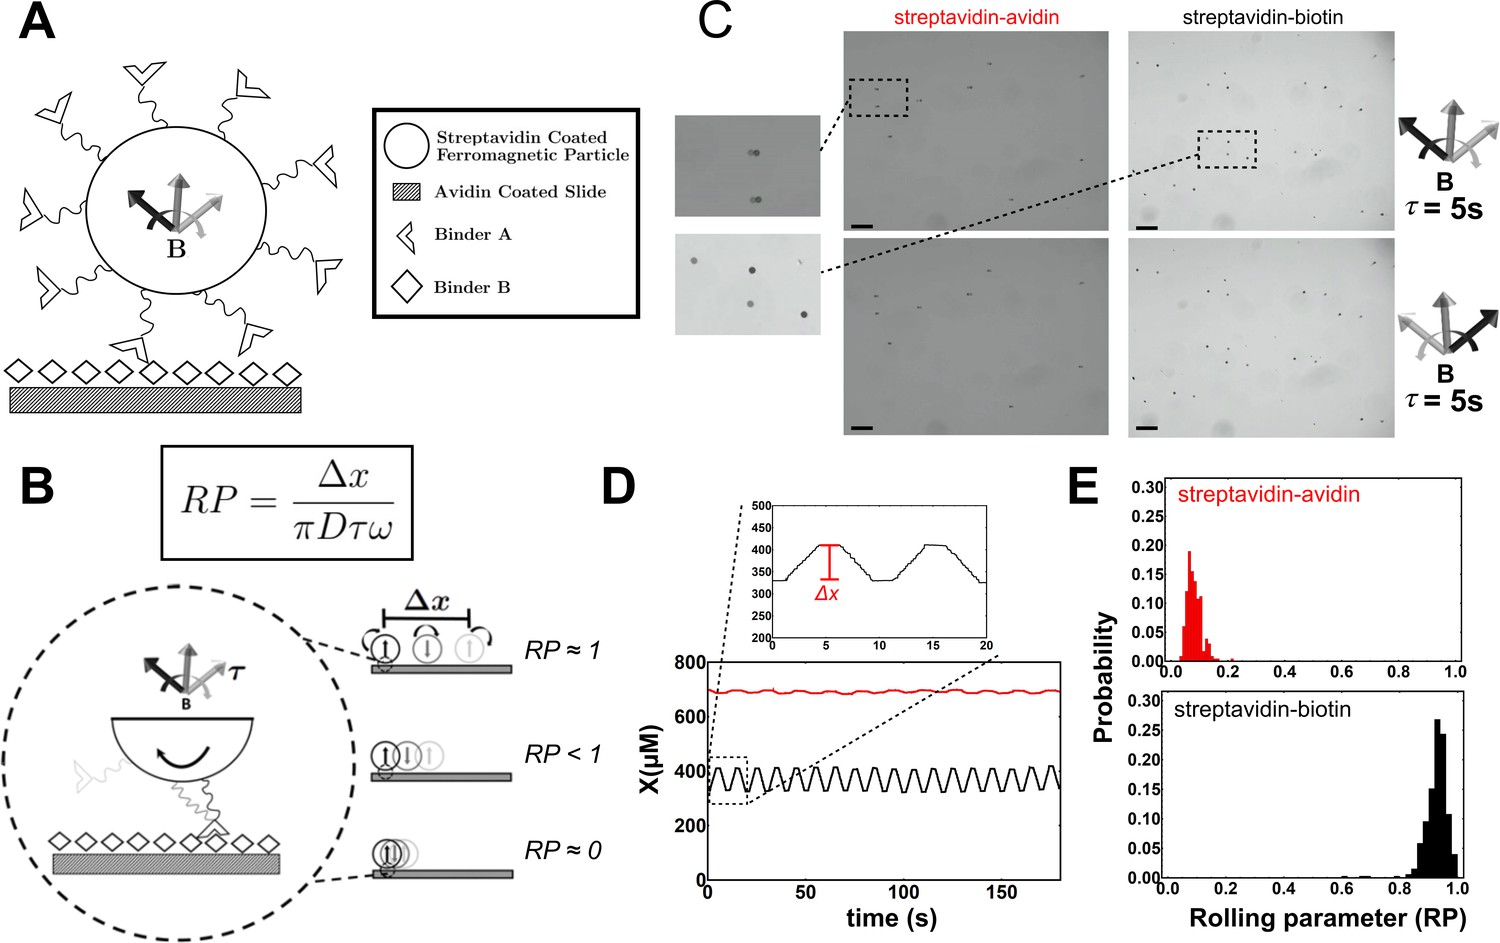
Experimental schematic of the Mechanically Transduced Immunosorbent Assay (METRIS) used to measure protein-protein interactions.
(A) General schematic of roller and surface functionalization. Both binder A and binder B are attached to the roller or the surface by biotin-streptavidin interactions. The direction of the rotating magnetic field is indicated by the curved arrow. (B) The rolling parameter (RP) is a dimensionless parameter that measures rolling. The RP is calculated by taking the ratio between the observed displacement of a roller, , and the maximum theoretic rolling of a sphere, which is calculated from the circumference of each spherical particle ΠD, the frequency of the rotation of the magnetic field , and the actuation time . In the schematic three scenarios are depicted: (top) a RP of 1 where the roller moves the maximum theoretical displacement, (middle) a RP less than 1, and (bottom) a RP near 0 where the particle does not move. (C) Representative microscopy images of streptavidin rollers (black points) on an avidin (left) or a biotin surface (right). The scale bar in black is 100 μm and the images size are 1.28 mm × 0.96 mm. The position of the rollers prior to magnetic field actuation are indicated by the transparent spots and after actuation is opaque. The top panels are after a CW actuation and the bottom is after a CCW actuation. The magnification illustrates the difference between the null (streptavidin-avidin) and biotin-streptavidin interaction translational displacement. (D) Plot of a single roller from a streptavidin-biotin (black) and an avidin-streptavidin (red) experiment. The y-axis (X) represents the position of each roller in the field of view. The magnification above shows how Δx is calculated for each roller by subtracting the preactuation position from the postactuation position. CW and CCW actuations are repeated as described in the methods. Translational displacement is calculated as a vector. (E) The distribution of rolling parameters (RPs) from the streptavidin-avidin (N=8 rollers) and biotin-streptavidin (N=9 rollers) experiments. RP is calculated using the equation in (B) for each actuation period for each roller so the distributions contain N × 36 points. See Figure 1—source data 1 for the rolling parameter for each actuation.
-
Figure 1—source data 1
Rolling parameter from all rolls for either biotin-streptavidin and avidin-streptavidin.
- https://cdn.elifesciences.org/articles/67525/elife-67525-fig1-data1-v1.xlsx
Figure 1—figure supplement 1
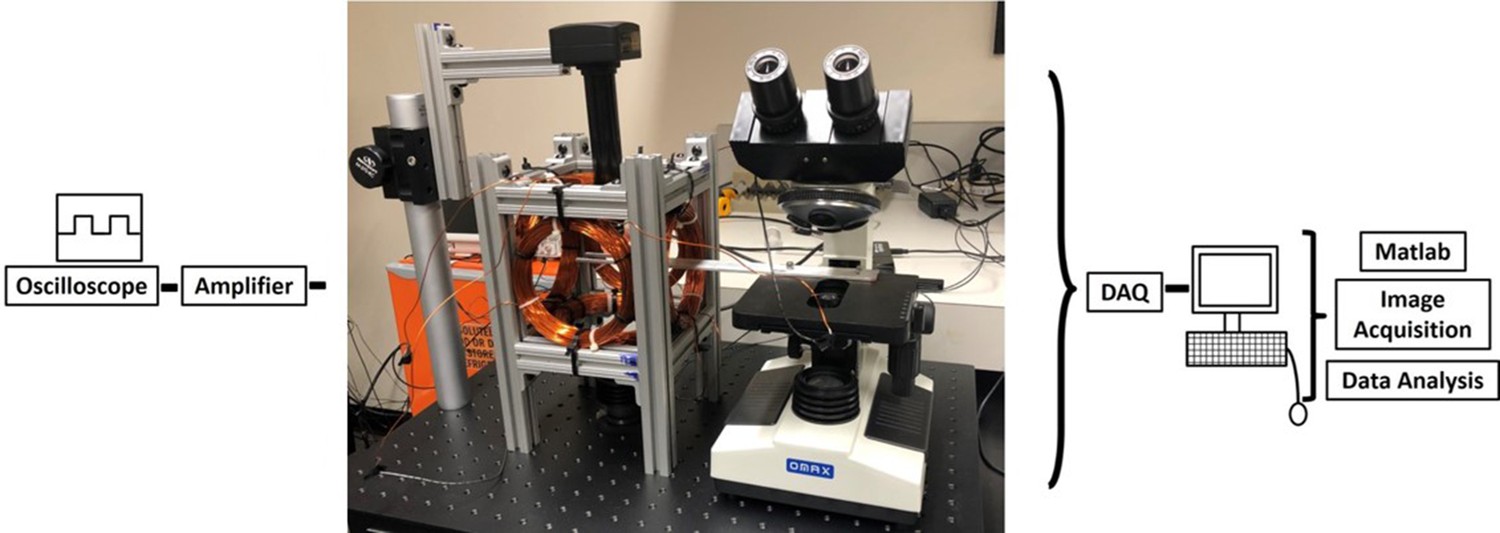
METRIS apparatus.
(A) Three pairs of Helmholtz coils were mounted on an aluminum T-slot assembly. Two sinusoidal signals are generated in Matlab, passed through a DAQ, amplifier, and then to the Helmholtz coils. Visualization is accomplished using a lens tube, 10X objective, and CCD camera. A 10 mT field was utilized.
Figure 1—video 1
Experimental video of streptavidin-coated rollers on an avidin-coated substrate and sped up 8X.
Figure 1—video 2
Experimental video of streptavidin-coated rollers on a biotin-coated substrate sped up 8X.
Figure 2 with 4 supplements
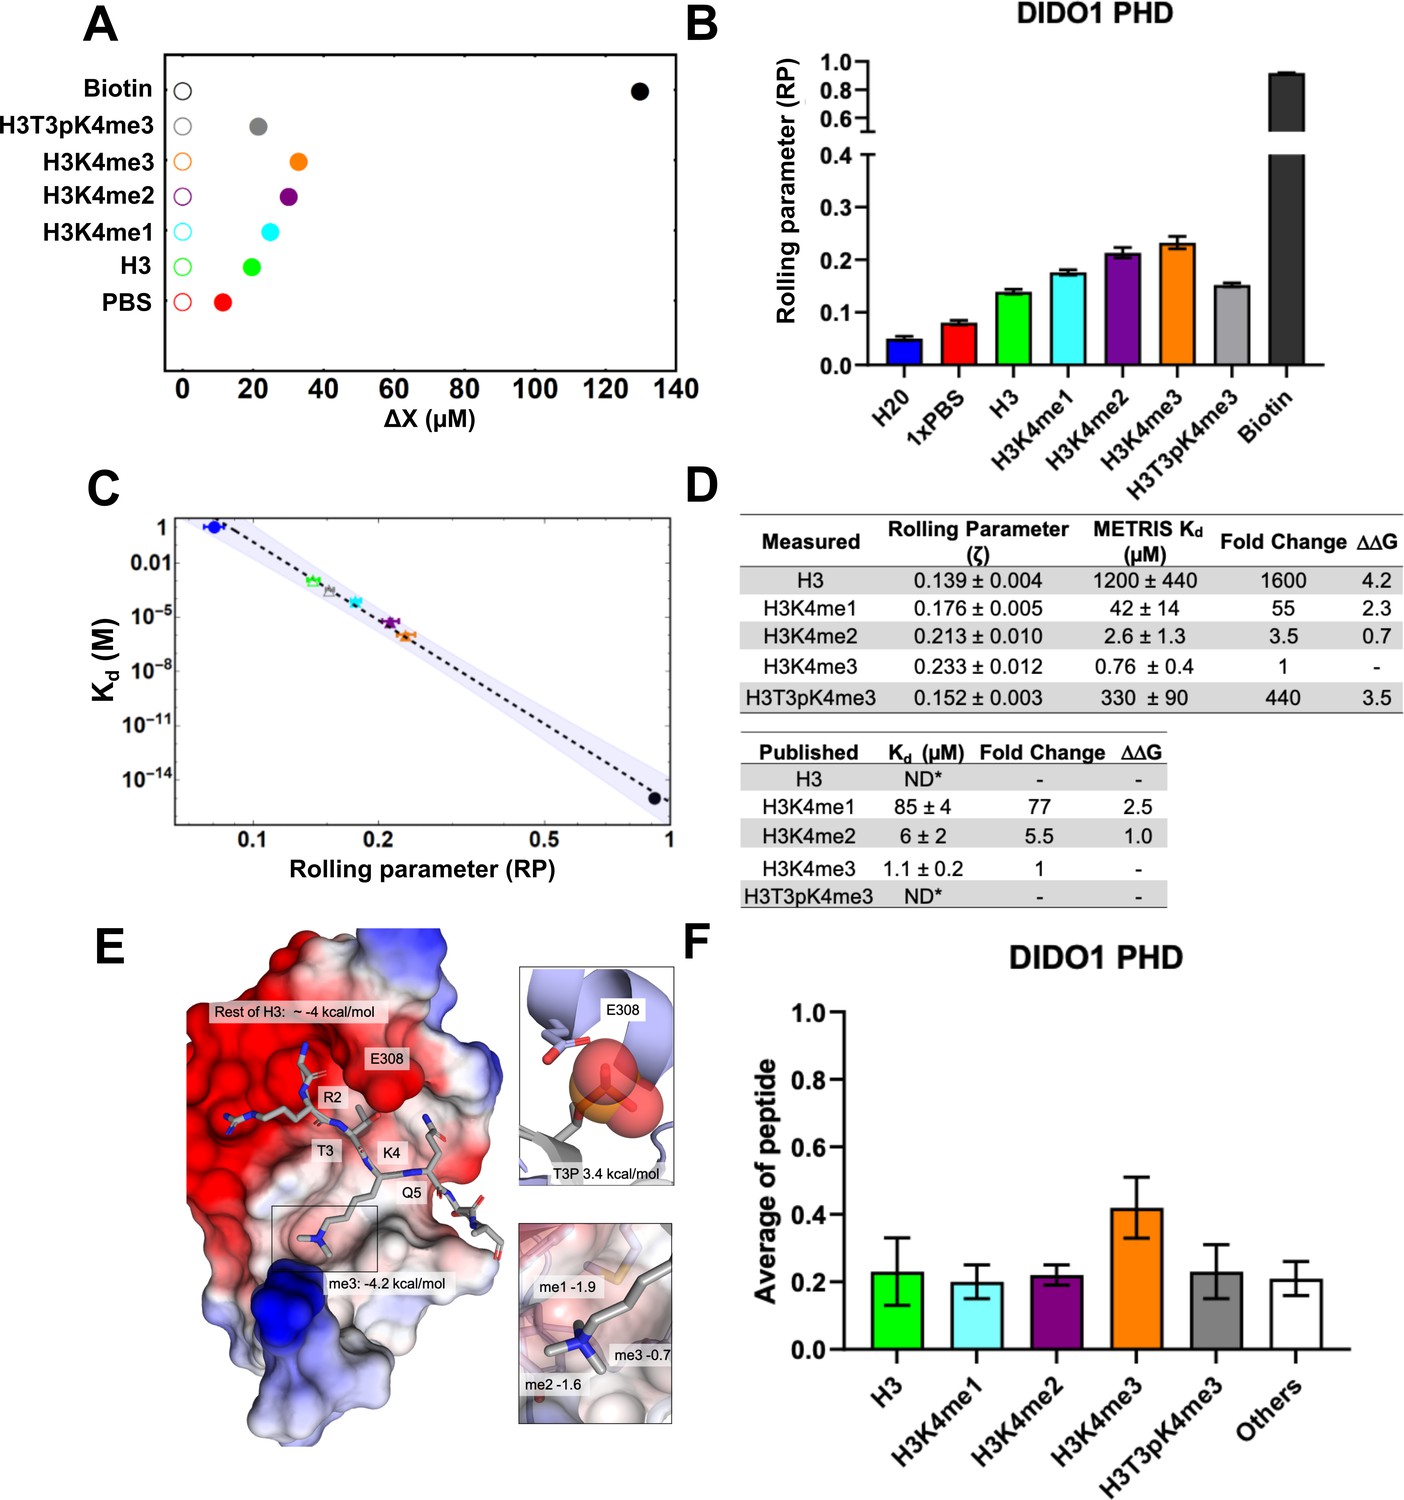
DIDO1-PHD interactions with H3 peptides characterized using METRIS.
(A) Plot showing the average translational displacement per actuation for the rollers coated with the indicated H3K4 methylated peptide on a DIDO1-PHD surface. Streptavidin-biotin and streptavidin-avidin (PBS) are included for references. See Figure 2—source data 2 for results of statistical analysis; all comparisons are statistically significant (p<0.0001). (B) Plot showing the calculated average rolling parameter per interaction. (C) Log-Log plot of the rolling parameters (RP) from panel B with the reported Kds. Extrapolated points for the unknown interactions are represented by unfilled markers, and the 95% confident interval for the fitting is depicted. (D) Table of rolling parameters and associated Kd estimates for the DIDO1-PHD interactions. Fold change is calculated as the ratio between the Kd values for the indicated peptide and for H3K4me3. These ratios are used to calculate at T=298K. The published values are from Gatchalian et al., 2013 using NMR (me1) and tryptophan fluorescence (me2/3); *ND = Not determined. (E) Image of the DIDO1-PHD crystal structure with H3K4me3 peptide, with the PHD surface electrostatic potentials shown (red = negative, blue = positive), the for K4me3, and the estimated for the rest of the peptide. The PTM reader sites are shown with greater detail to the right. Here, is calculated between the sequential methyl states, and the ratio of H3T3pK4me3 and H3K4me3 give the for T3p. (F) Results of the DIDO1-PHD histone peptide microarray assay against the indicated peptides (see Figure 1—figure supplement 1B for results of all peptides). Only H3K4me3 is statistically significant (P<0.05). (see Figure 2—source data 2 for results of statistical analysis). While these results indicate general binding trends, they cannot provide Kd estimates and do not have high enough resolution to distinguish between weaker binding interactions.
-
Figure 2—source data 1
Rolling parameter from all rolls for the indicated rollers on a DIDO1-PHD surface. Each row is a different roller and each column is an actuation.
- https://cdn.elifesciences.org/articles/67525/elife-67525-fig2-data1-v1.xlsx
-
Figure 2—source data 2
Statistical analysis of results from METRIS measurements and histone peptide microarray results for DIDO1-PHD.
Results from statistical tests comparing the indicated pairs of rolling parameters (METRIS) or microarray results (Array).
- https://cdn.elifesciences.org/articles/67525/elife-67525-fig2-data2-v1.xlsx
Figure 2—figure supplement 1
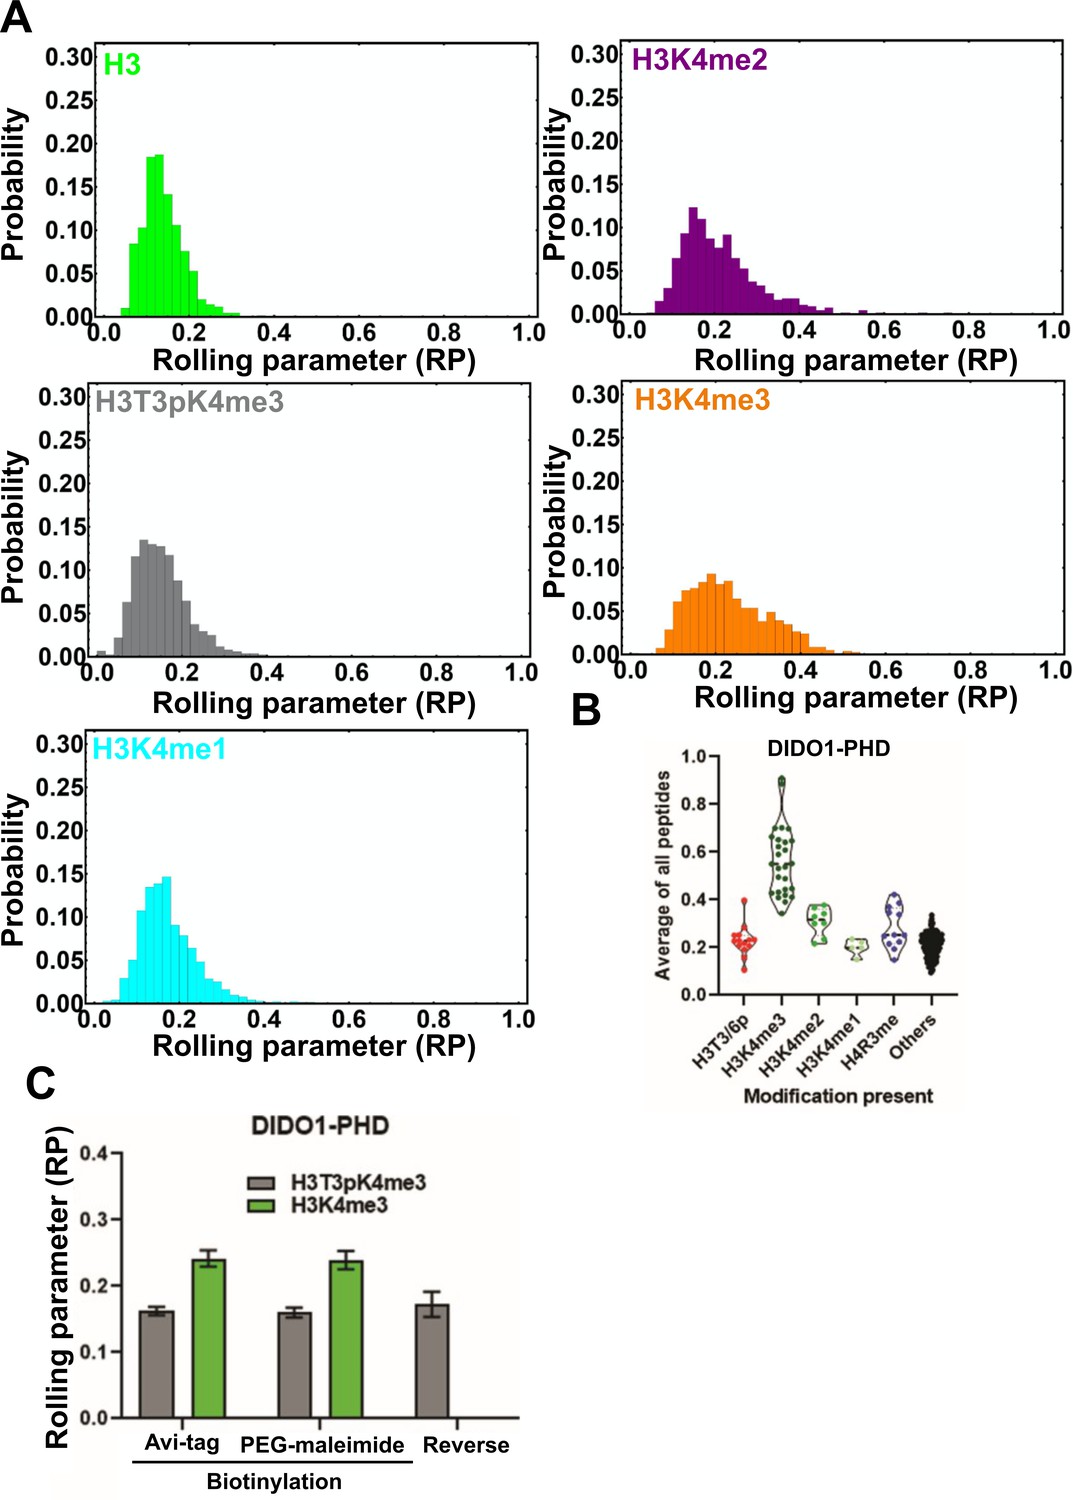
Rolling parameter for all rolls on the DIDO-PHD surface.
(A) Histogram showing the distribution of RPs for the indicated beads on the DIDO1-PHD-coated surface. See Figure 2—source data 1 for the rolling parameter for each actuation. (B) Normalized array signal intensities for the DIDO1-PHD, with the ‘others’ group including all other peptides. Each point represents the average value for an individual peptide. (C) Experiments where we tested either Avi-tagging or Biotin-PEG-maleimide tagging of GST-DIDO1-PHD. In the reverse experiment the bead was coated with Avi-tagged DIDO-PHD and the surface contains the peptide.
Figure 2—video 1
Experimental video of H3.
Coated rollers on a DIDO1 PHD-coated substrate sped up 8X.
Figure 2—video 2
Experimental video of H3K4me3-coated rollers on a DIDO1 PHD-coated substrate sped up 8X.
Figure 2—animation 1
Animation of 30 rolls for each roller for all DIDO1-PHD family of interactions: Orange, H3K9me3; Purple, H3K9me2; Cyan, H3K9me1; Green, H3, Grey; H3T3pK4me3.
Streptavidin-avidin (red) and biotin-avidin (black) are included for reference. The video is then reversed so it can be looped.
Figure 3 with 4 supplements

ORC1-BAH domain interactions characterized using METRIS.
(A) Plot showing the average translational displacement per actuation for the rollers immobilized with the H4K20 methylated peptide on a ORC1-BAH domain surface. Streptavidin-Biotin and Streptavidin-avidin (PBS) are included for references. See Figure 3—source data 2 for results of statistical analysis; all comparisons are significant (p<0.0001). (B) Plot showing the calculated RP for the indicated interactions (C) Log-Log plot of the rolling parameters, RP, from panel A. Extrapolated point markers are unfilled and the 95% Kd confident interval for the fitting is depicted. (D) Table of rolling parameters and associated Kd estimates for the ORC1-BAH. Fold change is calculated as the ratio between the Kd for the indicated peptide and the Kd for H4K20me2. These ratios are used to calculate at T=298K. The published values are from Kuo et al., 2012 using ITC; *ND = Not determined. (E) Image of the ORC1-BAH crystal structure with H4K20me2 peptide, with the BAH surface electrostatic potentials shown (red = negative, blue = positive) as well as the for K20me2 and the estimate for the rest of the peptide. The PTM reader site is shown with greater detail to the right. Here the is calculated between the sequential methyl states. (F) Results of the ORC1-BAH histone peptide microarray assay against the indicated peptides from panel A (see Figure 3—figure supplement 1B for complete peptide plot). Only H4K20me2 is statistically significantly different (p<0.05) from the other H4 peptides (Figure 3—source data 2). Again, we see that microarrays can indicate general binding trends but they cannot provide Kd estimates and do not have high enough resolution to distinguish between weaker binding interactions.
-
Figure 3—source data 1
Rolling parameter from all rolls for the indicated rollers on a ORC1-BAH surface. Each row is a different roller and each column is an actuation.
- https://cdn.elifesciences.org/articles/67525/elife-67525-fig3-data1-v1.xlsx
-
Figure 3—source data 2
Statistical analysis of results from METRIS measurements and histone peptide microarray results for ORC1-BAH.
Results from statistical tests comparing the indicated pairs of rolling parameters (METRIS) or microarray results (Array).
- https://cdn.elifesciences.org/articles/67525/elife-67525-fig3-data2-v1.xlsx
Figure 3—figure supplement 1
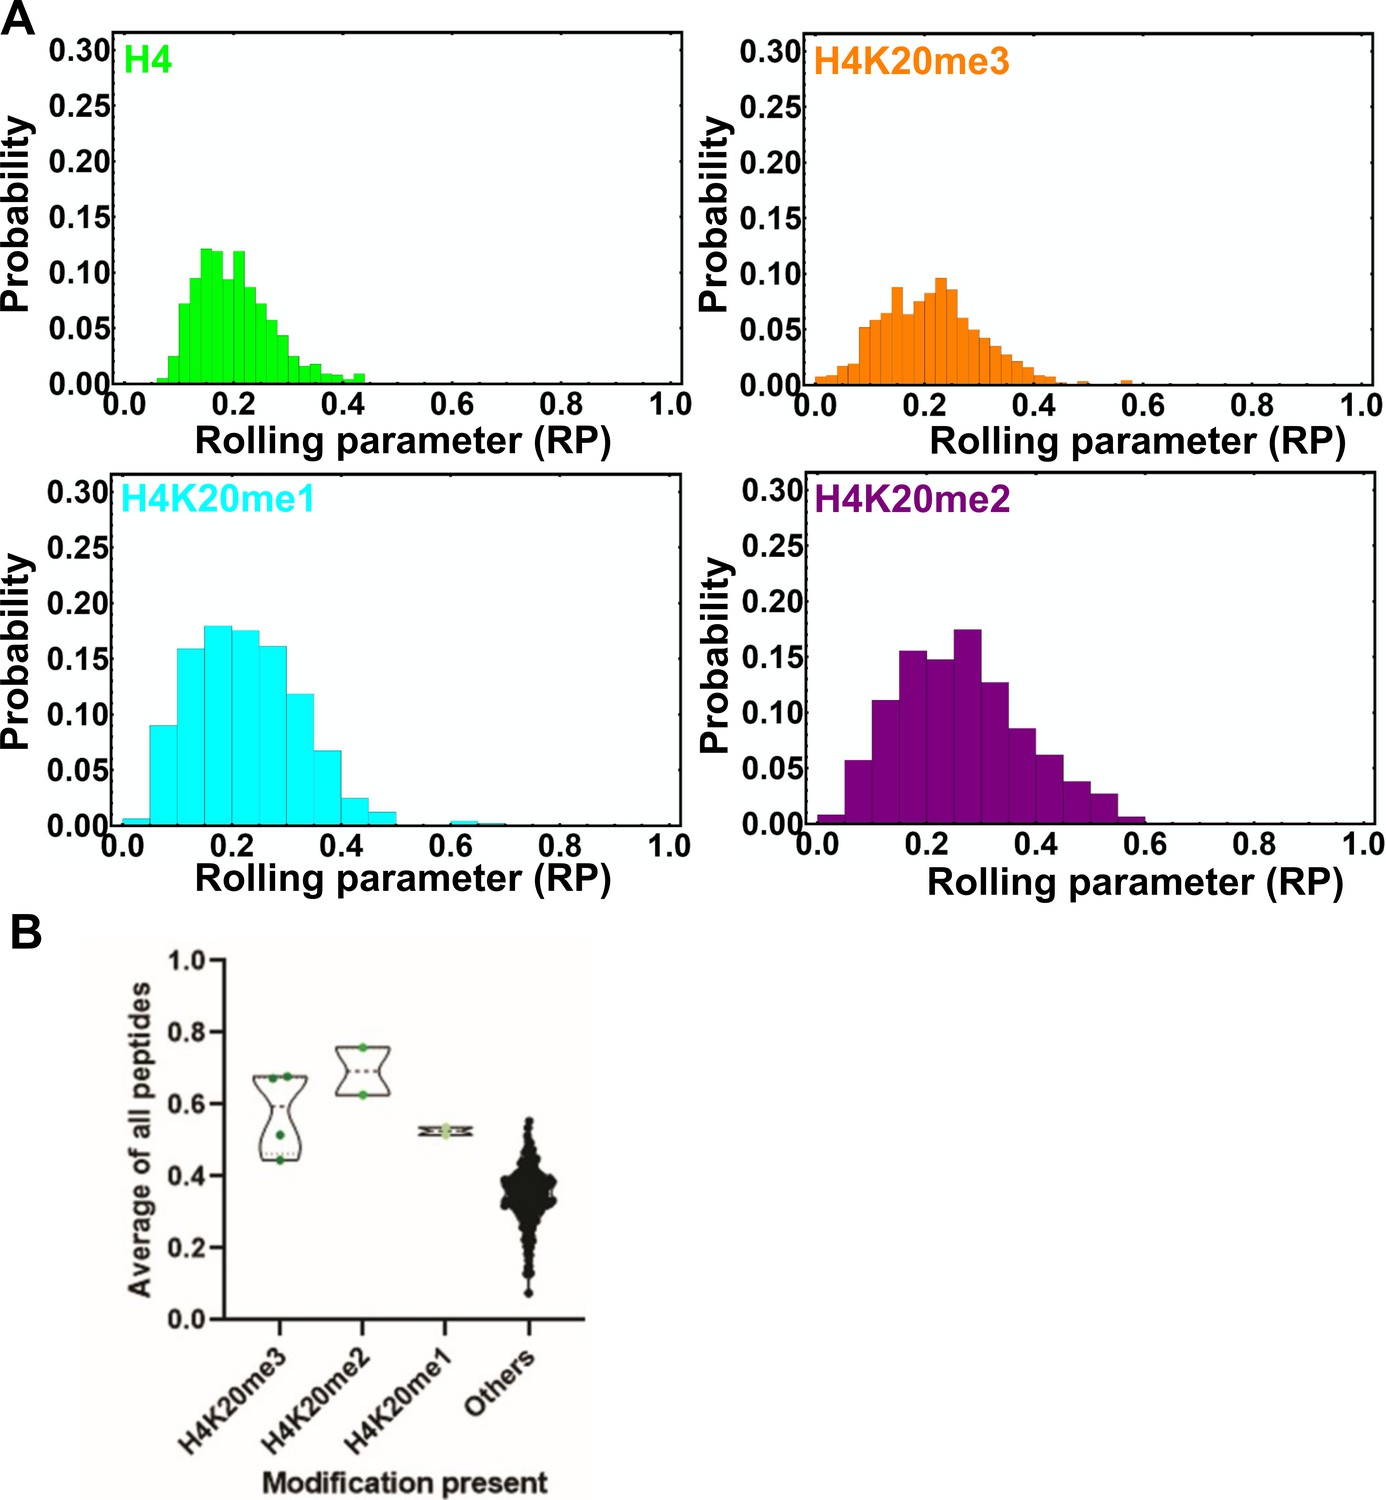
Rolling parameter for all rolls on the ORC1-BAH surface.
(A) Histogram showing the distribution of RPs for the indicated beads on the ORC1-BAH-coated surface. See Figure 3—source data 1 for the rolling parameter for each actuation. (B) Normalized array signal intensities for the ORC1-BAH, with the ‘others’ group including all other peptides. Each point represents the average value for an individual peptide.
Figure 3—video 1
Experimental video of H4-coated rollers on a ORC1-BAH-coated substrate sped up 8X.
Figure 3—video 2
Experimental video of H4K20me2-coated rollers on a ORC1-BAH-coated substrate sped up 8X.
Figure 3—animation 1
Animation of 30 rolls for each roller for all ORC1-BAH family of interactions: Orange, H4K20me3; Purple, H4K20me2; Cyan, H4K20me1; Green, H4.
The video is then reversed so it can be looped.
Figure 4 with 2 supplements
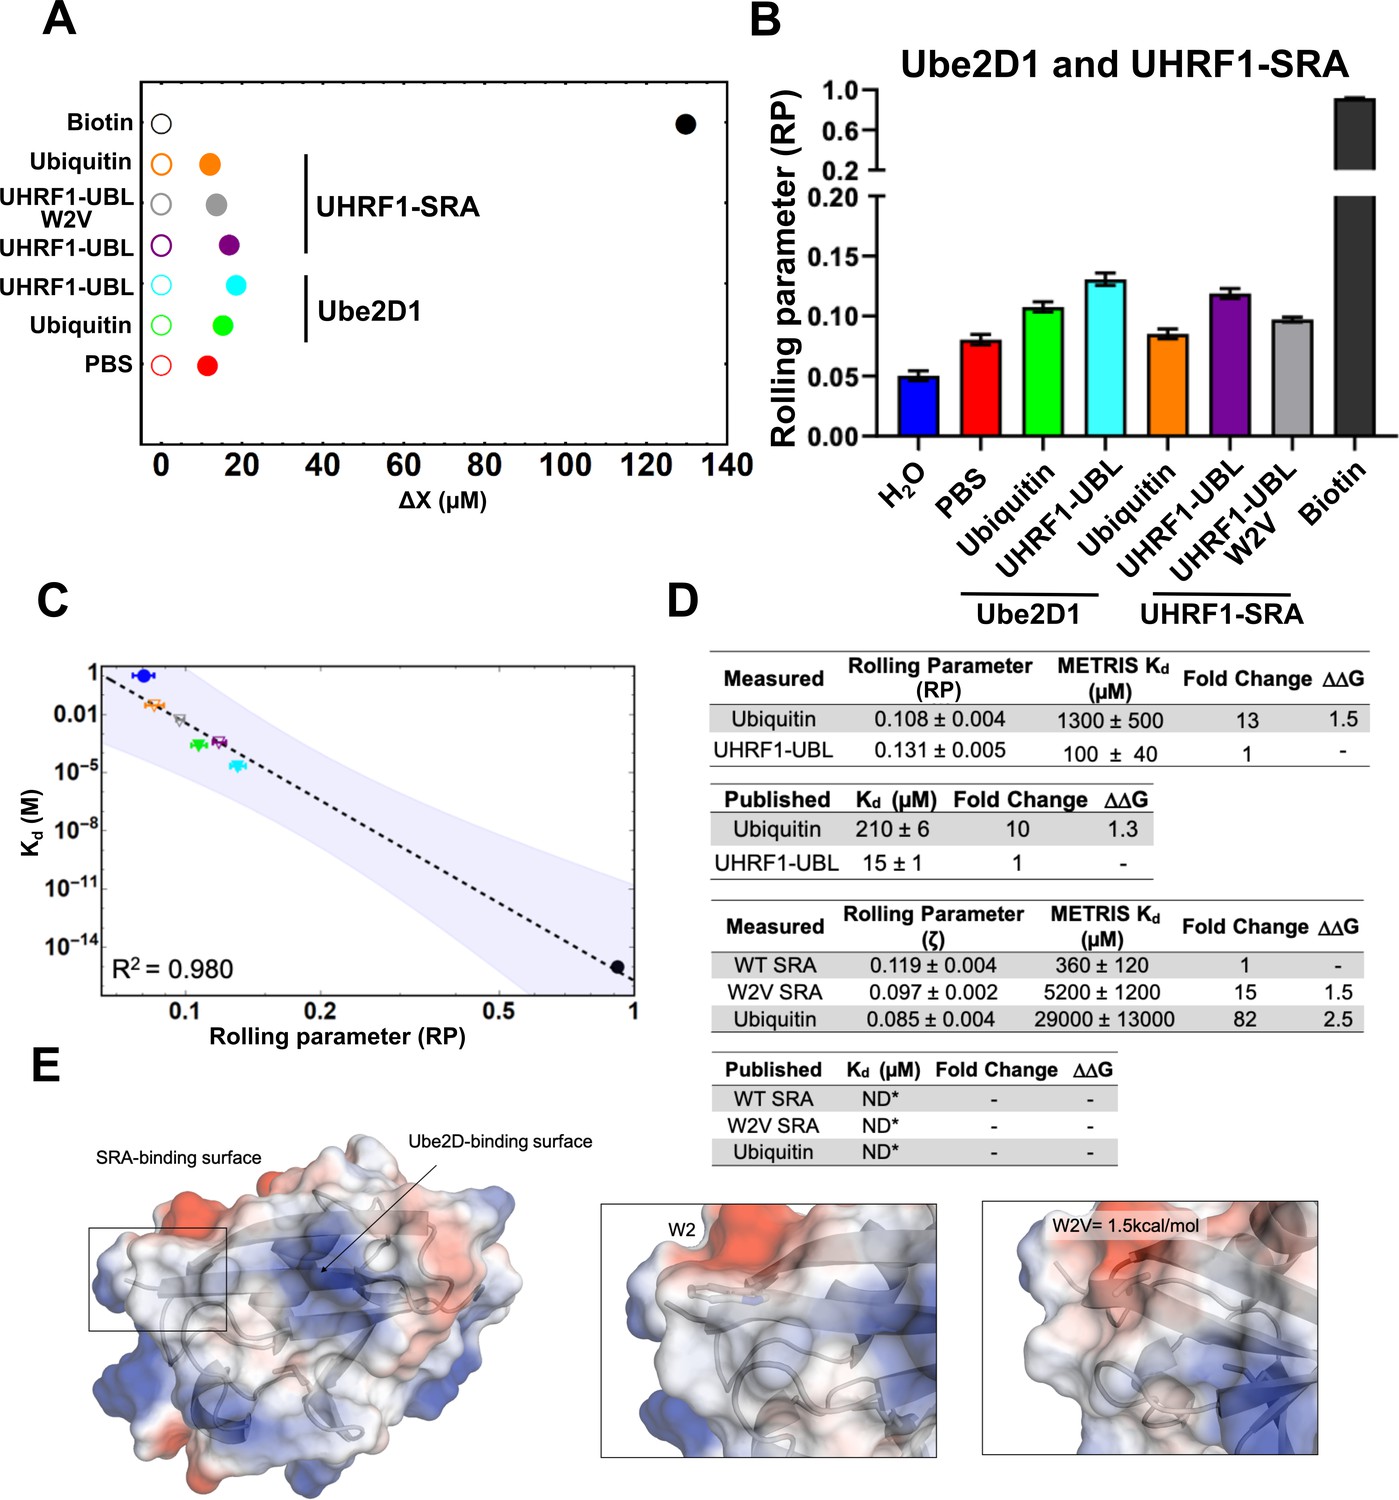
Measuring the interaction of UBL domains with Ube2D1 or the UHRF1-SRA domain using METRIS.
(A) Plot showing the average translational displacement per actuation for the rollers coated with the indicated proteins on a surface containing UbeD21 (E2) or the UHRF1-SRA domain. Streptavidin-Biotin and Streptavidin-avidin (PBS) are included for references. All comparisons are statistically significant (See Figure 4—source data 2 for results of statistical analysis.) (B) Plot showing the calculated RP for the indicated rollers (C) Log-Log plot of the rolling parameters, RP, from panel A. Extrapolated point markers are unfilled and the 95% confident interval for the fitting is depicted. (D) Table of all rolling parameters and associated METRIS-Kd estimates. Fold change is calculated as the ratio between the indicated protein and the UHRF1-UBL domain and the is calculated using these ratios at T=298K. Kd values for ubiquitin are taken from Buetow et al., 2015 and UHRF1-UBL value taken from DaRosa et al., 2018. (E) Image of the UHRF1-UBL binding surface for the UHRF1-SRA and Ube2D1 shown with electrostatic surface potentials (red = negative, blue = positive) with insets highlighting the change of the UBL surface with the W2V mutation and the associated .
-
Figure 4—source data 1
Rolling parameter from all rolls for the indicated rollers on either a Ube2D1 surface or a UHRF1-SRA surface.
Each row is a different roller and each column is an actuation.
- https://cdn.elifesciences.org/articles/67525/elife-67525-fig4-data1-v1.xlsx
-
Figure 4—source data 2
Statistical analysis of results from METRIS measurements for ubiquitin and UHRF1-UBL binding to Ube2D1 or UHRF1-SRA domain.
Results from statistical tests comparing the indicated pairs of rolling parameters (METRIS).
- https://cdn.elifesciences.org/articles/67525/elife-67525-fig4-data2-v1.xlsx
Figure 4—figure supplement 1
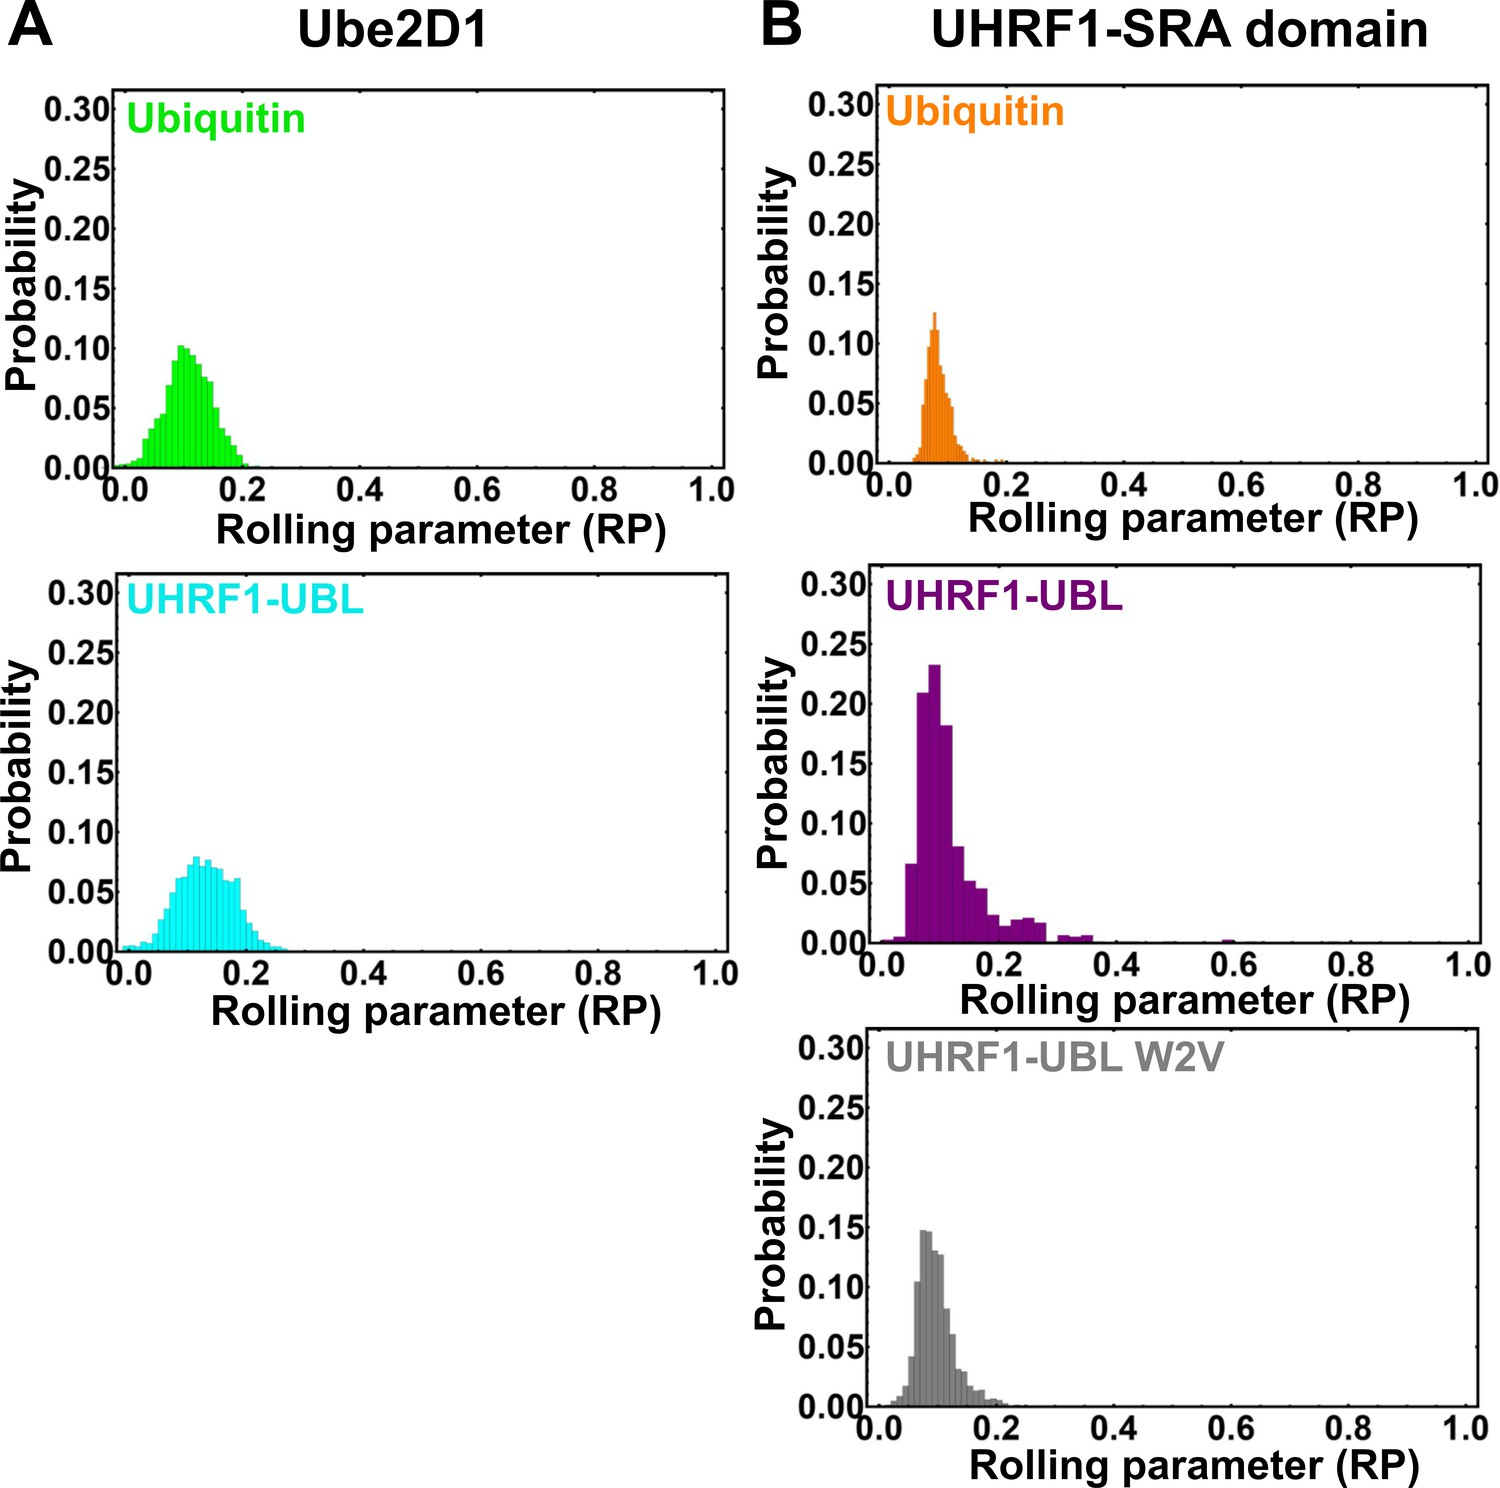
Rolling parameter for all rolls on the Ube2D1 or SRA surface.
(A) Histogram showing the distribution of RPs for the indicated beads on the Ube2D1-coated surface. (B) Histogram showing the distribution of RPs for the indicated beads on the UHRF1-SRA-coated surface. See Figure 4—source data 1 for the rolling parameter for each actuation.
Figure 4—animation 1
Animation of 30 rolls for each roller for all Ube2d1 and UHRF1 UBL family of interactions: Cyan, UHRF1-UBL; Green, ubiquitin; both on a Ube2D1 surface.
Purple, UHRF1-UBL, Grey UHRF1-UBL W2V; Orange; Ubiquitin, all on the UHRF1-SRA surface. The video is then reversed so it can be looped.
Figure 5
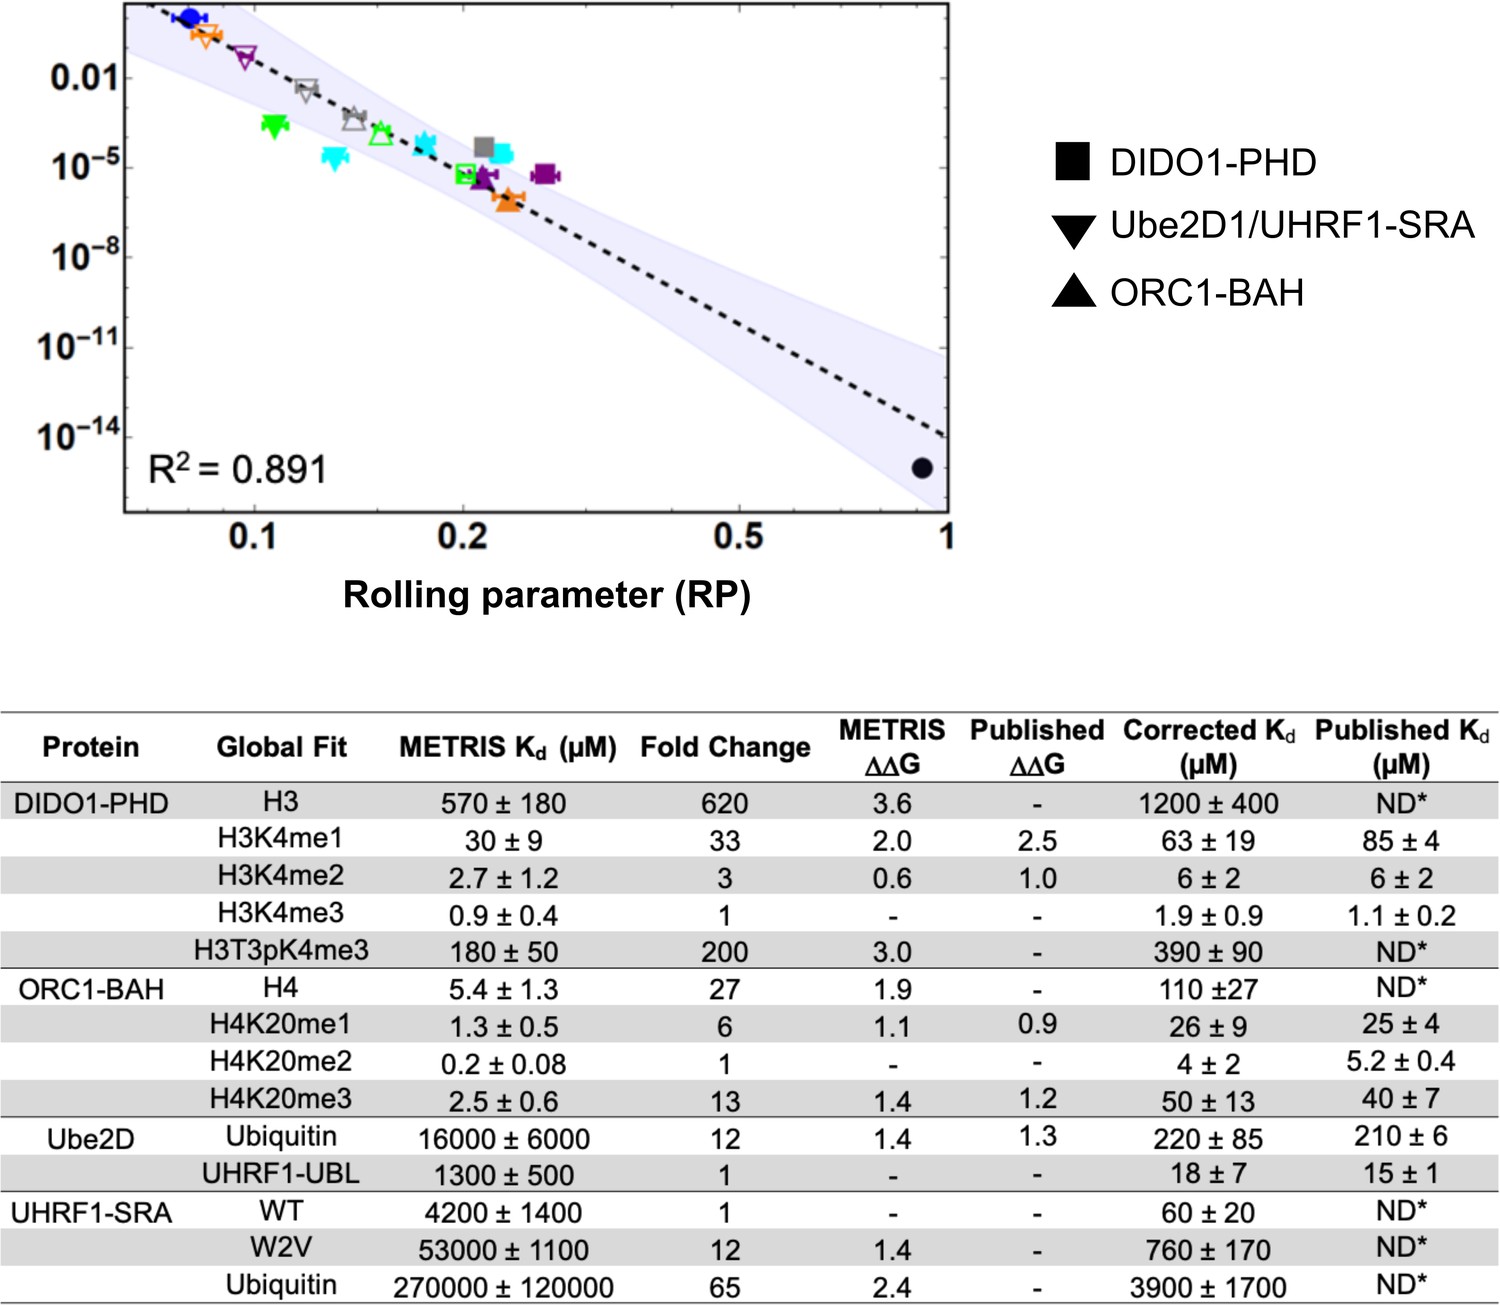
Global fit of binding partners for all METRIS experiments performed.
(A) Global Log-Log plot showing linearity between rolling parameter and dissociation constant for all interactions measured. (B) Table of binding constants of tested interaction partners when determined from the global fit. Fold change and are calculated in the same way as the previous example and the are similar to the previous reported value. Scaling factors are calculated by averaging the fold difference between METRIS-Kd and the published Kd for all interactions of the same type. Then the METRIS-Kd is multiplied by the scaling factor yielding the corrected Kds, which match the published values.
Author response image 1
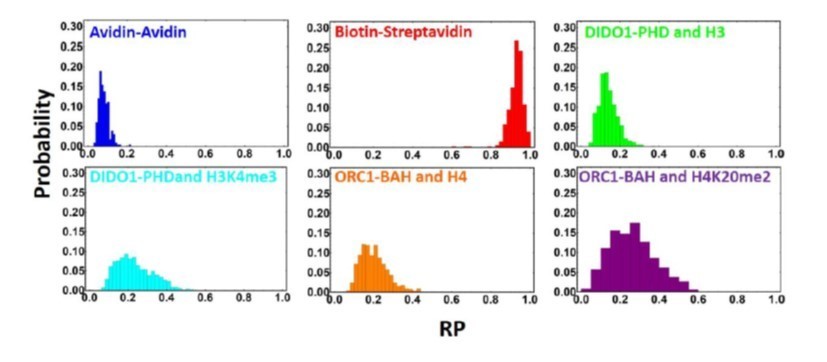
Distribution of rolling parameters for different PPI interactions.
Author response image 2
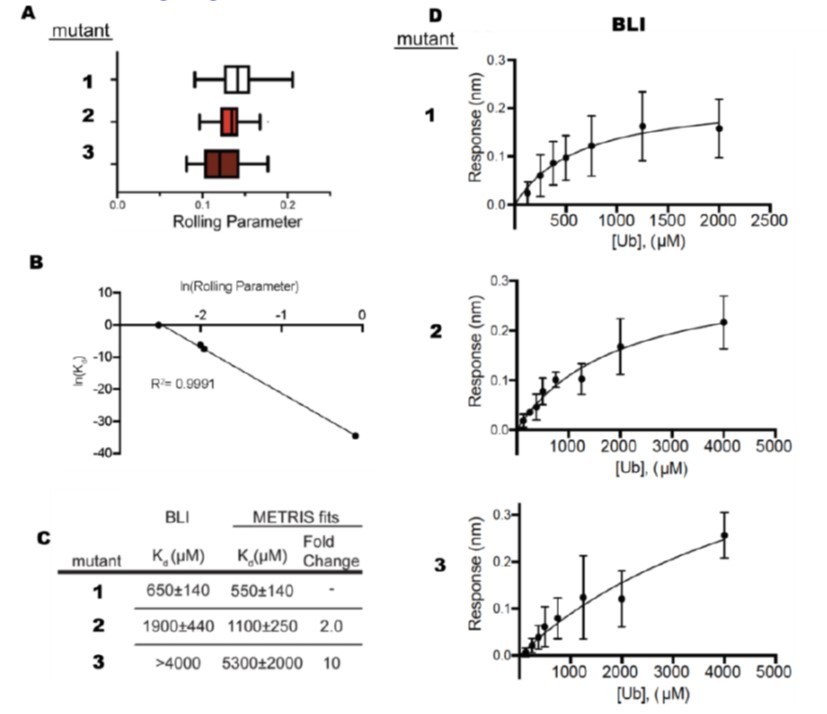
Comparison Between BLI and METRIS.
(A) Rolling parameter measurements for 3 mutants that bind ubiquitin. (B) Fit of METRIS to Kd values. (C) Kdvalues obtained from METRIS and BLI. (D) BLI data for each of the mutants.
Author response image 3
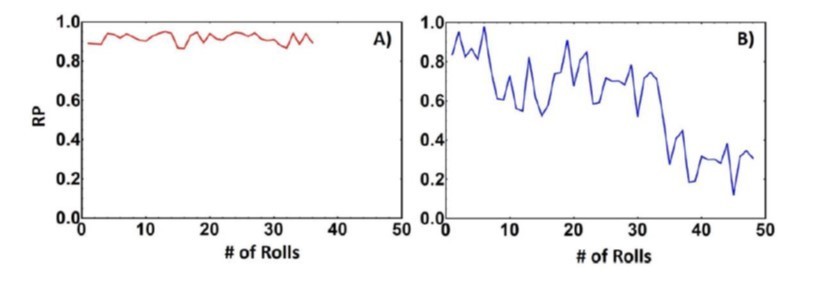
Rolling parameter of biotin-streptavidin interaction on avidin substrate (A) and a biotinylated supported lipid bilayer (B).
Author response image 4
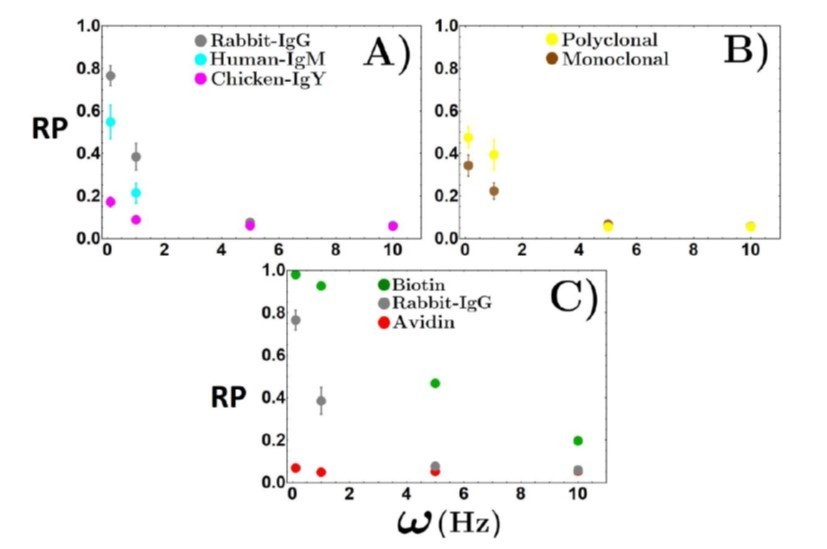
Rolling parameter as a function of rotational frequency for interactions.
Tables
Key resources table
| Reagent type (species) or resource | Designation | Source or reference | Identifiers | Additional information |
|---|---|---|---|---|
| Recombinant DNA reagent | BirA-GST-Orc1-BAH; Orc1-BAH | This Study | Strahl Lab, pGEX vector, Figure 2 | |
| Recombinant DNA reagent | BirA-GST-DIDO1-PHD; DIDO1-PHD | This Study | Strahl Lab, pGEX vector, Figure 3 | |
| Recombinant DNA reagent | N-cys Ubiquitin; ubiquitin | Kamadurai, Hari B et al. ‘Insights into ubiquitin transfer cascades from a structure of a UbcH5B approximately ubiquitin-HECT(NEDD4L) complex.’ Molecular cell vol. 36,6 (2009): 1095–102. | pGEX vector, | |
| Recombinant DNA reagent | Ube2D1 | DaRosa, Paul A et al. ‘A Bifunctional Role for the UHRF1 UBL Domain in the Control of Hemi-methylated DNA-Dependent Histone Ubiquitylation.’ Molecular cell vol. 72,4 (2018): 753–765.e6. | Pet15 vector, | |
| Recombinant DNA reagent | UHRF1-SRA | This study | Harrison Lab, MBP-pQ80L, Figure 4 | |
| Recombinant DNA reagent | N-cys-UHRF1-UBL W2V | This study | Harrison Lab, MBP-pQ80L, Figure 4 | |
| Recombinant DNA reagent | N-cys-UHRF1-UBL | This study | Harrison Lab, MBP-pQ80L, Figure 4 | |
| Software | Able Particle Tracker | Mu Labs | Full Version | http://apt.mulabs.com/ |
| Software | Mathematica | Steimel Labs | ||
| Software | OGG Video Converter | Ogg-converter.net | Version 6 | |
| Software | Pymol | Schrödinger | V2.4 | |
| Software | Prism | GraphPad | ||
| Other | Streptavidin Coated Ferromagnetic Beads | Spherotech | SVFM-100–4 | |
| Other | Avidin Coated Slides | ArrayIt | SMV | |
| Other | Histone peptide array | Petell, Christopher J et al. ‘Improved methods for the detection of histone interactions with peptide microarrays.’ Scientific reports vol. 9,1 6265. 18 Apr. 2019 | ||
| Antibody | Anti-GST (rabbit polyclonal) | Epicypher | 13–0022 | (1:1000) |
| Antibody | Anti-Rabbit AlexaFluor-647 (goat polyclonal) | Invitrogen | A21244 | (1:10,000) |
Additional files
Download links
A two-part list of links to download the article, or parts of the article, in various formats.
Downloads (link to download the article as PDF)
Open citations (links to open the citations from this article in various online reference manager services)
Cite this article (links to download the citations from this article in formats compatible with various reference manager tools)
Mechanically transduced immunosorbent assay to measure protein-protein interactions
eLife 10:e67525.
https://doi.org/10.7554/eLife.67525


