A Brownian ratchet model for DNA loop extrusion by the cohesin complex
- Chromosome Segregation Laboratory, The Francis Crick Institute, United Kingdom
- Mechanobiology and Biophysics Laboratory, The Francis Crick Institute, United Kingdom
- Department of Physics and Astronomy, University College London, United Kingdom
Figures
Figure 1 with 1 supplement
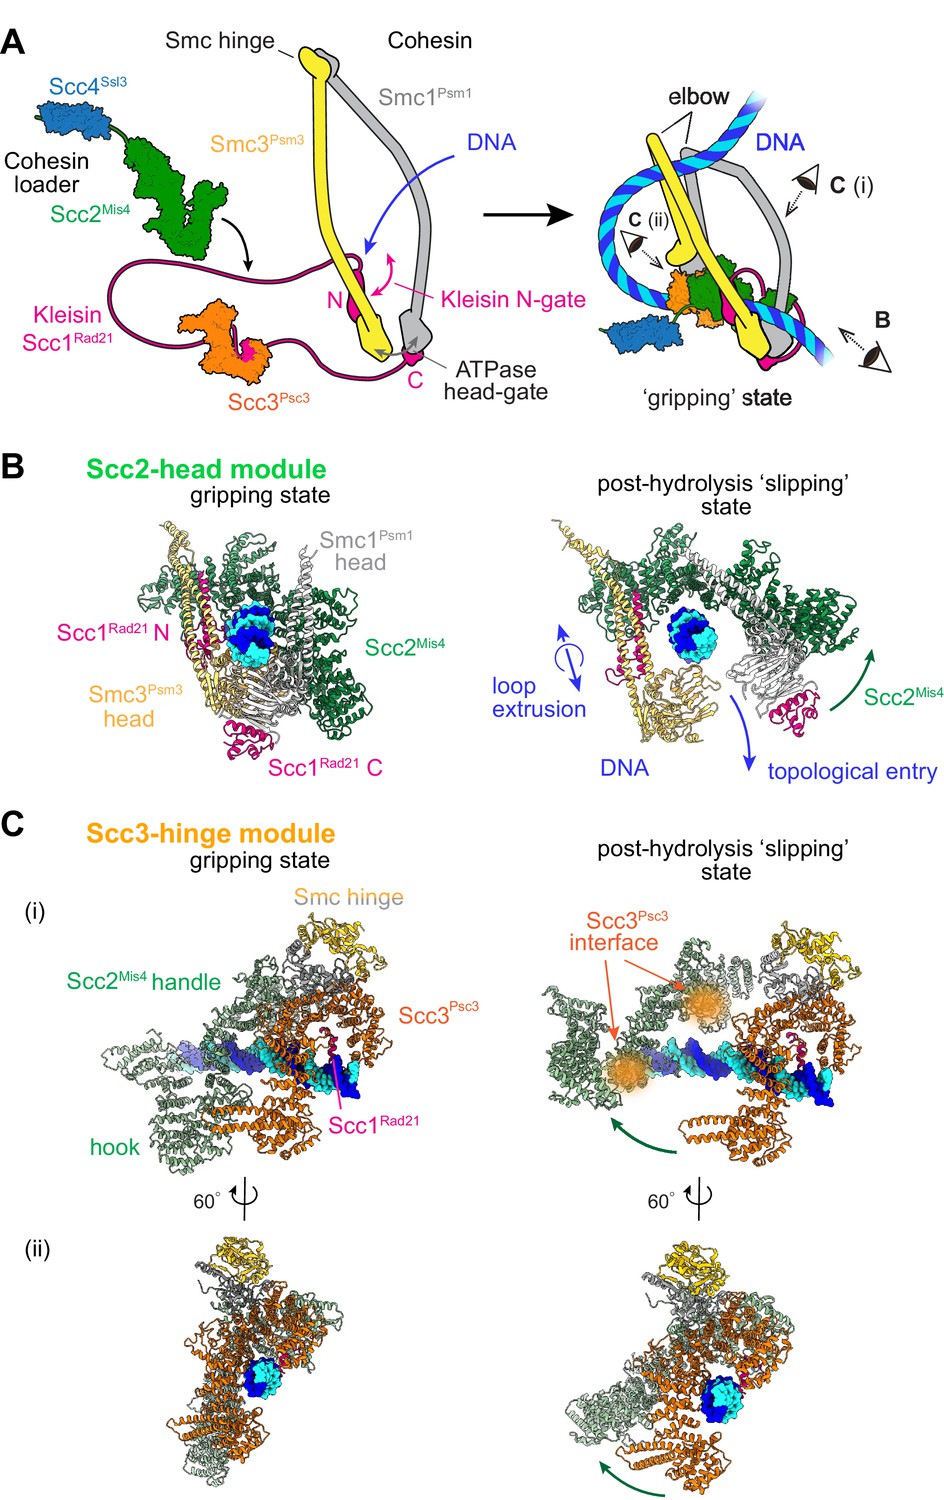
Two cohesin DNA binding modules in the gripping state and in their projected post-hydrolysis states.
(A) Structural overview of the cohesin complex components and assembly of the DNA gripping state. Viewpoints of the structures shown in (B and C) are indicated. (B) The Scc2-head module in the gripping state and its predicted conformation following ATP hydrolysis. ATPase head disengagement and return of Scc2Mis4 from the gripping state conformation to its extended crystal structure form results in loss of DNA interactions, turning the module into its ‘slipping state’. (C) The Scc3-hinge module. The DNA binding surface of this module remains unaltered by ATP hydrolysis. However, the Scc2Mis4 conformational change leads to uncoupling of the Scc3-hinge from the Scc2-head module.
Figure 1—figure supplement 1
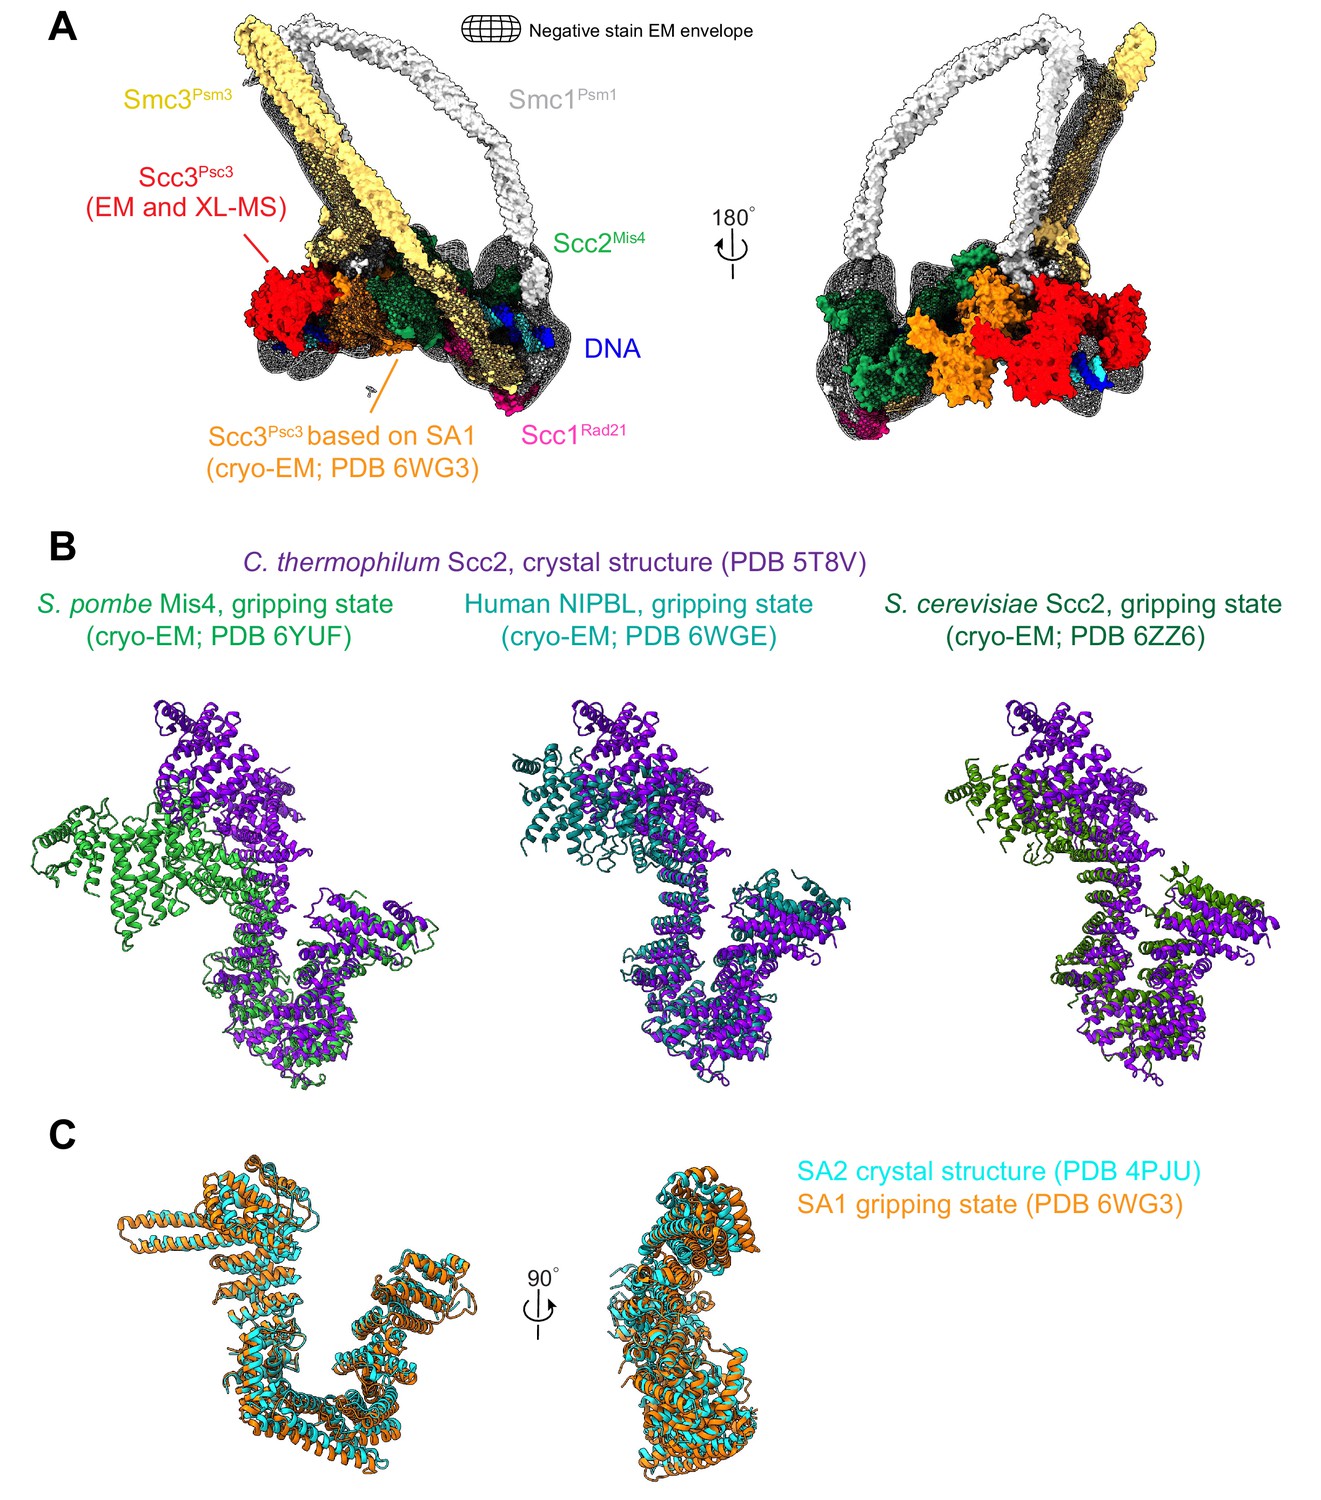
Configuration of Scc3Psc3 and Scc2Mis4 in the DNA gripping state.
(A) Hybrid structural model of fission yeast cohesin in the gripping state, built around a high-resolution cryo-EM structure of the SMC heads with proximal coiled coil, the Scc2Mis4 cohesin loader, as well as the kleisin Scc1Rad21 N- and C-terminal domains, in complex with DNA (Higashi et al., 2020). Structural models of Scc3Psc3 (shown in red), the SMC hinge and remaining coiled coil were added, based on the negative stain EM envelope and information from protein crosslinking mass spectrometry data. The higher resolution of Scc3SA1 in the human structure revealed Scc3Psc3 interactions with both the cohesin loader and the SMC hinge (Shi et al., 2020). For our considerations of the gripping state, we therefore model Scc3Psc3 to take the position of human Scc3SA1 (shown in orange). (B) Structural comparisons of Scc2Mis4 in the fission yeast, human and budding yeast gripping states (Collier et al., 2020; Higashi et al., 2020; Shi et al., 2020), aligned to the extended C. thermophilum Scc2 crystal structure form (Kikuchi et al., 2016). (C) Structural comparison of human Scc3SA1 in the gripping state with the free crystal structure form of Scc3SA2 (Hara et al., 2014).
Figure 2 with 2 supplements
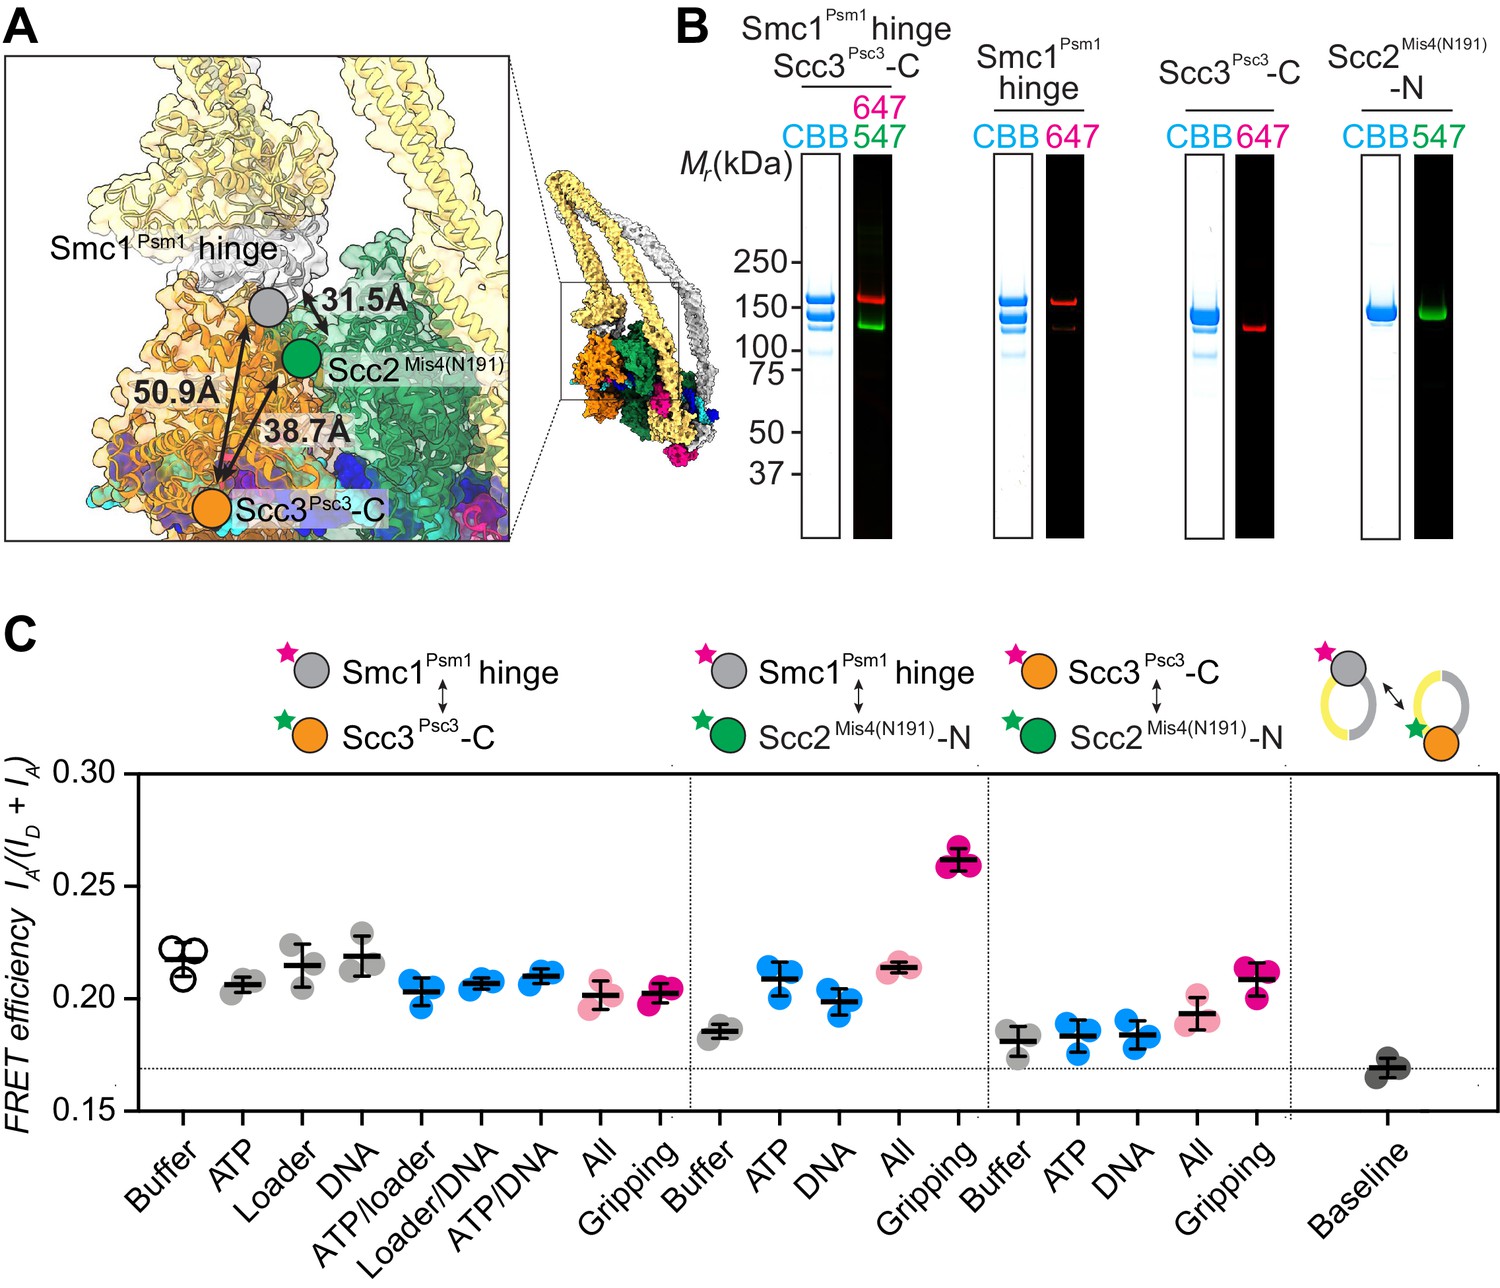
FRET-based conformational analyses of the Scc3-hinge and Scc2-head modules.
(A) FRET reporter positions on the fission yeast cohesin structural model in the DNA gripping state. The silver, orange, and green circles mark the positions of the Smc1Psm1 hinge residue R593, the Scc3Psc3 C-terminal residue E959 and Scc2Mis4 residue P209, respectively. The Euclidean distances between the Cα atoms of these residues are indicated. (B) The purified and labeled cohesin complexes and Scc2Mis4(N191) cohesin loader were analyzed by SDS-PAGE followed by Coomassie blue staining (CBB) or in gel fluorescence detection of the Cy547 (547) and Alexa 647 (647) dyes. (C) Relative FRET efficiencies IA/(ID + IA) between the respective elements were recorded under the indicated conditions, where ID is the donor and IA the acceptor emission intensity resulting from donor excitation. The apparent FRET value observed using a mixture of single-labeled cohesins is indicated as a baseline. Results from three independent repeats of the experiments, their means and standard deviations are shown.
Figure 2—figure supplement 1

Control experiments for the FRET-based conformational analyses.
(A) Labeling efficiencies of the cohesin complexes and Scc2Mis4(N191), calculated based on protein absorbance at 280 nm and fluorophore absorbance at 560 and 660 nm as detailed in the Materials and methods. Shown is also the purified cohesin complex, single-labeled with Dy547 at the Scc3Psc3 C-terminus, used for the FRET baseline determination. Labeling efficiencies were typically around 50%, though somewhat lower in the case of Psc3, maybe due to the tendency of the latter subunit to be a substoichiometric component of the cohesin complex during protein purification. (B) In vitro topological DNA loading assays to confirm the biochemical activity of the fluorophore-labeled cohesin complex components shown in (A).
Figure 2—figure supplement 2

Investigation of complex formation between cohesin and the Scc2Mis4(N191) cohesin loader.
Following incubation of cohesin and Scc2Mis4(N191) under the conditions used for FRET recordings, cohesin was immunoprecipitated via a Pk epitope tag at the Smc3Psm3 C-terminus. Coprecipitation of Scc2Mis4(N191) was analyzed by SDS-PAGE followed by immunoblotting and in-gel fluorescence detection.
Figure 3 with 1 supplement
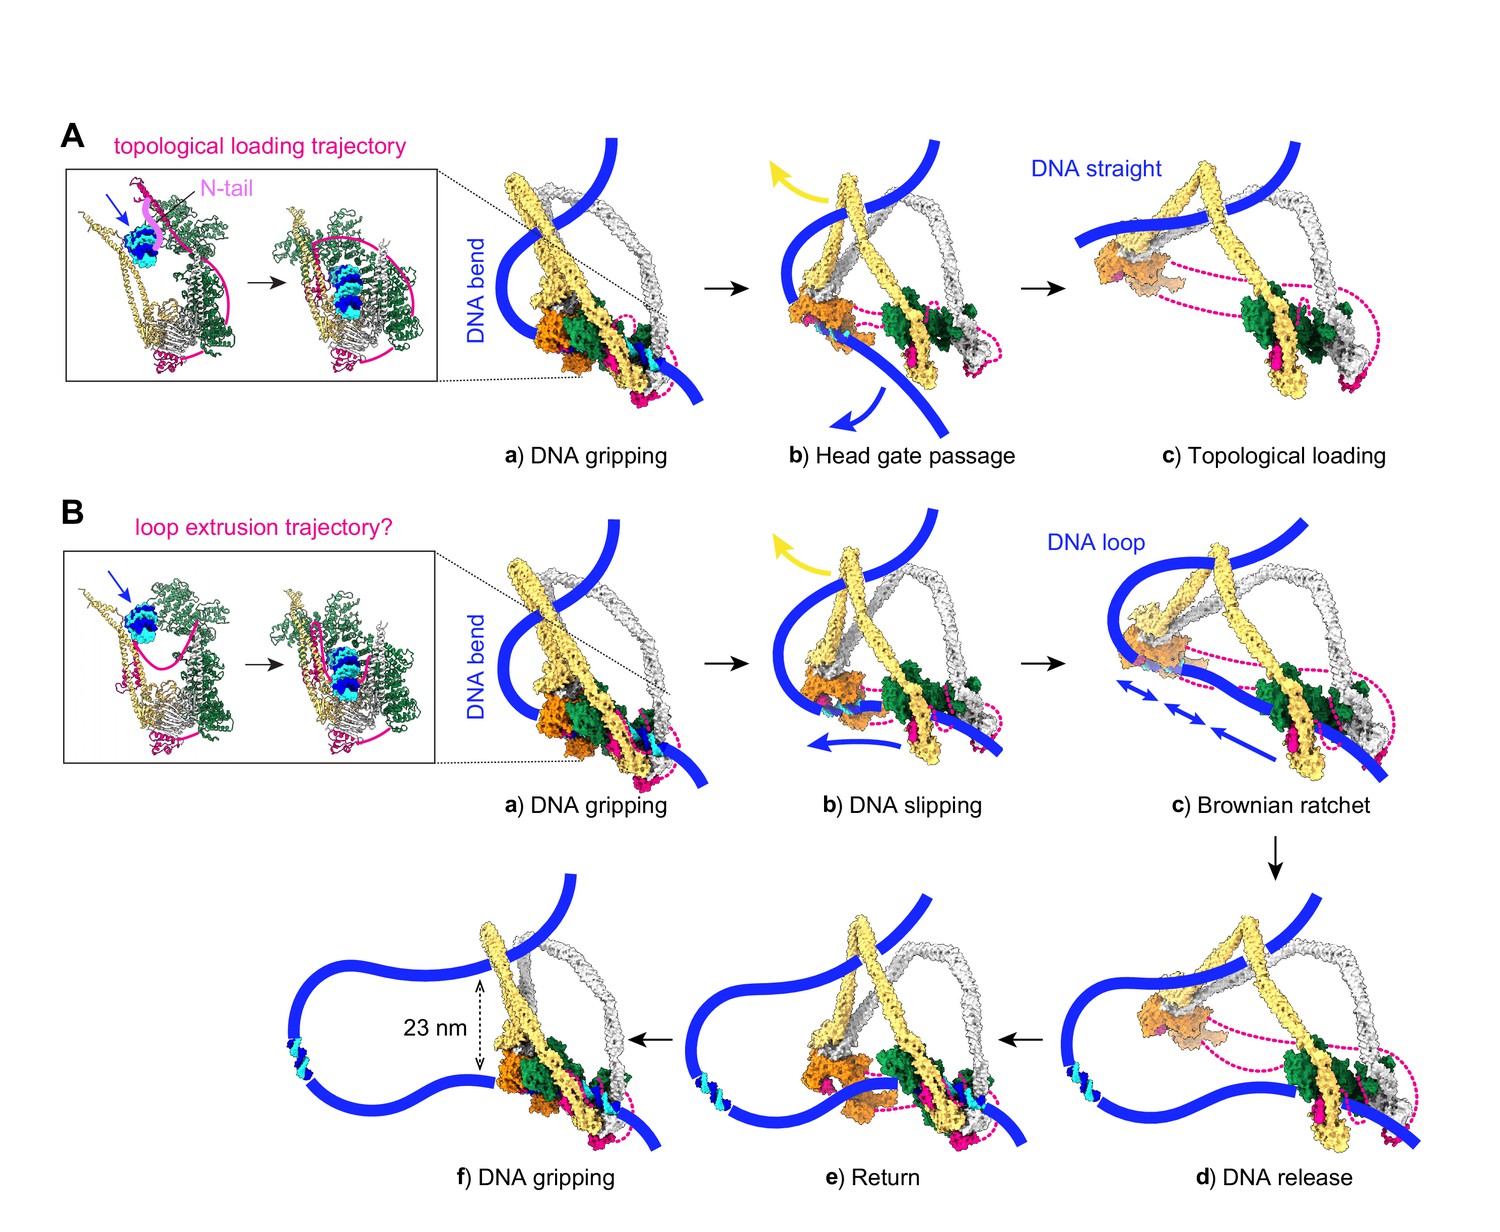
Molecular models for topological DNA entry into the cohesin ring and for loop extrusion.
(A) Topological DNA entry into the cohesin ring. (a) DNA enters through the open kleisin-N gate. DNA binding by both the Scc2-head and Scc3-hinge modules introduces a DNA bend. (b) ATP hydrolysis opens the SMC head gate. The swinging motion of the Scc3-hinge module (indicated by a yellow arrow) steers the DNA through the head gate to complete topological entry. (c) DNA is topologically entrapped in the Scc3-Smc3-kleisin-N chamber. (B) Loop extrusion. (a) DNA arrives in the gripping state without passing the kleisin N-gate. (b) ATP hydrolysis leads to SMC head gate opening, but the kleisin path prevents DNA passage. The swinging motion of the Scc3-hinge module instead turns the DNA bend into a loop, while DNA slips along the Scc2-head module. (c) Loop growth depends on the stochastic Brownian motion of the Scc3-hinge module. (d) The low DNA affinity of the Scc3-hinge module results in DNA release. (e) The Scc3-hinge module returns to form a new DNA gripping state upon nucleotide binding. (f) The next loop extrusion cycle begins. The in- and outbound DNAs are constrained by cohesin at a distance of ~23 nm, in line with recent measurements of the condensin neck size when engaged in loop extrusion (Ryu et al., 2020a).
Figure 3—figure supplement 1
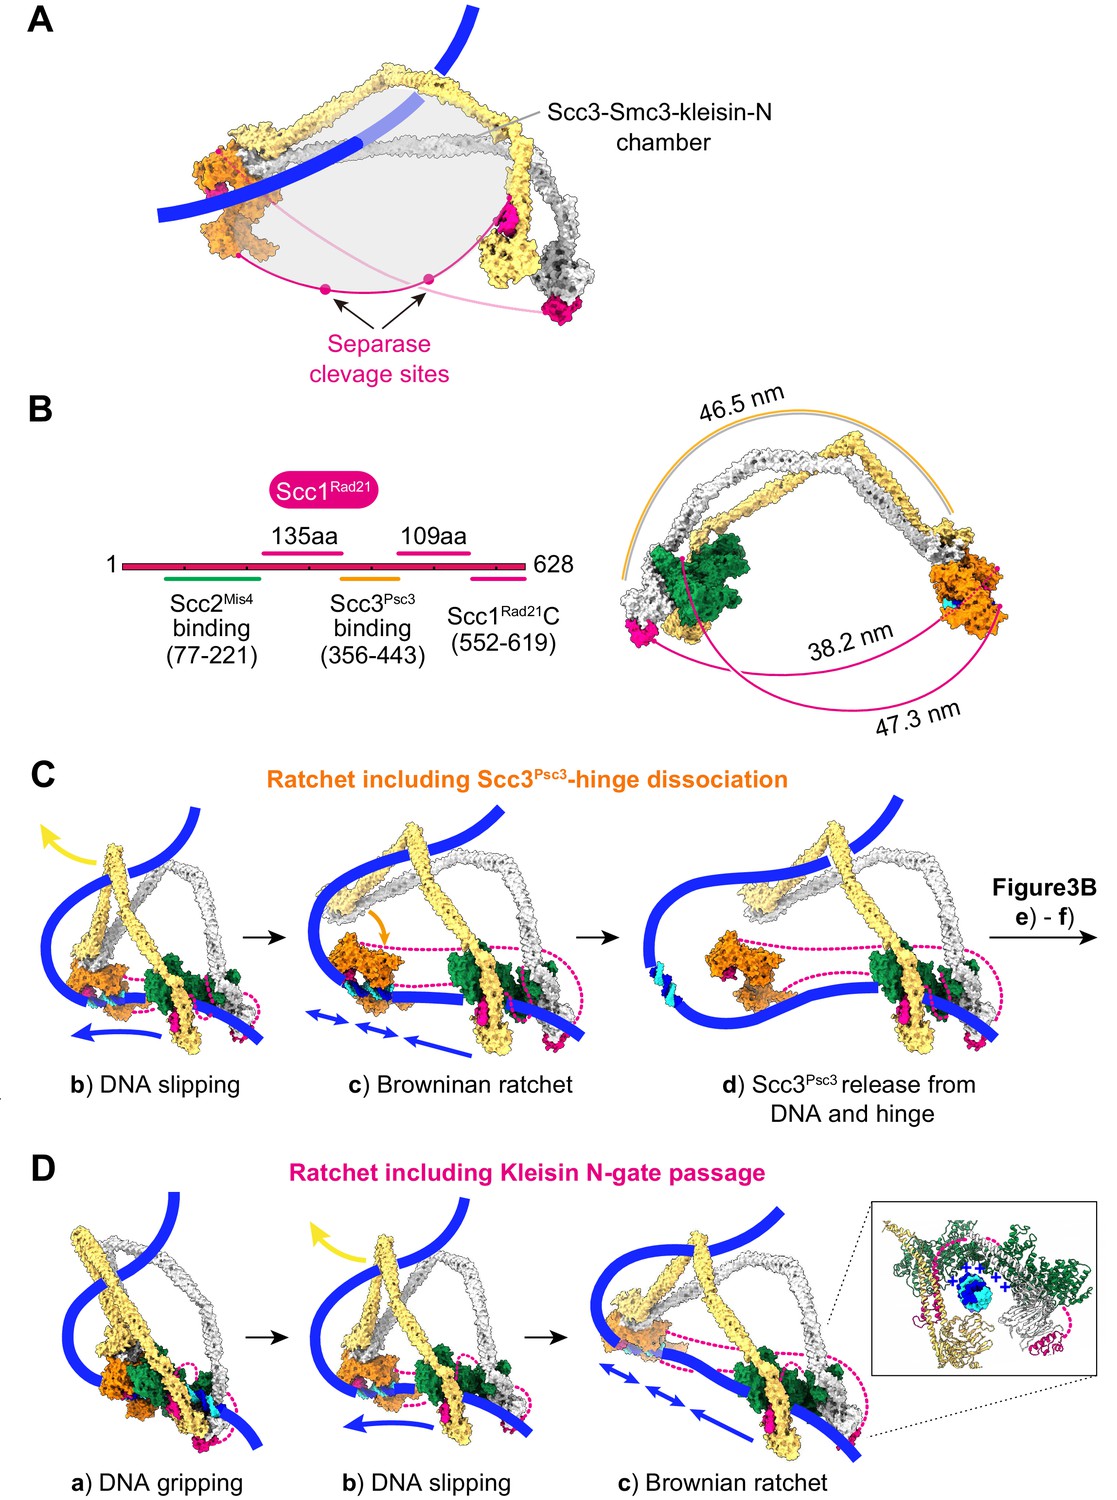
Additional views of cohesin during topological loading onto DNA and during loop extrusion.
(A) Following completion of topological loading, DNA finds itself in the Scc3-Smc3-kleisin-N chamber, delineated by Scc3Psc3, the Smc3Psm3 coiled coil and the kleisin unstructured region between the kleisin N-gate and Scc3Psc3 interaction site. Two separase recognition sequences, whose cleavage liberates cohesin from DNA to trigger anaphase, are indicated. (B) Schematic of the kleisin and the lengths of its unstructured regions. A molecular model depicts the potential span of the kleisin, using a conservative estimate of 3.5 Å per amino acid (Ainavarapu et al., 2007), compared to the length of the SMC coiled coil. (C) Consequences for loop extrusion if Scc3Psc3 dissociates from the SMC hinge in the Brownian ratchet state (corresponding to Figure 3B, panel c). Loop extrusion remains unaffected, as long as Scc3Psc3 rejoins the complex during the next gripping state assembly (corresponding to Figure 3B, panels (e) and (f)). (D) An alternative model in which loop extrusion initiates following successful DNA passage of the kleisin N-gate. In this scenario, nothing obstructs the ATPase head gate in the slipping state, but DNA is retained by the Scc2-head module owing to electrostatic contacts of the positively charged Scc2Mis4 surface with DNA.
Figure 4

Loop extrusion by the fission yeast cohesin complex.
(A) Time course of DNA loop extrusion. Scale bar 1 μm. A doubly tethered DNA molecule (48.5 kbp) is stained with Sytox Orange and stretched using buffer flow at 15 μl/min. Upon addition of cohesin and cohesin loader in the presence of ATP, a loop formed at the tip of the DNA and dynamically extended toward the DNA ends. The corresponding loop size change over time is plotted. (B) Mean DNA loop extrusion rates from n = 21 DNA molecules analyzed.
Figure 5
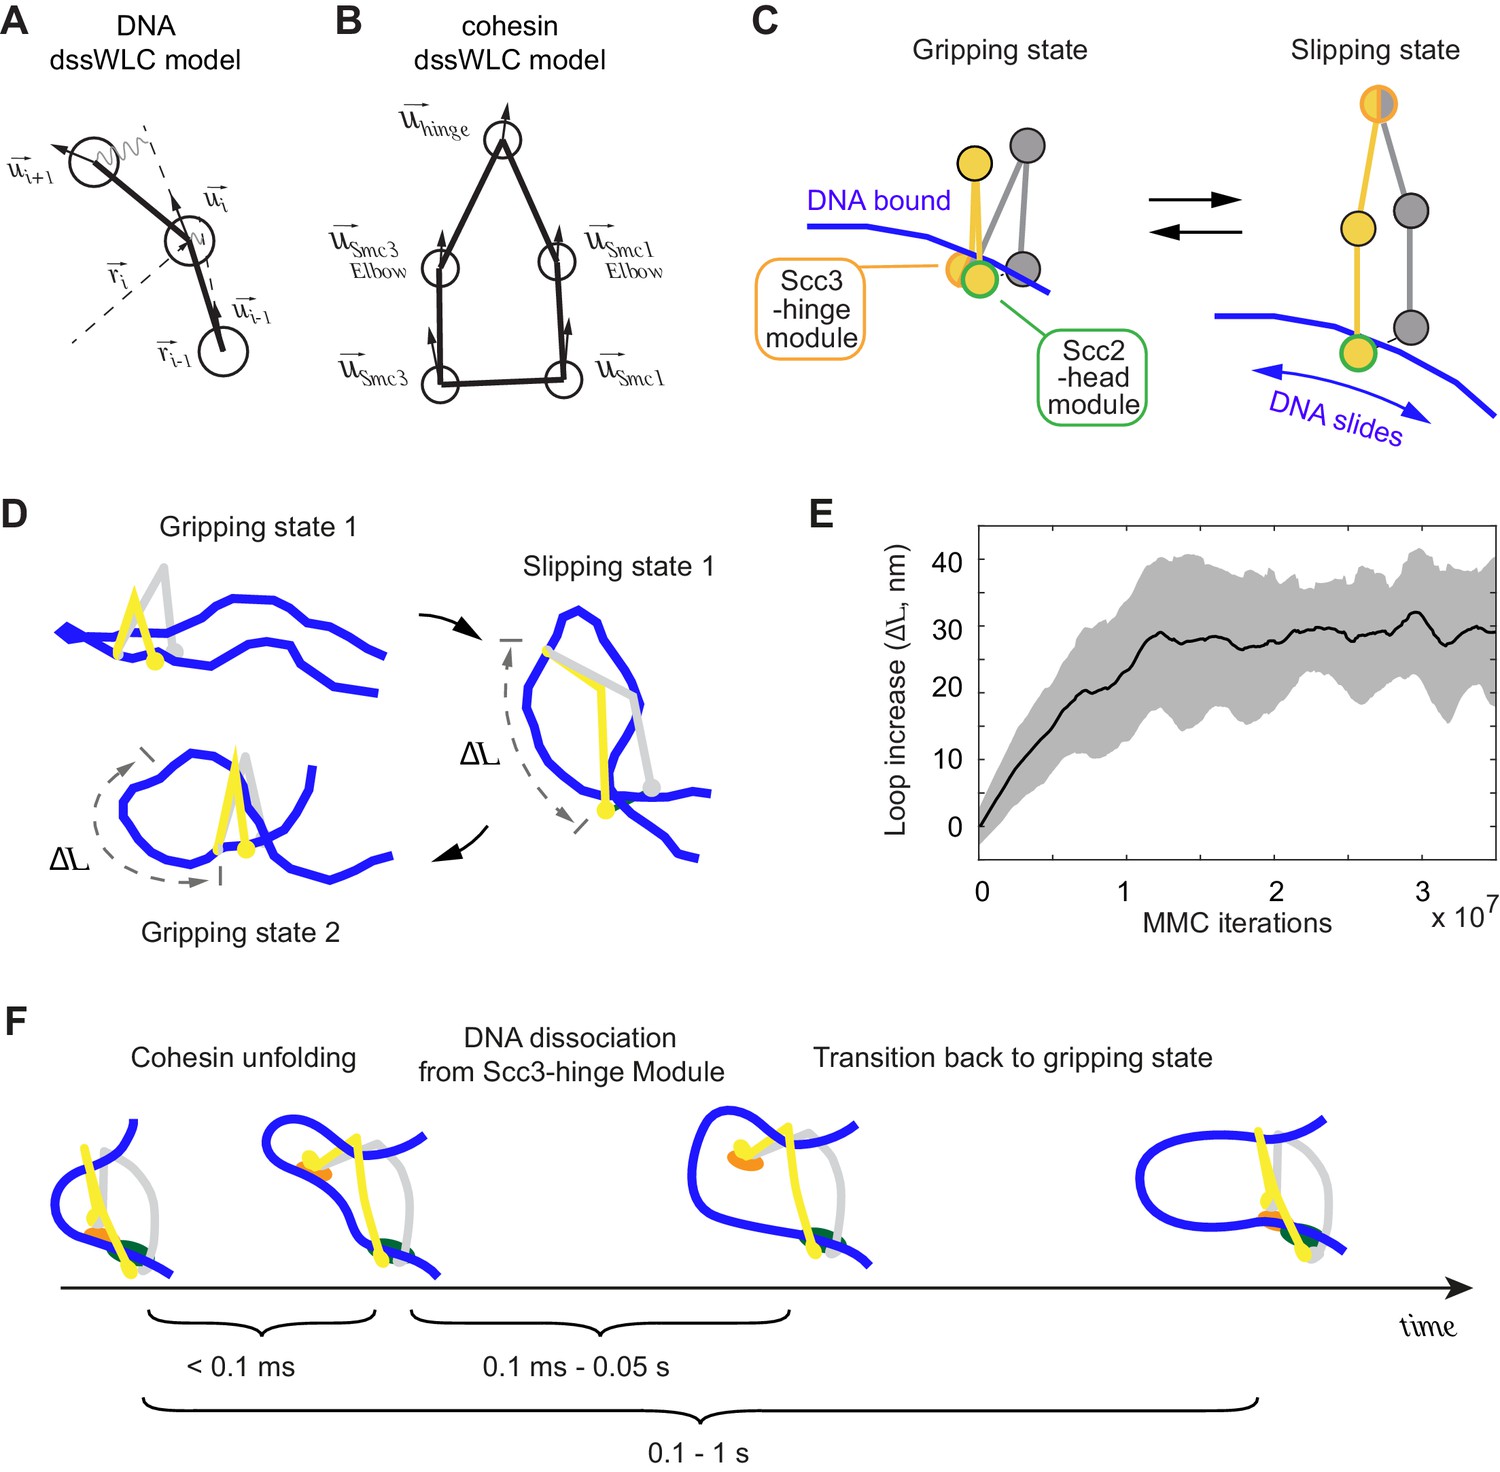
3D Metropolis Monte-Carlo simulation of cohesin-DNA interactions.
(A) Representation of DNA as a dssWLC model. DNA is split into 5 nm long segments. Each segment is described by its radius vector and a unit vector that defines segment orientation. (B) Cohesin is described by five beads corresponding to Smc1 and Smc3 heads and elbows as well as the hinge. The bead positions are defined by the corresponding vector radii (not shown) and their orientation by unit vectors. (C) The two equilibrium conformations of the model, corresponding to the gripping and slipping states. (D) Snapshots from a simulation, started in a gripping state. The system was sampled 2.5·106 times and then the equilibrium state was changed to the slipping state. It was sampled for another 8·106 iterations, which led to cohesin unfolding and loop extension. At iteration 1·107, the equilibrium conformation was returned to gripping state. (E) Loop length increase shown as function of Metropolis Monte-Carlo (MMC) iterations following the gripping to the slipping state transition. Before iteration zero, the system was equilibrated for 2·106 rounds in the gripping state. The black line represents the average and the gray area the standard deviation across 10 independent simulation replicates. (F) Schematic to show time progression of the DNA interaction with the Scc3-hinge module. Time intervals show indicative ranges of model parameters.
Figure 6 with 1 supplement
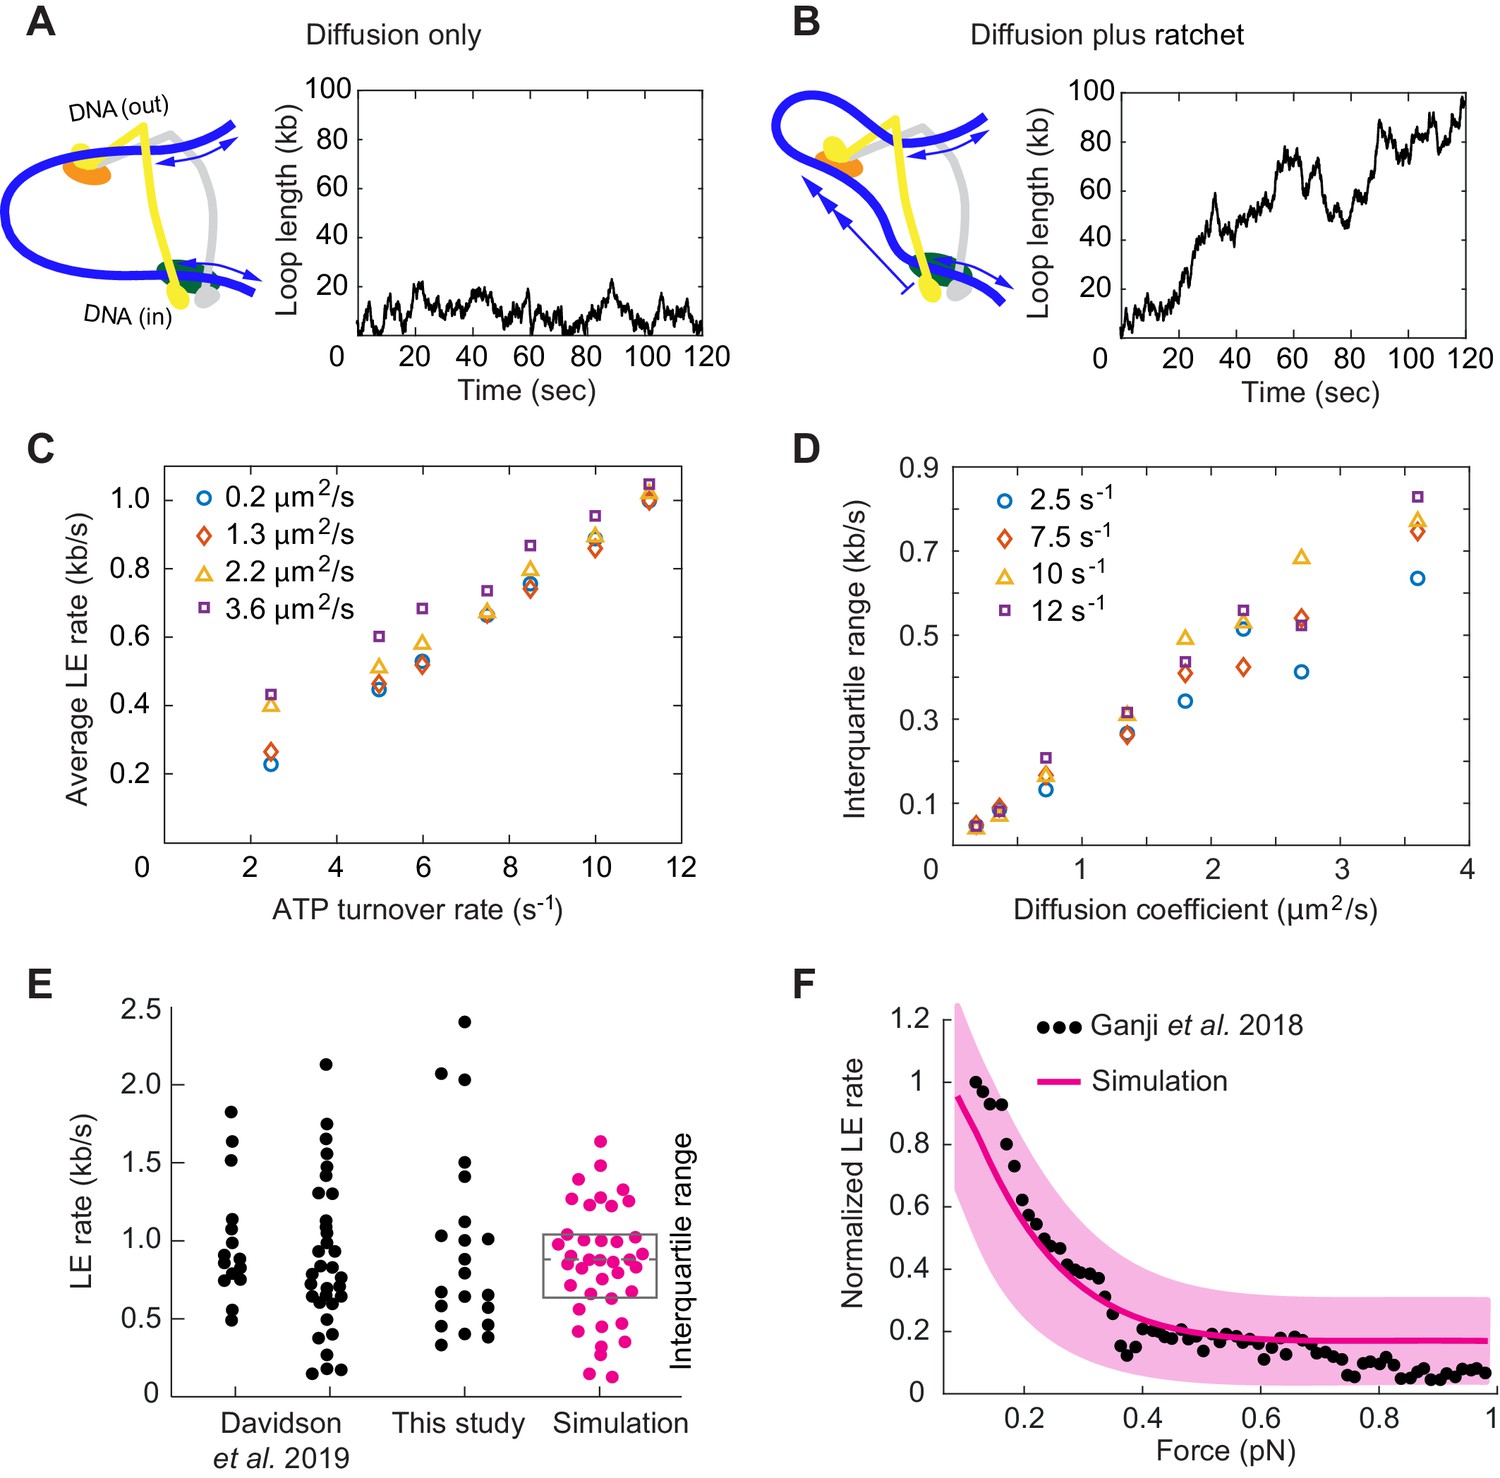
Loop extrusion by cohesin as a Brownian ratchet.
(A) DNA loop size changes due to diffusion only of both DNAs. (B) DNA loop size changes due to random diffusion plus directed diffusion generated by cohesin’s gripping to slipping state transition at a rate of 9 s−1. (C) Simulated average loop extrusion (LE) rates as a function of the cohesin cycle (ATP turnover) rate. Symbol colors represent simulations with the indicated diffusion coefficients. (D) Scatter in the loop extrusion rates, generated during 3 min simulations and quantified as the interquartile range, shown as a function of the outbound DNA diffusion coefficient. The diffusion coefficient for the inbound strand was 0.05 μm2/s. Symbol colors indicate simulations with different cohesin cycle rates. (E) Comparison of experimentally observed LE rate distributions of HeLa cell and recombinant human cohesin (left and right, Davidson et al., 2019), fission yeast cohesin from Figure 4, and an example of simulated data over the same time interval. (F) Comparison of the experimentally observed force dependence of condensin LE rates (Ganji et al., 2018) with the simulated outcome. The pink line shows the median across 35 simulations performed with discrete force values at 0.1 pN increments. The light pink area shows the corresponding interquartile range. Parameters for the simulations in (E) and (F) were: cohesin cycle rate = 9 s−1, DNA diffusion coefficient = 1.5 μm2/s, simulation time = 3 min.
Figure 6—figure supplement 1
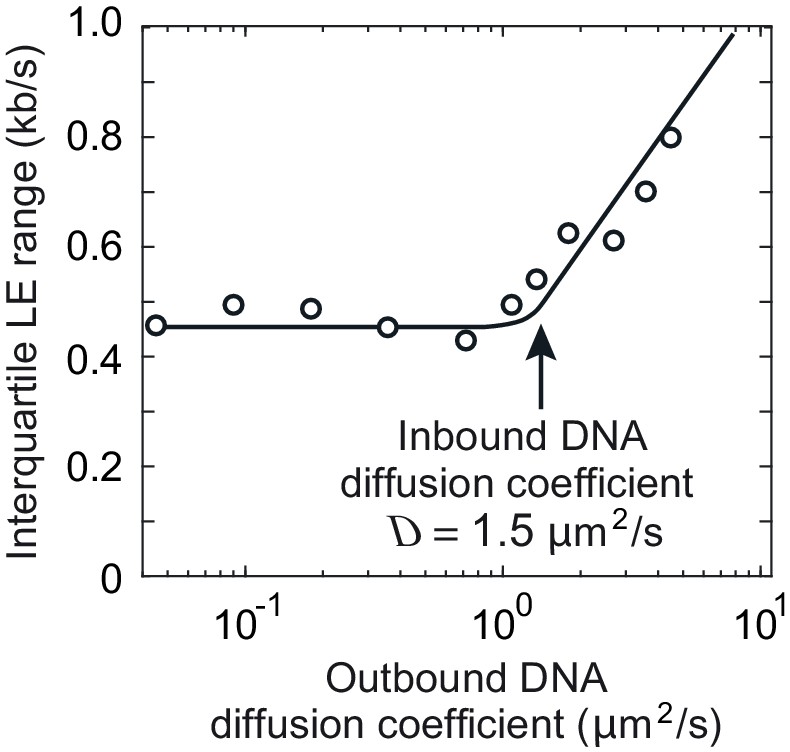
Interquartile range of loop extrusion (LE) rates when the DNAs entering and exiting the cohesin ring show divergent diffusion coefficients.
The diffusion coefficient of the inbound DNA was fixed at 1.5 μm2/s, while the diffusion coefficient of the outbound DNA varied between 0.05 and 5 μm2/s. The line indicates the overall trend. Simulations were over 3 min.
Figure 7
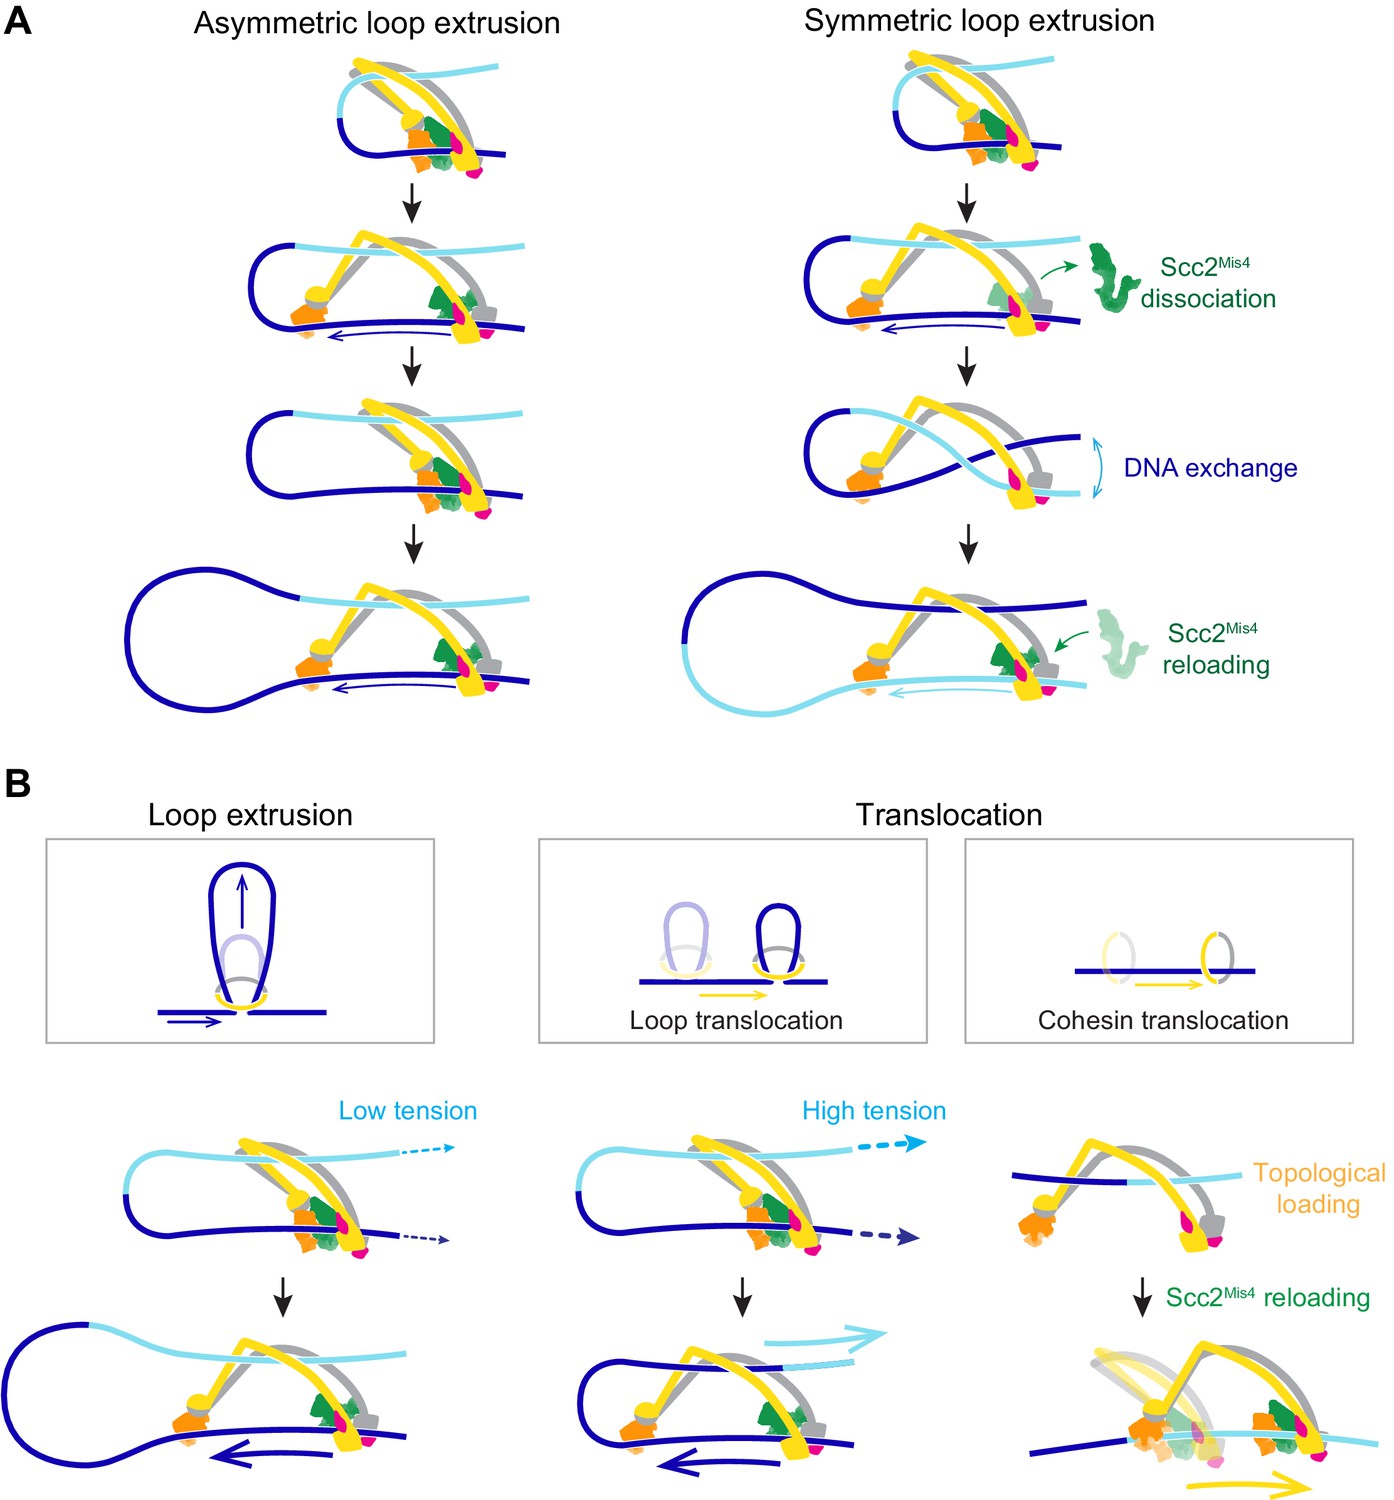
A model for asymmetric and symmetric loop extrusion, as well as possible mechanisms for cohesin translocation along stretched DNA.
(A) A model for symmetric loop extrusion as a special case of asymmetric loop extrusion. Continued action of the Brownian ratchet on the DNA that enters the cohesin ring results in Asymmetric loop extrusion. If the cohesin loader dissociates, reassembly of the Brownian ratchet following Scc2Mis4 reloading gives both DNAs an equal chance to become part of the ratchet. Over time, alternating asymmetric extrusion of both DNAs results in apparent Symmetric loop extrusion. (B) Two possible mechanisms for cohesin translocation along DNA under tension. Loop extrusion is possible only against very weak DNA counterforces. If loop growth stalls due to DNA tension, the continued operation of the Brownian ratchet leads to Loop translocation. Alternatively, cohesin might at first topologically load onto DNA. Recurring gripping state formation and resolution following topological loading results in Brownian ratchet driven Cohesin translocation.
Figure 8 with 2 supplements
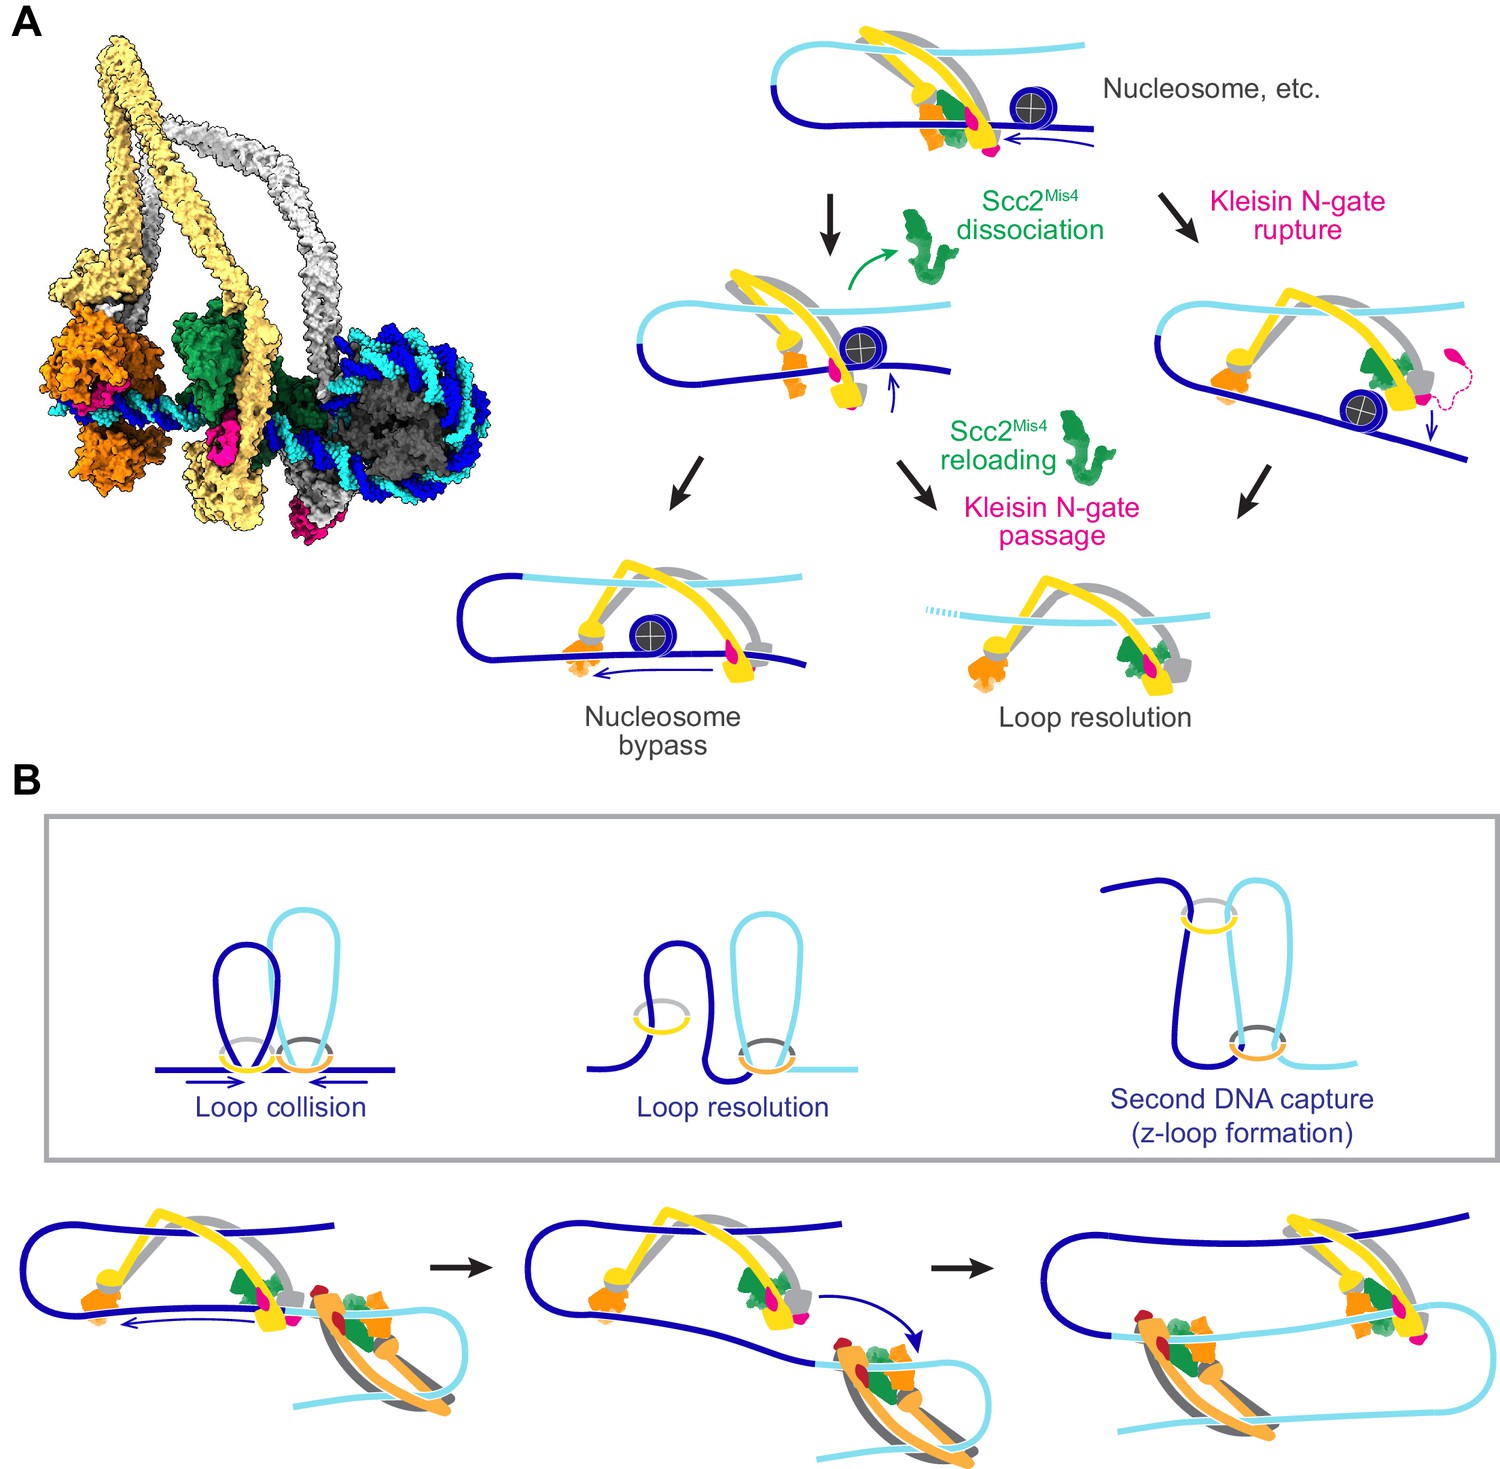
Possible outcomes of obstacle encounters.
(A) Structural model of cohesin in the slipping state encountering a nucleosome (left). Three possible outcomes are shown on the right. If the cohesin loader dissociates, an Scc3-hinge module stroke can achieve Nucleosome bypass before the next gripping state forms. Alternatively, cohesin loader dissociation and reloading opens a renewed opportunity for Kleisin N-gate passage by DNA, resulting in Loop resolution. The impact of a nucleosome collision might alternatively cause Kleisin N-gate rupture, which again results in Loop resolution. (B) A model for z-loop formation following head-on Loop collision of two loop extruding condensin complexes. One of the two condensins undergoes Loop resolution, by either kleisin N-gate passage or N-gate rupture. The now topologically bound condensin complex diffuses in search for a substrate for Second DNA capture, resulting in z-loop formation. During two-sided z-loop growth, depicted here, both in and outward pointing DNAs move through both condensin complexes. One is moved by each condensin’s Brownian ratchet, the other by the motion of the opposite condensin.
Figure 8—figure supplement 1
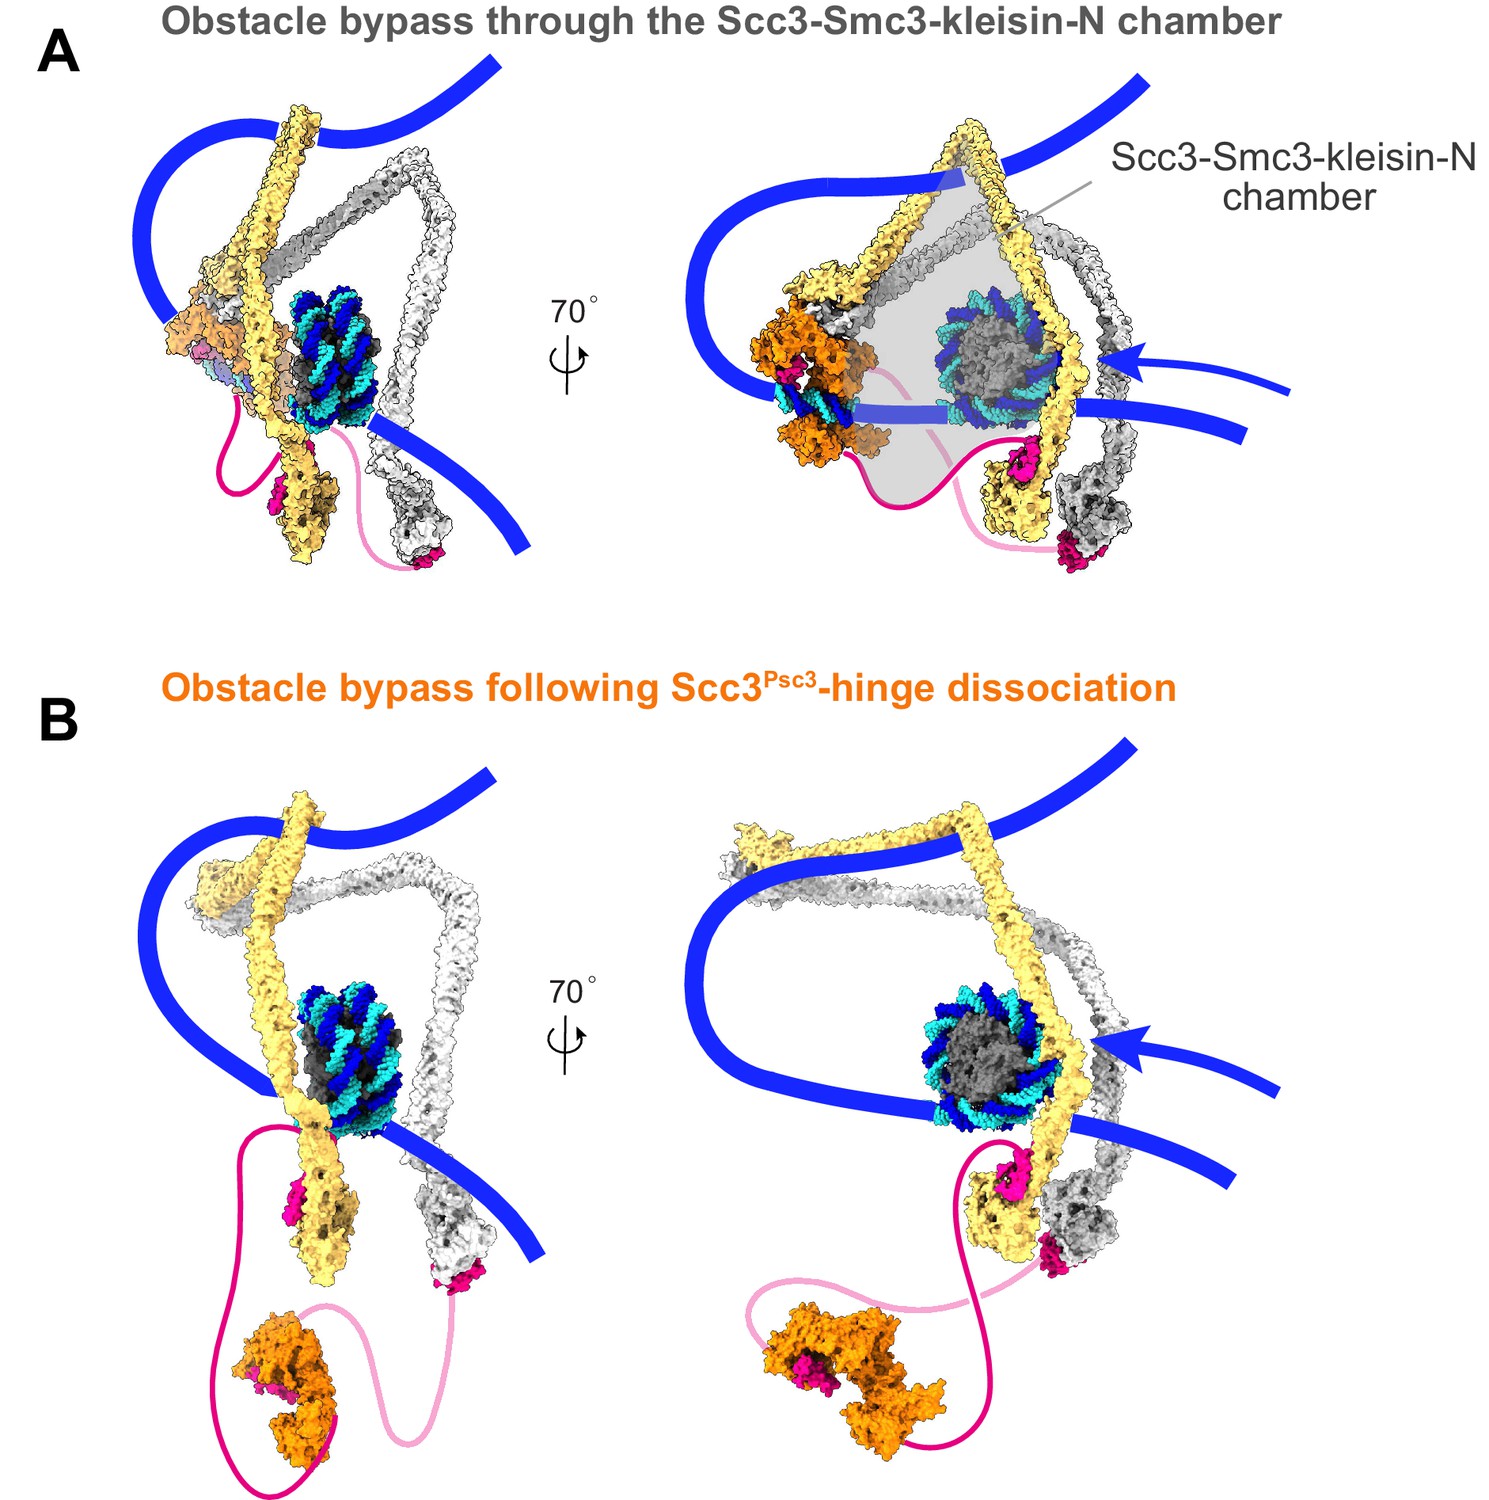
Additional views of cohesin during nucleosome bypass.
(A) Molecular model of nucleosome bypass by cohesin. Following dissociation of the cohesin loader, directed Brownian motion pulls incoming DNA through the Scc3-Smc3-kleisin-N chamber. This chamber is wide enough to accommodate a nucleosome and possibly even larger DNA-bound obstacles. (B) If the Scc3-hinge module disassembles in the Brownian ratchet phase of loop extrusion, the clearance for obstacle bypass by the cohesin ring is further enlarged.
Figure 8—figure supplement 2
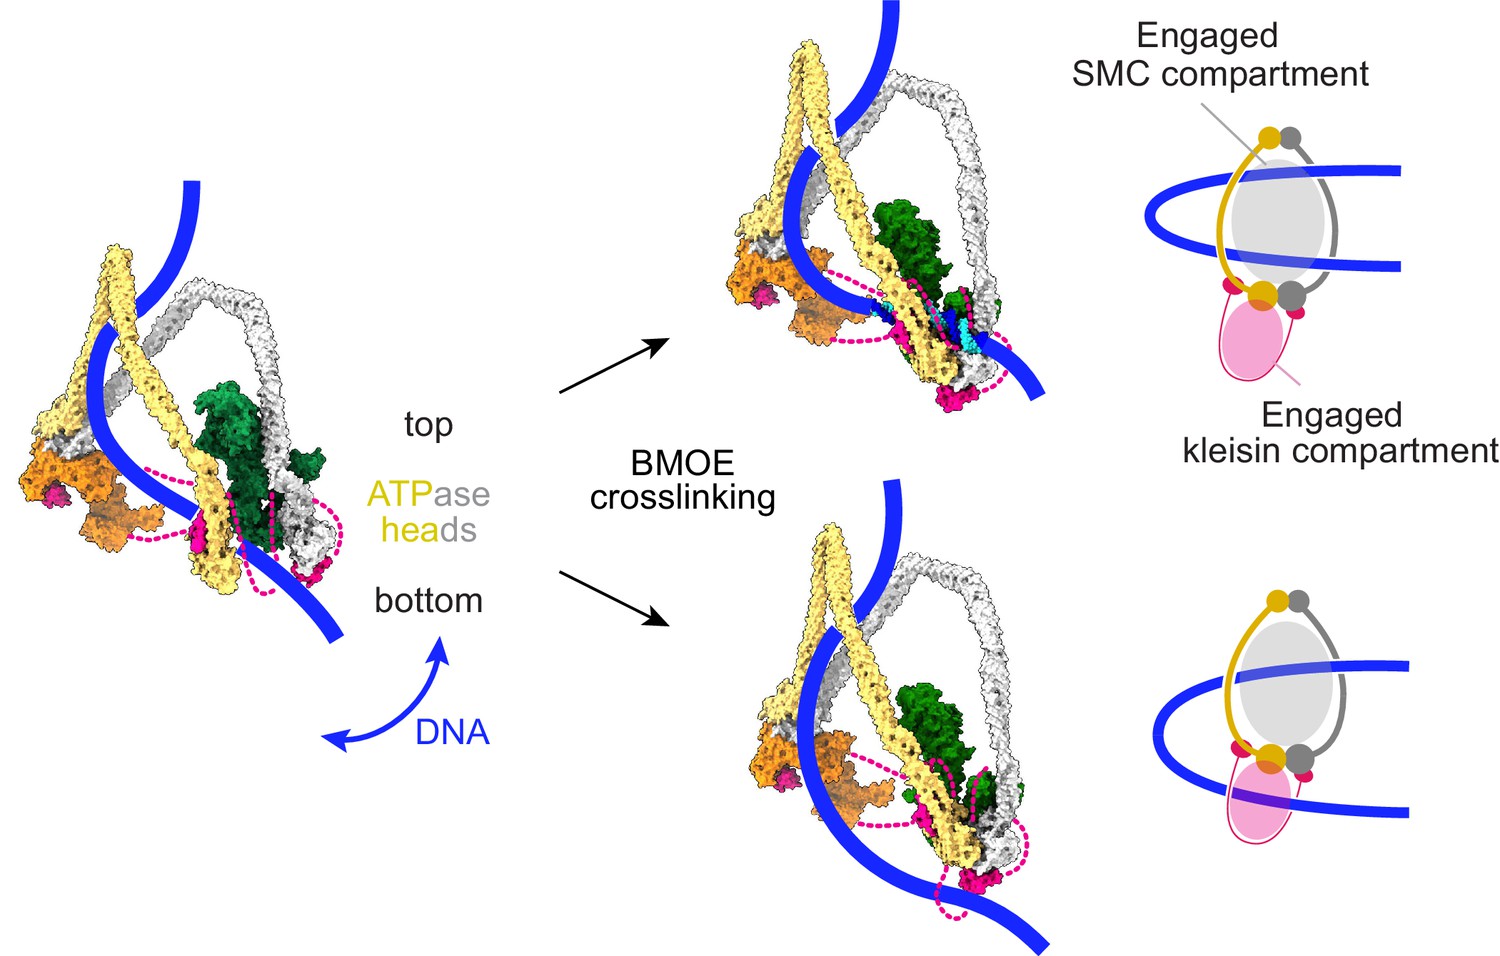
Schematic that reconciles our molecular model of cohesin function with an alternative model for DNA entry into the cohesin ring, based on chemical crosslinking (Collier et al., 2020).
Our DNA-protein crosslink mass spectrometry data suggest that DNA initially explores the space between the SMC coiled coils. Before ATP-dependent head engagement, this might include passage between the heads. BMOE-induced crosslinking results in two possible outcomes. DNA is either not trapped by cohesin (top), or DNA is trapped in both the engaged SMC compartment, as well as the engaged kleisin compartment (bottom). At a slower rate, DNA successfully passes the kleisin N-gate upon ATPase head engagement, leading to topological DNA entry into the SMC-kleisin ring.
Videos
Video 1
Movie showing formation and extension of a loop on doubly tethered DNA in the presence of cohesin, the cohesin loader and ATP.
Scale bar 1 μm. A DNA molecule (48.5 kbp) is stained with Sytox Orange and stretched at 15 μL/min buffer flow.
Video 2
Progression of the Metropolis Monte-Carlo simulation as cohesin is switched between the parameters describing its gripping and slipping states (Supplementary file 1).
Before the start of the video, the system was equilibrated for ~ 107 iterations. Frames were captured every 2⋅105 iterations and the video spans ~ 5⋅107 iterations. Pauses were introduced to highlight imposed state transitions and DNA binding and unbinding events. Axis scale, nm.
Tables
Key resources table
| Reagent type (species) or resource | Designation | Source or reference | Identifiers | Additional information |
|---|---|---|---|---|
| Strain, strain background (S. cerevisiae) | MATa URA3::pGAL1-psm3-3Pk-7his/pGAL10-psm1, LEU2::pGAL1-rad21-HA-pps-protein A/pGAL10-7his-psc3, pep4Δ::HIS3 | Murayama and Uhlmann, 2014 | Y4443 | Wild type cohesin purification |
| Strain, strain background (S. pombe) | pMis4-pps-protein A (LEU2), pSsl3(ura4+), h-, lue1-32, ura4-D18 | Murayama and Uhlmann, 2014 | Y4483 | Mis4-Ssl3 purification |
| Strain, strain background (S. cerevisiae) | MATa URA3::pGAL1-psm3-3Pk-7his/pGAL10-psm1(R593-SNAP-P594), LEU2::pGAL1-rad21-HA-pps-protein A/pGAL10-7his-psc3-CLIP, pep4Δ::HIS3 | This study | Smc1Psm1hinge/Scc3Psc3-C FRET construct purification | |
| Strain, strain background (S. cerevisiae) | MATa URA3::pGAL1-psm3-3Pk-7his/pGAL10-psm1,LEU2::pGAL1-rad21-HA-pps-protein A/pGAL10-7his-psc3-CLIP, pep4Δ::HIS3 | This study | Scc3Psc3-C(CLIP) FRET construct purification | |
| Strain, strain background (S. cerevisiae) | MATa URA3::pGAL1-psm3-3Pk-7his/pGAL10-psm1,LEU2::pGAL1-rad21-HA-pps-protein A/pGAL10-7his-psc3-SNAP, pep4Δ::HIS3 | This study | Scc3Psc3-C(SNAP) FRET construct purification | |
| Strain, strain background (S. pombe) | pCLIP-Mis4 N191-pps-protein A (LEU2), h-, lue1-32, ura4-D18 | This study | Scc2Mis4(N191)-N FRET construct purification | |
| Antibody | anti-V5(Pk) (Mouse monoclonal) | Bio-Rad | Cat# MCA1360 | (1:20,000) |
| Antibody | anti-HA (Mouse monoclonal) | Sigma-Aldrich | Cat# 11583816001 | (1:20,000) |
| Antibody | Anti-mouse IgG-HRP (Sheep polyclonal) | GE Healthcare | Cat# NXA931 | (1:20,000) |
| Antibody | Anti-Digoxigenin-AP, Fab fragments (Sheep polyclonal) | Roche | Cat# 11093274910 | (1:30) |
| Recombinant DNA reagent | Lambda DNA | New England BioLabs | Cat# N3013L | |
| Chemical compound, drug | SNAP-Surface Alexa Fluor 647 | New England BioLabs | Cat# S9136S | |
| Chemical compound, drug | CLIP-Surface 547 | New England BioLabs | Cat# S9233S | |
| Chemical compound, drug | SYBR Gold Nucleic Acid Gel Stain | ThermoFisher | Cat# S11494 | |
| Chemical compound, drug | ATP | Sigma-Aldrich | Cat# A2383 | |
| Chemical compound, drug | ADP | Sigma-Aldrich | Cat# A2754 | |
| Chemical compound, drug | Beryllium sulfate tetrahydrate | VWR international LTD | Cat# 16104.14 | |
| Chemical compound, drug | Sodium fluoride 0.5 M Solution | Sigma-Aldrich | Cat# 67414–1 ML-F | |
| Chemical compound, drug | Dynabeads Protein A | ThermoFisher | Cat#10002D | |
| Chemical compound, drug | Protease K | TaKaRa | Cat# 9034 | |
| Chemical compound, drug | Pluronic F127 | Sigma-Aldrich | Cat# P2443 | |
| Chemical compound, drug | β-Casein from bovine milk | Sigma-Aldrich | Cat# C6905 | |
| Chemical compound, drug | DIG-11-dUTP | Jena Bioscience | NU-803-DIGXS | |
| Chemical compound, drug | SYTOX Orange Nucleic Acid Stain | Invitrogen | Cat# S11368 | |
| Software, algorithm | UCSF ChimeraX | https://www.cgl.ucsf.edu/chimerax/ | ||
| Software, algorithm | PyMOL | https://pymol.org/2/ | ||
| Software, algorithm | SWISS-MODEL | https://swissmodel.expasy.org | ||
| Software, algorithm | CCBuilder 2.0 | http://coiledcoils.chm.bris.ac.uk/ccbuilder2/builder | ||
| Software, algorithm | Fiji Image J | https://imagej.net/Fiji |
Additional files
-
Supplementary file 1
Cohesin-DNA interaction parameters in gripping and slipping states.
The values and units of the parameters are indicated, together with an indication of changes between the simulated gripping and slipping states.
- https://cdn.elifesciences.org/articles/67530/elife-67530-supp1-v1.docx
-
Transparent reporting form
- https://cdn.elifesciences.org/articles/67530/elife-67530-transrepform-v1.docx
Download links
A two-part list of links to download the article, or parts of the article, in various formats.
Downloads (link to download the article as PDF)
Open citations (links to open the citations from this article in various online reference manager services)
Cite this article (links to download the citations from this article in formats compatible with various reference manager tools)
A Brownian ratchet model for DNA loop extrusion by the cohesin complex
eLife 10:e67530.
https://doi.org/10.7554/eLife.67530


