Thalamocortical axons control the cytoarchitecture of neocortical layers by area-specific supply of VGF
- Department of Brain Morphogenesis, Institute of Molecular Embryology and Genetics, Kumamoto University, Japan
- Laboratory of Mammalian Neural Circuits, National Institute of Genetics, Japan
- Division of Developmental Genetics, Institute of Resource Development and Analysis, Kumamoto University, Japan
- Laboratory of Cellular and Molecular Neurobiology, Graduate School of Frontier Biosciences, Osaka University, Japan
Figures
Figure 1 with 3 supplements
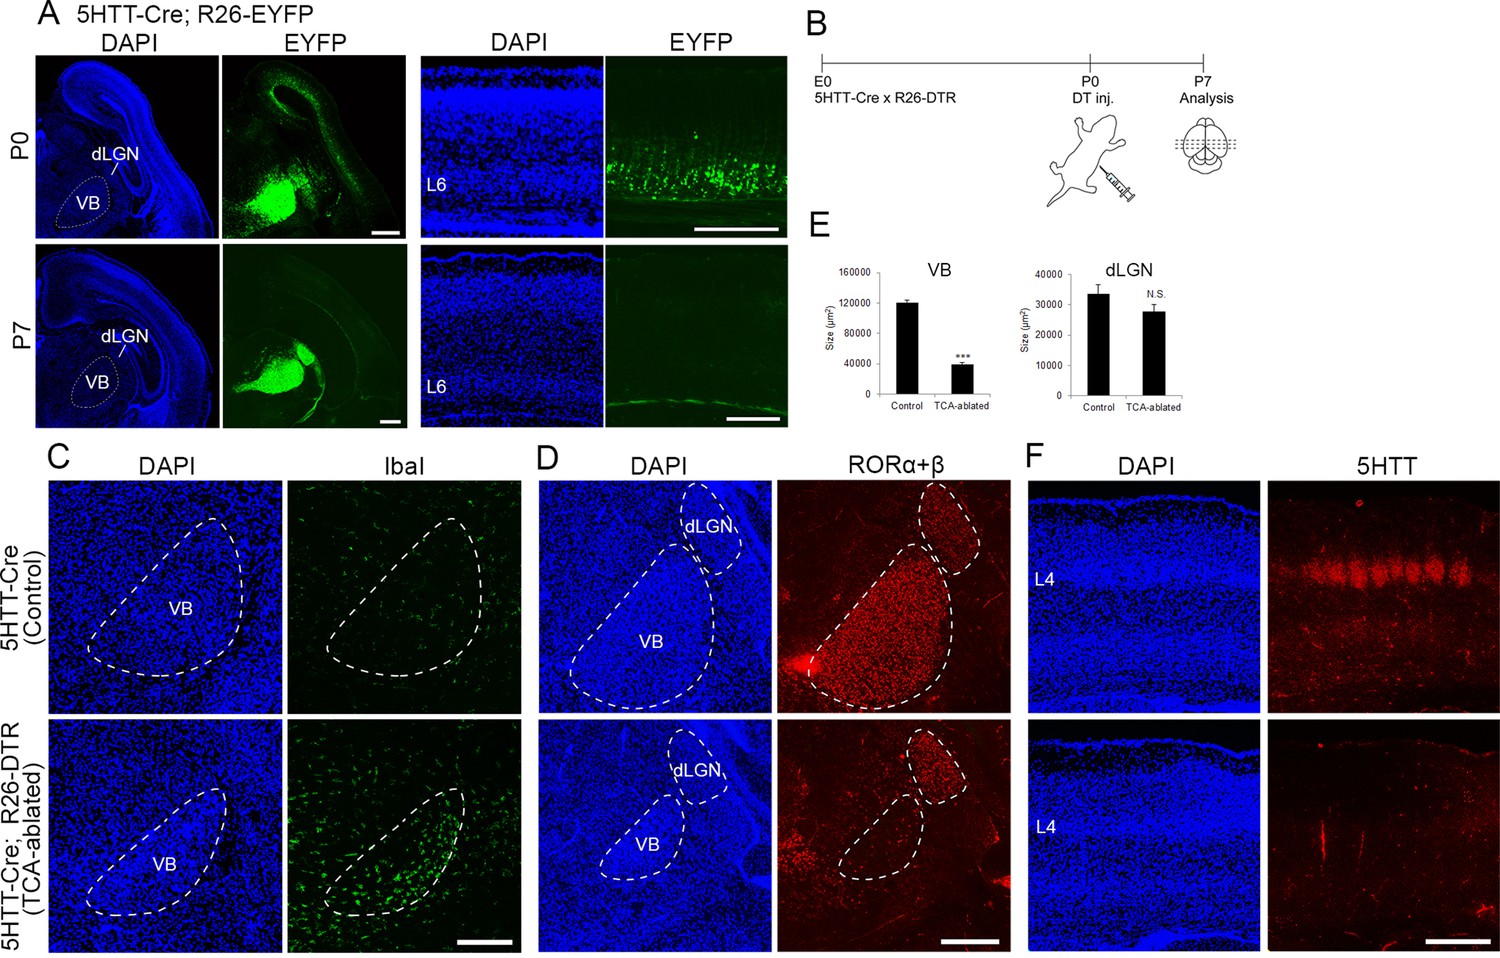
Elimination of thalamocortical axons (TCAs) by toxin-mediated thalamic cell ablation in vivo.
(A) Cre recombinase activities in cross-sections of forebrains of P0 (upper panels) and P7 (lower panels) 5HTT-Cre mice. The 5HTT-Cre line was crossed with the R26-EYFP reporter line to allow detection of Cre activity by EYFP fluorescence. EYFP was the most strongly expressed in the VB nucleus and to a lesser extent in the dLGN in the thalamus at P0 (upper left panels), and also weakly in layer 6 (L6) in the cortex (upper right panels), which was lost by P7 (lower right panels). (B) Experimental scheme for TCA ablation. Neonatal pups from a cross of a 5HTT-Cre mouse with a R26-Diphtheria toxin receptor (DTR) mouse were administrated DT intraperitoneally. Cross-sections of P5 (C) and P6 (D) thalamus stained for Iba1 (C) and RORα+β (D) reveal microglial cells and thalamic nuclei, respectively. Ablation of thalamic neurons was confirmed by loss of RORα+β expression, especially in the VB. DAPI (4',6-diamidino-2-phenylindole)-stained cell nuclei are packed more densely in the smaller VB than in the control. (E) Quantification of the size of VB and dLGN. The area of these nuclei revealed by RORC staining on seven sections from seven mice was measured. The size of VB, but not dLGN was significantly reduced in TCA-ablated mice compared with control mice. Data are presented as µm2 (mean ± standard error of the mean [SEM]): VB, 120,882.2 ± 5582.1 (control), 39,658.6 ± 5672.2 (TCA-ablated), p = 0.0006; dLGN, 33,514.1 ± 3081.1 (control), 27,699.9 ± 2308.1 (TCA-ablated), p = 0.128; Mann–Whitney U test, ***p < 0.001. Seven mice for both control and experiment were used. (F) 5HTT immunohistochemistry of P7 cortices. The amount of TCAs stained for 5HTT was greatly reduced in S1, the target of VB neurons, in the TCA-ablated cortex. Note that the 5HTT-positive barrel structure is completely absent in TCA-ablated mice. dLGN, dorsal lateral geniculate nucleus; L4, layer 4; L6, layer 6; VB, ventrobasal nucleus. Scale bars, 500 µm (A, F), 200 µm (C, D).
-
Figure 1—source data 1
Raw data of E.
- https://cdn.elifesciences.org/articles/67549/elife-67549-fig1-data1-v2.xlsx
Figure 1—figure supplement 1

Postnatal emergence of laminar configuration in the cortical area.
RORC immunohistochemistry of hemisagittal (A) and coronal (B) sections of E16, P0, and P7 cortices to reveal expression of the layer 4 marker RORβ. Sections are counterstained with DAPI. (C) Quantification of RORC-immunostaining signal along a tangential plane between dashed lines shown in (B). Signal intensity in rectangle domains of 78.1 μm height × 33.5 μm width was measured tangentially along RORβ-positive layer with regular interval of 25.6 μm as shown in left bottom panel in (B). The relative signal intensity is presented as a percentage of the maximum value in the same panel. Ctx, cortex; Hip, hippocampus; Str, striatum; a, anterior; d, dorsal; m, medial; S1, primary somatosensory area; PMBSF, posteromedial barrel subfield. Scale bar, 500 μm.
-
Figure 1—figure supplement 1—source data 1
Raw data of C.
- https://cdn.elifesciences.org/articles/67549/elife-67549-fig1-figsupp1-data1-v2.xlsx
Figure 1—figure supplement 2
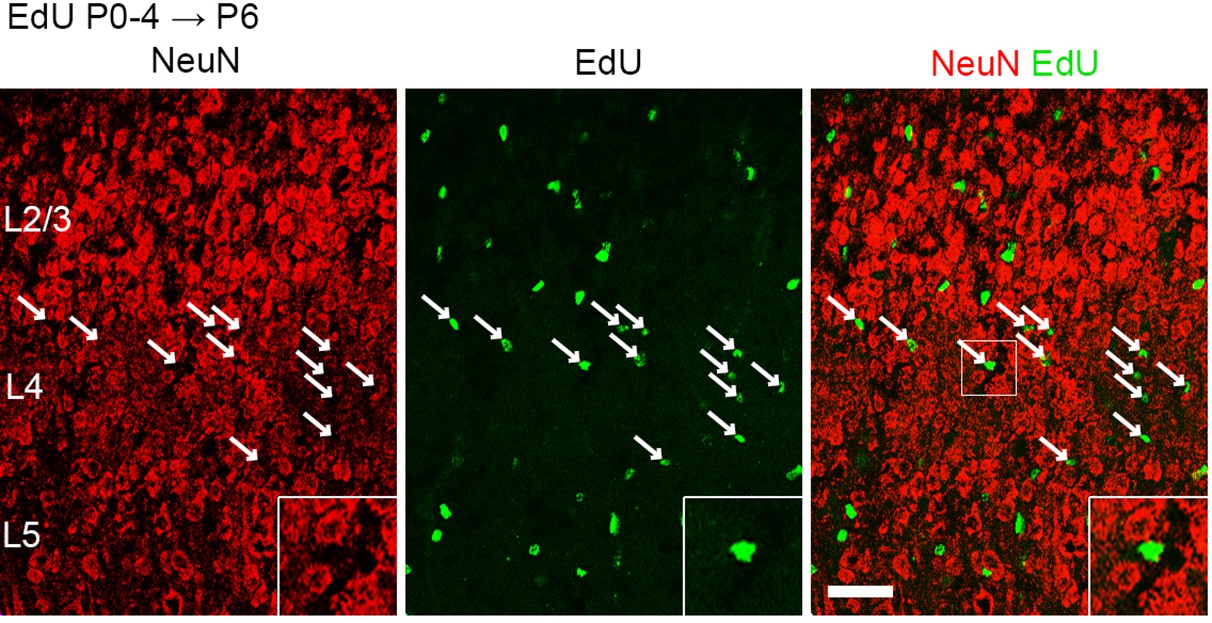
Layer 4 neurons are not additively generated postnatally.
Coronal sections of the S1 cortex of a P6 mouse administrated EdU every day from P0 to P4 to label newly generated postmitotic cells, double stained for NeuN and EdU. Note that all the EdU-labeled cells in layer 4 were not costained for NeuN (arrows), indicating that they are not neurons. Bottom-right insertions are magnified view of square region in the merged image. L2/3, layers 2 and 3; L4, layer 4; L5, layer 5. Scale bar, 50 μm.
Figure 1—figure supplement 3
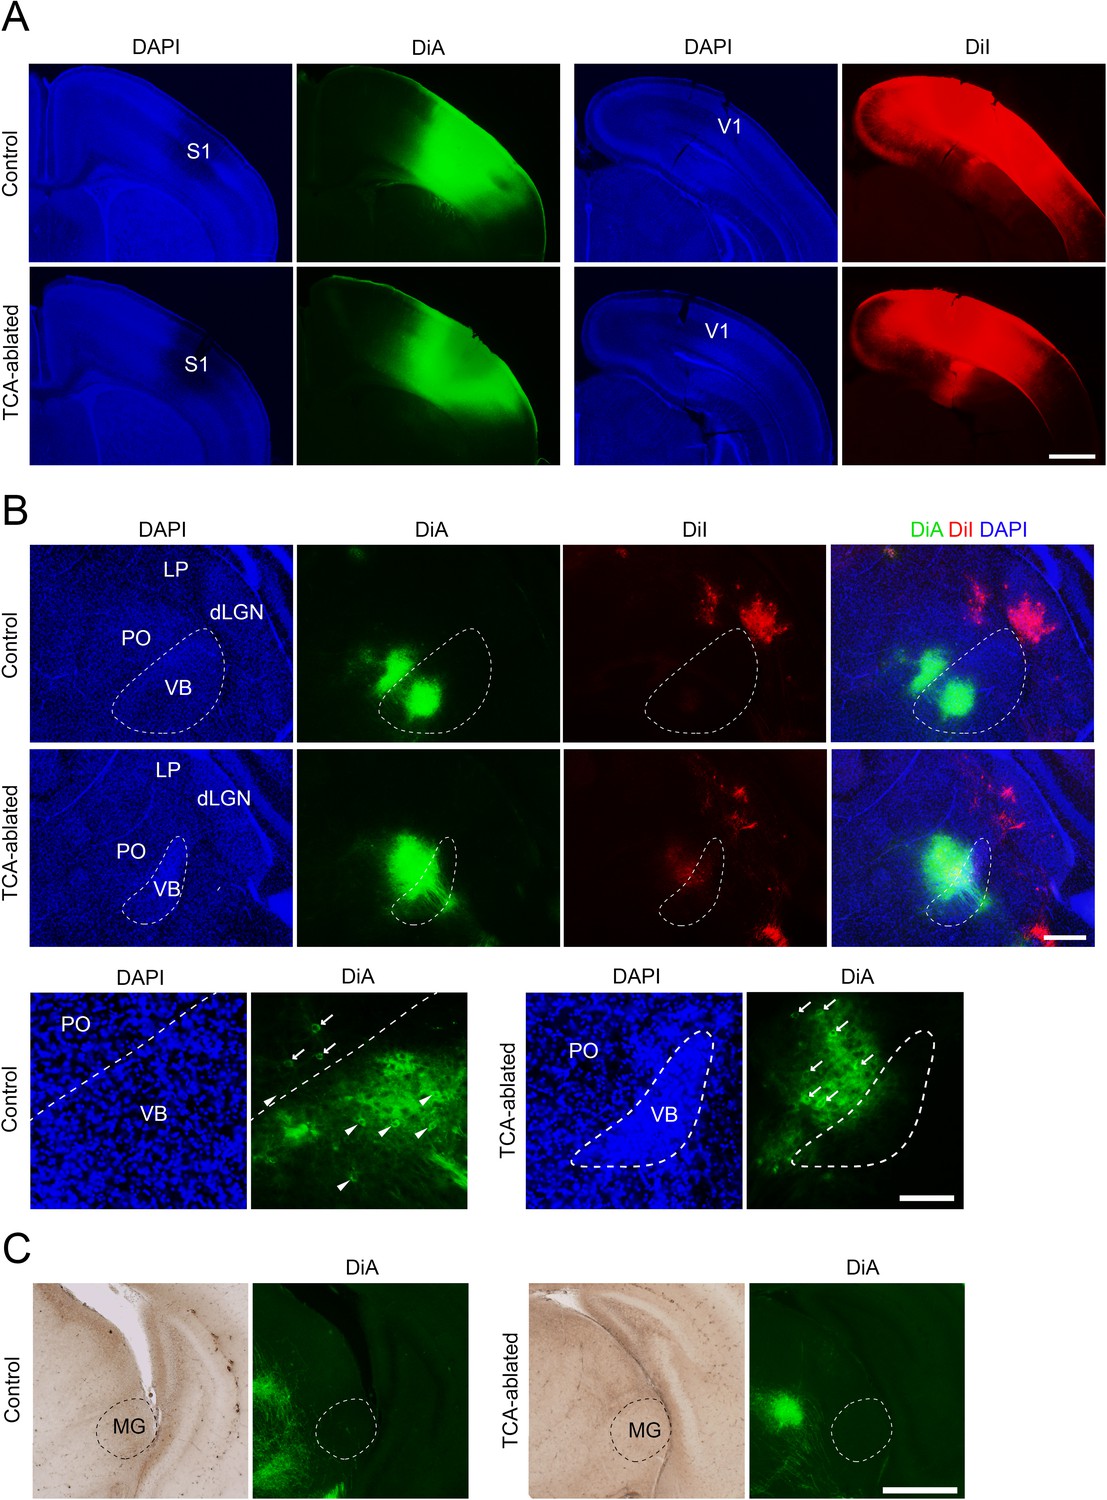
Thalamocortical axon (TCA) connections in S1 of TCA-ablated mouse.
(A) Coronal sections of control and TCA-ablated cortices showing DiA (green) and DiI (red) embedded in S1 and V1, respectively. (B, C) Coronal sections of thalami of control and TCA-ablated mice showing retrogradely labeled cell bodies and anterogradely labeled axons from the cortex in the thalamus. Note that DiA signal was not observed in dLGN nor MG in the TCA-ablated mouse. Lower panels in (B) represent cell bodies retrogradely labeled with DiA (arrows in PO and arrowheads in VB), indicating that those neurons project to S1. Note that neurons in both VB and PO are labeled in control mice, whereas only PO neurons are labeled in TCA-ablated mice. dLGN, dorsal lateral geniculate nucleus; LP, lateral posterior nucleus; MG, medial geniculate nucleus; PO, posterior nucleus; S1, primary somatosensory area; VB, ventrobasal nucleus; V1, primary visual area. Scale bars, 1 mm (A), 500 μm (B, upper panel and C), 200 μm (B, lower panel).
Figure 2 with 3 supplements
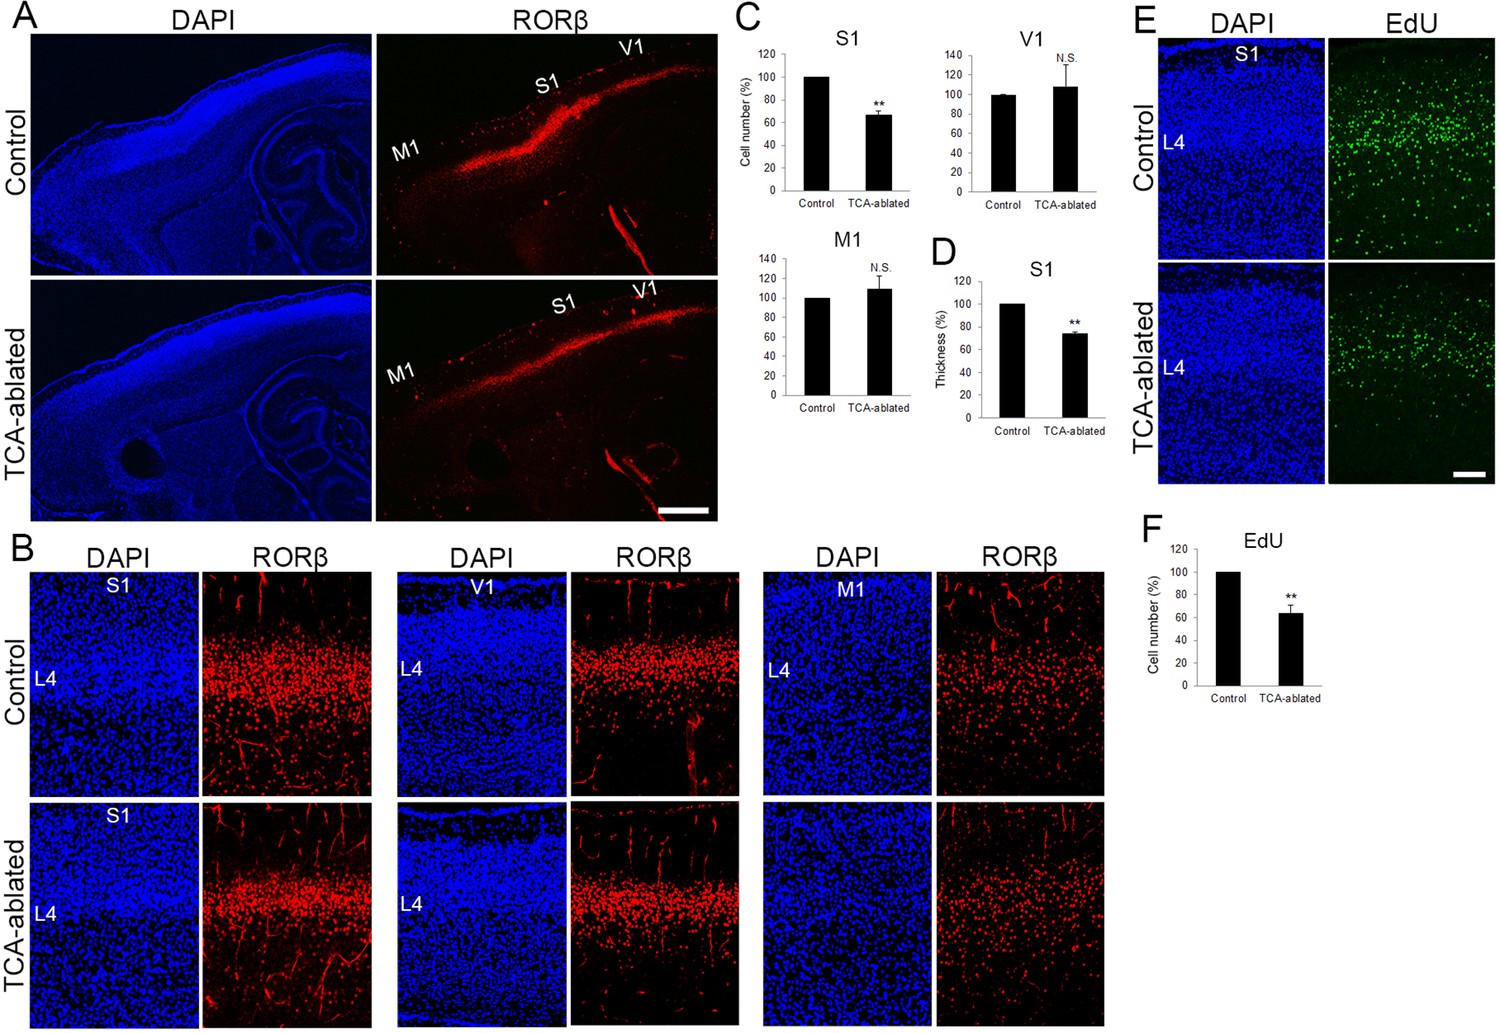
The number of layer 4 neurons is reduced in S1.
(A) Sagittal sections of P7 cortices derived from thalamocortical axon (TCA)-ablated mice stained with RORC antibody. Expression of the layer 4 marker RORβ was declined, specifically in S1, resulting in poorly demarcated borders between adjacent areas. (B) Coronal section of the cortex of a TCA-ablated mouse at P7, showing RORβ-expressing layer 4 (L4) neurons in S1. (C) Quantification of RORβ expression. RORβ-expressing cells within an 850-μm-wide strip of the cortical wall were counted. Note that the number of RORβ-positive cells was less in S1, but was not changed in V1 and M1, in TCA-ablated mice. Data are presented as a percentage of control mice (mean ± standard error of the mean [SEM]): S1, 66.75 ± 3.30%, N = 7 mice, p = 0.0011; V1, 108.28 ± 22.00%, N = 5 mice, p = 0.656; M1, 109.47 ± 12.97%, N = 4 mice, p = 0.878; Mann–Whitney U test, **p < 0.01. The same numbers of control and experimental animals were used. (D) Thickness of RORβ-expressing layer was also reduced in TCA-ablated mice. Data are presented as a percentage of control mice (mean ± SEM): 73.69 ± 1.83%, N = 7 mice, p = 0.0011; Mann–Whitney U test, **p < 0.01. (E) Cross-sections of S1 cortices of control and TCA-ablated mice at P7, showing distribution of EdU-positive cells. EdU was injected at E14.7. (F) Quantification of the results. The number of EdU-positive cells within an 850-μm-wide strip of the cortical wall relative to control is shown as the mean ± SEM: 64.37 ± 6.77%, p = 0.0075; Mann–Whitney U test, **p < 0.01, N = 5 animals for both control and TCA-ablated mice. L4, layer 4; M1, motor area; S1, primary somatosensory area; V1, primary visual area. Scale bars, 500 μm (A), 100 μm (B, E).
-
Figure 2—source data 1
Raw data of C, D, F.
- https://cdn.elifesciences.org/articles/67549/elife-67549-fig2-data1-v2.xlsx
Figure 2—figure supplement 1
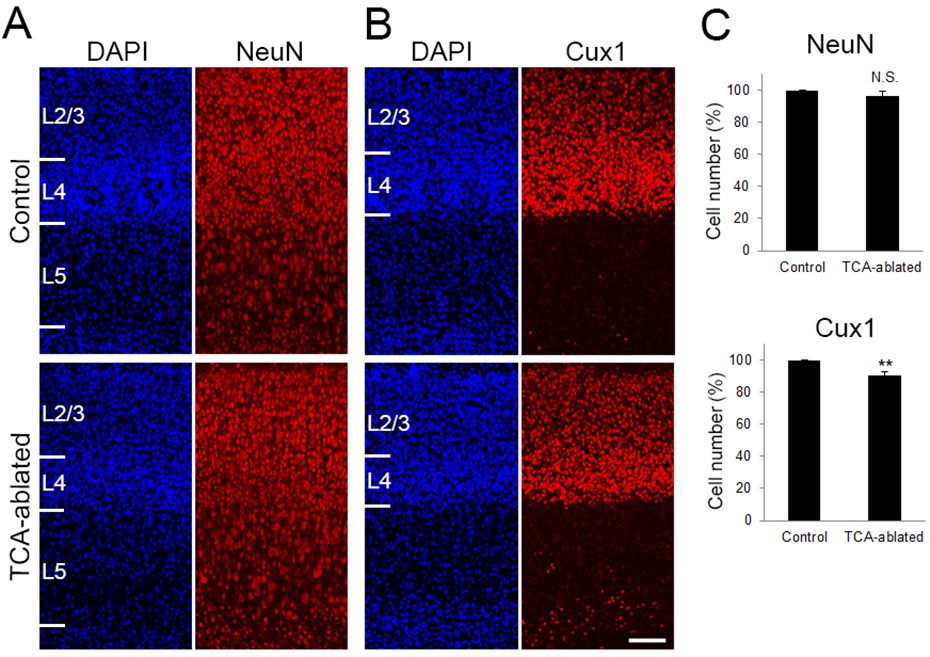
Effects of thalamocortical axon (TCA) ablation on the number of neurons in L2–5 and Cux1-positive upper layer neurons.
(A, B) Cross-sections of S1 area of P7 control and TCA-ablated mice, stained for DAPI, NeuN (A), and Cux1 (B). (C) Quantification of the results. Ratio of the number of cells in TCA-ablated mice to control mice is presented as mean ± standard error of the mean (SEM): NeuN-positive cell, 96.40 ± 2.95%, N = 14 sections from 4 mice for each, p = 0.282; Cux1-positive cell, 90.50 ± 2.12%, N = 26 sections from 7 mice for each, p = 0.0011; Mann–Whitney U test, **p < 0.01. Neurons in layer 6 were not counted as they express Cre in 5HTT-Cre mice. L2/3, layers 2 and 3; L4, layer 4; L5, layer 5. Scale bar, 100 μm.
-
Figure 2—figure supplement 1—source data 1
Raw data of C.
- https://cdn.elifesciences.org/articles/67549/elife-67549-fig2-figsupp1-data1-v2.xlsx
Figure 2—figure supplement 2
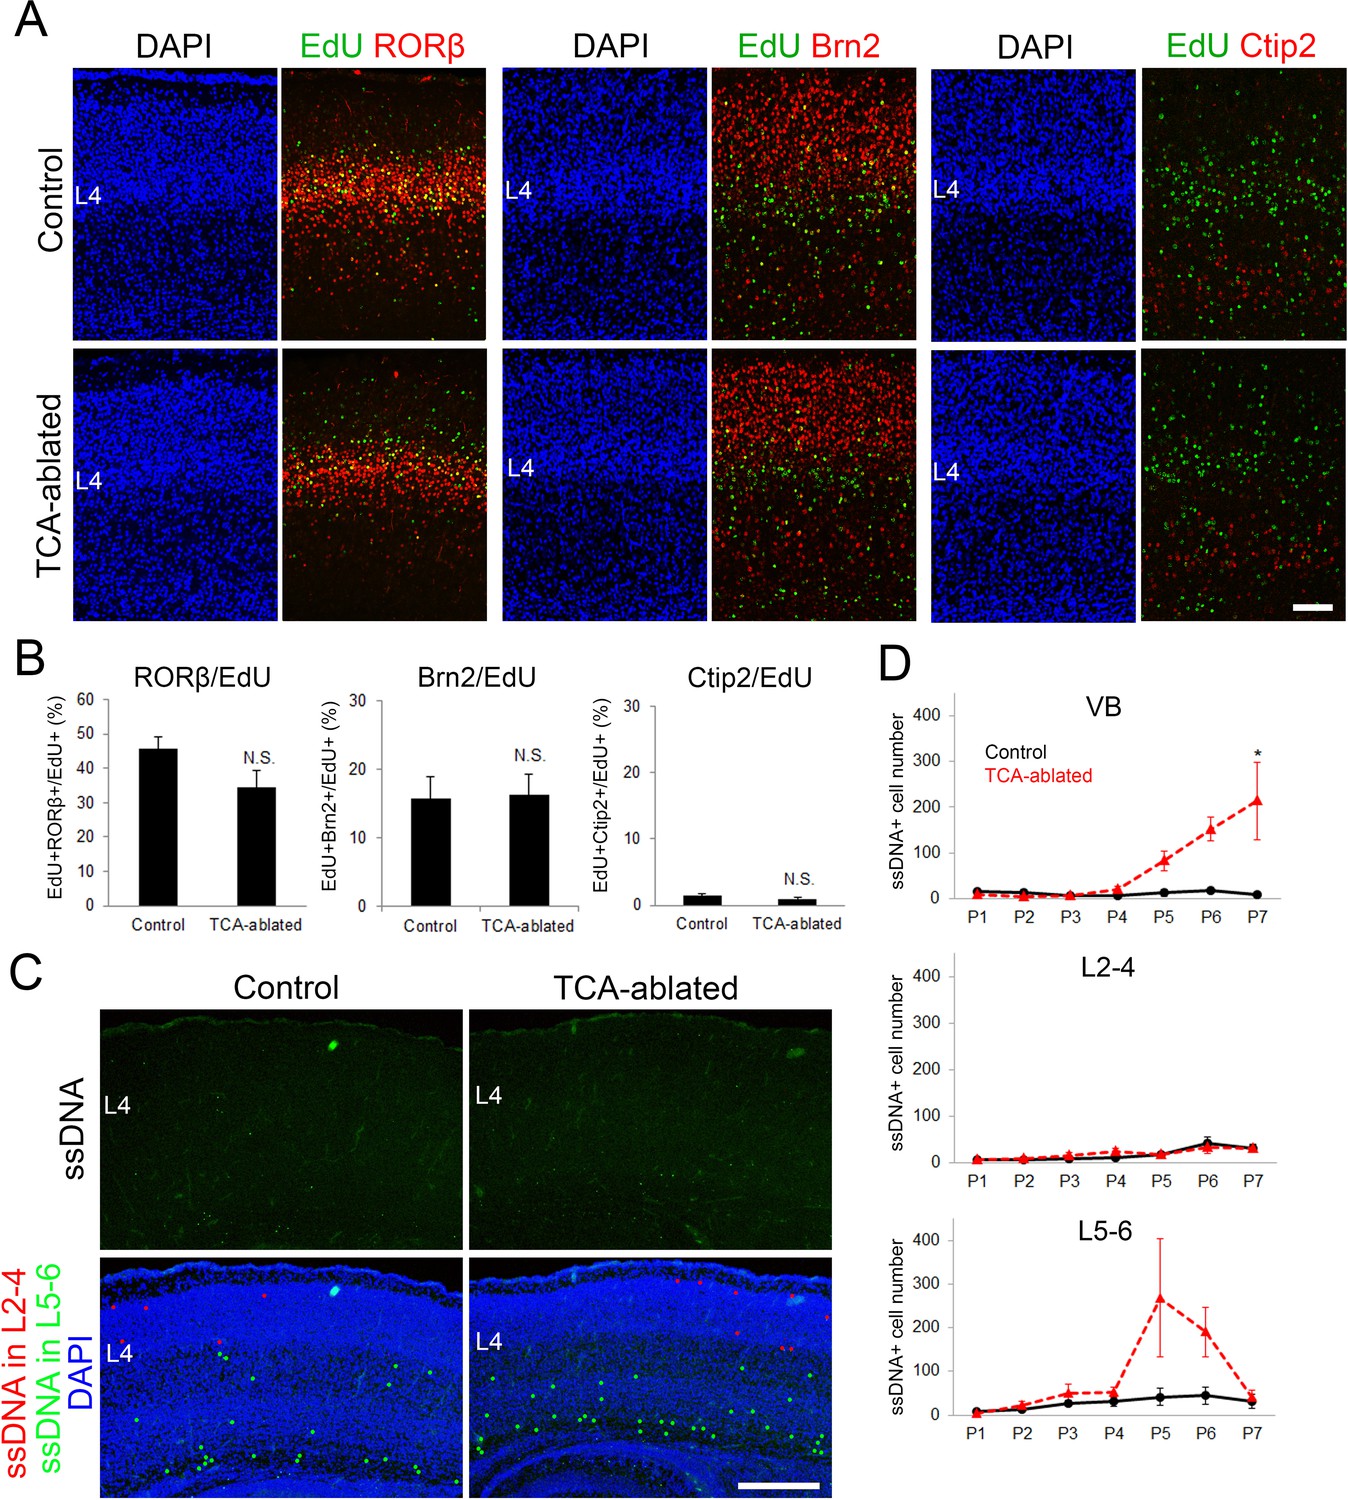
Effects of thalamocortical axon (TCA) ablation on cell fate and cell death of layer 4 neurons in S1.
(A) Cross-sections of S1 cortex of control and TCA-ablated mice to which EdU had been administrated at E14.7, stained for EdU and layer markers, RORβ, Brn2, and Ctip2. (B) Quantification of the results. Percentage of EdU-labeled cells with a given layer marker is presented as the mean ± standard error of the mean (SEM): RORβ/EdU, 45.87 ± 3.15% (control), 34.56 ± 4.88% (TCA-ablated), N = 26 sections from 7 mice for each, p = 0.128; Brn2/EdU, 15.82 ± 3.04% (control), 16.28 ± 2.99% (TCA-ablated), N = 16 sections from 5 mice for each, p = 1.00; Ctip2/EdU, 1.42 ± 0.36% (control), 0.990 ± 0.19% (TCA-ablated), N = 16 sections from 4 mice for each, p = 0.686; Mann–Whitney U test. (C) Coronal sections of S1 cortex of control and TCA-ablated mice at P4, stained for ssDNA. Stained cells in layers 2–4 and 5–6 are represented as red and green dots, respectively, in the DAPI-stained image. (D) Quantification of the results. The number of ssDNA-positive cells in VB, layers 2–4, and layers 5–6 through P1–7 is presented as mean ± SEM: VB, P1, 15.0 ± 4.36 (control, N = 6 sections from 3 mice), 10.0 ± 2.00 (TCA-ablated, N = 4 sections from 2 mice); P2, 14.3 ± 6.17 (control), 4.67 ± 1.45 (TCA-ablated), N = 6 sections from 3 mice for each; P3, 5.67 ± 1.86 (control), 6.33 ± 3.18 (TCA-ablated), N = 5 sections from 3 mice for each; P4, 7.33 ± 2.91 (control), 20.67 ± 5.81 (TCA-ablated), N = 5 sections from 3 mice for each; P5, 12.67 ± 7.86 (control), 82.67 ± 21.46 (TCA-ablated), N = 4 sections from 3 mice for each; P6, 17.0 ± 5.51 (control), 152.3 ± 24.9 (TCA-ablated), N = 6 sections from 3 mice for each; P7, 9.75 ± 2.17 (control), 213.8 ± 85.0 (TCA-ablated), N = 8 sections from 4 mice for each, p = 0.0286; layers 2–4, P1, 7.33 ± 0.67 (control, N = 12 sections from 3 mice), 6.00 ± 1.00 (TCA-ablated, N = 8 sections from 2 mice); P2, 5.33 ± 2.40 (control), 9.00 ± 2.00 (TCA-ablated), N = 12 sections from 3 mice for each; P3, 7.67 ± 0.33 (control), 16.0 ± 6.93 (TCA-ablated), N = 11 sections from 3 mice for each; P4, 11.0 ± 3.21 (control), 23.7 ± 6.06 (TCA-ablated), N = 9 sections from 3 mice for each; P5, 16.4 ± 2.70 (control), 16.4 ± 4.64 (TCA-ablated), N = 8 sections from 3 mice for each; P6, 41.0 ± 13.4 (control), 33.0 ± 12.3 (TCA-ablated), N = 13 section from 4 mice for each, p = 0.686; P7, 31.25 ± 7.69 (control), 31.25 ± 6.29 (TCA-ablated), N = 16 sections from 4 mice for each, p = 0.8846; layers 5–6, P1, 7.33 ± 0.88 (control, N = 12 sections from 3 mice), 3.50 ± 1.50 (TCA-ablated, N = 8 sections from 2 mice); P2, 12.3 ± 2.96 (control), 22.7 ± 8.11 (TCA-ablated), N = 12 sections from 3 mice for each; P3, 26.6 ± 6.95 (control), 49.6 ± 20.2 (TCA-ablated), N = 11 sections from 3 mice for each; P4, 30.3 ± 9.84 (control), 52.3 ± 11.3 (TCA-ablated), N = 9 sections from 3 mice for each; P5, 41.3 ± 19.8 (control), 268.0 ± 135.7 (TCA-ablated), N = 9 sections from 3 mice for each; P6, 44.3 ± 20.3 (control), 190.3 ± 56.8 (TCA-ablated), N = 13 sections from 4 mice for each, p = 0.0571; P7, 31.5 ± 15.6 (control), 40.5 ± 16.0 (TCA-ablated), N = 16 sections from 4 mice for each, p = 0.343; Mann–Whitney U test, *p < 0.05. The number of ssDNA-positive cells in VB and layers 5–6 was increased in TCA-ablated mice consistent with Cre expression in these regions, whereas that in layers 2–4 was not throughout the period. L2–4, layers 2–4; L4, layer 4; L5–6, layers 5–6; VB, ventrobasal nucleus. Scale bars, 100 µm (A), 500 µm (C).
-
Figure 2—figure supplement 2—source data 1
Raw data of B, D.
- https://cdn.elifesciences.org/articles/67549/elife-67549-fig2-figsupp2-data1-v2.xlsx
Figure 2—figure supplement 3
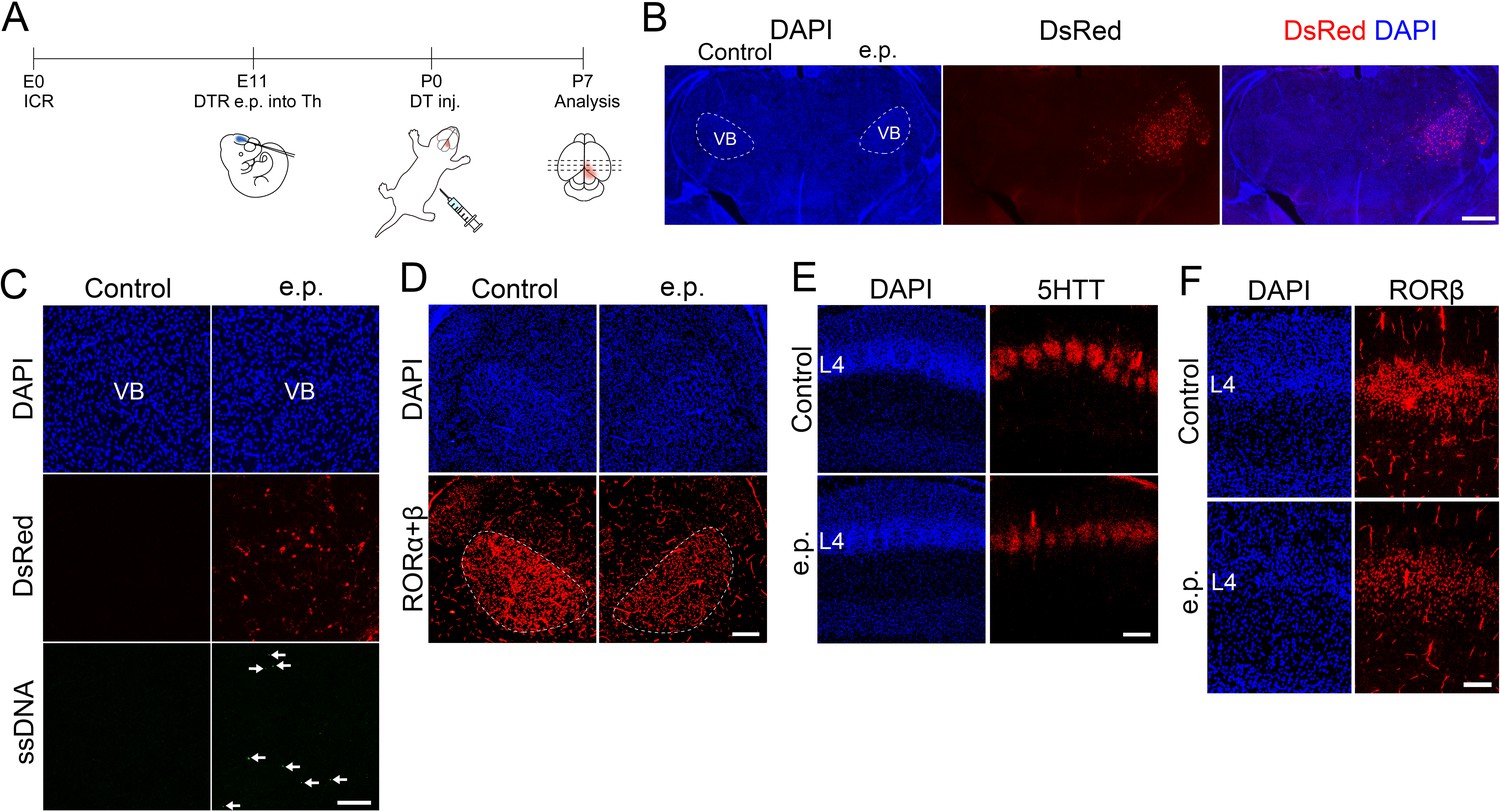
Electroporation-based thalamocortical axon (TCA) ablation causes reduction in the number of layer 4 neurons.
(A) Schematic representation of the experimental procedure used for electroporation-mediated thalamic ablation. DTR-encoding plasmid together with DsRed plasmid was electroporated into the thalamus of E11.5 ICR mice. DT was administrated at P0 and brains were collected at P7. Coronal sections of thalamus specimens of electroporated mice at P7 (B, D) and P2 (C). VB neurons were preferentially electroporated, as shown by DsRed fluorescence on the electroporated (e.p.) side of the thalamus at P7 (B). Upon administration of DT at P0, a number of ssDNA-positive dying cells (arrows in C) were detected on the e.p. side, where residual DsRed-expressing cells are visible at P2. RORC-immunostaining revealed a reduction in RORα+β-expressing neuron in the VB on the e.p. side at P7 (D). Coronal sections of S1 cortex of a DTR-electroporated specimen to which DT was administrated at P0, stained for 5HTT (E) and RORβ (F). 5HTT immunoreactivity (E), and the cell density of RORβ-expressing cells (F) were decreased in layer 4 on the e.p. side. L4, layer 4; VB, ventrobasal nucleus. Scale bars, 500 µm (B), 200 µm (C–E), 100 µm (F).
Figure 3
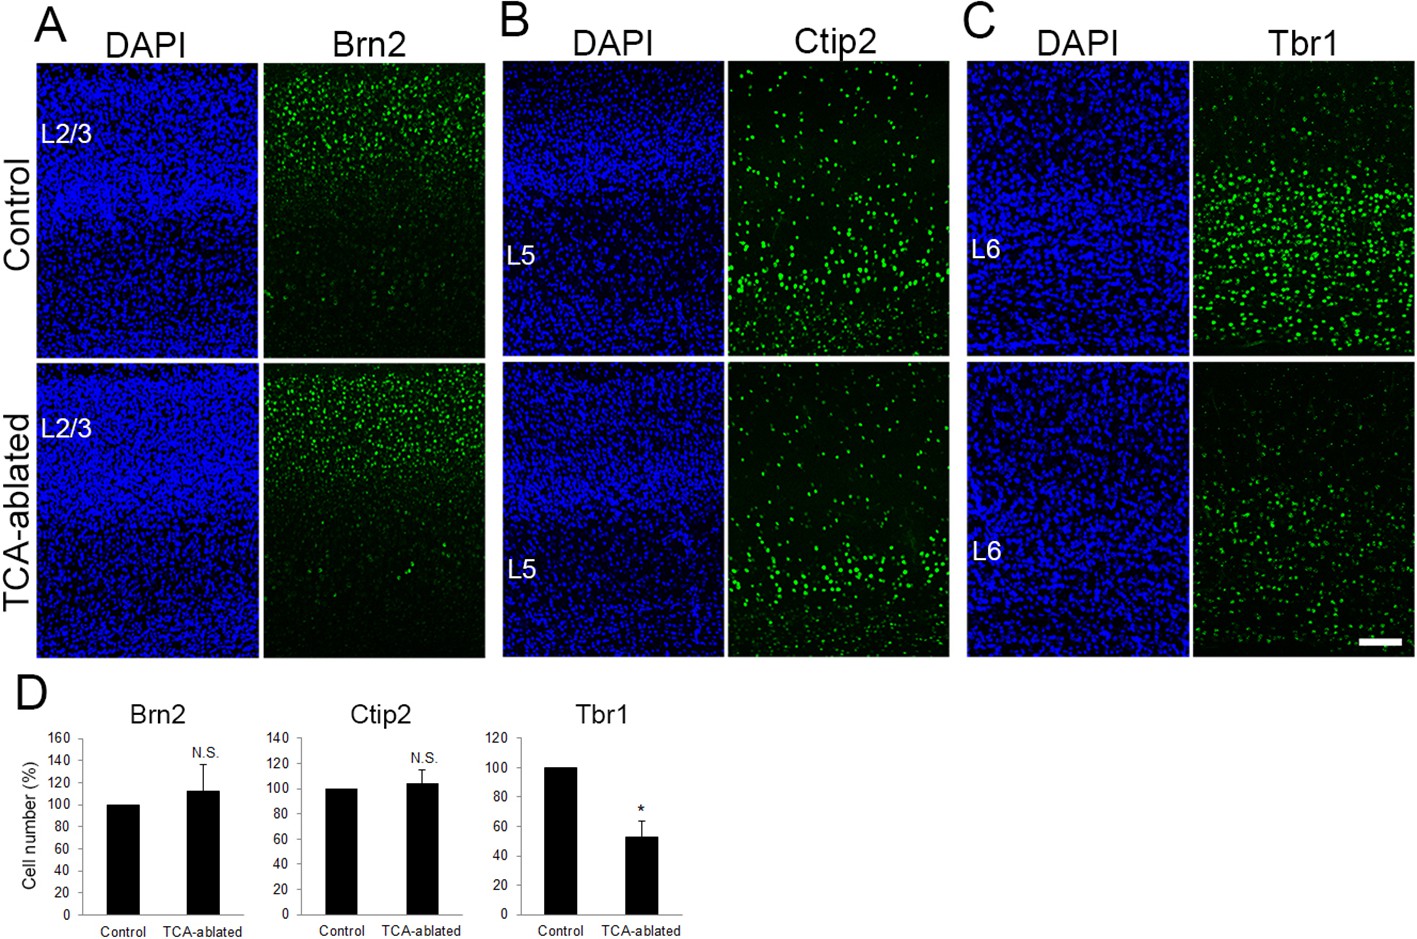
Layers 2/3 and 5 appear intact upon thalamocortical axon (TCA) elimination.
Cross-sections of S1 cortices of TCA-ablated mice at P7 stained for Brn2 (layer 2/3) (A), Ctip2 (layer 5) (B), and Tbr1 (layer 6) (C). Expression of Brn2 and Ctip2 were not markedly changed, whereas Tbr1-positive cells were decreased in TCA-ablated mice. (D) Quantitative analyses of the number of cells of TCA-ablated S1 relative to the control. Cells positive for each marker within an 850-μm-wide strip of the cortical wall were counted. Data are presented as a percentage of control (mean ± standard error of the mean [SEM]): Brn2, 112.70 ± 23.79%, N = 6 animals, p = 0.347; Ctip2, 104.09 ± 11.23%, N = 4 animals, p = 0.878; Tbr1, 52.97 ± 10.47%, N = 4 animals, p = 0.0211; Mann–Whitney U test, *p < 0.05. The same numbers of control and experimental animals were used. L2/3, layers 2 and 3; L5, layer 5; L6, layer 6. Scale bar, 100 μm.
-
Figure 3—source data 1
Raw data of D.
- https://cdn.elifesciences.org/articles/67549/elife-67549-fig3-data1-v2.xlsx
Figure 4
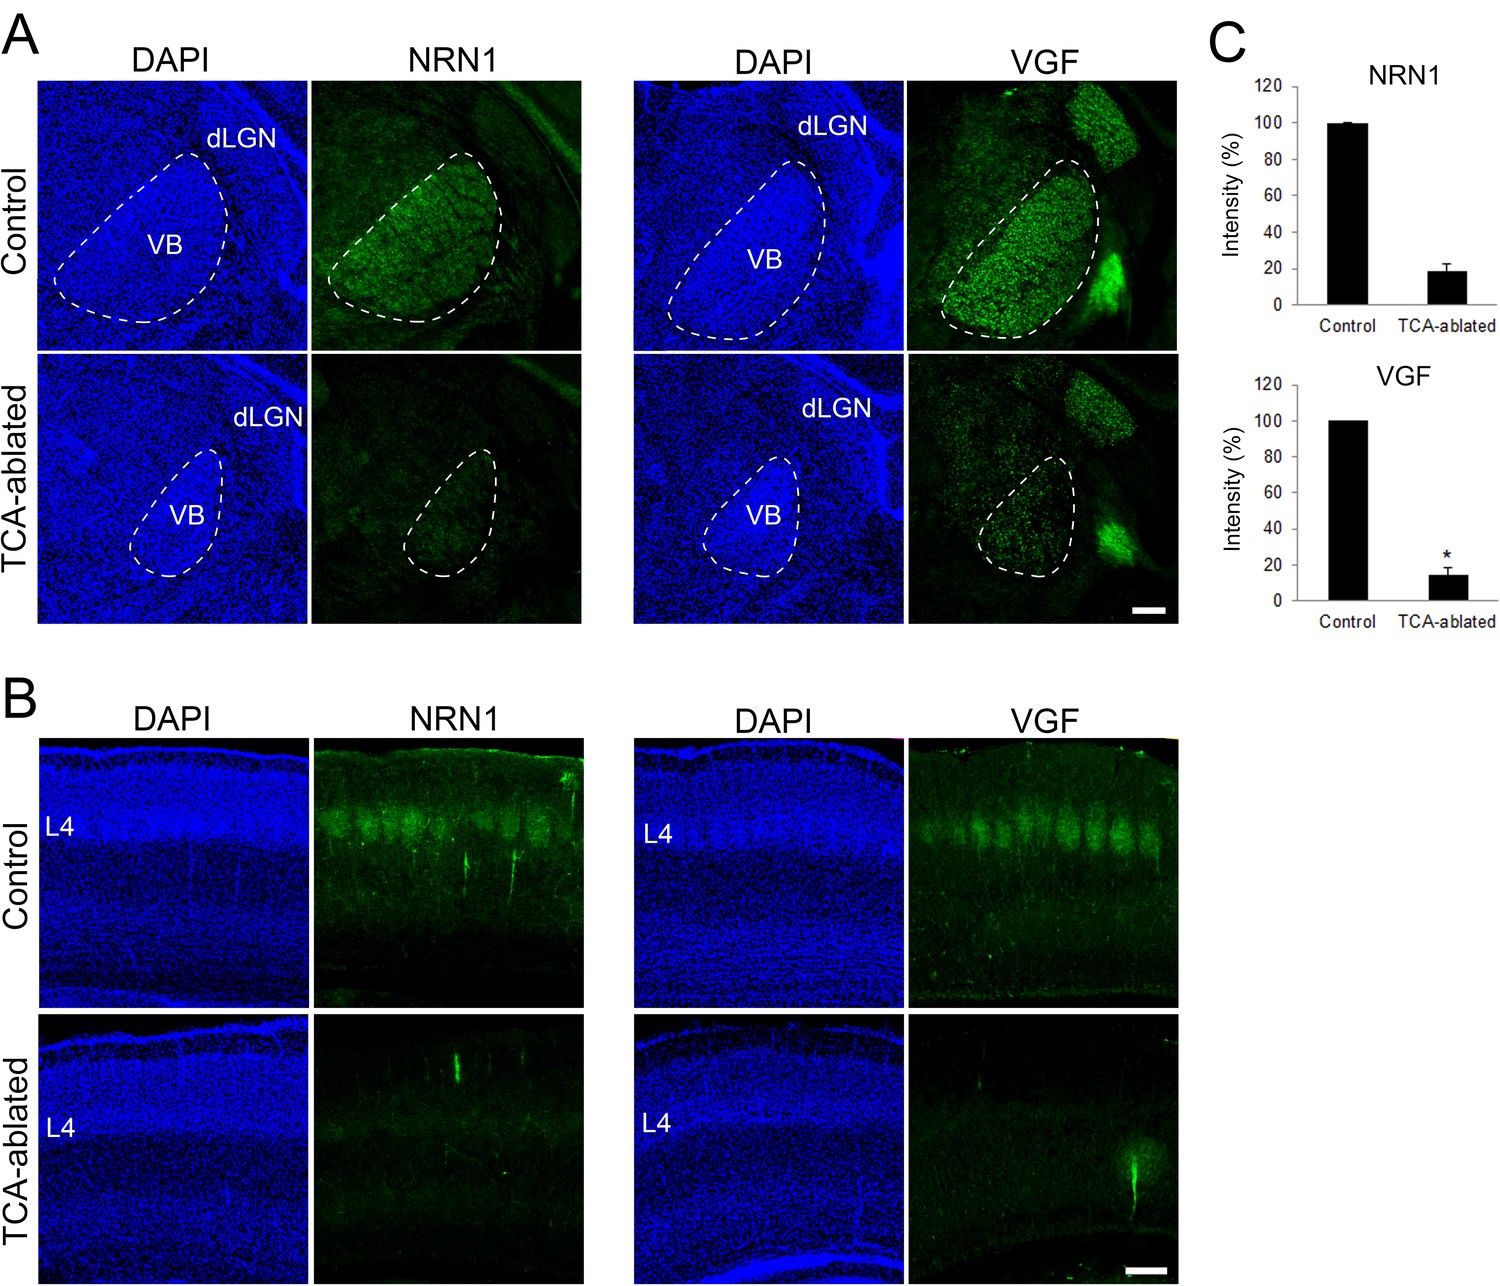
Expression of NRN1 and VGF are lost in the cortex of thalamocortical axon (TCA)-ablated mice.
Coronal sections of thalamus (A) and S1 cortex (B) of control and TCA-ablated mice at P7 immunostained for NRN1 and VGF. Note that NRN1 and VGF are expressed in the VB of control, but not TCA-ablated mice, and that their signals are absent in layer 4 of S1 cortex in TCA-ablated mice. (C) Quantification of the intensity of NRN1- and VGF-immunoreactive signal in the VB. Data are presented as a percentage of control (mean ± standard error of the mean [SEM]): NRN1, 18.35 ± 4.03 %, N = 2 for each; VGF, 13.43 ± 2.85%, N = 4 for control, N = 5 for TCA-ablated mice, p = 0.0151; Mann–Whitney U test, *p < 0.05. dLGN, dorsal lateral geniculate nucleus; L4, layer 4; VB, ventrobasal nucleus. Scale bar, 200 μm.
-
Figure 4—source data 1
Raw data of C.
- https://cdn.elifesciences.org/articles/67549/elife-67549-fig4-data1-v2.xlsx
Figure 5 with 2 supplements
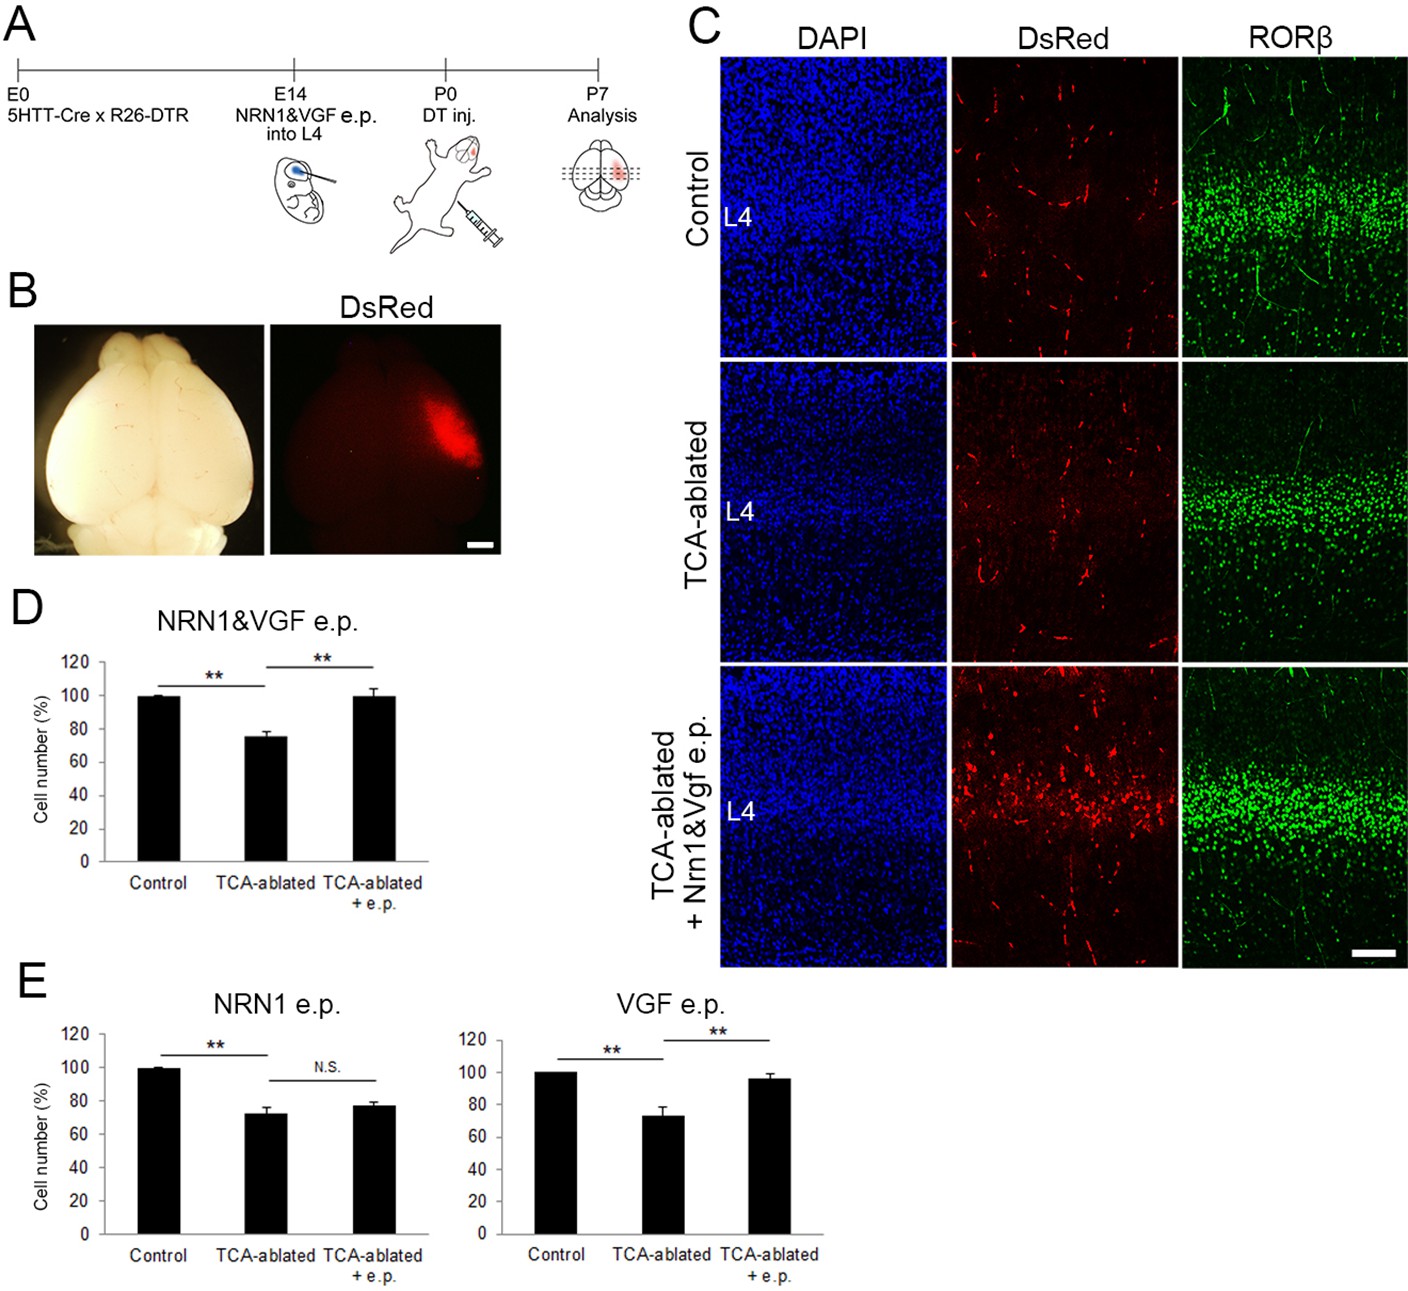
Overexpression of VGF rescues layer 4 formation in thalamocortical axon (TCA)-ablated mice.
(A) Schematic representation of the experimental procedure. (B) P7 electroporated (e.p.) brain showing the DsRed-positive e.p. region in the right hemisphere. (C) Cross-sections of S1 cortices of control, TCA-ablated, and TCA-ablated + e.p. mice stained for DsRed and RORβ. (D) Quantitative analysis of RORβ-expressing cells. Data are presented as a percentage of control (mean ± standard error of the mean [SEM]): TCA-ablated, 75.61 ± 2.87%, p = 0.0028; TCA-ablated + e.p., 99.52 ± 4.54%, p = 0.0022, N = 6 animals for each; Mann–Whitney U test, **p < 0.01. (E) Results of single electroporation of NRN1 or VGF into layer 4 of TCA-ablated mice. The number of RORβ-expressing cells was counted and presented as a percentage of control (mean ± SEM): NRN1 e.p., 72.27 ± 3.68% (TCA-ablated), p = 0.0075, 76.87 ± 2.18% (TCA-ablated +e.p.), p = 0.5476, N = 5 animals for each; VGF e.p., 73.43 ± 4.91% (TCA-ablated, N = 5 animals for control, 7 animals for TCA-ablated), p = 0.0042, 96.2 ± 3.10% (TCA-ablated + e.p., N = 5 animals for control, 7 animals for TCA-ablated), p = 0.0023; Mann–Whitney U test, **p < 0.01. L4, layer 4. Scale bars, 1 mm (B), 100 μm (C).
-
Figure 5—source data 1
Raw data of D.
- https://cdn.elifesciences.org/articles/67549/elife-67549-fig5-data1-v2.xlsx
Figure 5—figure supplement 1
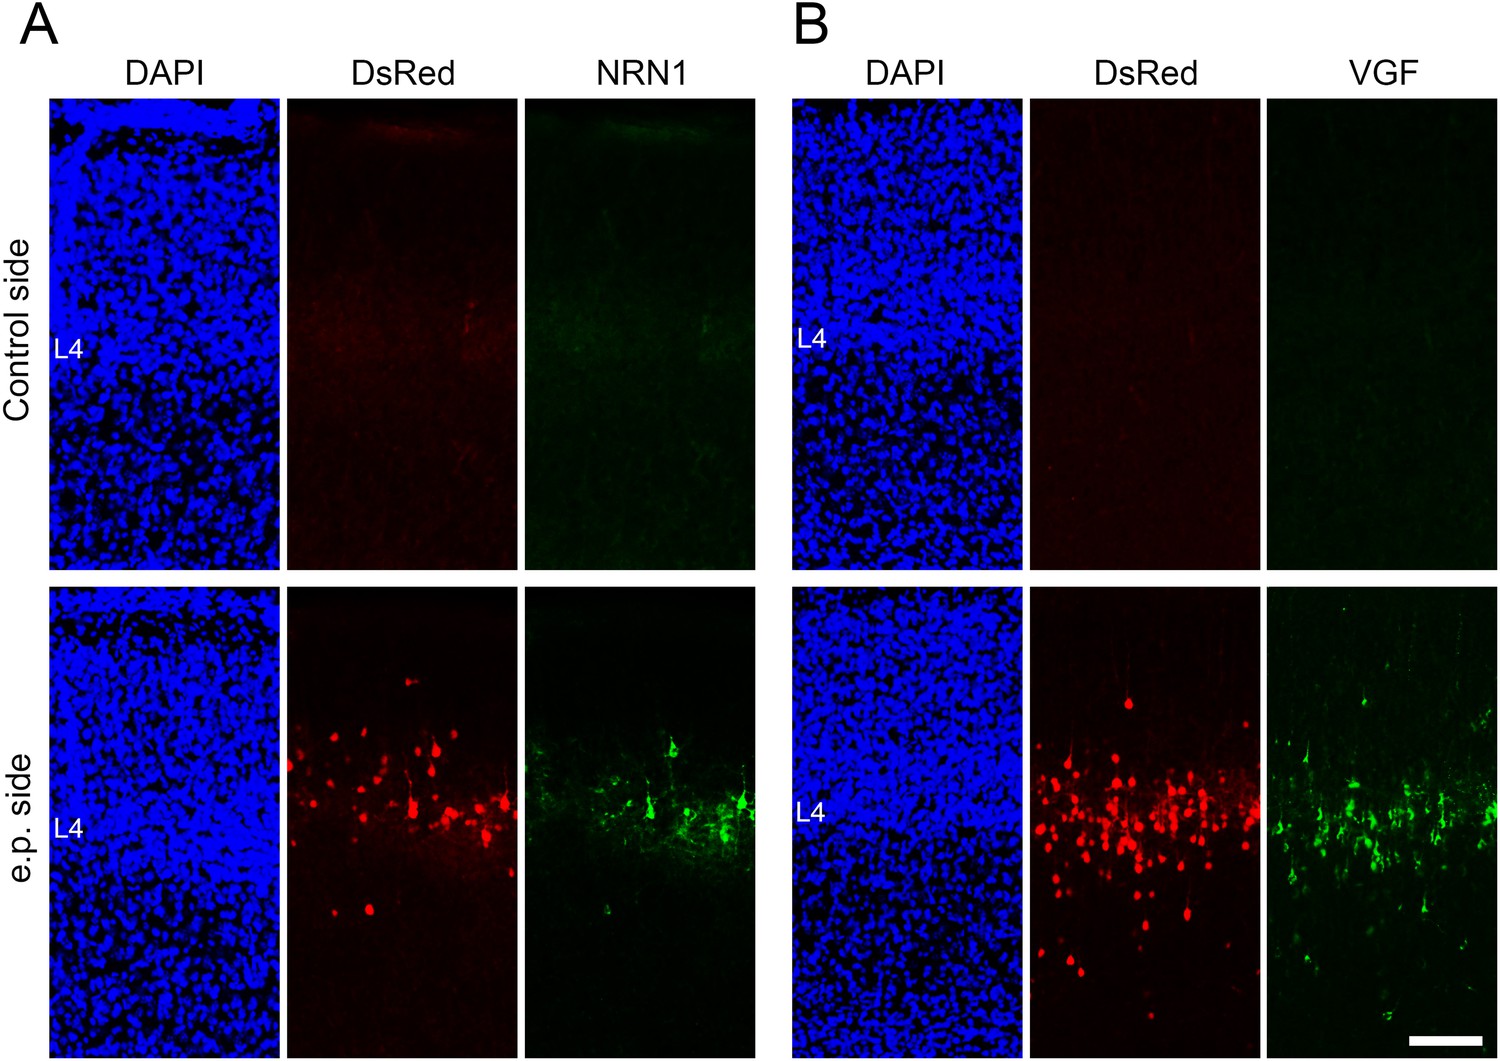
Expression of exogenous NRN1 and VGF in the electroporated cortices.
Coronal sections of P7 cortices electroporated with Nrn1-Flag, Vgf-Fc, and DsRed at E14.3, stained with anti-FLAG (A) and anti-VGF (B) antibodies in thalamocortical axon (TCA)-ablated mice. Note that both signals are observed in layer 4 neurons in the electroporated side but not in the control side. L4, layer 4. Scale bar, 200 μm.
Figure 5—figure supplement 2
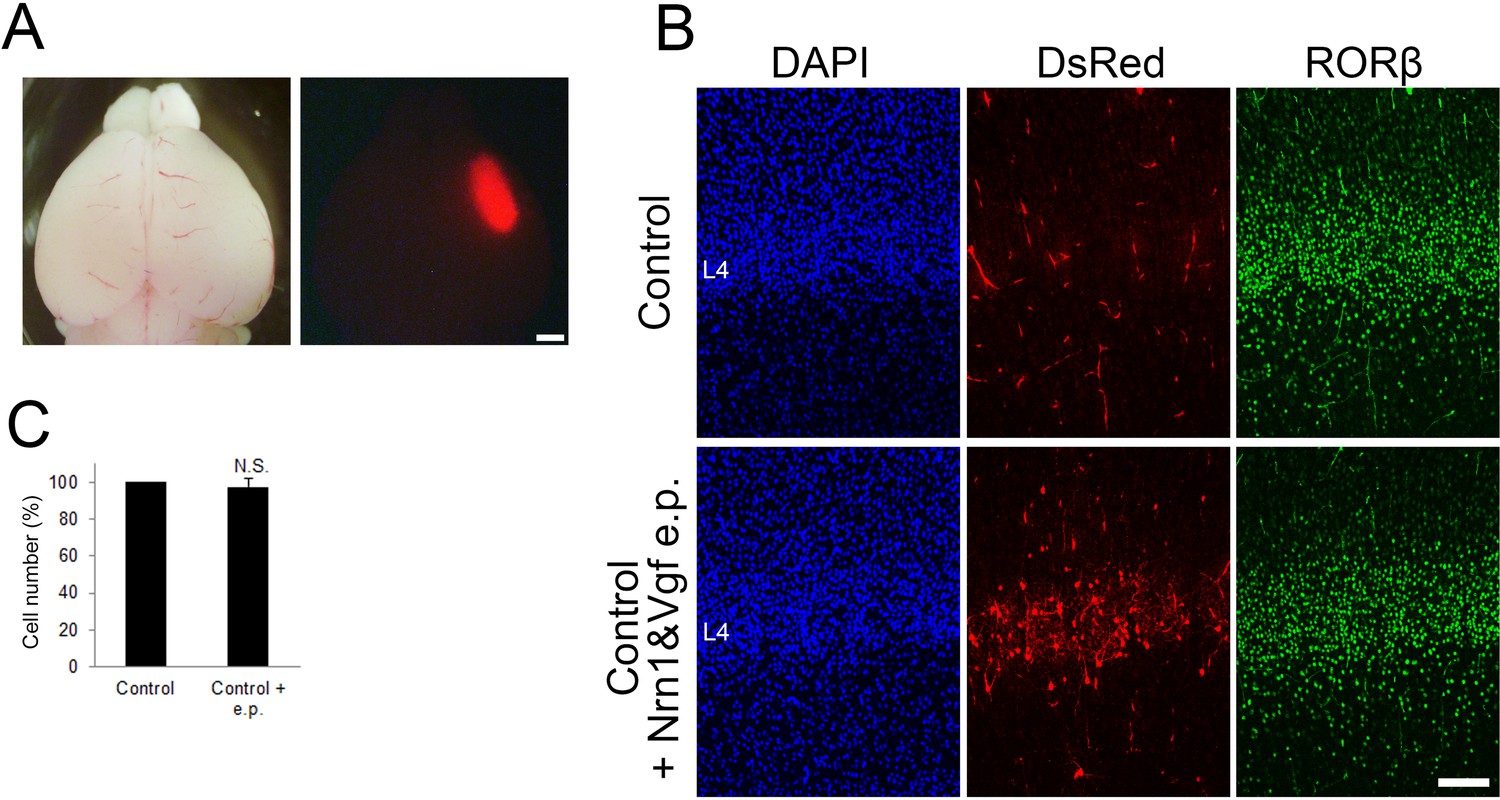
Overexpression of NRN1 and VGF did not affect layer 4 formation in control mice.
(A) P7 electroporated brain showing DsRed signal in the right hemisphere. (B) Cross-sections of S1 cortices of control and control + electroporated (e.p.) mice stained for DsRed and RORβ. (C) Quantification of the results. The number of RORβ-expressing cells is presented as a percentage of control (mean ± standard error of the mean [SEM]): 97.54 ± 4.31%, N = 6 for each, p = 0.932; Mann–Whitney U test. L4, layer 4. Scale bars, 1 mm (A), 100 μm (B).
-
Figure 5—figure supplement 2—source data 1
Raw data of C.
- https://cdn.elifesciences.org/articles/67549/elife-67549-fig5-figsupp2-data1-v2.xlsx
Figure 6
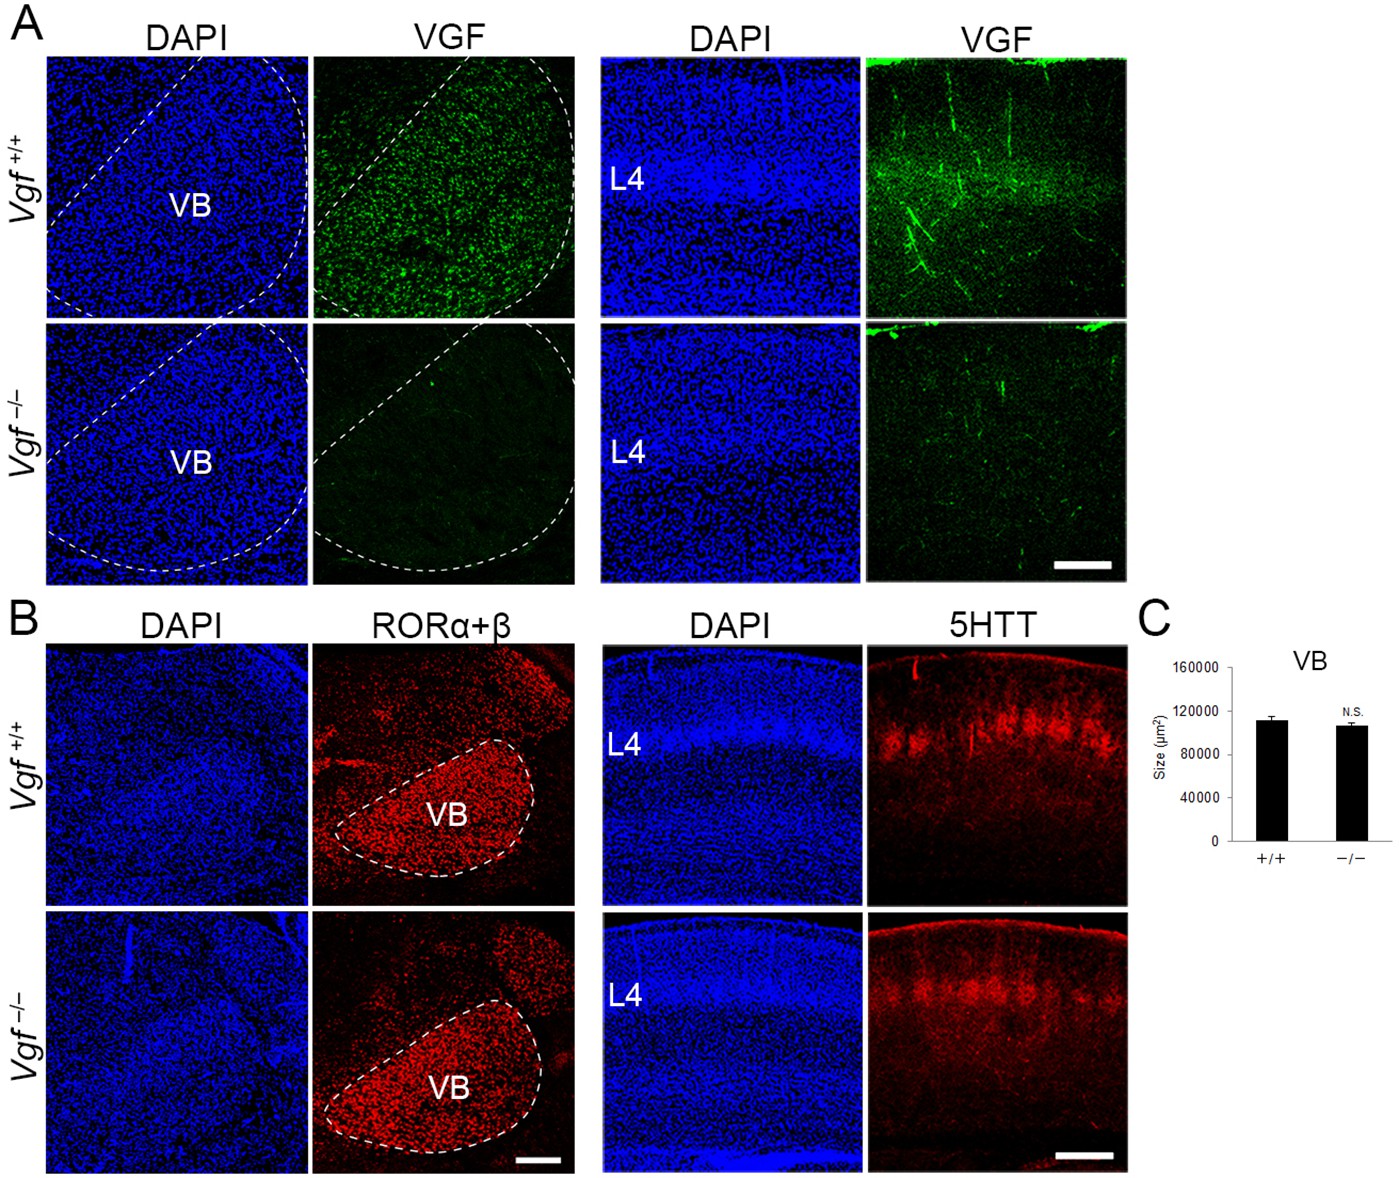
Generation of Vgf-KO mice using the CRISPR/Cas9 system.
Coronal sections of thalamus (left groups) and S1 cortex (right groups) of wild-type and Vgf-deficient mice at P8 stained with anti-VGF (A), -RORC (B), and -5HTT (B) antibodies. (C) Quantification of the size of the VB nucleus: 111,800.71 ± 3366.63 µm2 (wild-type), 106,920 ± 2667.67 µm2 (Vgf-KO), N = 8 mice for both, p = 0.235, Mann–Whitney U test. Note that VGF protein is lost in the VB and cortical layer 4 of Vgf−/− mice, whereas expression of RORα+β in the VB and the presence of 5HTT-positive thalamocortical axon (TCA) terminals in cortical layer 4 were not affected. Scale bars, 200 μm (A and B, left panel), 500 μm (B, right panel).
-
Figure 6—source data 1
Raw data of C.
- https://cdn.elifesciences.org/articles/67549/elife-67549-fig6-data1-v2.xlsx
Figure 7 with 2 supplements
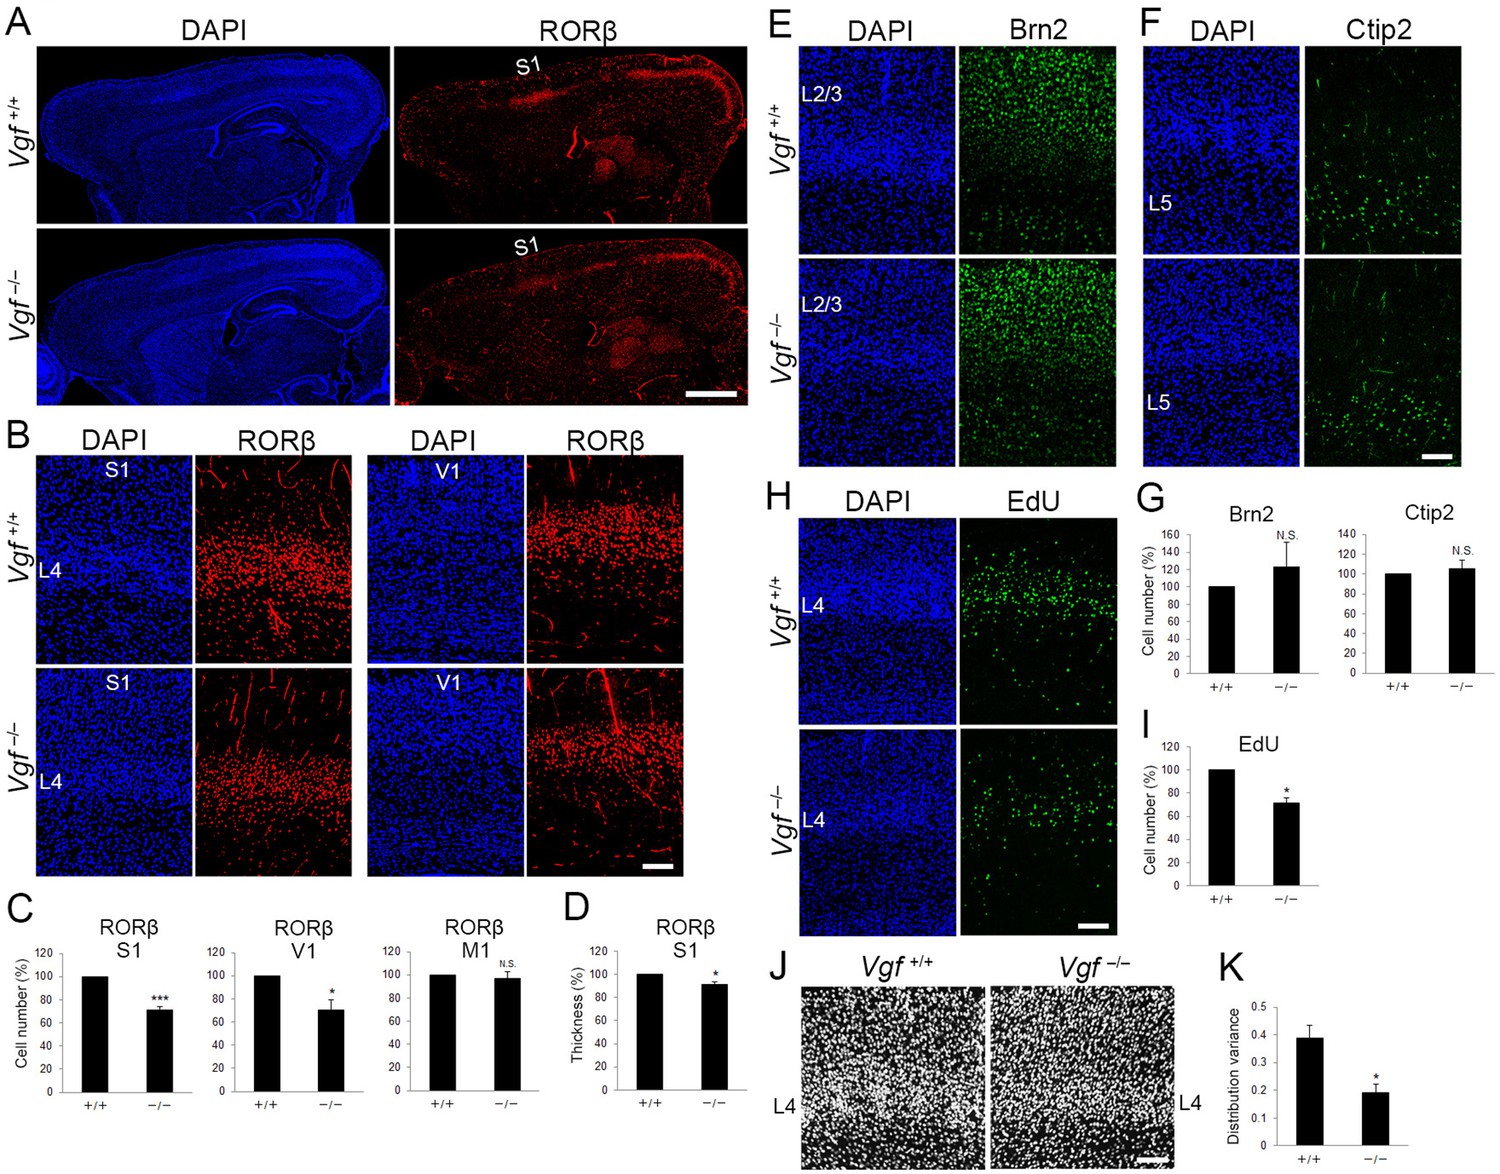
Vgf-deficiency causes a reduction of layer 4 neurons in S1.
(A) RORC immunostaining of sagittal sections of P8 cortices of wild-type and Vgf−/− mice revealed the reduction in layer 4 in the S1 area in the mutant. Coronal sections of P8 cortices of wild-type and Vgf−/− mice stained with anti-RORC (B), anti-Brn2 (E), and anti-Ctip2 (F) antibodies. (C, G) Quantification of the results. Data are presented as a percentage of wild-type control (mean ± standard error of the mean [SEM]): RORβ S1, 70.87 ± 3.18%, N = 7 wild-type and 9 Vgf−/− mice, p = 0.0006; RORβ V1, 70.02 ± 9.36%, N = 3 wild-type and 5 Vgf−/− mice, p = 0.0314; Brn2, 123.18 ± 28.63%, N = 7 wild-type and 9 Vgf−/− mice, p = 0.301; Ctip2, 105.02 ± 9.37%, N = 7 wild-type and 9 Vgf−/− mice, p = 0.740; Mann–Whitney U test, *p < 0.05, ***p < 0.001. (D) Relative thickness of RORβ-expressing layer to the wild-type: 91.34 ± 2.24%, N = 5 Vgf−/− mice, p = 0.0325; Mann–Whitney U test, *p < 0.05. Three wild-type mice were used as the reference. (H) Cross-sections of S1 cortices of wild-type and Vgf−/− mice at P7 stained for EdU. EdU was injected at E14.3. (I) Quantification of the results. The number of EdU-positive cells within an 850-μm-wide strip of the cortical wall relative to control is shown as the mean ± SEM: 71.22 ± 5.06%, N = 4 animals for each, p = 0.0211; Mann–Whitney U test, *p < 0.05. (J) DAPI staining of coronal sections showed barrel structure as uneven and repetitive distribution of cell nuclei in layer 4 of wild-type, but not of Vgf−/− mice. (K) Distribution variance of layer 4 cells as the mean ± SEM: wild-type, 0.390 ± 0.045, N = 4 mice; Vgf−/−, 0.192 ± 0.032, N = 5 mice, p = 0.0159; Mann–Whitney U test, *p < 0.05. L2/3, layers 2 and 3; L4, layer 4; L5, layer 5; S1, primary somatosensory area; V1, primary visual area. Scale bars, 1 mm (A), 100 μm (B, E, F, H, J).
Figure 7—figure supplement 1
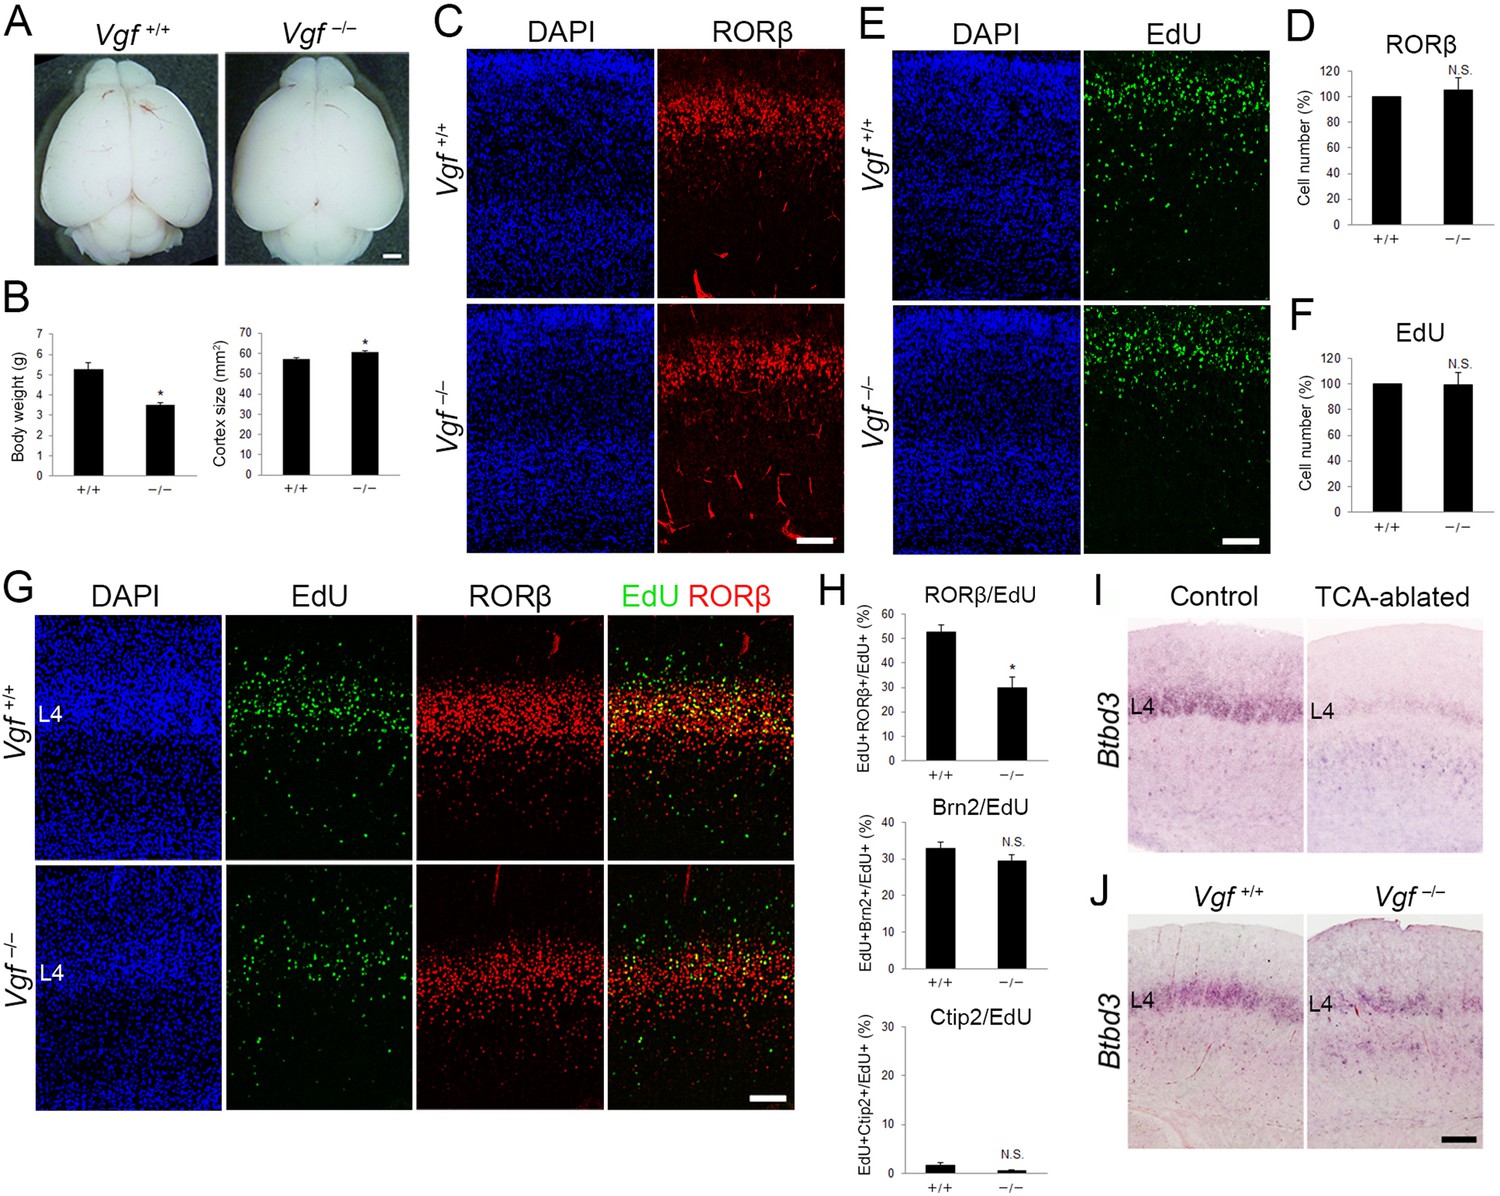
Neonatal cell number and postnatal cell fate of layer 4 neurons in Vgf-KO mice.
(A) Dissected brains of wild-type and Vgf−/− mouse at P8. (B) Quantitative data of body weight and cortical surface area presented as the mean ± standard error of the mean (SEM): body weight, 5.29 ± 0.42 g (wild-type, N = 4 mice), 3.51 ± 0.05 g (Vgf−/−, N = 5 mice), p = 0.0189; cortical surface area, 57.43 ± 0.62 mm2 (wild-type, N = 4 mice), 60.76 ± 0.37 mm2 (Vgf−/−, N = 5 mice), p = 0.0159; Mann–Whitney U test, *p < 0.05. (C, E) Cross-sections of cortices dissected from P0 Vgf-KO mice, stained for RORβ and EdU. EdU was administrated at E14.7. (D, F) Quantitative data of the number of RORβ- and EdU-positive cells presented as a percentage of control (mean ± SEM): RORβ, 104.00 ± 9.58%, N = 4 mice for each, p = 0.878; EdU, 99.21 ± 11.83%, N = 4 for each, p = 0.878; Mann–Whitney U test. (G) Cross-sections of P7 cortices from Vgf-KO mice, stained for RORβ and EdU. EdU was administrated at E14.7. Sections were counterstained with DAPI. (H) Quantification of the results. Percentage of EdU-labeled cells with a given layer marker is presented as the mean ± SEM: RORβ/EdU, 52.66 ± 2.92% (wild-type), 30.05 ± 4.14% (Vgf−/−), N = 4 mice for each, p = 0.0286; Brn2/EdU, 32.94 ± 1.74% (wild-type), 29.54 ± 1.71% (Vgf−/−), N = 4 mice for each, p = 0.200; Ctip2/EdU, 1.63 ± 0.36% (wild-type), 0.66 ± 0.16% (Vgf−/−), N = 4 mice for each, p = 0.0571; Mann–Whitney U test, *p < 0.05. (I, J) In situ hybridization for Btbd3 in S1 layer 4 of P7 mice. (I) Thalamocortical axon (TCA)-ablated and (J) Vgf-KO mice with controls. L4, layer 4. Scale bars, 1 mm (A), 100 µm (C, E, G, I, J).
-
Figure 7—figure supplement 1—source data 1
Raw data of B, D, F, H.
- https://cdn.elifesciences.org/articles/67549/elife-67549-fig7-figsupp1-data1-v2.xlsx
Figure 7—figure supplement 2
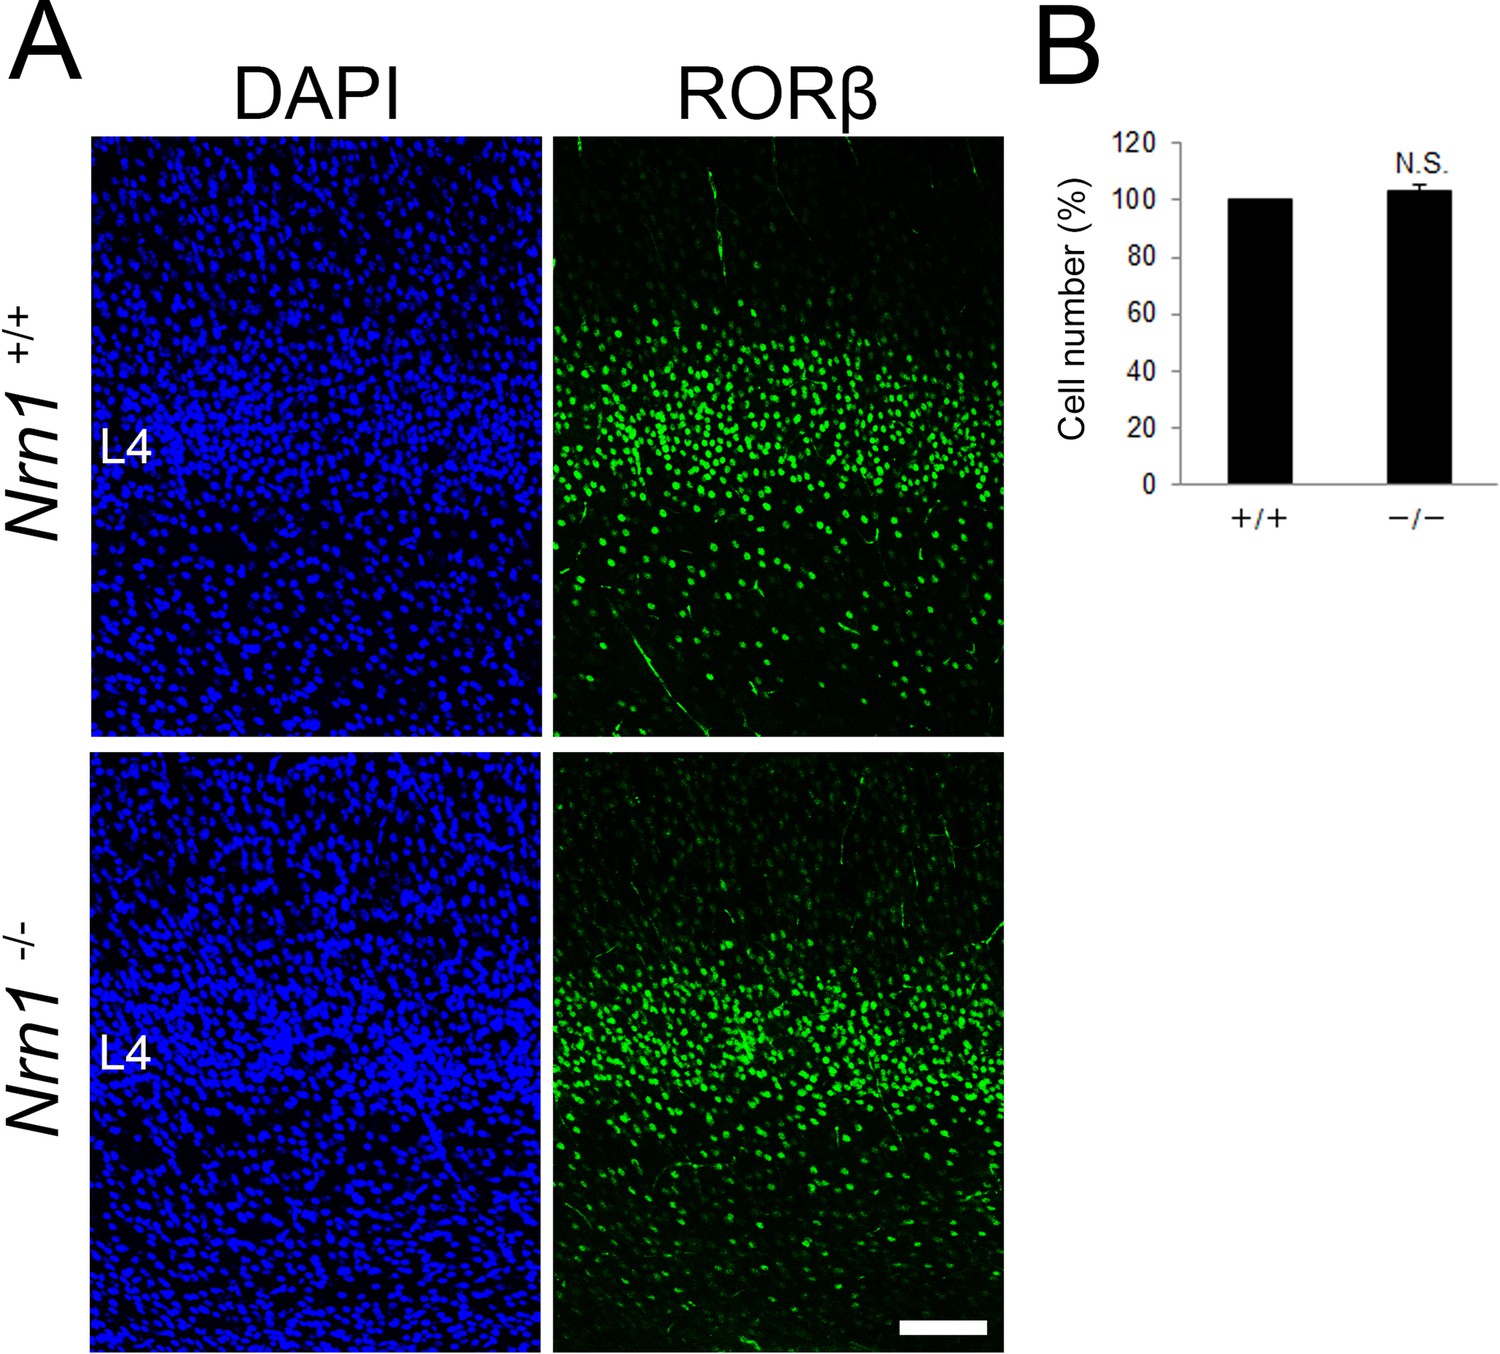
Nrn1-KO mice show normal layer 4.
(A) Coronal sections of S1 cortex of wild-type and Nrn1-deficient mice at P8 stained with anti-RORC antibody. (B) Quantification of the results. The number of RORC-immunoreactive cells is presented as a percentage of control (mean ± standard error of the mean [SEM]): 102.95 ± 2.53%, N = 7 sections form 4 mice for each, p = 0.283, Mann–Whitney U test. L4, layer 4. Scale bar, 100 μm.
Author response image 1
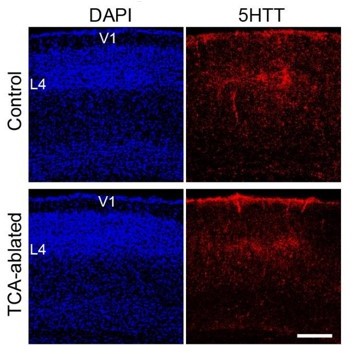
Thalamocortical projection is preserved in V1 of TCAablated mice.
Cross sections of V1 region of P7 control (upper panels) and TCA-ablated (lower panels) mice stained with anti-5HTT antibody. V1, primary visual area; L4, layer 4. Scale bar, 200 µm.
Author response image 2
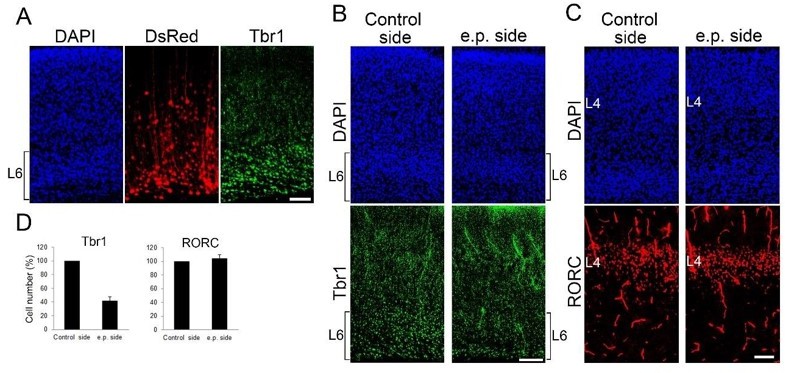
Postnatal L6 ablation does not affect L4 cell number at P7.
(A-C) Coronal sections of P7 cortices electroporated with DTR and DsRed at E11.5, when layer 6 neurons are produced. Without DT administration, DsRedpositive cells are mainly located in Tbr1-positive layer 6 at P7 (A). Upon DT administration at P0, the number of Tbr1-positive layer 6 cells was markedly reduced on electroporated (e.p.) side compared with control side at P7 (B). The number of RORC-immunoreactive layer 4 cells was not different between the hemispheres (C). (D) Quantification of the results. The number of RORC- and Tbr1-immunoreactive cells is presented as a percentage of control (mean ± SEM): Tbr1, 41.40 ± 6.44%; RORC, 104.25 ± 5.25%, N = 3 for each. L4, layer 4; L6, layer 6. Scale bars, 100 µm.
Author response image 3
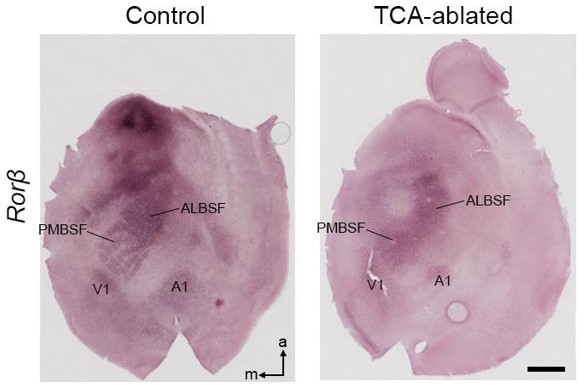
Area pattern on tangential sections of TCA-ablated mice.
In situ hybridization for Rorβ on flat-mount sections of P7 control and TCAablated mice. PMBSF, posteromedial barrel subfield; ALBSF, anterolateral barrel subfield; V1, primary visual area; A1, primary auditory area; m, medial; a, anterior. Scale bar, 1 mm.
Tables
Appendix 1—key resources table
| Reagent type (species) or resource | Designation | Source or reference | Identifiers | Additional information |
|---|---|---|---|---|
| Gene (M. musculus) | Nrn1 | GenBank | BC035531 | |
| Gene (M. musculus) | Vgf | GenBank | BC085134 | |
| Gene (Homo-sapiens) | HBEGF | GenBank | BC033097 | |
| Strain, strain background (Escherichia coli) | DH5α | Our lab | Calcium chloride-treated competent cells | |
| Strain, strain background (M. musculus) | ICR | SLC Japan | Slc:ICR | |
| Strain, strain background (M. musculus) | C57BL/6J | SLC Japan | C57BL/6JJmsSlc | |
| Genetic reagent (M. musculus) | C57BL/6J-Tg(Slc6a4-cre)208Ito(5HTT-Cre, Sert-Cre, SLC6A4-Cre) | RIKEN BRC Arakawa et al., 2014 | RBRC10598C57BL/6J-Tg(Slc6a4-cre)208Ito | |
| Genetic reagent (M. musculus) | ROSA26iDTR(B6-iDTR) | The Jackson Laboratory Buch et al., 2005 | Strain #007900C57BL/6-Gt(ROSA)26Sortm1(HBEGF)Awai/J | |
| Genetic reagent (M. musculus) | R26R-EYFP | The Jackson LaboratorySrinivas et al., 2001 | Strain #006148B6.129 × 1-Gt(ROSA)26Sortm1(EYFP)Cos/J | |
| Genetic reagent (M. musculus) | Nrn1-KO | This paper | CRISPR-mediated Nrn1 null mice available upon request | |
| Genetic reagent (M. musculus) | Vgf-KO | This paper | CRISPR-mediated Vgf null mice available upon request | |
| Antibody | anti-RORC (Mouse monoclonal) | Perseus Proteomics | Cat#: PP-H3925-00 | IF (1:800) |
| Antibody | anti-GFP (Rabbit polyclonal) | Invitrogen | Cat#: A6455 | IF (1:800) |
| Antibody | anti-Iba1 (Rabbit polyclonal) | Wako | Cat#: 019-19741 | IF (1:500) |
| Antibody | anti-Brn2 (Goat polyclonal) | Santa Cruz | Cat#: sc-6029 | IF (1:50) |
| Antibody | anti-Ctip2 (Rat polyclonal) | Abcam | Cat#: ab18465 | IF (1:200) |
| Antibody | anti-Tbr1 (Rabbit polyclonal) | Abcam | Cat#: ab31940 | IF (1:500) |
| Antibody | anti-NeuN (Mouse monoclonal) | Chemicon | Cat#: MAB377 | IF (1:400) |
| Antibody | anti- Cux1 (Rabbit polyclonal) | Santa Cruz | Cat#: sc-13024 | IF (1:100) |
| Antibody | anti-RFP (Rabbit polyclonal) | MBL | Cat#: PM005 | IF (1:1000) |
| Antibody | anti-FLAG (Mouse monoclonal) | Sigma-Aldrich | Cat#: F1804 | IF (1:1000) |
| Antibody | anti-ssDNA (Rabbit polyclonal) | MBL | Cat#: 18,731 | IF (1:300) |
| Antibody | anti- RORβ (Rabbit polyclonal) | Diagenode | Cat#: pAb-RORβHS-100 | IF (1:5000) |
| Antibody | anti- NRN1 (Rabbit polyclonal) | Santa Cruz | Cat#: sc-13 25,261 | IF (1:50) |
| Antibody | anti-VGF (Goat polyclonal) | Santa Cruz | Cat#: sc-10381 | IF (1:50) |
| Antibody | anti-DIG (Sheep polyclonal) | Roche | Cat#: 11093274910 | ISH (1:1000) |
| Recombinant DNA reagent | pFLCI-Btbd3 (plasmid) | Matsui et al., 2011 | ||
| Recombinant DNA reagent | pCAG-DTR (plasmid) | This paper | HBEGF expression plasmid driven by CAG promoter | |
| Recombinant DNA reagent | pCAG-DsRed(plasmid) | Zhao et al., 2011 | ||
| Sequence-based reagent | Nrn1 sgRNA | This paper | Single-guide RNA targeting Nrn1 | AGCATGGCCAACTACCCGCA |
| Sequence-based reagent | Vgf sgRNA #1 | This paper | Single-guide RNA targeting Vgf | TCACGTTGCCGGCATCCGTC |
| Sequence-based reagent | Vgf sgRNA #2 | This paper | Single-guide RNA targeting Vgf | CGGTACTGTTGCAGGCACTGGACCGT |
| Sequence-based reagent | Nrn1_FW | This paper | PCR primer | ACCAGGGAACTGAGCCTGAG |
| Sequence-based reagent | Nrn1_RV | This paper | PCR primer | GGACTCACCTCCCTGCTATC |
| Sequence-based reagent | Vgf-FW | This paper | PCR primer | GGTACCCAGAAGGAGGATTG |
| Sequence-based reagent | Vgf-RV | This paper | PCR primer | TTGCTCGGACTGAAATCTCG |
| Sequence-based reagent | Vgf-Seq | This paper | Sequencing primer | CTCAGCTCTGAGCATAATGG |
| Peptide, recombinant protein | Diphtheria toxin | Calbiochem | Cat#: 322,326 | |
| Commercial assay or kit | HistoVT One | Nacalai Tesque | Cat#: 06380-05 | |
| Commercial assay or kit | M.O.M. Basic Kit | Vector | Cat#: BMK-2202 | |
| Commercial assay or kit | VENTASTAIN ABC Kit | Vector | Cat#: PK4000 | |
| Commercial assay or kit | Click-iT EdU Imaging Kit | Thermo Fisher Scientific | Cat#: C10337 | |
| Commercial assay or kit | DIG-RNA Synthesis Kit | Roche | Cat#: 11175025910 | |
| Commercial assay or kit | Plasmid Maxi Kit, Roche | Genopure | Cat#: 03143422001 | |
| Chemical compound, drug | NBT/BCIP | Roche | Cat#: 11681451001 | ISH (1:50) |
| Chemical compound, drug | DiA | Thermo Fisher Scientific | Cat#: D3883 | |
| Chemical compound, drug | DiI | Thermo Fisher Scientific | Cat#: D3911 | |
| Software, algorithm | Metamorph software | Molecular Devices | ||
| Software, algorithm | ImageJ | https://imagej.nih.gov/ij/ | ImageJ v1.52 | |
| Software, algorithm | GraphPad Prism | GraphPad Software | GraphPad Prism 5.0 | |
| Other | DAPI stain | Wako | Cat#: 340-07971 | 1:1000 |
Additional files
Download links
A two-part list of links to download the article, or parts of the article, in various formats.
Downloads (link to download the article as PDF)
Open citations (links to open the citations from this article in various online reference manager services)
Cite this article (links to download the citations from this article in formats compatible with various reference manager tools)
Thalamocortical axons control the cytoarchitecture of neocortical layers by area-specific supply of VGF
eLife 11:e67549.
https://doi.org/10.7554/eLife.67549


