SNX9-induced membrane tubulation regulates CD28 cluster stability and signalling
- EMBL Australia Node in Single Molecule Science, School of Medical Sciences and the ARC Centre of Excellence in Advanced Molecular Imaging, University of New South Wales, Australia
- Biotechnology Institute Thurgau (BITg) at the University of Konstanz, Switzerland
- Department of Biology, University of Konstanz, Germany
- Electron Microscopy Unit, Mark Wainwright Analytical Centre, University of New South Wales, Australia
- Institute for Molecular Bioscience (IMB), University of Queensland, Australia
Figures
Figure 1 with 2 supplements
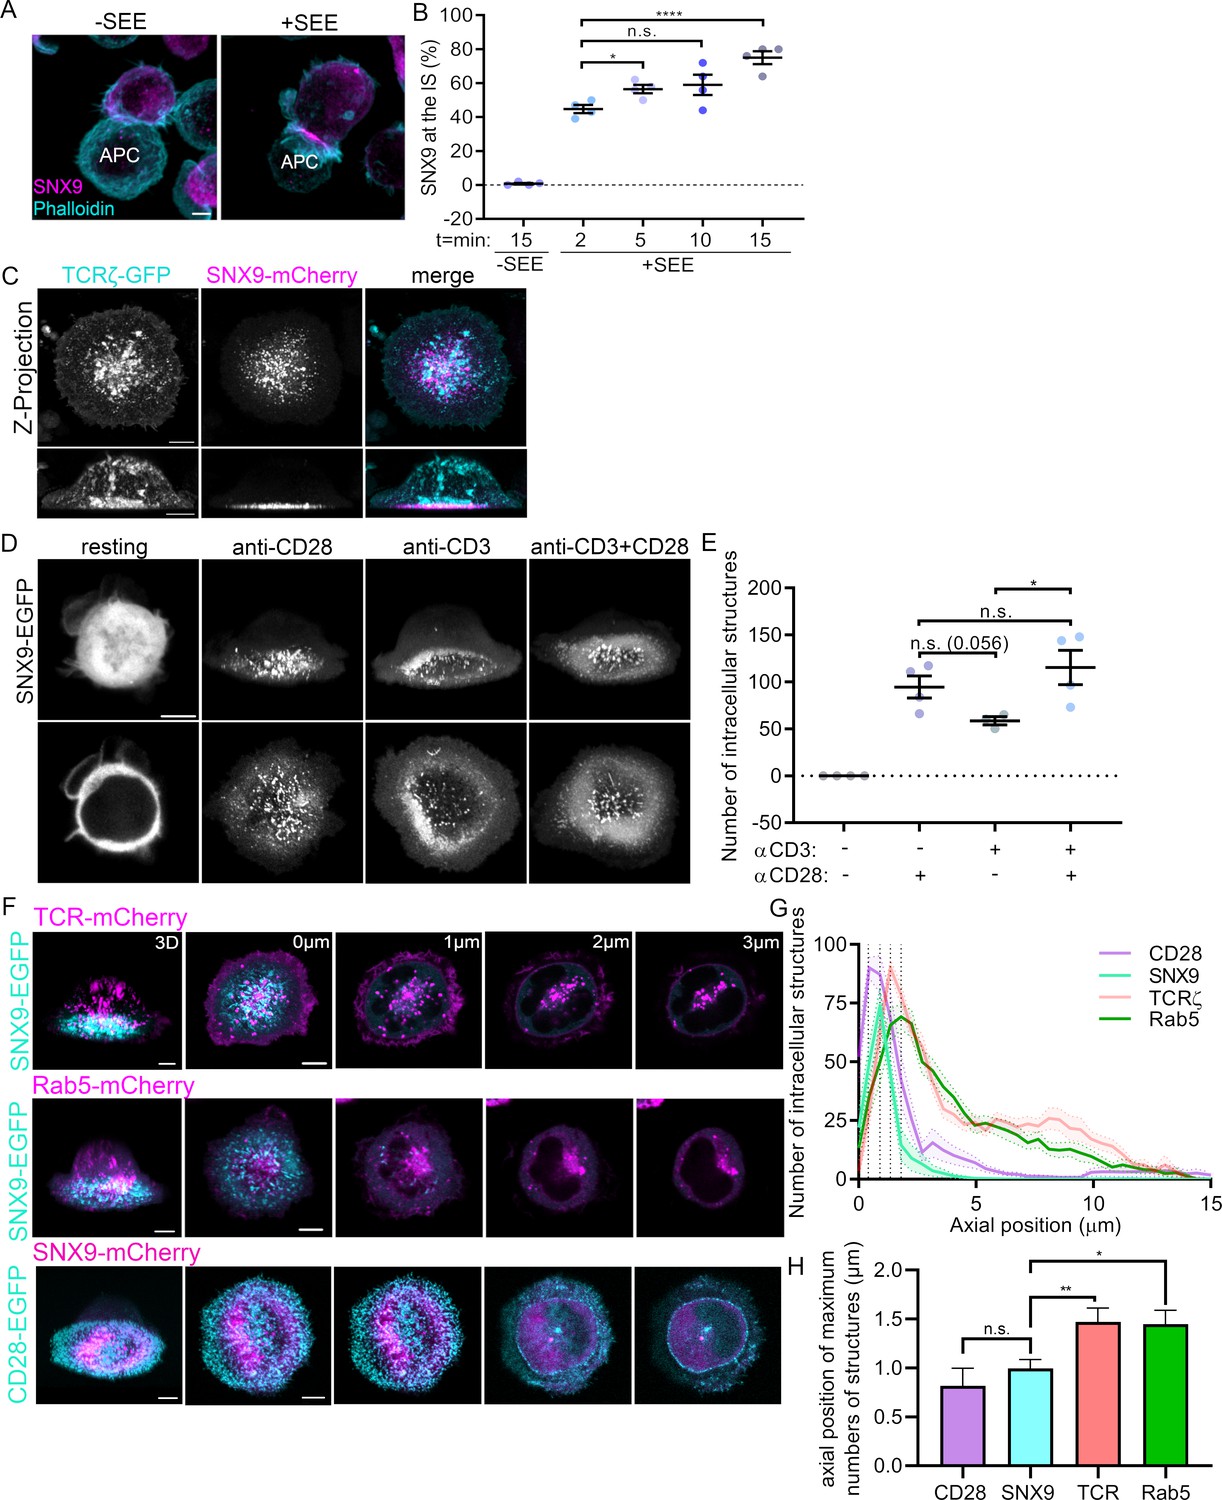
Recruitment of SNX9 to the immunological synapse upon T cell activation.
(A) Representative images of maximum intensity projections from Z-stacks (0.19 µm per slice) of WT Jurkat T cells conjugated to SEE pulsed (+ SEE) or non-pulsed (-SEE) antigen presenting cells (APC). Cells were then fixed after incubation at 37 °C for 2, 5, 10, or 15 min, permeabilized and stained for endogenous SNX9 and actin (Phalloidin-488). (B) Mean percentage of SNX9 recruitment towards the synapse at indicated time points of cell shown in A identified in a blinded analysis of 60–100 cells per condition in four independent experiments. (C) Representative live images of WT Jurkat T cells activated on cover glass (anti-CD3ε and anti-CD28), expressing SNX9-mCherry and TCRζ-EGFP. Top panel: maximum intensity projections from Z-stacks (0.19 µm per slice) Bottom panel: shows 3D reconstructions. (D) Representative images of 3D reconstruction and maximum intensity projections of wildtype Jurkat T cells expressing SNX9-EGFP either in resting (PLL-coated cover glass) or under different activating conditions. (E) Mean number of SNX9-positive structures in T cells activated under different conditions in three to four experiments (8–11 cells per experiment). (F) Representative live images of activated Jurkat T cells co-expressing SNX9-EGFP or -mCherry and either TCRζ-mCherry (top), Rab5-mCherry (middle) or CD28-EGFP (bottom). (G) Quantification of the number of SNX9-EGFP/-mCherry, TCRζ-mCherry, Rab5-mCherry and CD28-EGFP positive vesicles in each frame of the z-stack of three to four experiments (5 cells per experiment). (H) Average axial position where the maximum number of CD28, SNX9, TCRζ and Rab5 structures were identified. Dots represent individual experiments. Error bars indicate mean ± SEM. n.s. = not significant, * = p < 0.05, **** = p < 0.0001 from Student’s T-test of means of independent experiments. Scale bar = 5 µm.
Figure 1—figure supplement 1
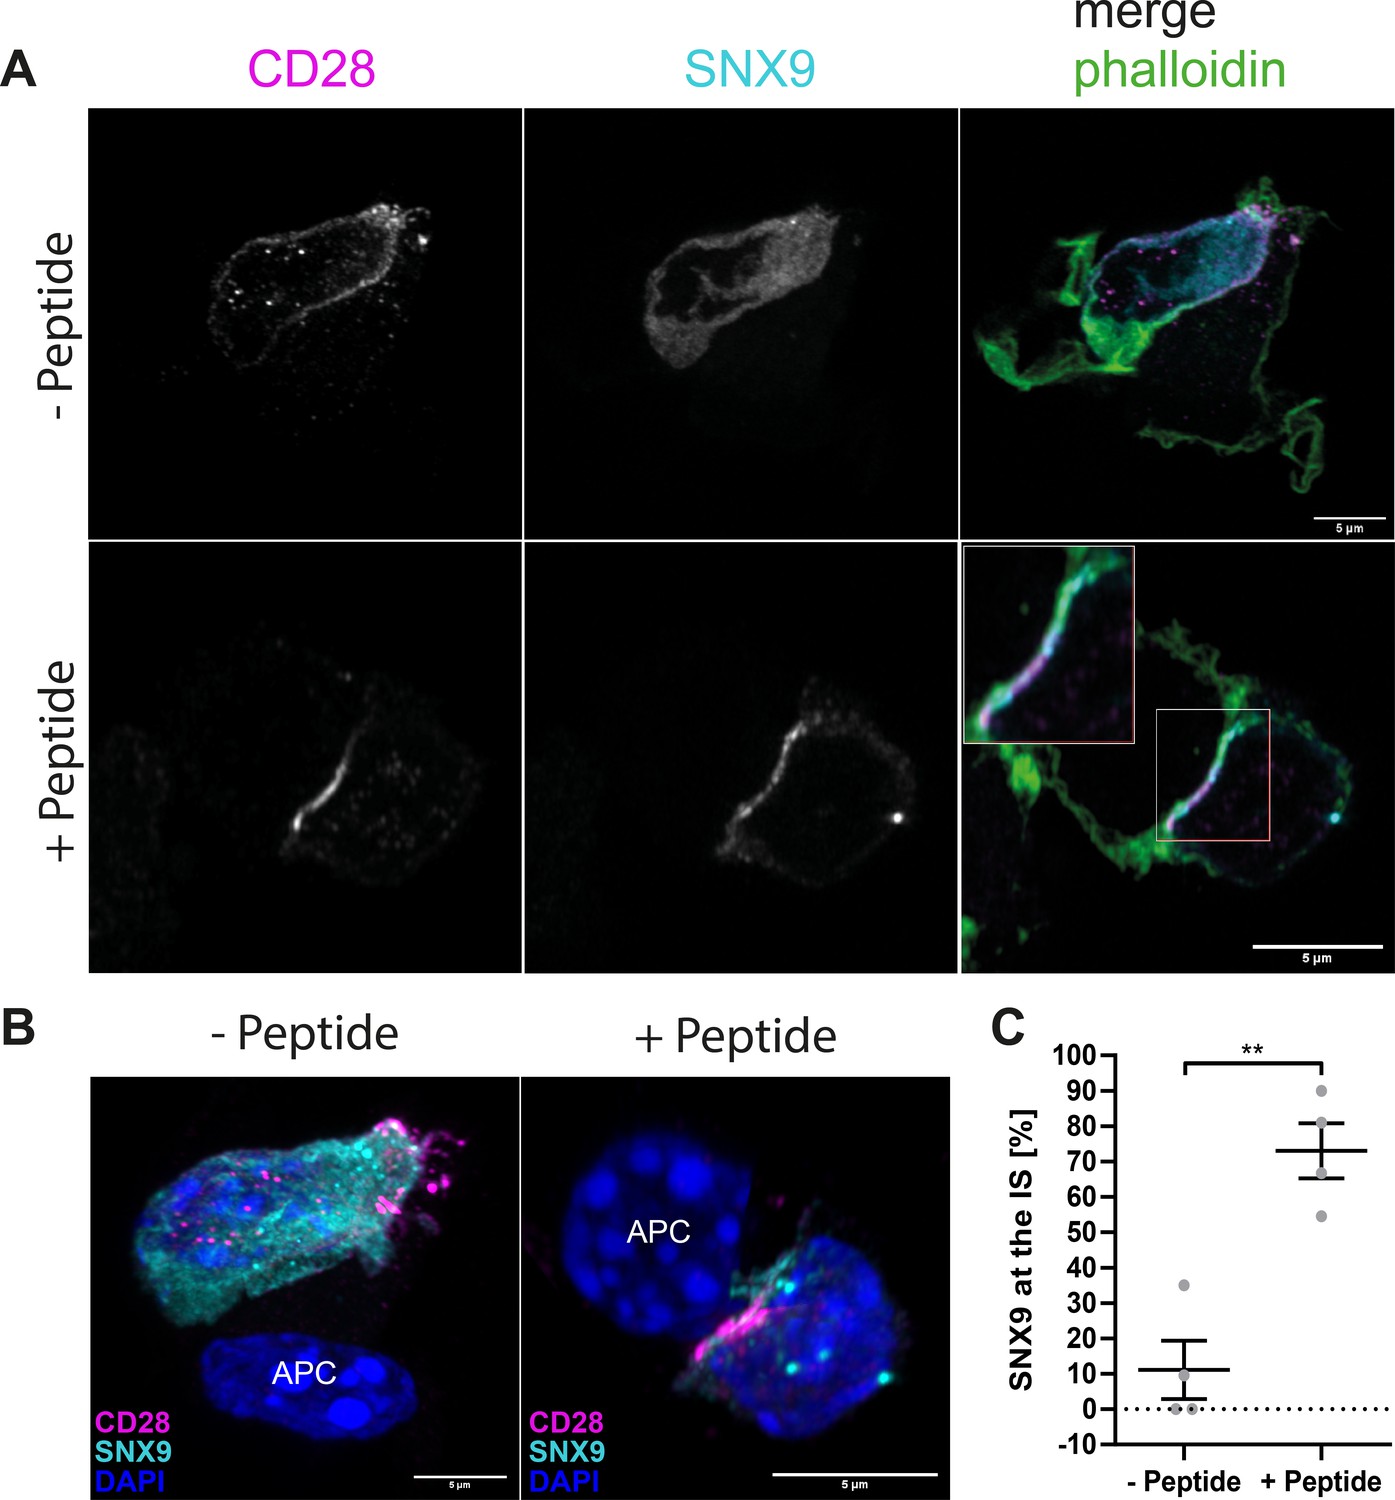
SNX9 is recruited to the immunological synapse of primary T cells where it co-localises with CD28.
(A) Representative images of maximum intensity projections of 5 Z-stacks of OT-II T cells expressing GFP-SNX9 and conjugated for 15 min to bone marrow-derived dendritic cells pulsed with OT-II peptide (+ Peptide) or not (- Peptide) and stained for CD28 and F-actin. (B) 3D reconstructions of the same images as shown in (A) including DAPI. (C) Mean recruitment of SNX9 to the synapse with and without peptide after 15 min of conjugation. Four independent experiments with a total of 67 cells in presence of peptide and 74 cells without peptide. Error bars indicate mean ± SEM, ** = p < 0.01 from an unpaired Student’s T-test. Scale bar = 5 µm.
Figure 1—figure supplement 2
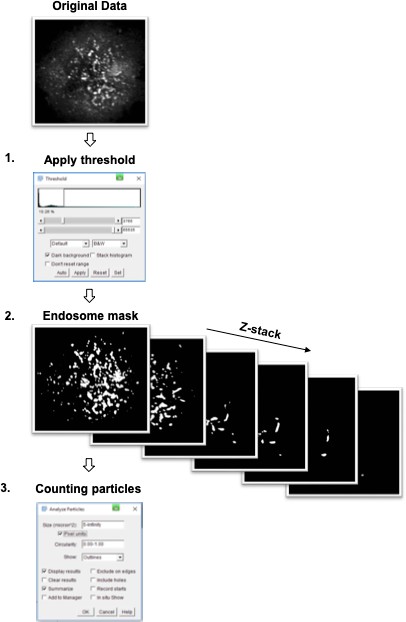
Worflow for identification of intracellular structures.
1. A threshold is applied to the original data to identify endosomal structures in the z-plane with maximal identifiable structures. 2. The threshold is applied to the entire Z-stack to generate a subsequent binary endosome mask for each image in the stack. 3. The endosome mask is then analysed to identify endosomal structures above a minimum of 5-pixel units in total size (pixel size: 65 nm).
Figure 2 with 5 supplements

Recruitment of SNX9 to CD28 clusters upon T cell activation.
(A) Representative TIRF images of fixed WT Jurkat T cells expressing CD28WT-EGFP or CD28YF-EGFP (cyan) and activated for 10 min. (B) Fold fluorescent intensities of CD28WT/YF-EGFP (cyan) and anti-SNX9 (purple) along the doted lines in A. (C) Quantification of the percentage overlap between WT or YF CD28 and SNX9, or Rab5 and SNX9. (D) Representative TIRF live images of WT Jurkat T cells expressing SNX9-mCherry and CD28-EGFP at indicated timepoints. Images representative of four independent experiments including four to eight cells each (E) Representative zoomed images of C, showing CD28-EGFP (red arrow) arriving at the immunological synapse first, recruiting SNX9-mCherry (magenta arrow) over time to the same microclusters (yellow). (F) Representative live images of activated Jurkat SNX9 KO#4T cells expressing SNX9-WT-mCherry (left), SNX9-ΔSH3-mCherry (middle) or SNX9-ΔPX-mCherry (right). (G) Representative live images of activated SNX9 KO#4T cells co-expressing CD28WT-EGFP and SNX9WT-mCherry, SNX9-ΔSH3-mCherry or SNX9-ΔPX-mCherry. (H) Fold change of mean fluorescence intensity profiles of SNX9-WT-mCherry, SNX9-ΔSH3-mCherry or SNX9-ΔPX-mCherry intensity within CD28WT-EGFP microclusters compared to the mean fluorescence intensity profile of SNX9WT-mCherry within the cytosol. Error bars indicate mean ± SEM. n.s. = not significant, ** = p < 0.01, from Student’s T-test of means of three independent experiments of 6–10 cells, or individual cells (C). Scale bar = 5 µm.
Figure 2—figure supplement 1
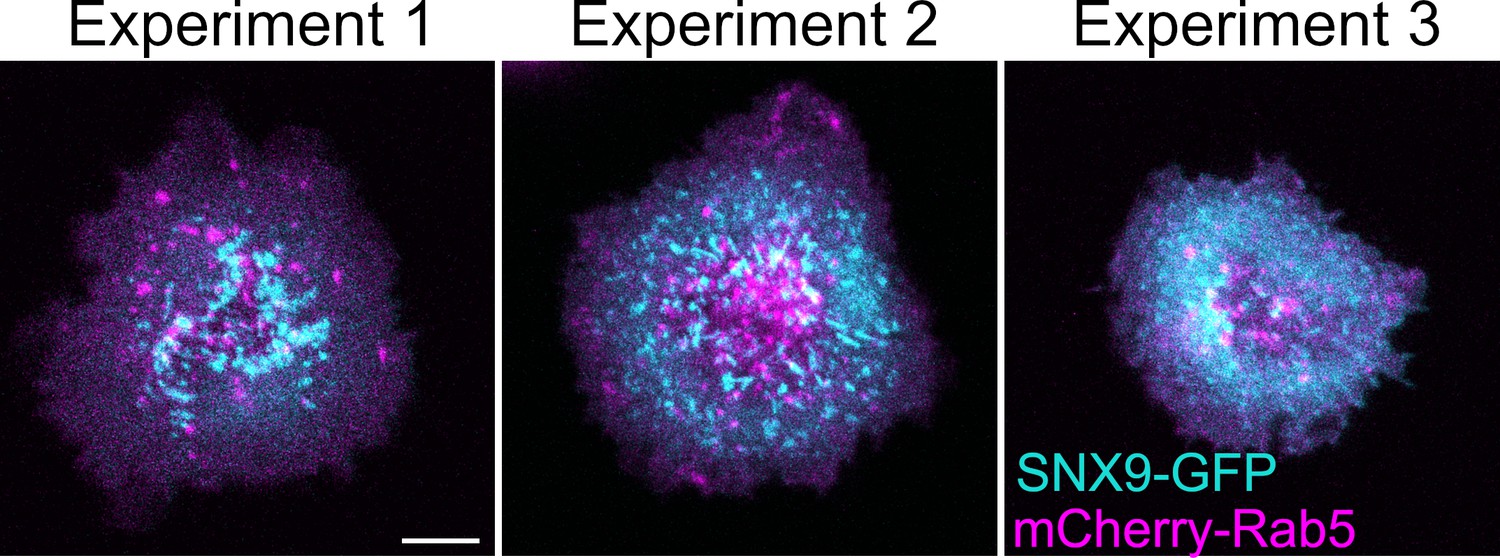
Representative confocal images from three independent experiments of WT Jurkat T cells expressing SNX9-GFP (cyan) and mCherry-Rab5 (magenta) and activated for 10 min.
Scale bar = 5 µm.
Figure 2—figure supplement 2
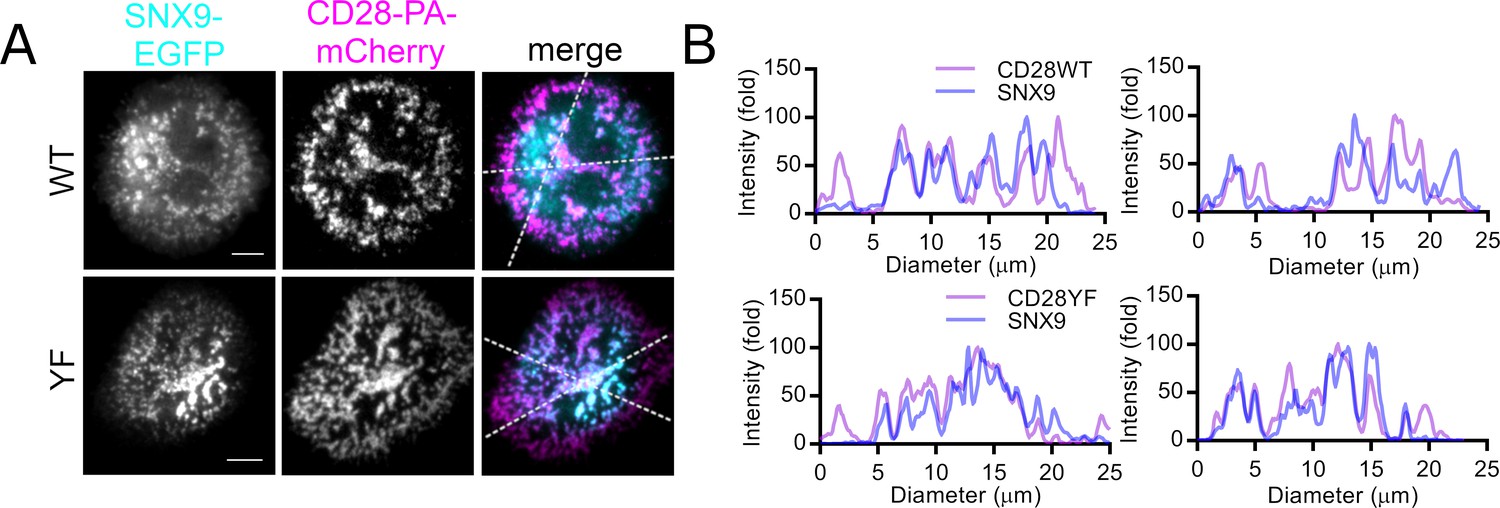
SNX9 is recruited into CD28 microclusters upon T cell activation.
(A) Representative images of Jurkat T cells expressing SNX9-EGFP (cyan) and CD28WT (top)- or CD28YF (bottom) fused to PA-mCherry (magenta), plated onto activating cover glass (anti-CD3ε and anti-CD28), photoactivated with 405 nm light and imaged live by TIRF microscopy for 250 frames (93.59 s). (B) Histograms of fold fluorescent intensities of CD28WT/YF (purple) and SNX9 (blue) on the white doted lines in the merged images. Scale bar = 5 µm.
Figure 2—figure supplement 3
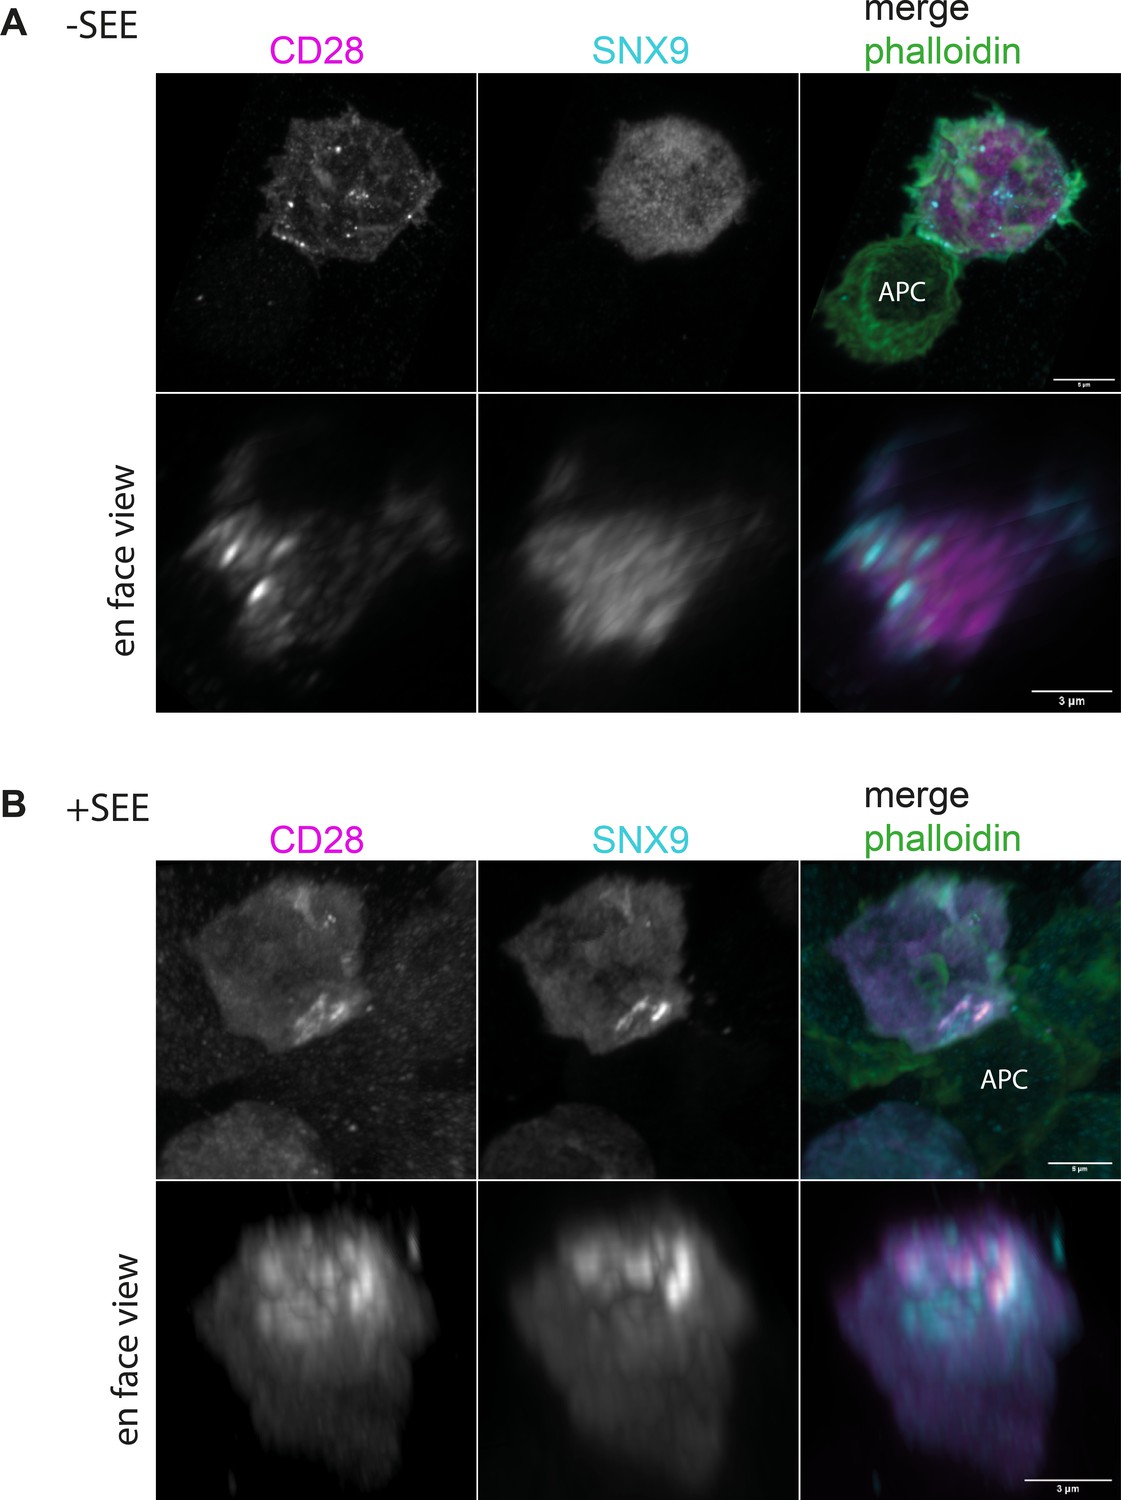
SNX9 is recruited into CD28 microclusters upon T cell activation by antigen-presenting cells.
(A) Upper row: representative images of maximum intensity projections from Z-stacks of Jurkat T cell expressing mCherry-SNX9 and CD28-EGFP conjugated to Raji B cells in absence of SEE for 15 min, fixed and stained for endogenous F- actin with phalloidin. Lower row: En-face view of the 3D reconstruction of the same cell. (B) Same as (A) for Jurkat T cells conjugated with SEE pulsed Raji B cells. Images are representative of three independent experiments. Scale bar = 3 µm.
Figure 2—figure supplement 4
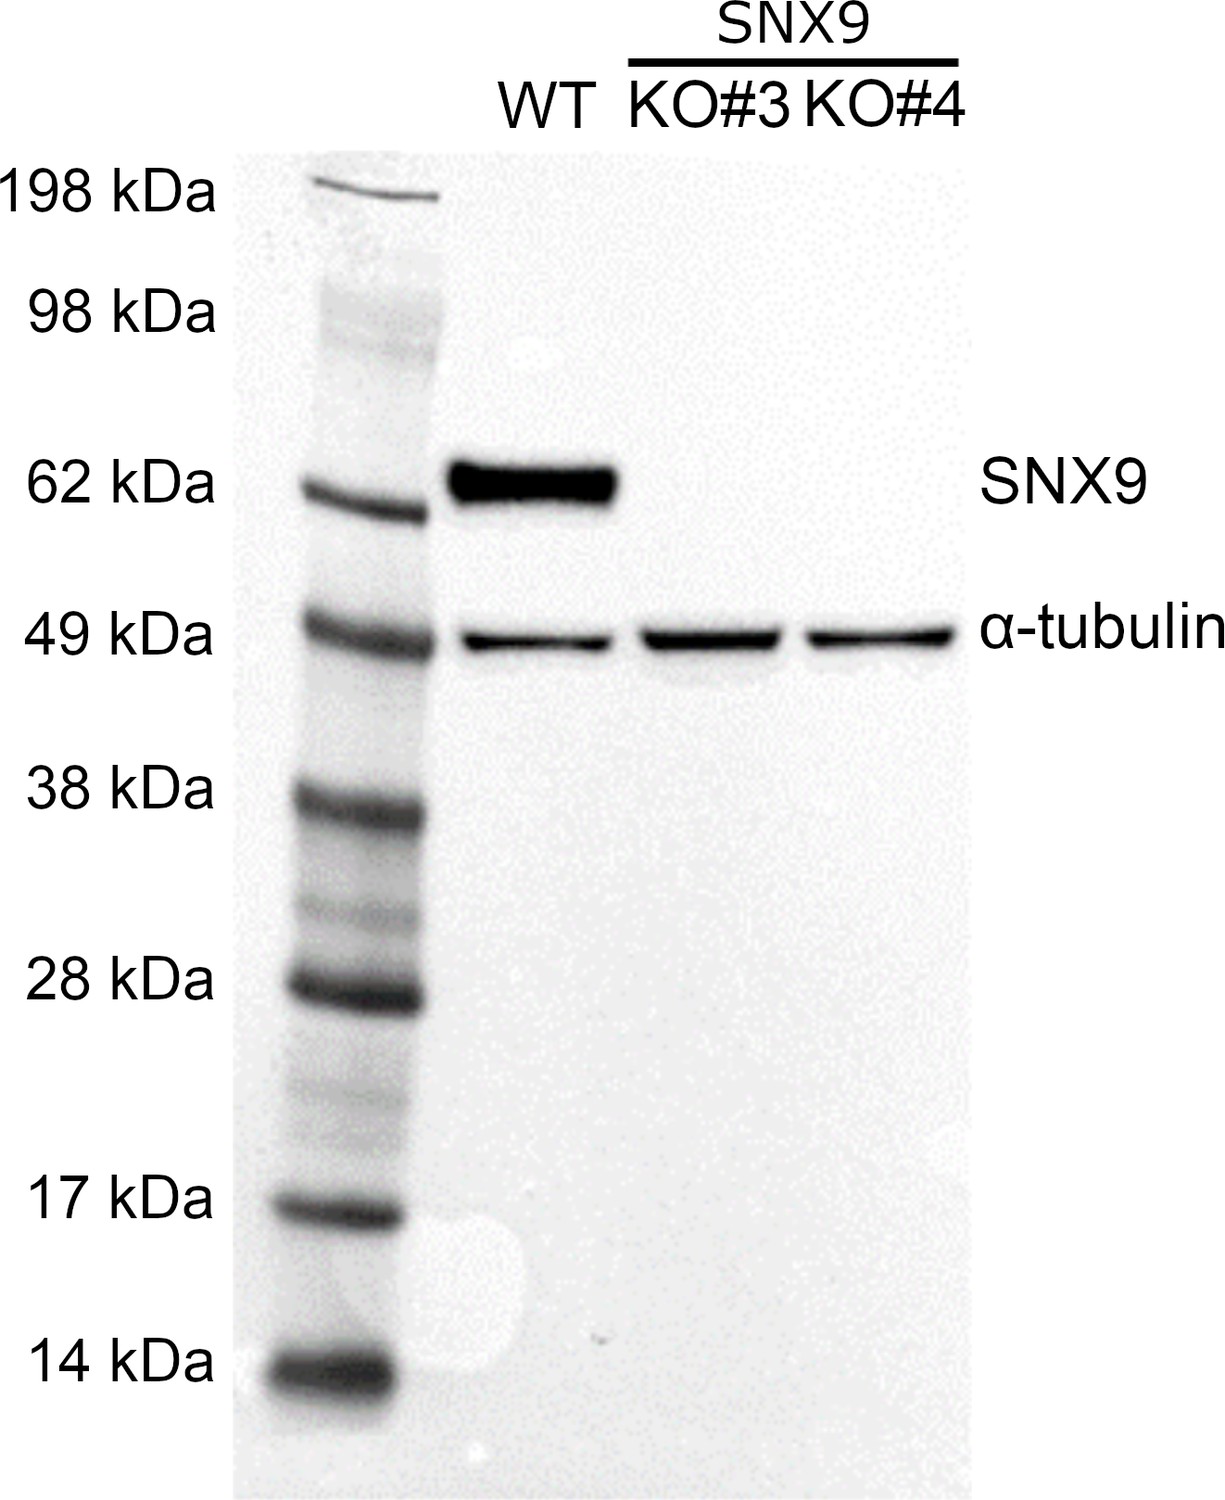
SNX9 expression in Jurkat WT and SNX9KO T cells.
Western blot probed with antibodies against SNX9 and α-tubulin (loading control) in WT Jurkat (first lane) and CRISPR/Cas9 gene edited Jurkat T cells with SNX9 knocked out (second SNX9KO#3 and third lane SNX9KO#4).
Figure 2—video 1
Representative live cell movie showing SNX9 recruitment to CD28 clusters during T cell activation.
WT Jurkat T cells expressing SNX9-mCherry (magenta) and CD28-EGFP (cyan), activated live on anti-CD3ε and anti-CD28 antibody-coated glass surfaces and imaged live in TIRF for 700 s with 100 ms intervals.
Figure 3 with 3 supplements

Dynamics and persistence of SNX9 within CD28 clusters.
(A) Schematic of photoactivation of fluorescent proteins at the plasma membrane of cover glass activated cells with the photoactivated protein diffusing either though the cell membrane or through protein-clusters localised at the plasma membrane. (B) Representative confocal time series of SNX9-PAmCherry repetitively photoactivated by 405 nm laser at the membrane region of interest (dashed line) in activated SNX9 KO#4 cells. (C) Mean fluorescence intensity profiles of SNX9-PAmCherry intensity within CD28-EGFP clusters (blue) or within the cytosol (magenta). Dashed line represents the timepoint from which the SNX9-PAmCherry intensity significantly diverges between cytosol and clusters (** = p < 0.01). Error bars = mean ± SEM = means of three independent experiments of 6–10 cells. (D) Schematic of whole cell photoactivation in TIRF. (E) Representative TIRF images of WT activated Jurkat T cells co-expressing CD28-EGFP and SNX9-PAmCherry photoactivated once for 6 s. (F) Fold change of mean fluorescent intensity profiles of SNX9-PAmCherry intensity within CD28-EGFP microclusters compared to the cytosol of three experiments (6–9 cells per experiment). n.s. = not significant. Scale bar = 5 µm.
Figure 3—figure supplement 1
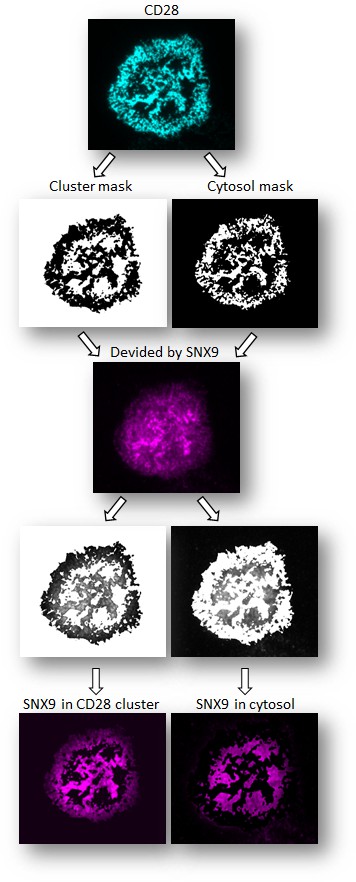
Example of custom-made FIJI quantification of cluster versus cytosol.
The GFP channel is thresholded to define GFP positive CD28 clusters and the cytosol (no GFP positive clusters) creating a cluster mask and cytosol mask, respectively. These masks are then divided by the SNX9-PAmCherry channel, creating an image of the PAmCherry signal within CD28-GFP-positive clusters or the cytosol, allowing measurement of SNX9 intensity in the clusters specifically. The mean pixel intensity within the cytosol and GFP-positive clusters is then quantified from the resulting images.
Figure 3—figure supplement 2
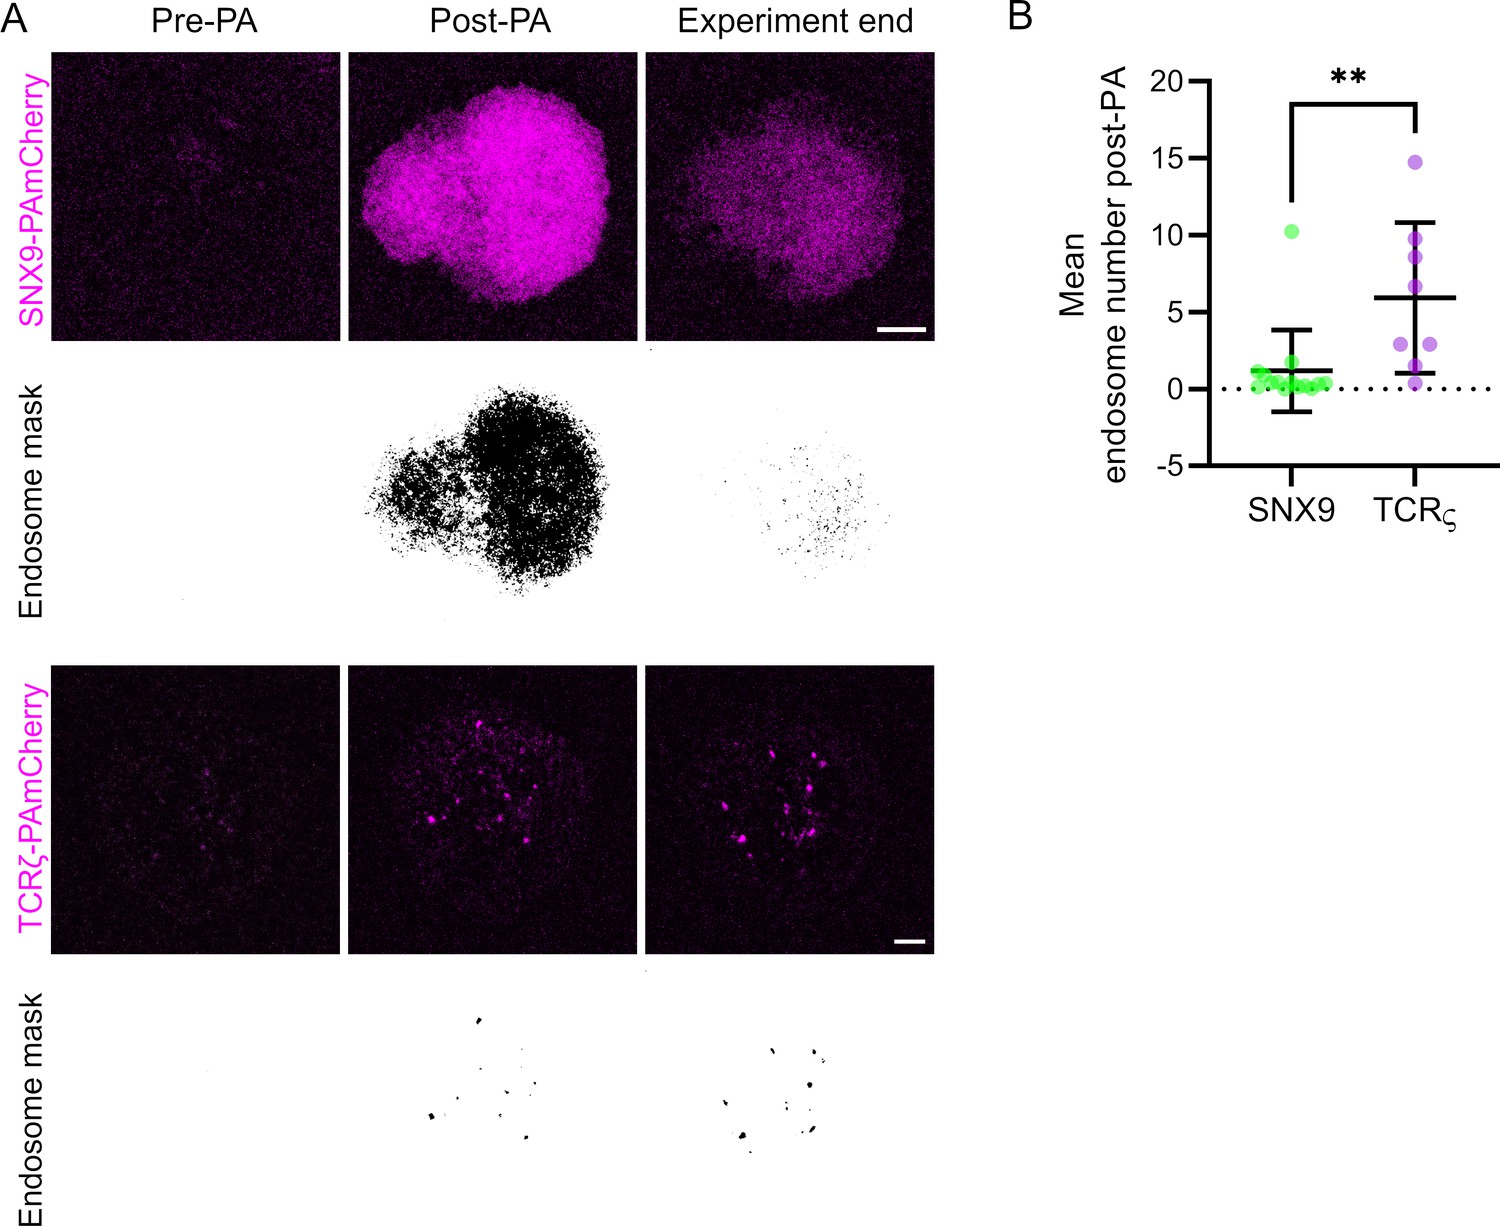
Quantification approach used to count the number of PAmCherrry-positive vesicles after photoactivation.
(A) Representative images of SNX9 and TCRζ-PAmCherry and the endosome masks generated from thresholded PAmCherry signal to identify endosomal structures. (B) Quantification of endosomal structures identified from SNX9 and TCRζ-PAmCherry signal following photoactivation on the cell periphery. Data points represent single cells. Error bars = mean ± SEM. Scale bar = 5 µm. ** = p < 0.01 from a Students T-test.
Figure 3—video 1
Representative movie showing the dynamic localisation of SNX9 in CD28 clusters.
Confocal time series of SNX9 KO#4 cells expressing CD28-EGFP and SNX9-PA-mCherry and repetitively photoactivated by 405 nm laser at the membrane region of interest (dashed line).
Figure 4 with 3 supplements
SNX9 defines tubules that are connected to CD28 clusters.
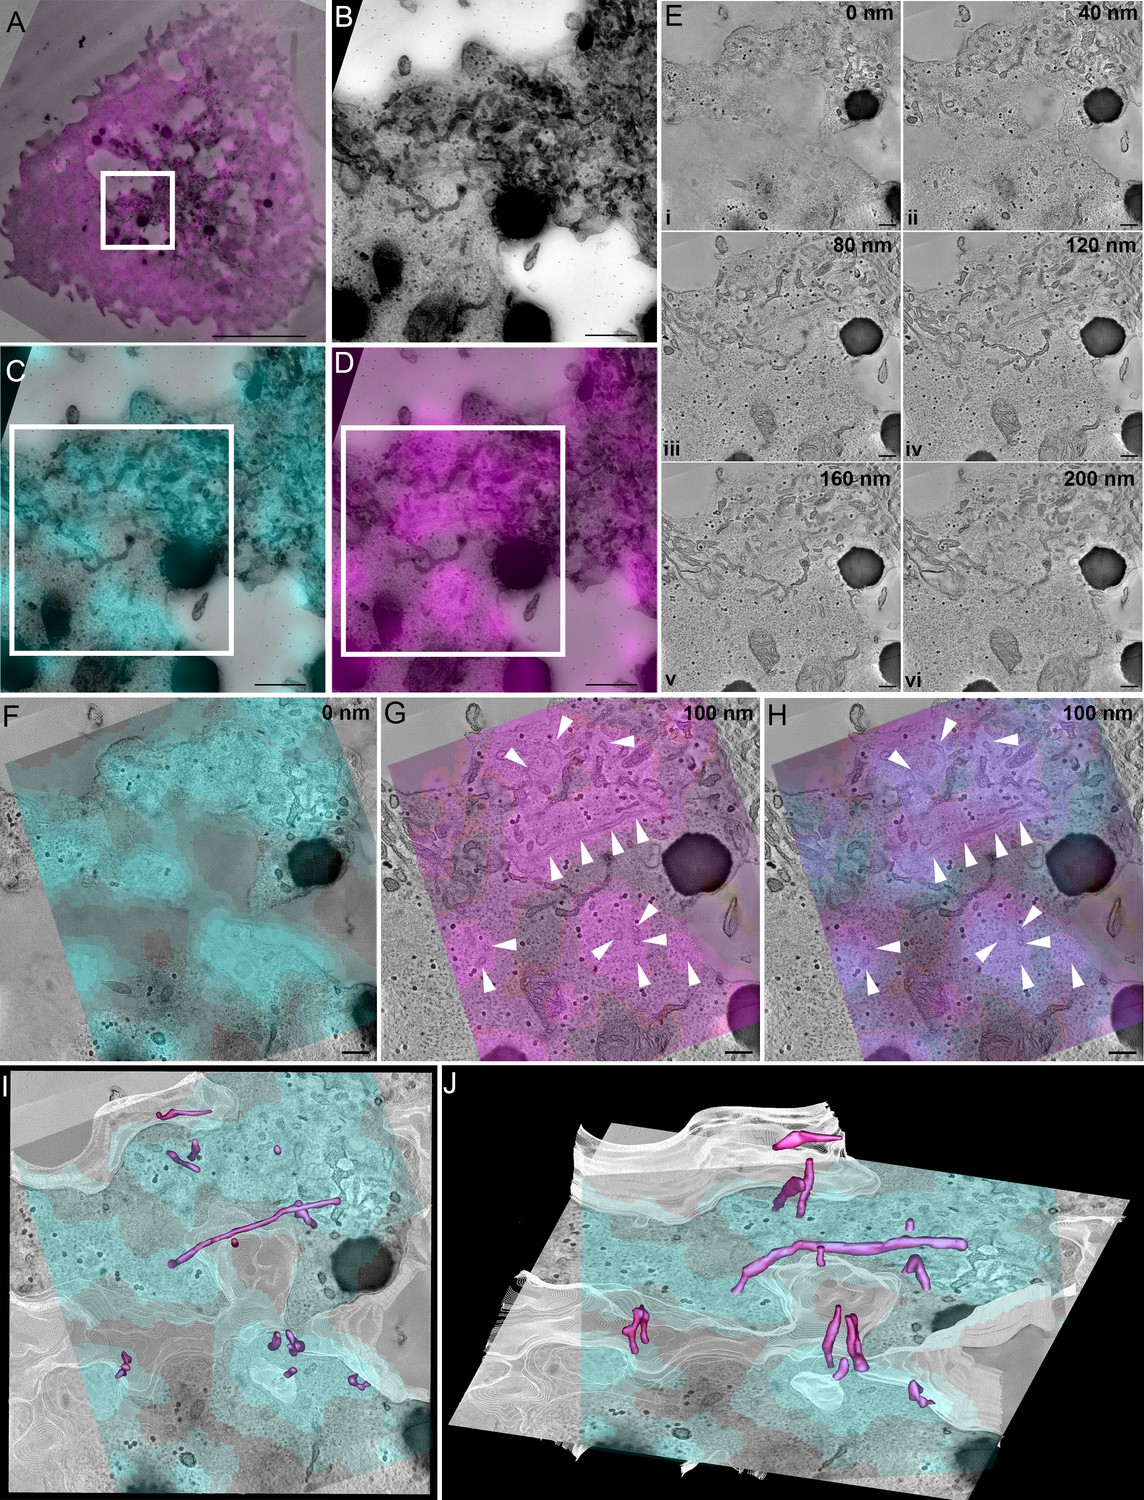
(A) Correlation of SNX9-mCherry transfected cell with the same cell re-registered by transmission electron microscopy. White box: region of interest positive for CD28-GFP and SNX9-mCherry. Scale 5 μm. (A) Region of interest from (A) identified from high magnification stitched transmission electron micrographs at ×10,000 magnification. White box = area of tomographic analysis. Scale 500 nm. (C) Overlay of CD28-EGFP with stitched electron micrograph. Scale 500 nm. (D) Overlay of SNX9-mCherry with stitched electron micrograph. Scale 500 nm. (E) Optical slices from a reconstructed tomogram of different z-depths demonstrating abundant tubules emerging from the plasma membrane. Scale 200 nm. (F) Overlay of CD28-EGFP signal at the cell-glass interface on the very base of the cell. Scale 200 nm. (G) Overlay of SNX9-mCherry signal with an electron tomographic slice deeper into the cell shows abundant tubulation (white arrowheads) at SNX9-mCherry-positive areas. Scale 200 nm. (H) Overlay of CD28 and SNX9 signal suggesting SNX9-tubules (white arrowheads) emerge from CD28-positive clusters. Scale 200 nm. (I, J) Rotated views of a segmented volume showing SNX9-positive tubules (magenta) directly connect with the immunological synapse/plasma membrane (white) at the CD28-positive clusters (cyan).
Figure 4—figure supplement 1
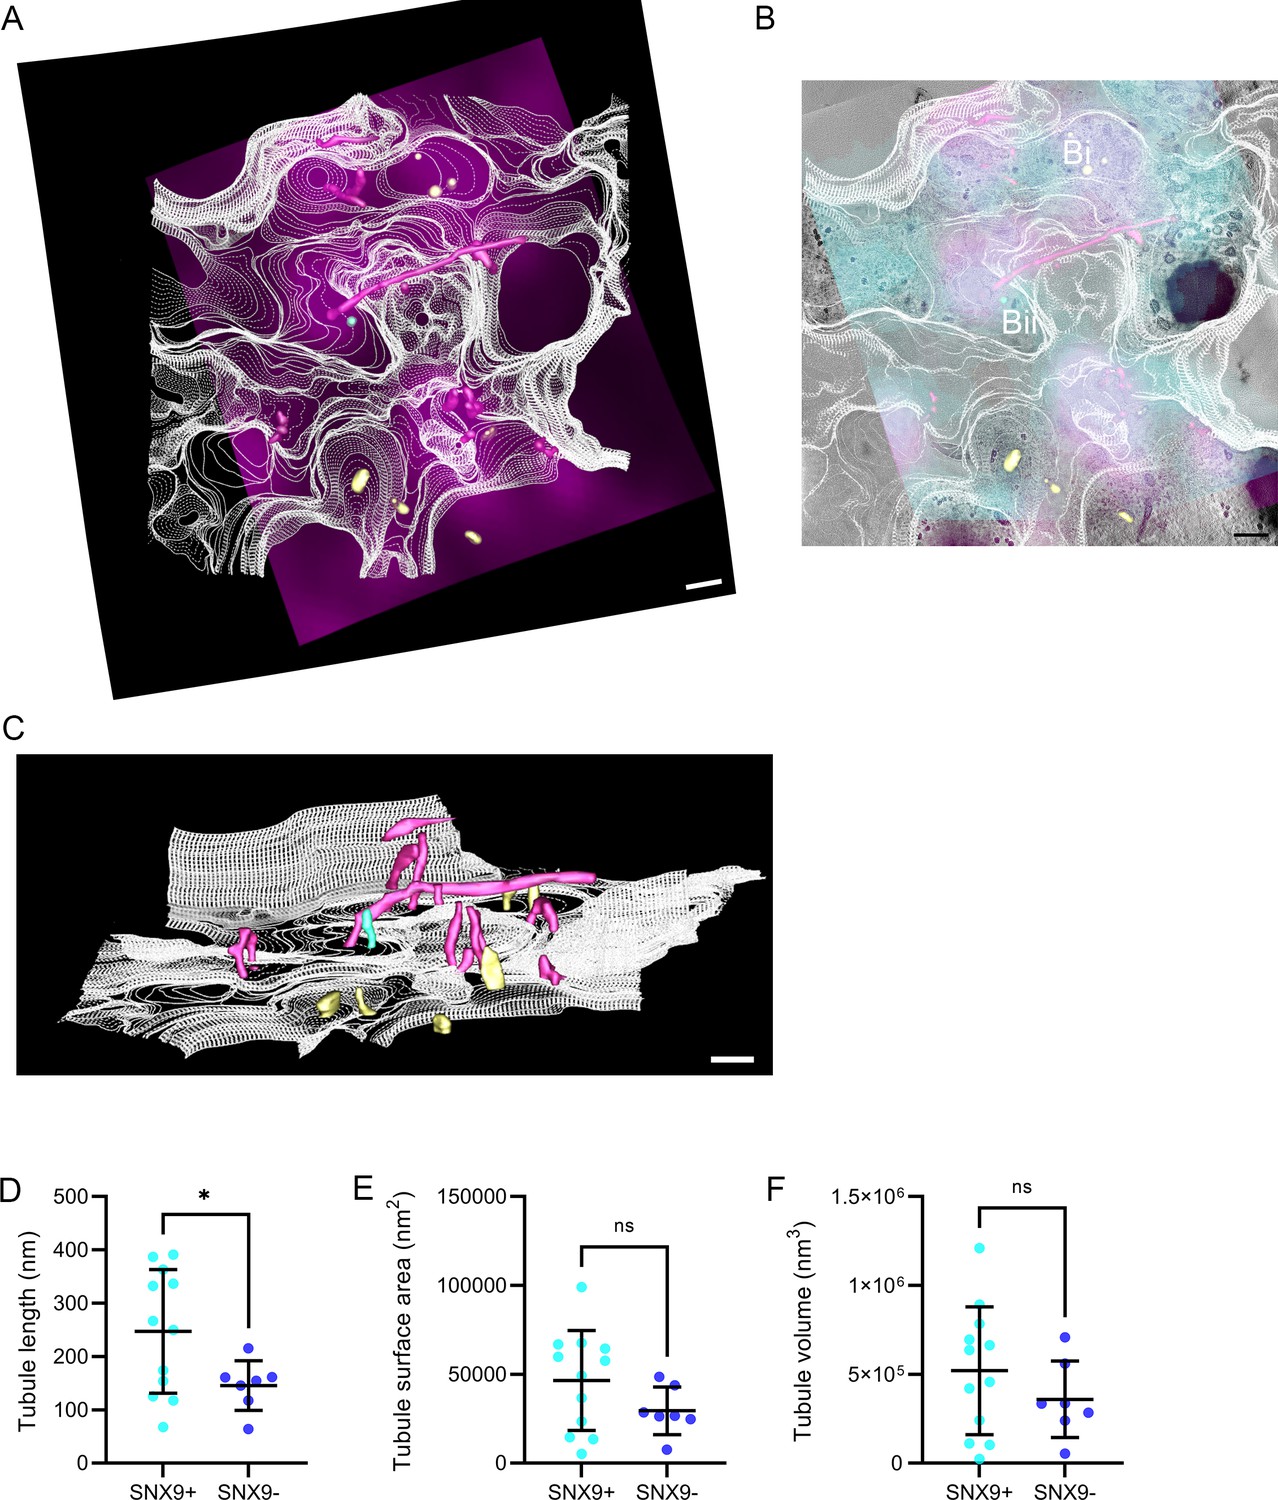
Identification and quantification of tubular structure in correlative electron tomography.
(A) Top-down rendering from electron tomography of cell plasma membrane (white contours), SNX9-positive tubules (purple rendering), SNX9-negative tubules or tubules with a density consistent with endoplasmic-reticulum tubules (yellow rendering), tubules with clathrin coats (cyan rendering) and Airyscan SNX9 signal (magenta). (B) Rendered tubules and membrane contour overlayed with electron tomography image (greyscale), CD28 Airyscan signal (cyan) and SNX9 Airyscan signal (magenta). Bi indicates tubules with density consistent with endoplasmic reticulum, Bii indicated clathrin-coated structure. (C) Side-on rendering from electron tomography as in (A) to highlight the depth and length of tubules. (D) Quantification of IMOD rendered SNX9-positive (purple tubules) and SNX9-negative/endoplasmic reticulum tubules (yellow) tubule length. (E) Quantification of SNX9-positive and SNX9-negative tubule surface area. (F) Quantification of SNX9-positive and SNX9-negative tubule volume. Data points represent individual tubules. Error bars represent mean ± SEM. n.s. = not significant, * = p < 0.05 from a Mann-Whitney U-test. One outlier was removed after identification using GraphPad PRISM Identify Outliers ROUT method with Q = 1%. Scale bars = 200 nm.
Figure 4—video 1
Confocal slices of the WT Jurkat cell expressing CD28-EGFP and SNX9-mCherry used to overlaid on the EM pictures.
Figure 4—video 2
Optical slices from a reconstructed tomogram of different z-depths demonstrating abundant tubules emerging from the plasma membrane.
Figure 5 with 4 supplements
SNX9 promotes CD28 cluster stability.
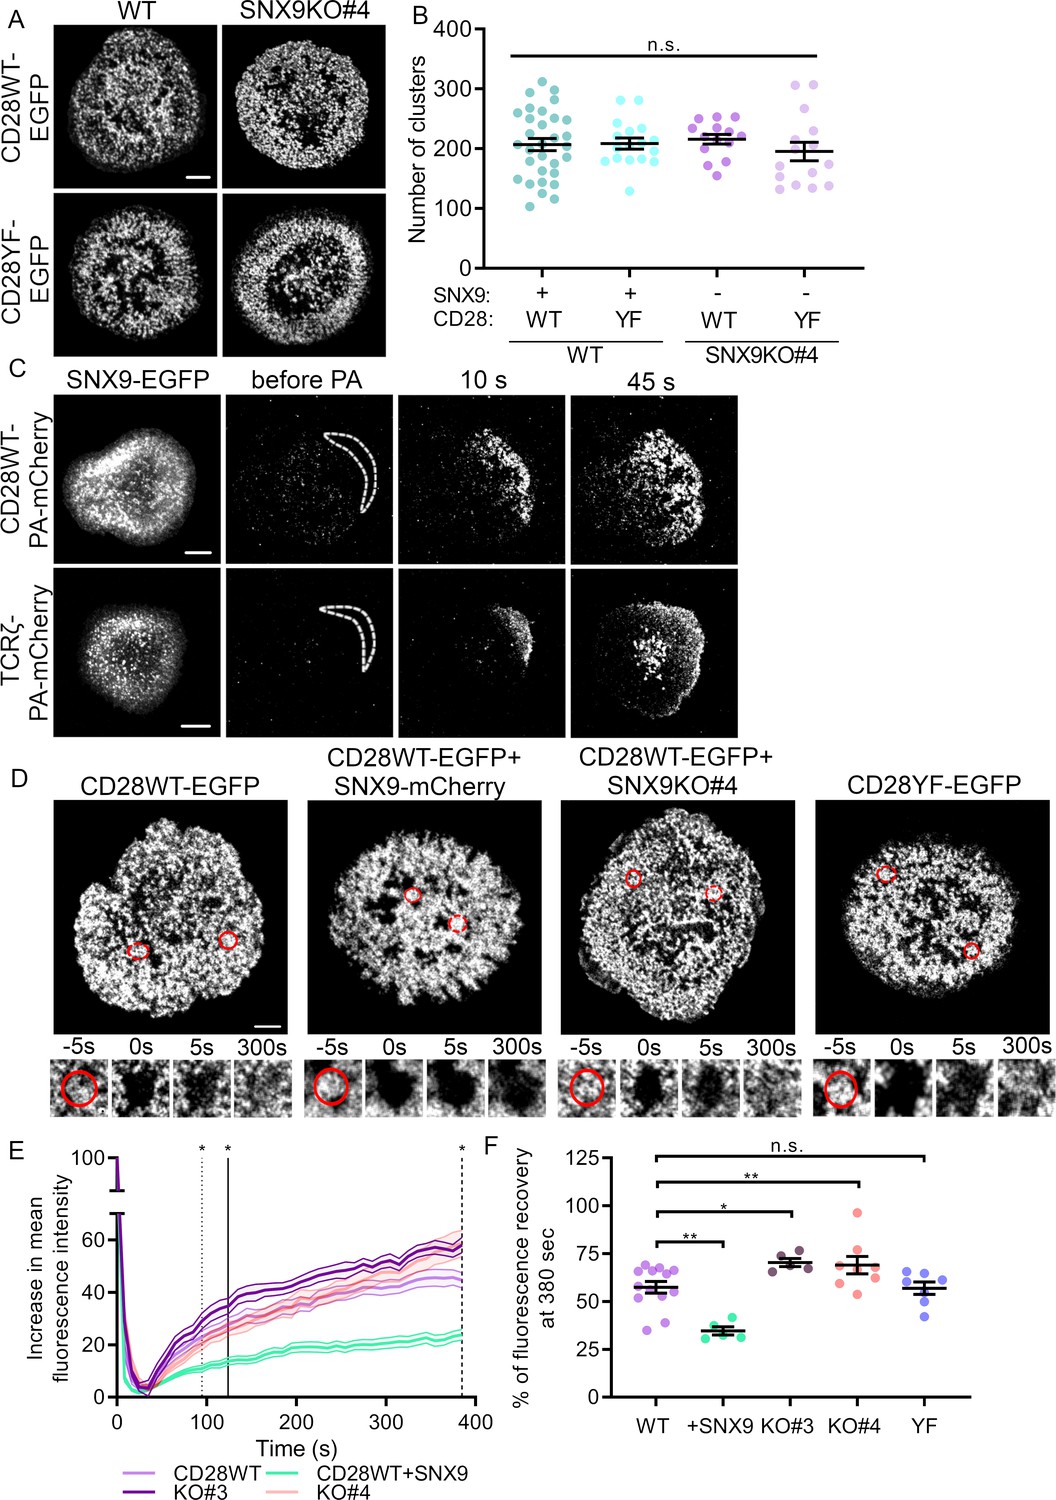
(A) Representative live images of activated WT Jurkat (left) and SNX9 KO#4 (right) T cells expressing CD28WT-EGFP or CD28YF-EGFP with or without SNX9WT-mCherry. (B) Number of CD28WT/YF-EGFP positive structures in Jurkat SNX9 KO T cells with or without SNX9WT-mCherry expression. Dots represent individual cells (15-28) of three to five independent experiments (C) Representative images at indicated time points of activated WT Jurkat T cells expressing SNX9-EGFP and CD28WT-PAmCherry (top panel) or TCRζ-PAmCherry (bottom panel) photoactivated within the dashed regions. Images representative of three and four independent experiments including three to seven cells each. (D) Representative images of activated WT and SNX9 KO#4 Jurkat T cells expressing CD28WT or YF-EGFP with or without SNX9-mCherry and photobleached in the region of interest (red circle). Red discontinuous circles represent non-beached control regions. (E) Increase in mean fluorescence intensity over time of bleached regions shown in (D). (F) Mean fluorescence intensity at t = 380 s from (E). Lines = time point of significant divergence (p < 0.05) from CD28WT (dotted:+ SNX9; solid: KO#3; dashed: KO#4). Data from 5 to 13 independent experiments involving three to six cells each. Dots on chart indicate independent experiments. Error bars indicate mean ± SEM. n.s. = not significant, * = p < 0.05, ** = p < 0.01 from Student’s T-test of mean of independent experiments. Scale bar = 5 µm.
Figure 5—figure supplement 1
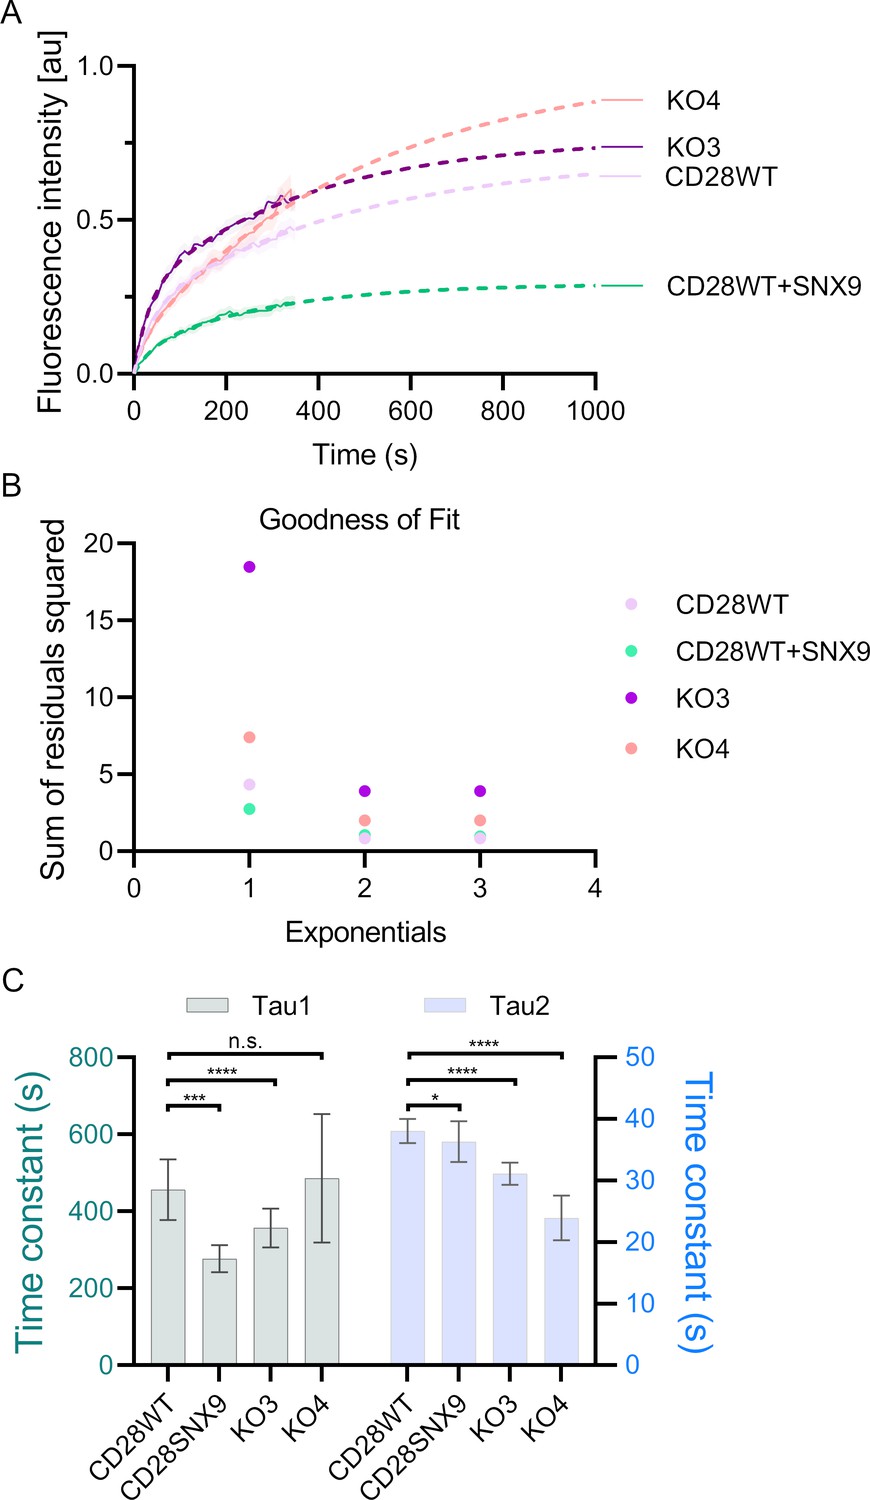
Fitting of the Fluorescence recovery after photobleaching (FRAP) curves for CD28 in WT, SNX9KO and SNX9 overexpressing Jurkat T cells.
(A) Normalised FRAP curves fitted with a bi-exponential decay model. (B) Goodness-of-fit of the mono-, bi-, or triple-exponential decay model evaluated by the sum of the weighted summed square of residuals (SSR). (C) Kinetic constants tau1 and tau2 of the FRAP curves fitted using a bi-exponential decay.
Figure 5—figure supplement 2
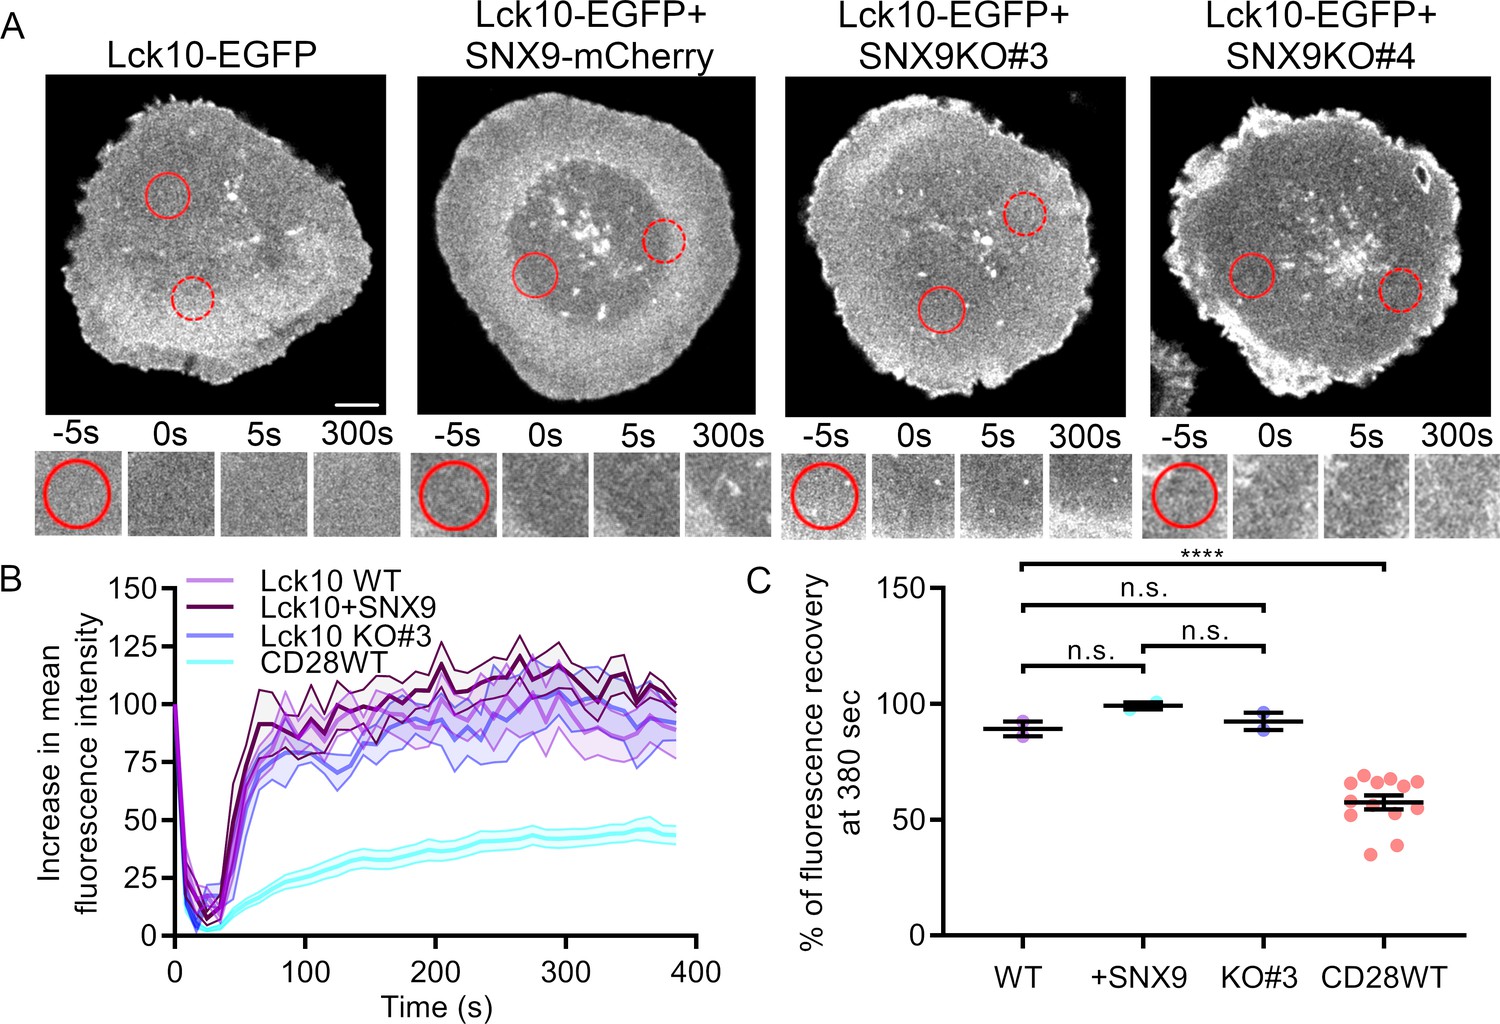
SNX9 has no impact on the recovery of Lck fluorescence intensity after FRAP.
(A) Confocal images of WT and SNX9KO Jurkat T cells expressing Lck10WT-EGFP and SNX9-mCherry, or only Lck10-EGFP, activated on anti-CD3ε and anti-CD28-coated glass surfaces. Photobleaching of the region of interest (red continuous circle) was archived using 800 nm light from a two-photon laser. Regions of interest were bleached after one frame for five consecutive frames for 5 s each and then imaged in 10-s intervals for 384 s. Red discontinuous circles represent a measured control region that wasn’t bleached and used to normalise for bleaching while imaging. (B) Increase in mean fluorescence intensity over time of bleached Lck10WT-EGFP regions in WT and SNX9KO Jurkat T cells as in A. (C) Mean fluorescence intensity profiles at t = 380 s from B. Error bars indicate mean ± SEM. n.s. = not significant, **** = p < 0.0001 from Student’s T-test of means of five to eight independent experiments. Scale bar = 5 µm.
Figure 5—video 1
Representative movie showing the diffusion of CD28 through clusters (identified by SNX9-mCherry).
Top: WT Jurkat T cells expressing CD28-PA-mCherry (magenta) and SNX9-EGFP (cyan). Bottom: TCRζ-PA-mCherry (magenta) and SNX9-EGFP (cyan). Cells were activated on antiCD3 and anti-CD28 coated surfaces, repetitively photoactivated three consecutive times on a region of interest and subsequently imaged for 250 s with a 2.5-s interval.
Figure 5—video 2
Representative movie showing two-photon FRAP of CD28-EGFP clusters.
WT Jurkat T cells expressing CD28WT co-expressing SNX9-mCherryor not and SNX9KO#4T cells expressing CD28WT-EGFP. Cells were activated on antiCD3 and anti-CD28-coated surfaces and the region of interest (white discontinuous circle in zoomed regions) was photobleached using 800 nm light from a two-photon laser for five consecutive times, 5 s each and then imaged in 10 s intervals for 384 s.
Figure 6 with 2 supplements
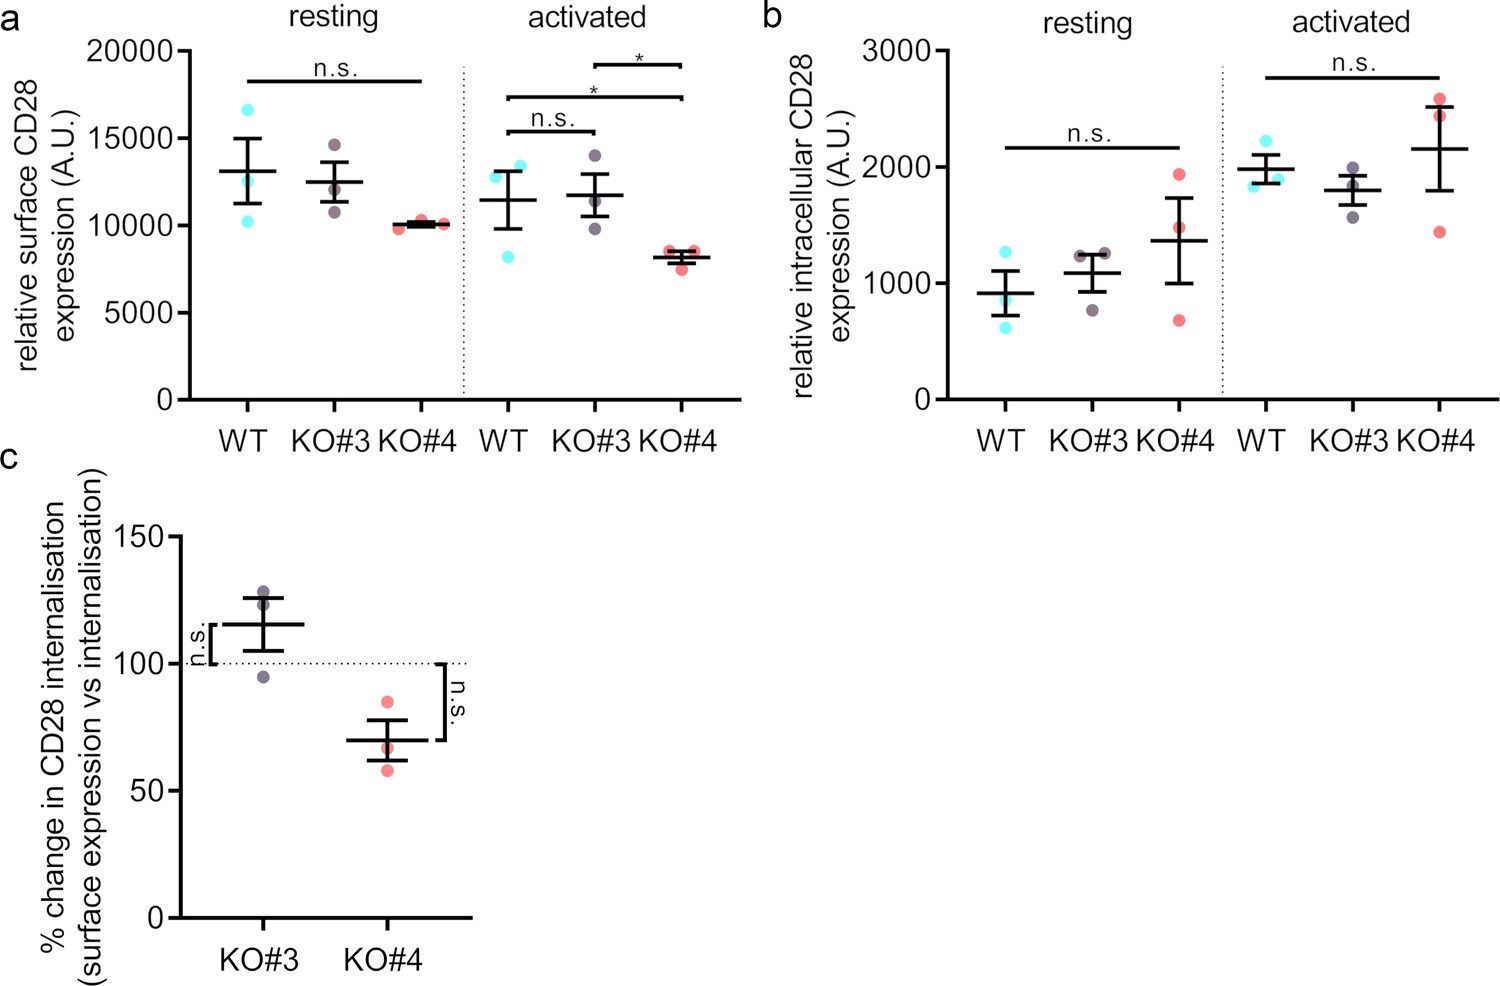
Surface levels and endocytosis of CD28 upon SNX9 knock-out.
(A) Mean fluorescence intensity of resting and activated (20 min) WT Jurkat and SNX9KO#3 and SNX9KO#4T cells incubated with an antibody against CD28 (CD28-FITC). (B) Mean fluorescence intensity of resting and activated Jurkat WT and SNX9KO#3 and SNX9KO#4T cells stained with an antibody against CD28 (CD28-FITC) and allowed to internalise CD28 complexes before removing any surface bound antibody. Error bars indicate mean ± SEM. n.s. = not significant, * = p < 0.05 from Student’s T-test of means of three independent experiments. (C) Ratio of internalised by surface expression of CD28 normalised to WT (100%). Data obtained from three independent experiments, with at least two replicates per experiment. Error bars indicate mean ± SEM. n.s. = not significant, * = p < 0.05, from a one sample T-test comparing values to the normalised WT mean of 100%. SNX9 specifically contributes to CD28-mediated signalling.
Figure 6—figure supplement 1
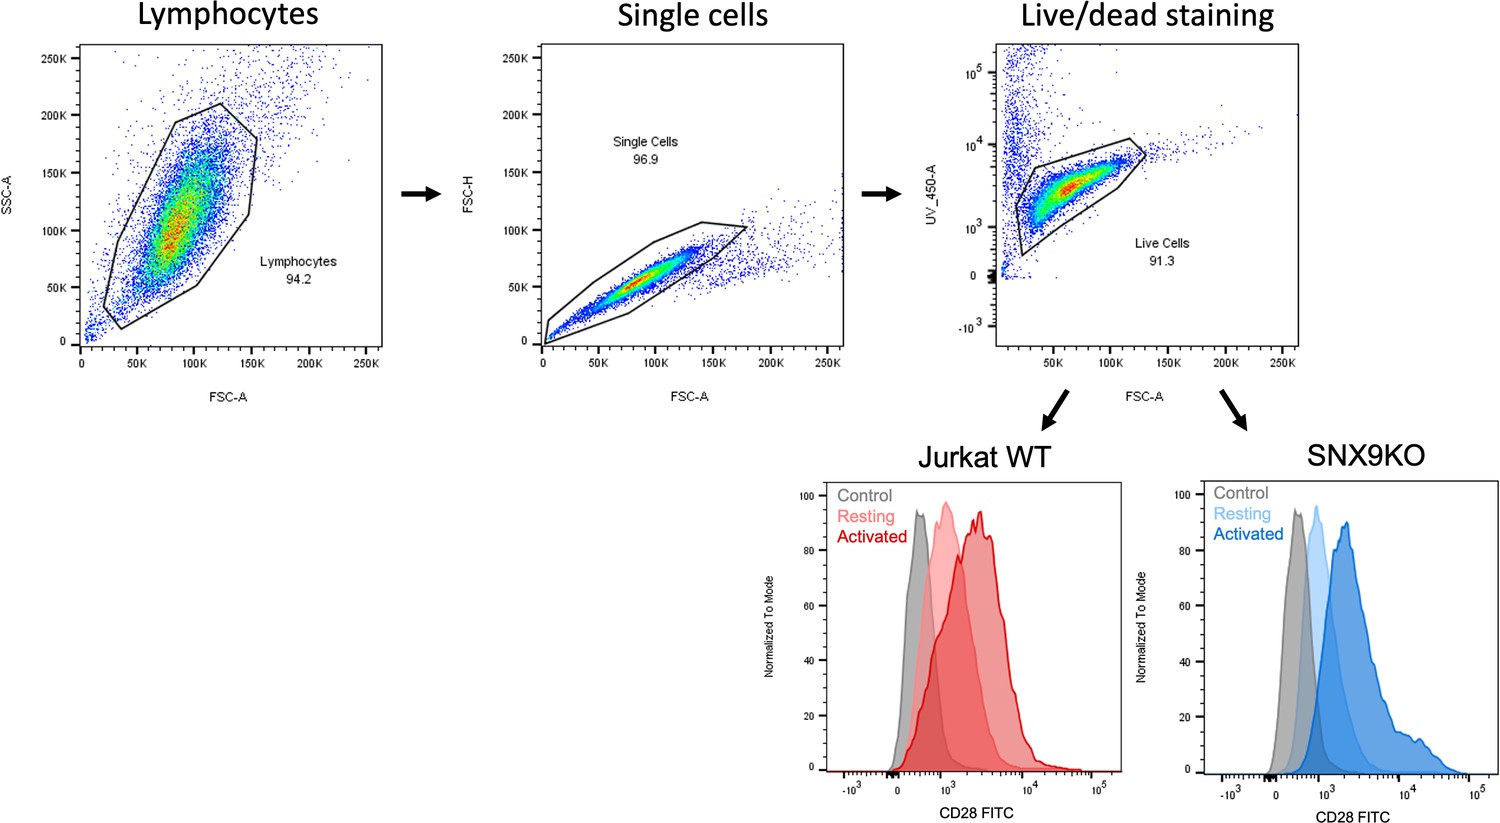
Flow cytometry gating strategy.
(A) FSC and SSC dot plots were used to identify live T Lymphocytes, doublets were eliminated by using a pulse geometry gate with FSC-H and FSC-A. Jurkat T cell viability was further assessed by incubation with DAPI. (B) Geometric Mean Fluorescent Intensity of 488 nm was determined to quantify intracellular CD28 upon T cell activation by labelling with a directly conjugated CD28-FITC antibody which was allowed to be internalised at 37°C after T cell activation. Surface labelling was removed by acid wash.
Figure 6—figure supplement 2
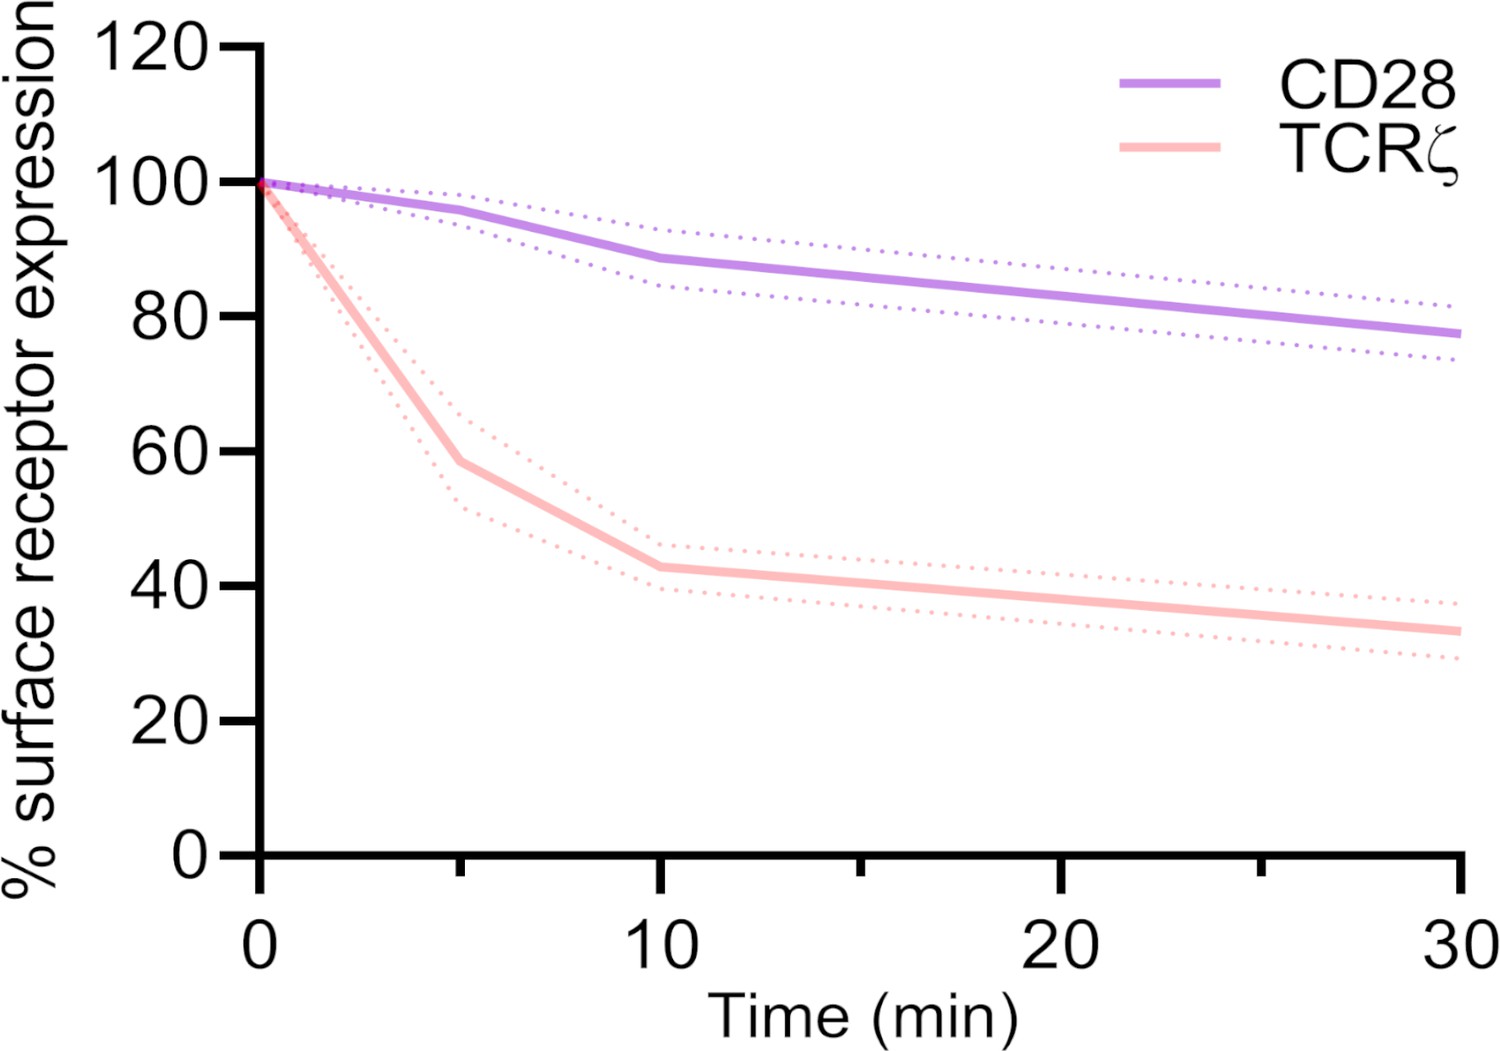
CD28 receptor internalisation very low compared to TCR.
Remaining CD28 and TCR at the surface of WT Jurkat T cells upon activation with soluble anti-CD3ε and anti-CD28. Surface TCR (CD3 ε) and CD28 were labelled at t = 0 min with biotinylated antibodies (anti-CD3 ε -biotin+ anti-CD28 for TCR labelling or anti-CD3e + anti-CD28-biotin for CD28 labelling). After activation for indicated times at 37°C, remaining labelled surface TCR or CD28 was detected with streptavidin-Pacific Blue.
Figure 7

SNX9 specifically contributes to CD28-mediated signalling.
(A) Phosphorylation of CD28 and (C) TCRζ in activated WT Jurkat and SNX9KO T cells detected by phospho-specific antibodies in flow cytometry. (B) Normalised (WT = 100%) percentage of pCD28 and (D) pTCRζ in SNX9KO cells compared to WT Jurkat T cells. Dots represent independent experiments (3-4) involving 50’000 cells. Error bars indicate mean ± SEM. n.s. = not significant, * = p < 0.05, from a one sample T-test. (E) Representative immunofluorescence images of resting and activated WT and SNX9KO Jurkat T cells stained with an antibody against NFAT. (F) Integrated NFAT fluorescence intensity over the Hoechst-stained nucleus in WT and SNX9 KO Jurkat T cells activated or not with anti-CD3ε and CD28 antibodies. Dots represent individual fields of view including 22–30 cells each from six independent experiments. Error bars = mean ± SEM. ** = p < 0.001, *** = p < 0.001 from Student’s T-test of means of field of views. Scale bar = 20 µm (G) WT Jurkat and SNX9KO T-cells were conjugated with SEE pulsed (activated+) or non-pulsed (resting-) Raji B cells and incubated together for 16 hr in a 96-well plate to allow for IL-2 secretion. The supernatant was collected, and the amount of IL-2 present was determined by ELISA. Error bars = mean ± SEM. * = p < 0.05, from Student’s T-test of means of 3–6 independent experiments involving 5 × 10⁵ cells of each type.
Author response image 1
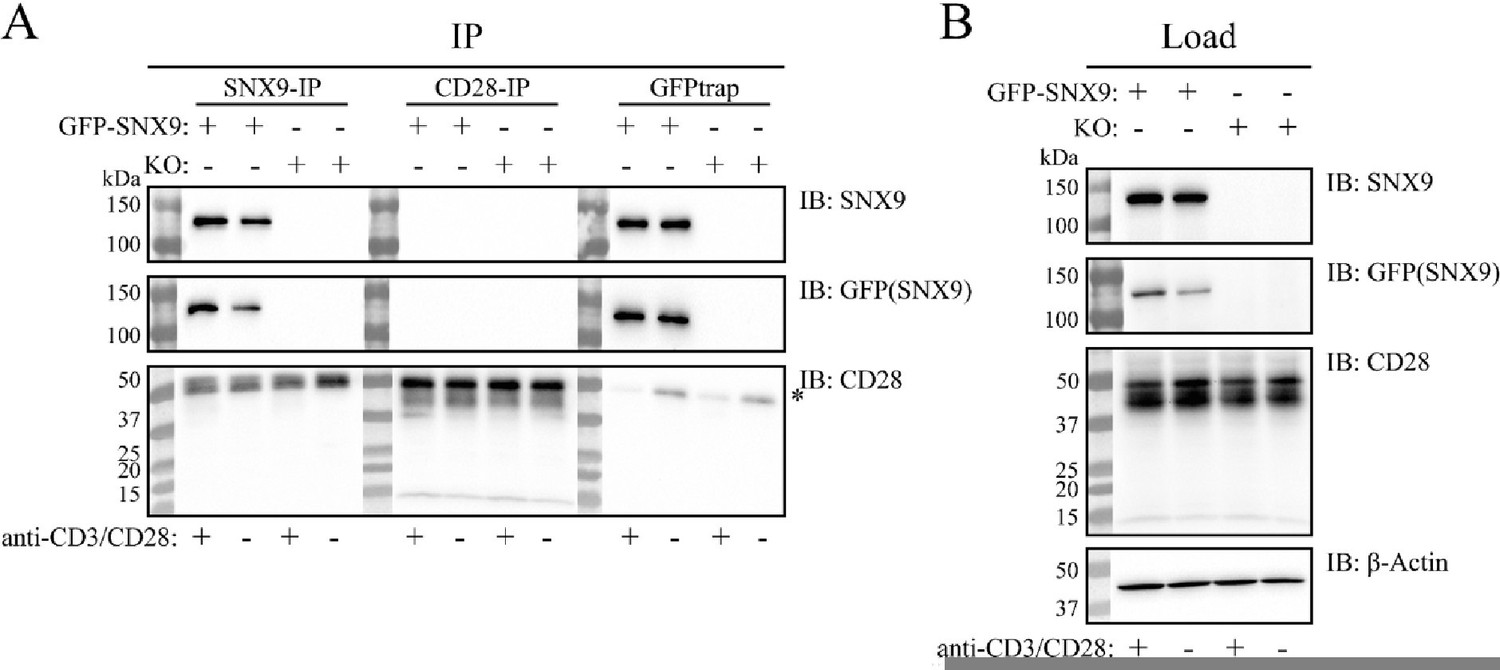
Co-immunoprecipitation (Co-IP) analysis of the interaction between SNX9 and CD28.
SNX9knock-out Jurkat T cells were retrovirally reconstituted to stably express GFP-SNX9. The Jurkat T cells were activated or not for 20-30 min with anti-CD3ε (OKT3) and anti-CD28 (CD28.2) antibodies bound onto dished additionally coated with PLL (Σ Aldrich) and human fibronectin (in-house). After lysis, cell lysates were subjected to Co-IP and WB analysis. (A) CD28 and GFP-SNX9 were immunoprecipitated using anti-CD28 (D2Z4E; Cell Signaling Technology), anti-SNX9 (EPR14399; Abcam) and GFPtrap (Chromotek), blotted onto nitrocellulose, and detected using the same antibodies (CD28 and SNX9) and anti-GFP (E385; Abcam) antibodies. When GFP-SNX9 was immunoprecipitated with either SNX9 or GFP antibodies, no CD28 coimmunoprecipitated (bottom blot, left and right panel). The same was observed when CD28 was immunoprecipitated, where no GFP-SNX9 co-immunoprecipitated (top and middle blot, middle panels). We did not observe an effect on the immunoprecipitation of CD28 and GFP-SNX9 by activation of the Jurkat T cells. The star (*) denotes heavy chains from the antibodies used for the Co-IP. (B) Load samples were analysed by WB to ensure proper expression of the target proteins. GFP-SNX9 was detected only in reconstituted cells (top blots). CD28 was detected in all samples (middle blot). Equal loading confirmed by anti-βActin antibodies (AC-15; Abcam). One representative experiment of three experiments with the same results is shown.
Additional files
Download links
A two-part list of links to download the article, or parts of the article, in various formats.
Downloads (link to download the article as PDF)
Open citations (links to open the citations from this article in various online reference manager services)
Cite this article (links to download the citations from this article in formats compatible with various reference manager tools)
SNX9-induced membrane tubulation regulates CD28 cluster stability and signalling
eLife 11:e67550.
https://doi.org/10.7554/eLife.67550


