CTP promotes efficient ParB-dependent DNA condensation by facilitating one-dimensional diffusion from parS
- Department of Macromolecular Structures, Centro Nacional de Biotecnología, Consejo Superior de Investigaciones Científicas, Spain
- DNA:Protein Interactions Unit, School of Biochemistry, Biomedical Sciences Building, University of Bristol, University Walk, United Kingdom
Figures
Figure 1 with 4 supplements

Direct visualization of ParB specific binding to parS sites.
(A) Domains and functional motifs of ParB as reported previously (Bartosik et al., 2004; Kusiak et al., 2011). Mutations R80A, defective for cytidine triphosphate (CTP) binding, and R149G, defective for parS binding, are indicated. (B) ParB dimer cartoon showing dimerization through the central and C-terminal domains. The nucleotide binding site at the N-terminal domain (NTD) is also indicated. (C) Schematic representation of the single-length 39× parS DNA used for C-trap experiments. The DNA contains 39 parS sequences distributed in six groups forming two clusters separated by 1905 bp (39× parS DNA). The positions of the parS sites in the DNA cartoon are represented to scale. (D) Schematic of the C-trap experiment where single and tandem (double-length) tethers are immobilized between two beads and scanned with a confocal microscope using 488 nm illumination (upper part). Representative confocal images of the experiment under no CTP, 2 mM CTP, or 2 mM CTPγS conditions (lower part) and 20 nM ParB2AF488. Dark to bright regions correspond to a scale of 0–30 photon counts for single-length tethers and 0–50 counts for tandem tethers. (E) Representative profiles (500 nm width) of the fluorescence intensity along the DNA axis of the confocal images depicted in D (only single-length tether data). Positions of the parS sequences are included to scale in the background. Brighter regions between the beads correlate with the position of the parS clusters. ParB proteins are also observed outside the parS region (red arrow) and in general the fluorescence intensity outside the parS region is always above the background and larger in CTPγS compared to CTP experiments. (F) Quantification of fluorescence intensity at the parS-containing region under no CTP, CTP, and CTPγS conditions.
-
Figure 1—source data 1
Source data file for Figure 1.
- https://cdn.elifesciences.org/articles/67554/elife-67554-fig1-data1-v2.xlsx
Figure 1—figure supplement 1
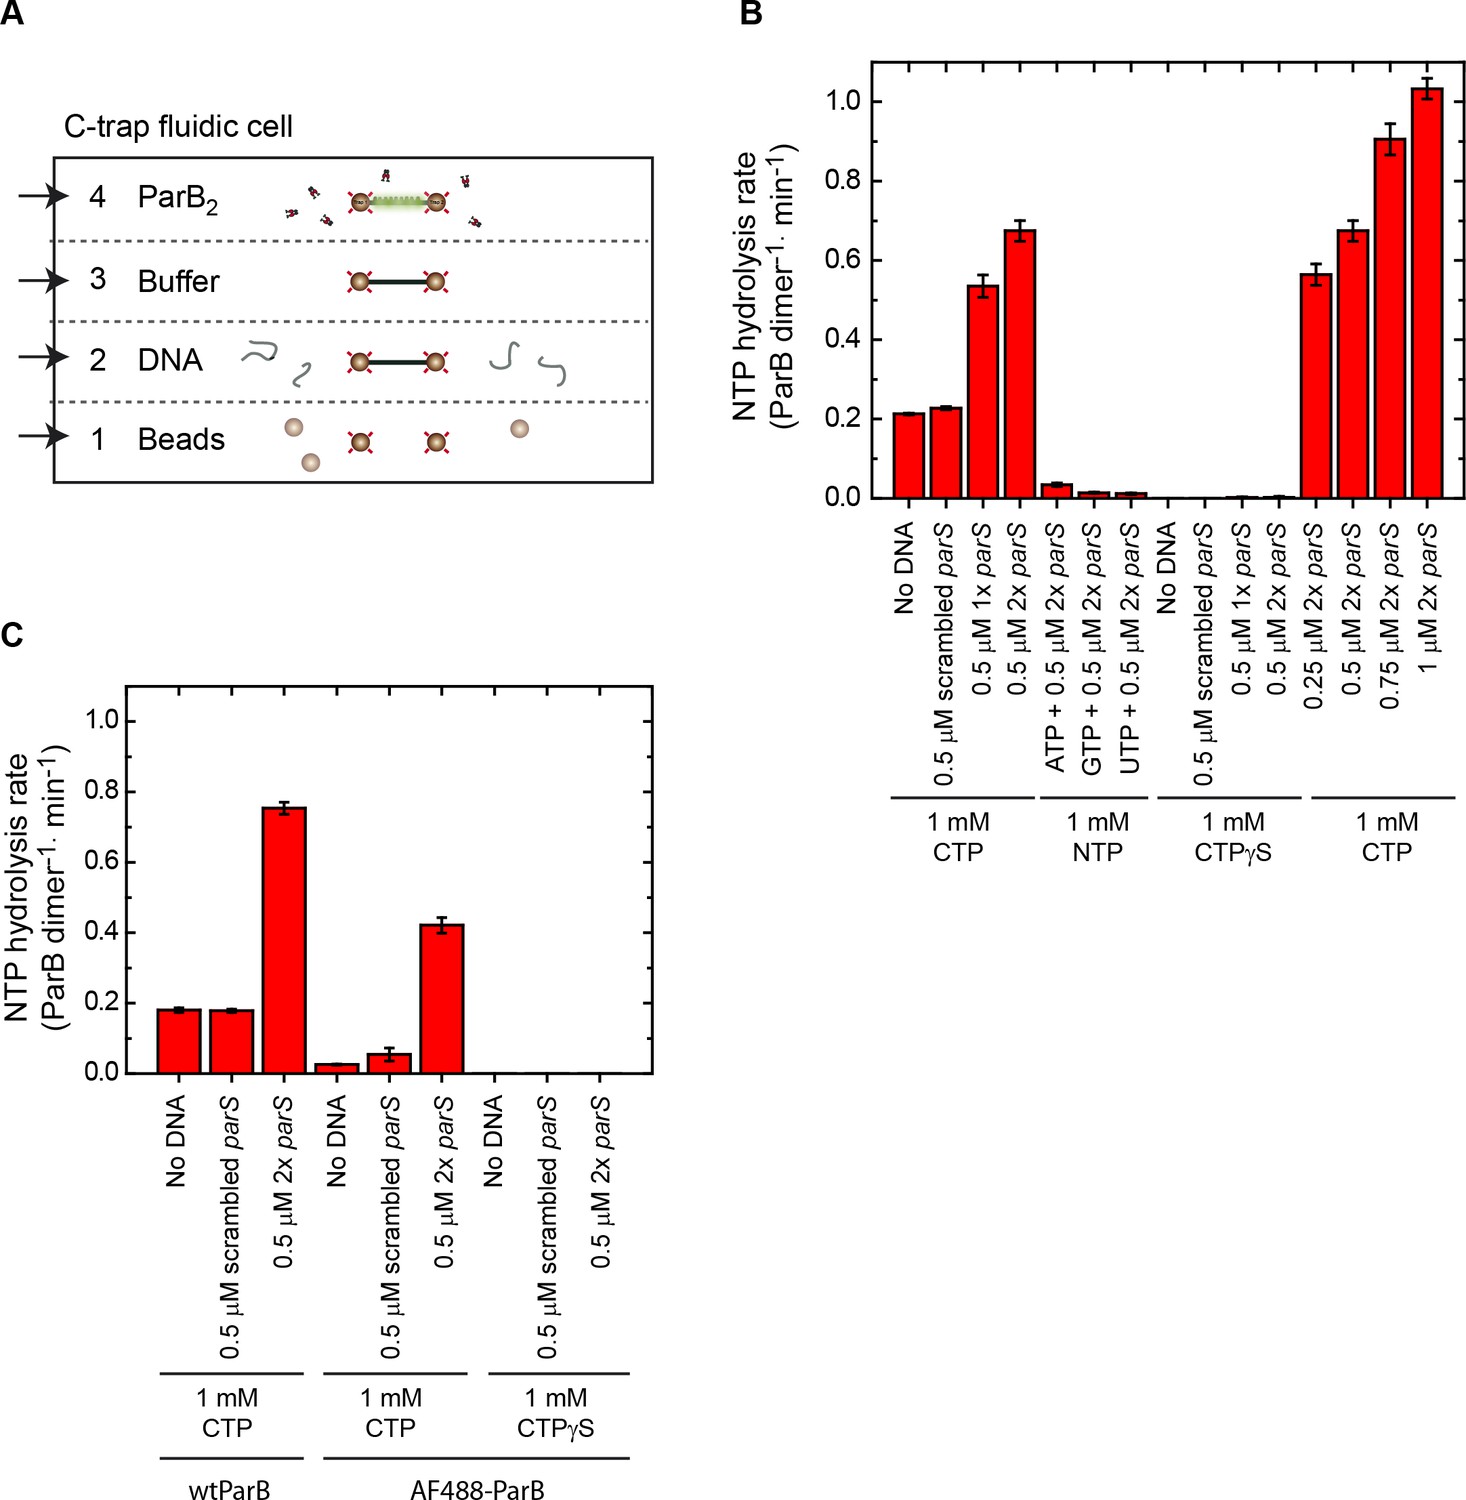
C-trap layout and nucleotide triphosphate (NTP) hydrolysis experiments.
(A) Cartoon of the fluid chamber employed for the experiments performed in this work. We used four laminar flows, containing streptavidin-coated beads, biotinylated DNA, buffer, or fluorescently labelled proteins. Confocal images and kymographs were obtained in channel 4 after a 2 min protein incubation. (B) NTP hydrolysis by wild-type ParB was measured using a colorimetric assay. Mean values are shown from four repeat experiments alongside the standard error of the mean. ParB hydrolyses cytidine triphosphate (CTP) in the absence of DNA at ~0.2 CTP molecules per dimer, per minute. CTP hydrolysis increases three- to four-fold in the presence of parS DNA. Nucleotides ATP, CTPγS, GTP, or UTP cannot be hydrolysed by ParB. The CTP hydrolysis rate increases linearly with the concentration of parS sequences. (C) NTP hydrolysis by wild-type ParB or ParBAF488 was measured in the absence or presence of DNA. Mean values are shown from two repeat experiments alongside the standard error of the mean. ParBAF488 retains parS-stimulated CTPase activity within two-fold levels of wild-type protein, which is likely attributable to inactivation of a fraction of the protein by the long labelling procedure.
-
Figure 1—figure supplement 1—source data 1
Source data file for Figure 1—figure supplement 1.
- https://cdn.elifesciences.org/articles/67554/elife-67554-fig1-figsupp1-data1-v2.xlsx
Figure 1—figure supplement 2
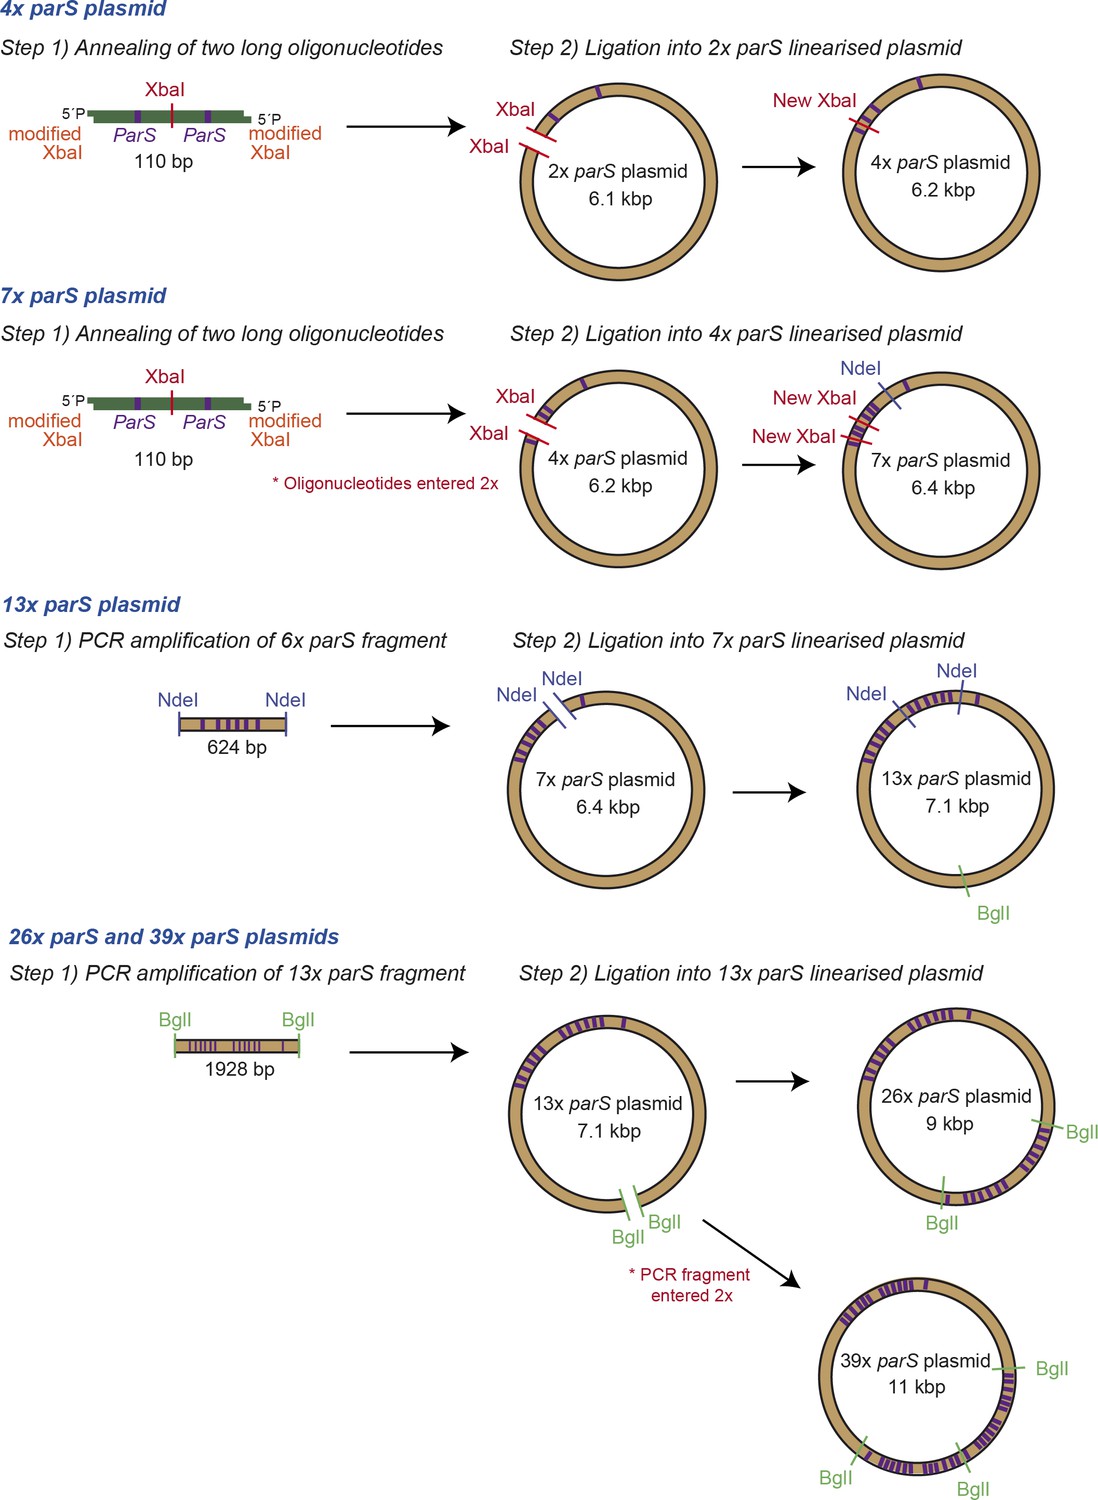
Fabrication of small DNA plasmids.
Schematic representation of the steps followed to fabricate DNA plasmids containing multiple copies of parS which were used to prepare the magnetic tweezers DNA substrates.
Figure 1—figure supplement 3
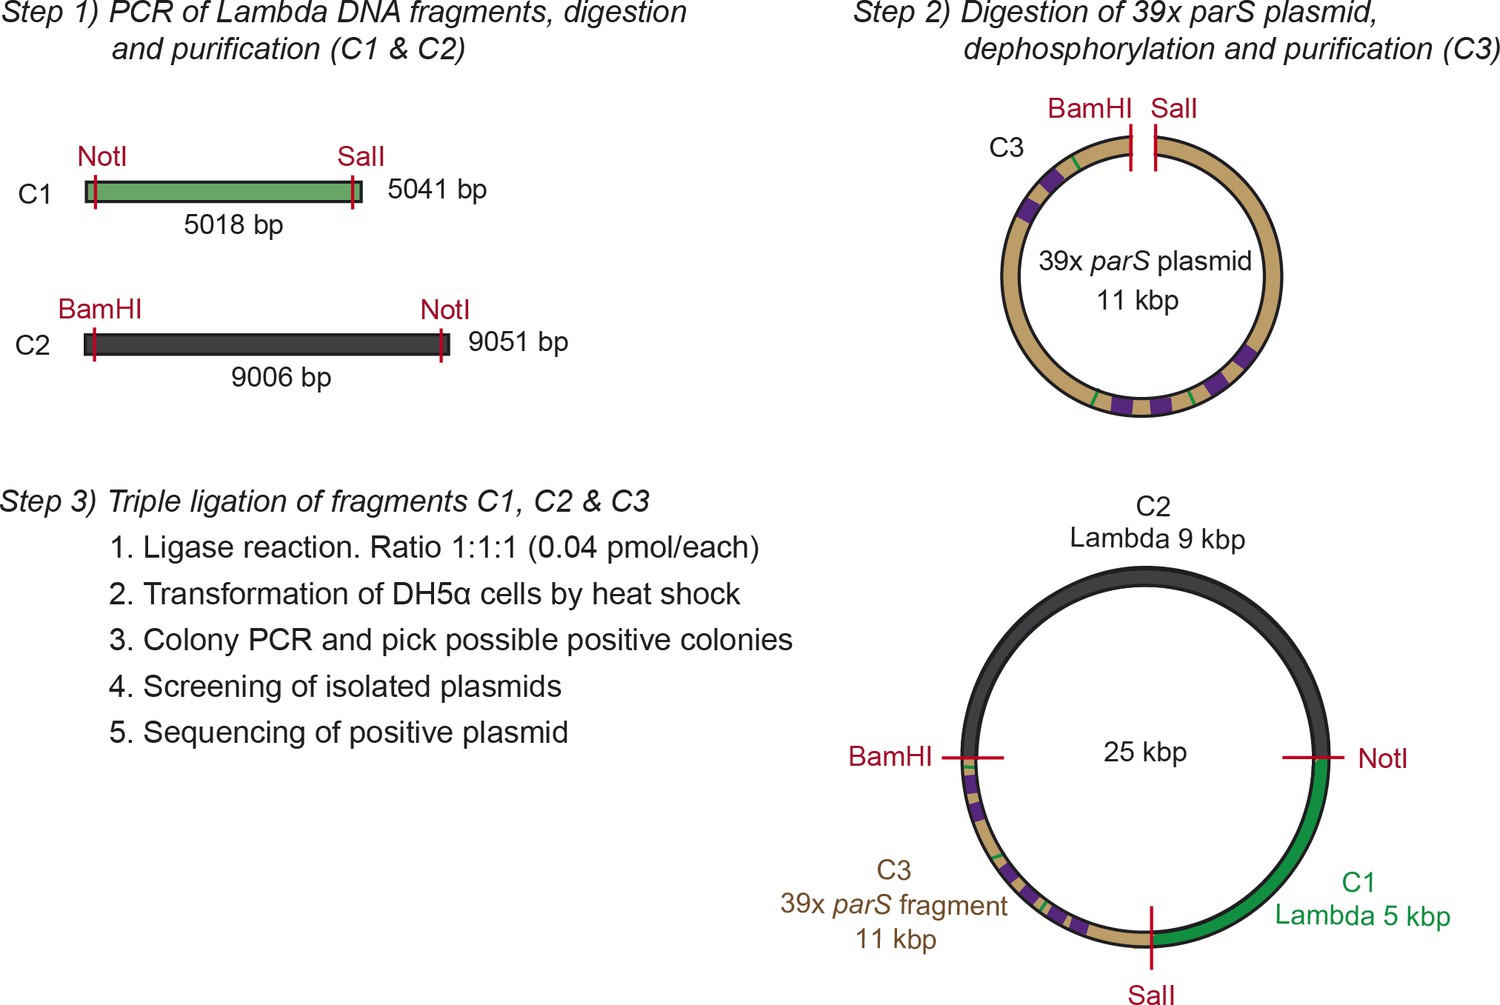
Fabrication of large DNA plasmids.
Schematic representation of the steps followed to fabricate the large plasmids used to make the C-trap DNA substrates. This scheme specifically represents the cloning of the large 39× parS plasmid. Further details are described in the Supplementary methods section.
Figure 1—figure supplement 4
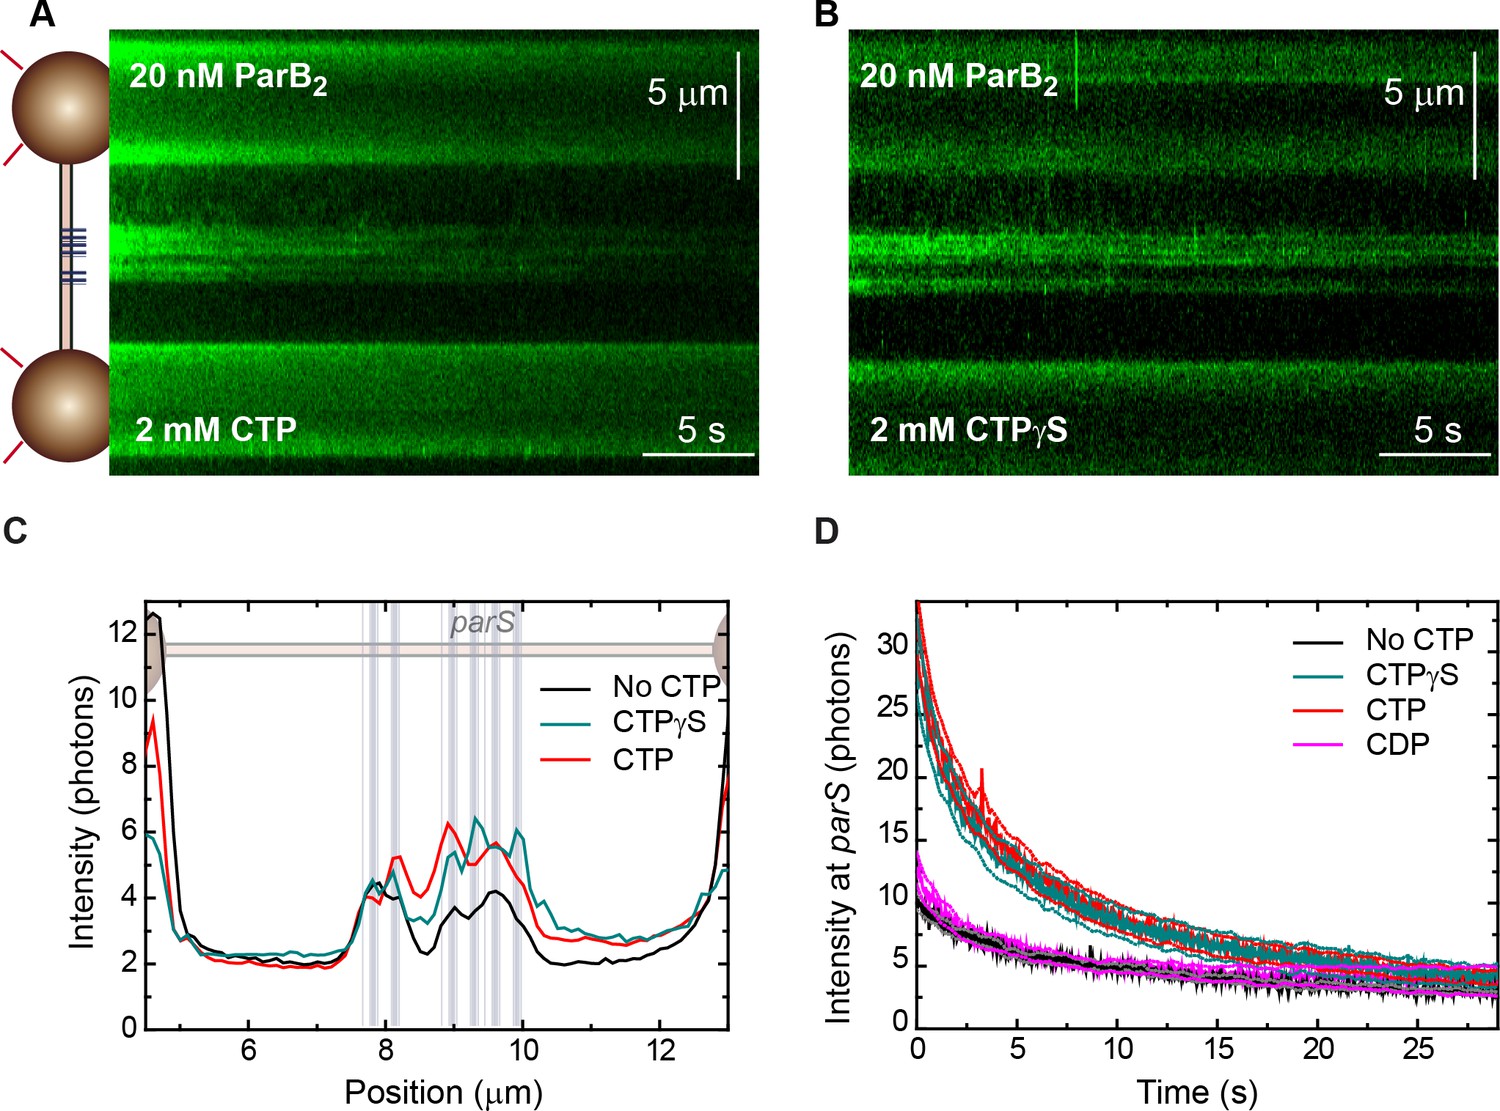
Kymographs of ParB bound along parS DNA.
(A) Fluorescence kymograph of a single 39× parS DNA molecule (Figure 1C) obtained with the C-trap including 20 nM ParB2 and 2 mM cytidine triphosphate (CTP). A cartoon of the experiment with a schematic of the DNA showing the positions of the parS sequences plotted to scale is included on the left. (B) Same experiment as in A but using 2 mM CTPγS. Regions corresponding to the position of the parS groups could be clearly identified. (C) Average intensity profile (30 s) obtained along the DNA molecule. Positions of the parS sequences are included to scale in the background. The fluorescence intensity peaks correlate very well with the position of the six groups of parS sites. (D) Time evolution of the fluorescence intensity at the parS region obtained from kymographs under no CTP, CTP, cytidine diphosphate (CDP), and CTPγS conditions. Represented data are the average of multiple (no CTP: n=6, CTP: n=17, CTPγS: n=11, CDP: n=16) fluorescence intensity time courses. Dotted lines represent plus/minus the standard error of the mean. Time zero corresponds to the moment of turning on the excitation.
-
Figure 1—figure supplement 4—source data 1
Source data file for Figure 1—figure supplement 4.
- https://cdn.elifesciences.org/articles/67554/elife-67554-fig1-figsupp4-data1-v2.xlsx
Figure 2 with 1 supplement

Cytidine triphosphate (CTP) binding promotes ParB spreading from parS.
(A) Cartoon of the experiment. First, a tandem 39× parS DNA molecule is incubated with 20 nM ParB2 and 2 mM CTP-Mg2+. Then, following a 2 min incubation, the confocal laser is turned on and confocal images are taken. (B) Representative confocal images taken after 2 min ParB incubation in the dark using tandem 39× parS DNA under no CTP, CTP, or CTPγS conditions, as well as parS-free DNA (lambda DNA) and 2 mM CTP-Mg2+. ParB appears in non-parS regions only when using parS DNA and under CTP or CTPγS conditions (red arrows). Dark to bright regions correspond to a scale of 0–50 photon counts for parS DNA tethers and 0–25 counts for lambda DNA. (C) Corresponding average profiles (500 nm width) of the fluorescence intensity taken along the DNA axis of the confocal images, including the cytidine diphosphate (CDP) case (scan not shown). Positions of the parS sequences are included to scale in the background. (D) Schematic representation of the single-length EcoRI 39× parS DNA used for C-trap roadblock experiments. The DNA contains 39 parS sequences arranged as in Figure 1C, but also includes two groups of 5× EcoRI sites flanking the parS region. Note that one of the 5× EcoRI groups is located 3613 bp away from the last parS sequence, potentially allowing spreading from the parS region. The positions of the parS sites in the DNA cartoon are represented to scale. (E) Cartoon of the roadblock experiment designed to limit ParB spreading using the EcoRIE111G mutant as a roadblock. The experiment is identical to that described in A, but first includes a 2 min pre-incubation with 100 nM EcoRIE111G, which is capable of DNA binding to EcoRI sites but unable to cleave the DNA, thus acting as a roadblock. (F) Confocal image showing limited spreading due to EcoRIE111G blocking in tandem EcoRI 39× parS DNA. Brighter regions correspond to parS binding and the two dimmed regions correspond to limited spreading up to the EcoRI sites (red arrows). Regions inaccessible to ParB spreading are indicated with blue arrows. (G) Corresponding average profile (500 nm width) of the fluorescence intensity taken along the DNA axis of the confocal image. Positions of the parS sequences and EcoRI sites are included to scale in the background. Red arrows indicate the limited spreading of ParB up to EcoRI sites. Blue arrows indicate inaccessible regions to ParB.
-
Figure 2—source data 1
Source data file for Figure 2.
- https://cdn.elifesciences.org/articles/67554/elife-67554-fig2-data1-v2.xlsx
Figure 2—figure supplement 1
Cytidine triphosphate (CTP) binding promotes ParB spreading from parS in 7× parS substrates.
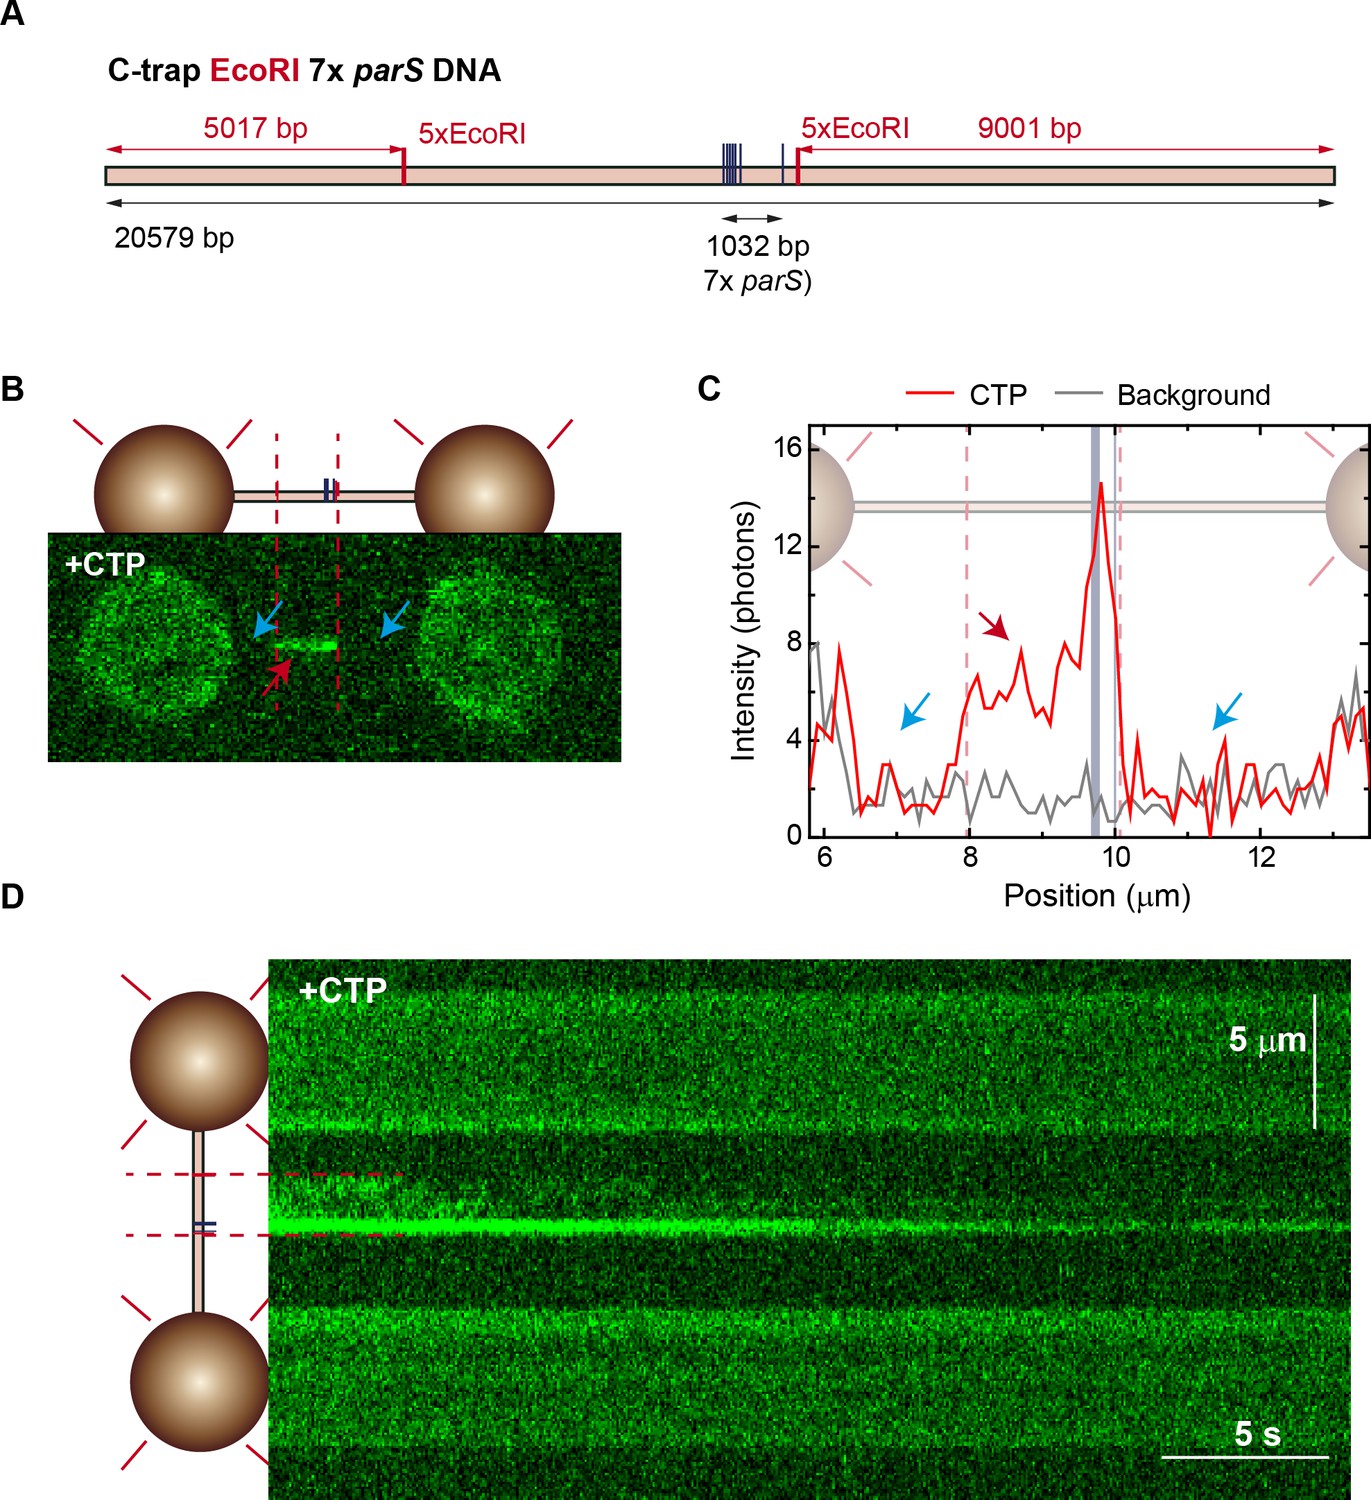
(A) Schematic representation of the single-length EcoRI 7× parS DNA used for C-trap roadblock experiments. The DNA contains seven parS sequences and also includes two groups of 5× EcoRI sites flanking the parS region. The positions of the parS and EcoRI sites in the DNA cartoon are represented to scale. (B) Confocal image showing limited spreading due to EcoRIE111G blocking in single EcoRI 7× parS DNA. Experiment includes 20 nM ParB2, 100 nM EcoRIE111G, and 2 mM CTP-Mg2+. Brighter region corresponds to parS binding and the dimmed region corresponds to limited spreading up to the EcoRI site (red arrow). Regions inaccessible to ParB spreading are indicated with blue arrows. (C) Corresponding average profile (300 nm width) of the fluorescence intensity taken along the DNA axis of the confocal image. Positions of the parS sequences and EcoRI sites are included to scale in the background. Red arrow indicates the limited spreading of ParB up to EcoRI sites. Blue arrows indicate inaccessible regions to ParB. (D) Fluorescence kymograph of the experiment shown in panel B. A cartoon of the DNA showing the positions of the parS and EcoRI sequences plotted to scale is included on the left.
Figure 3 with 1 supplement
Direct visualization of ParB diffusion from parS sites.
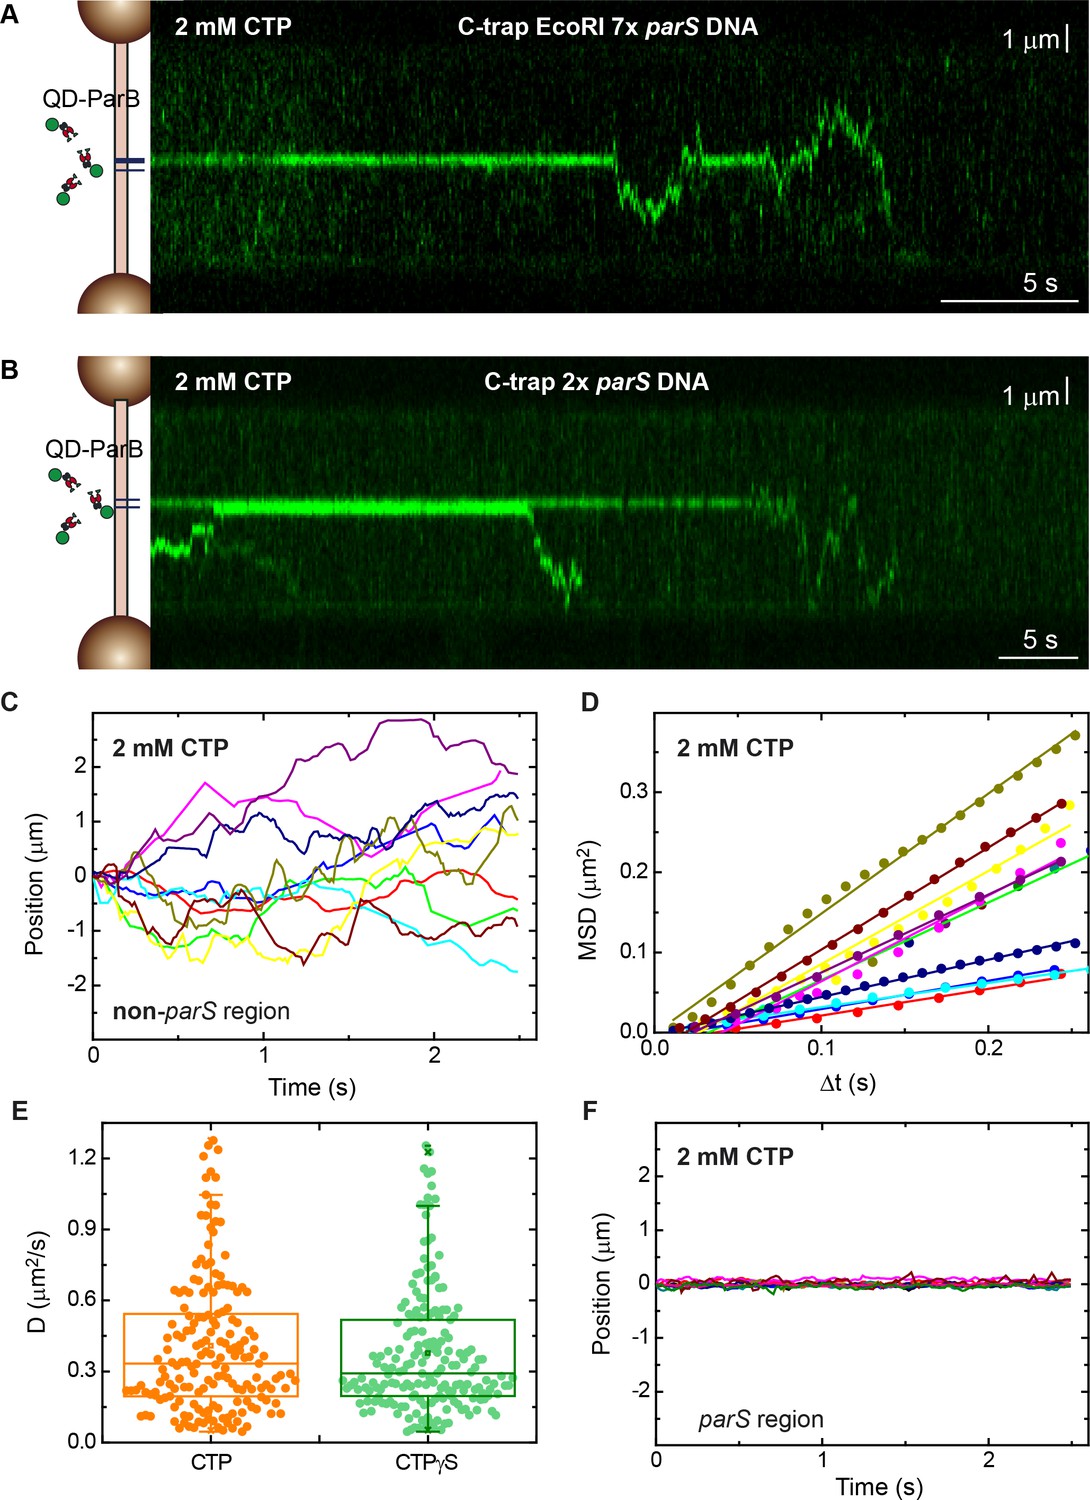
(A) Fluorescence kymograph of quantum dot (QD)-ParB on C-trap EcoRI 7× parS DNA substrates obtained under cytidine triphosphate (CTP)-Mg2+ conditions. ParB remains mostly at parS sites and eventually diffuses from parS. (B) Fluorescence kymograph of QD-ParB on C-trap 2× parS DNA substrates obtained under CTP-Mg2+ conditions. (C) Representative QD-ParB trajectories measured on non-parS regions of DNA (N=177). (D) Mean squared displacement (MSD) of ParB for different time intervals (Δt). Straight lines indicate normal diffusive behaviour. (E) Diffusion constants of ParB calculated as half of the slope of linear fits of MSD versus Δt. (F) Representative QD-ParB trajectories measured on parS regions of DNA indicate ParB remains mostly bound to parS.
Figure 3—figure supplement 1
Direct visualization of ParB diffusion from parS sites under CTPγS conditions.
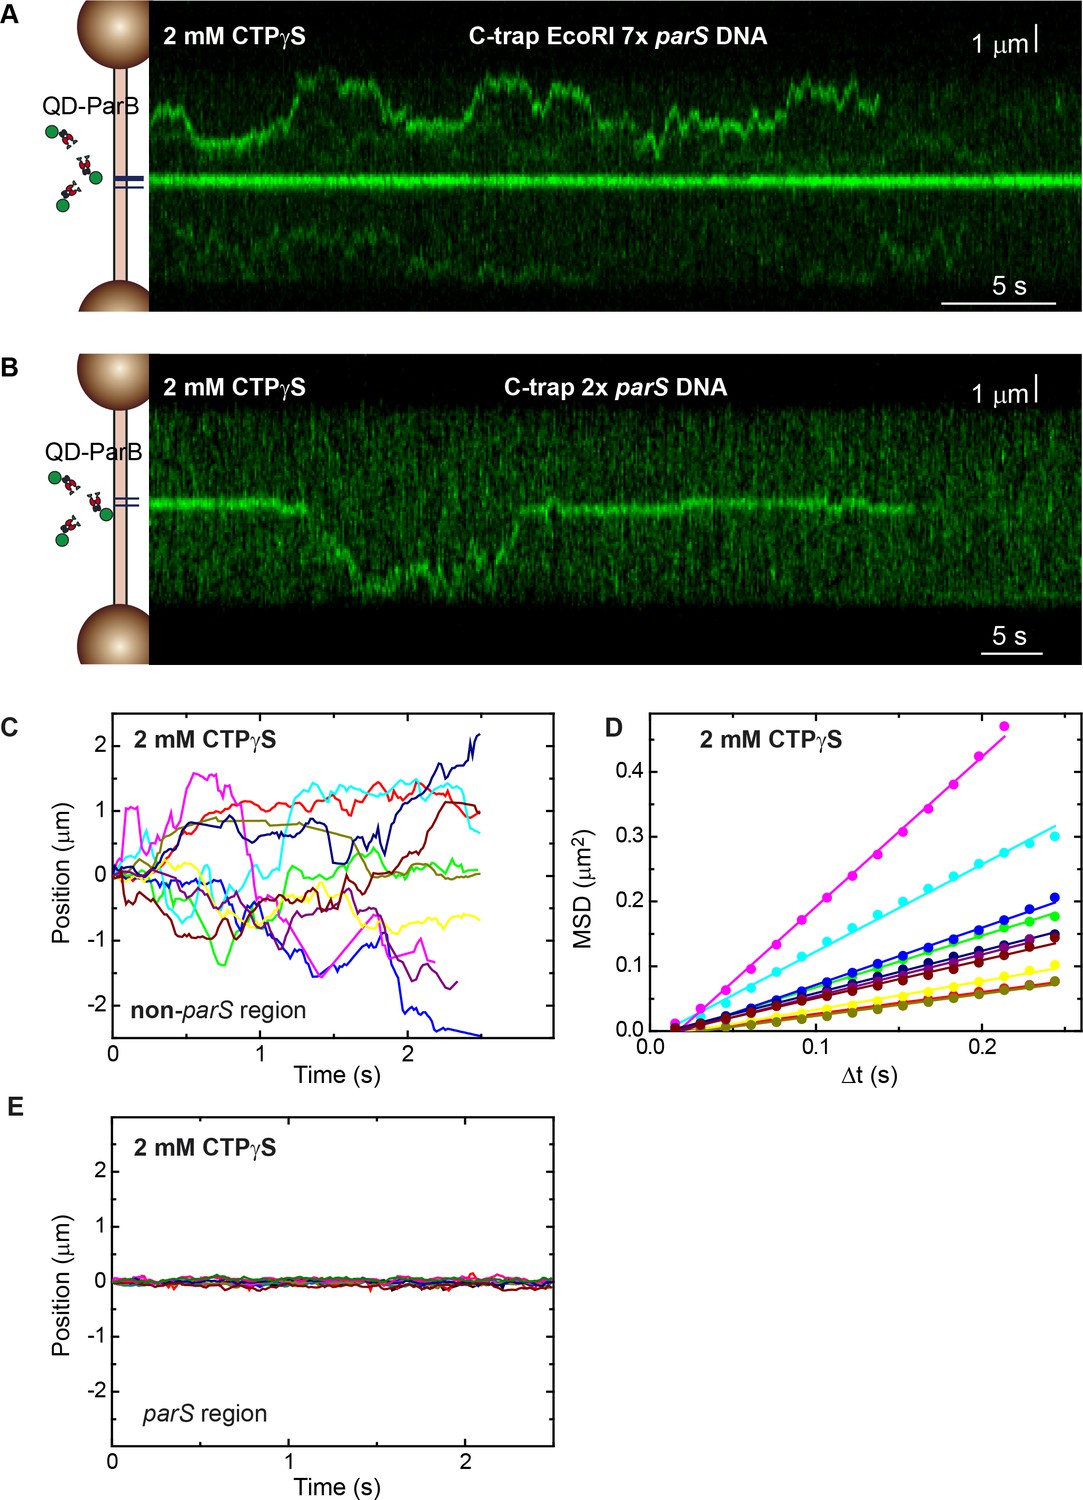
(A) Fluorescence kymograph of quantum dot (QD)-ParB on C-trap EcoRI 7× parS DNA substrates obtained under CTPγS-Mg2+ conditions. (B) Same experiment as in A but using the C-trap 2× parS DNA substrate. (C) Representative QD-ParB trajectories measured on non-parS regions of DNA (N=185). (D) Mean squared displacement (MSD) of ParB for different time intervals (Δt). Straight lines indicate diffusive behaviour. Diffusion constants for CTPγS conditions are shown in Figure 3E. (E) As in the cytidine triphosphate (CTP) case, QD-ParB trajectories measured on parS regions of DNA indicate ParB remains mostly bound to parS.
Figure 4 with 1 supplement
DNA condensation is induced by ParB at nanomolar concentrations in the presence of cytidine triphosphate (CTP).
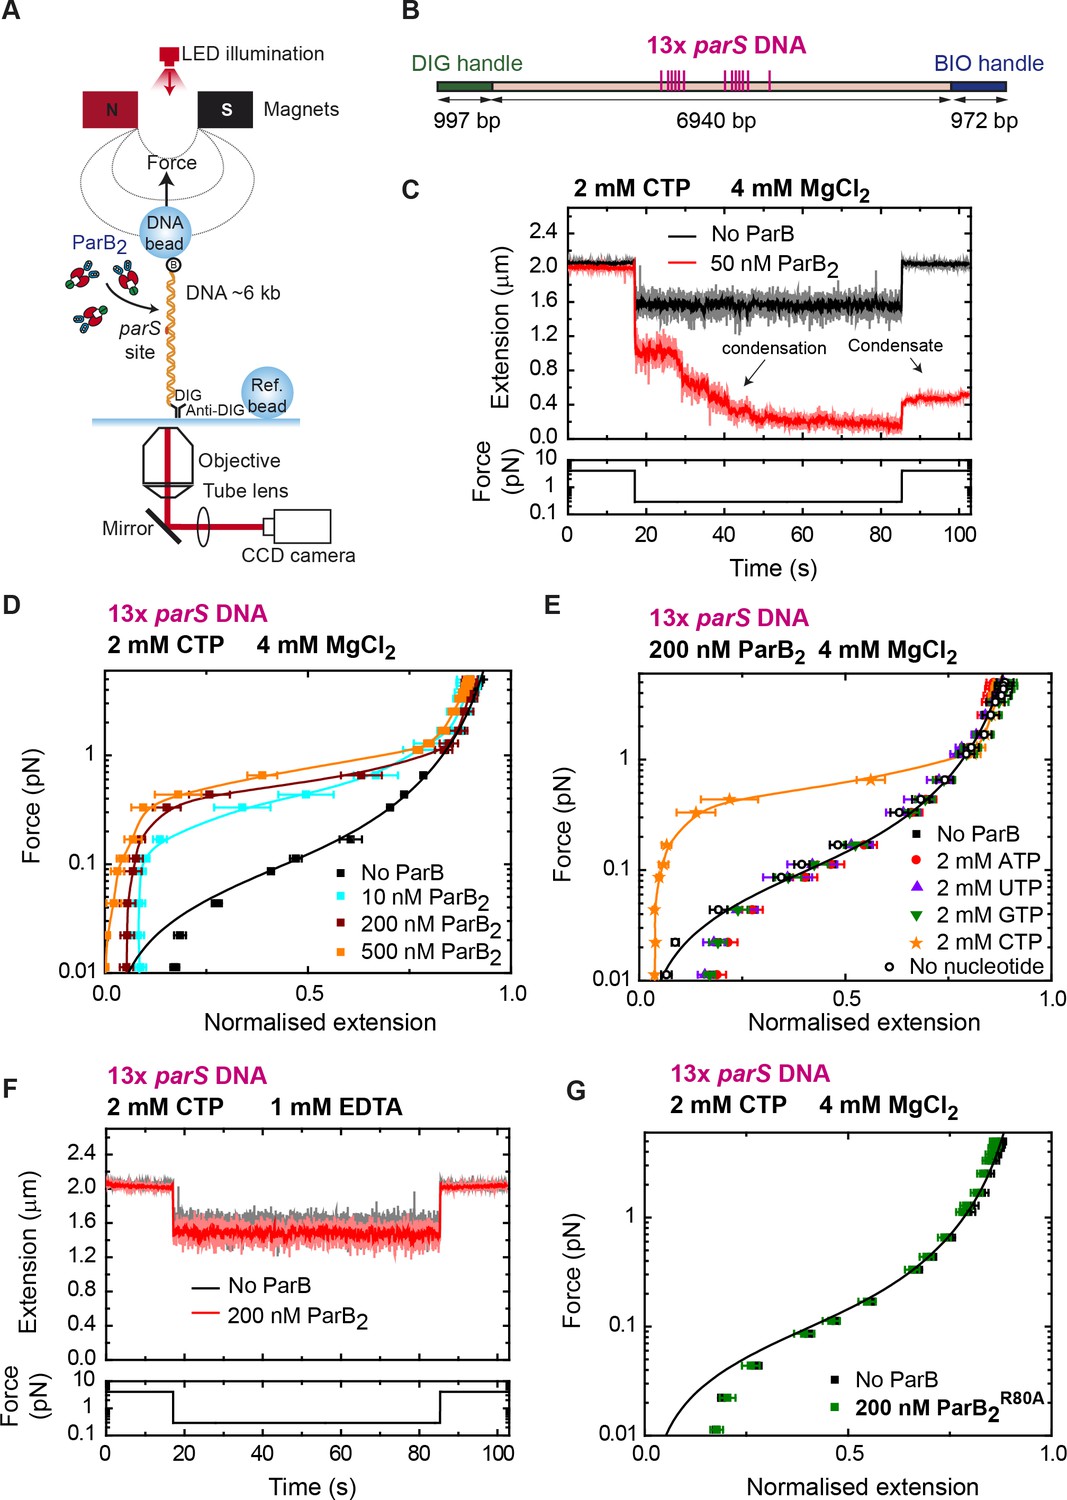
(A) Cartoon of the basic magnetic tweezers (MT) components and the layout of the experiment. (B) Schematic representation of the 13× parS DNA used for MT experiments. The positions of the parS sites in the DNA cartoon are represented to scale. (C) Condensation assay. DNA is held at 4 pN while 50 nM ParB2 is injected into the fluid cell in the presence of 2 mM CTP and 4 mM MgCl2. Following a 2 min incubation, the force is lowered to 0.3 pN and the extension recorded (red data). The extension in the absence of protein is shown in black. DNA could not recover the original extension by force after condensation at low force. (D) Average force-extension curves of 13× parS DNA molecules in the presence of 2 mM CTP, 4 mM MgCl2, and increasing concentrations of ParB2. A concentration of only 10 nM ParB2 was able to condense the 13× parS DNA. (E) Average force-extension curves of 13× parS DNA taken under the stated conditions and in the presence of different nucleotides or with no nucleotide. Only CTP produces condensation of parS DNA. Solid lines in the condensed data are guides for the eye. Errors are standard error of the mean for measurements taken on different molecules (N ≥ 6). (F) Condensation assay of 13× parS DNA under 2 mM CTP and 1 mM EDTA conditions. DNA condensation by ParB and CTP requires Mg2+. (G) CTP-binding mutant, ParBR80A, does not condense 13× parS DNA under standard CTP-Mg2+ conditions. No ParB data represent force-extension curves of DNA taken in the absence of protein and are fitted to the worm-like chain model. Errors are standard error of the mean for measurements taken on different molecules (N = 7).
-
Figure 4—source data 1
Source data file for Figure 4.
- https://cdn.elifesciences.org/articles/67554/elife-67554-fig4-data1-v2.xlsx
Figure 4—figure supplement 1
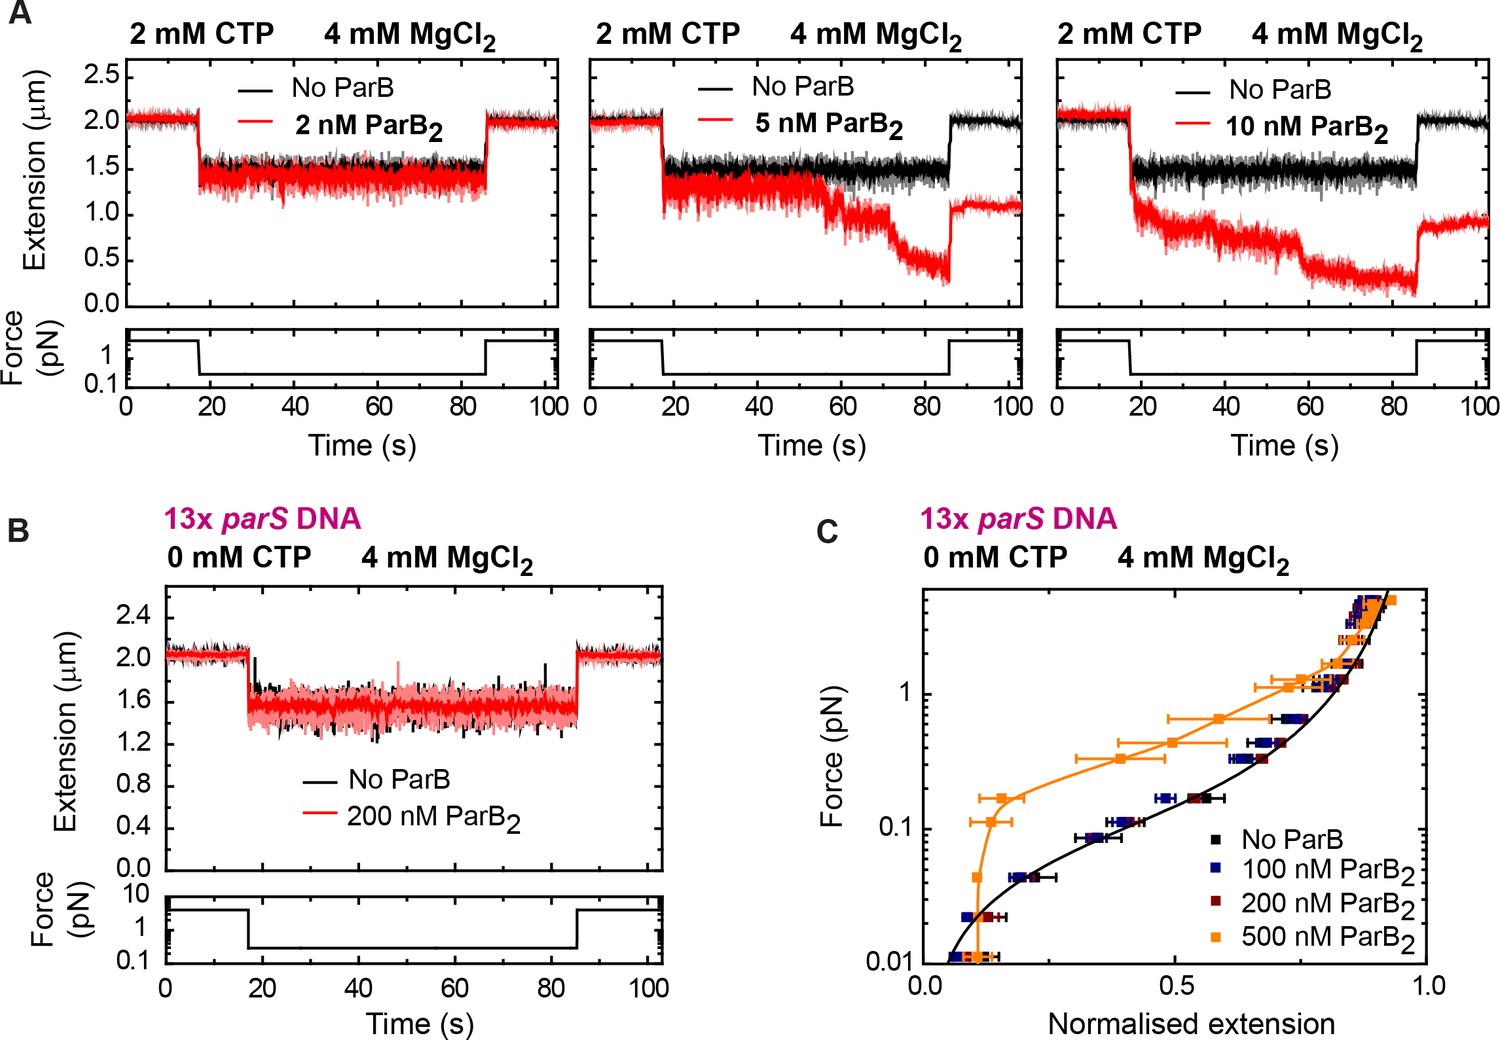
Low nanomolar concentrations of ParB condense parS DNA in the presence of cytidine triphosphate (CTP)-Mg2+.
(A) Condensation time courses showing that a minimum of 5 nM ParB2 condenses 13× parS DNA within a minute under 2 mM CTP, 4 mM MgCl2 conditions. (B) Control experiment showing no condensation in the absence of CTP. (C) A protein concentration above 500 nM condenses DNA via non-specific interactions, as previously reported (Taylor et al., 2015). No ParB data represent force-extension curves of DNA taken in the absence of protein and are fitted to the worm-like chain model. Errors are standard error of the mean for measurements taken on different molecules (N ≥ 7).
-
Figure 4—figure supplement 1—source data 1
Source data file for Figure 4—figure supplement 1.
- https://cdn.elifesciences.org/articles/67554/elife-67554-fig4-figsupp1-data1-v2.xlsx
Figure 5
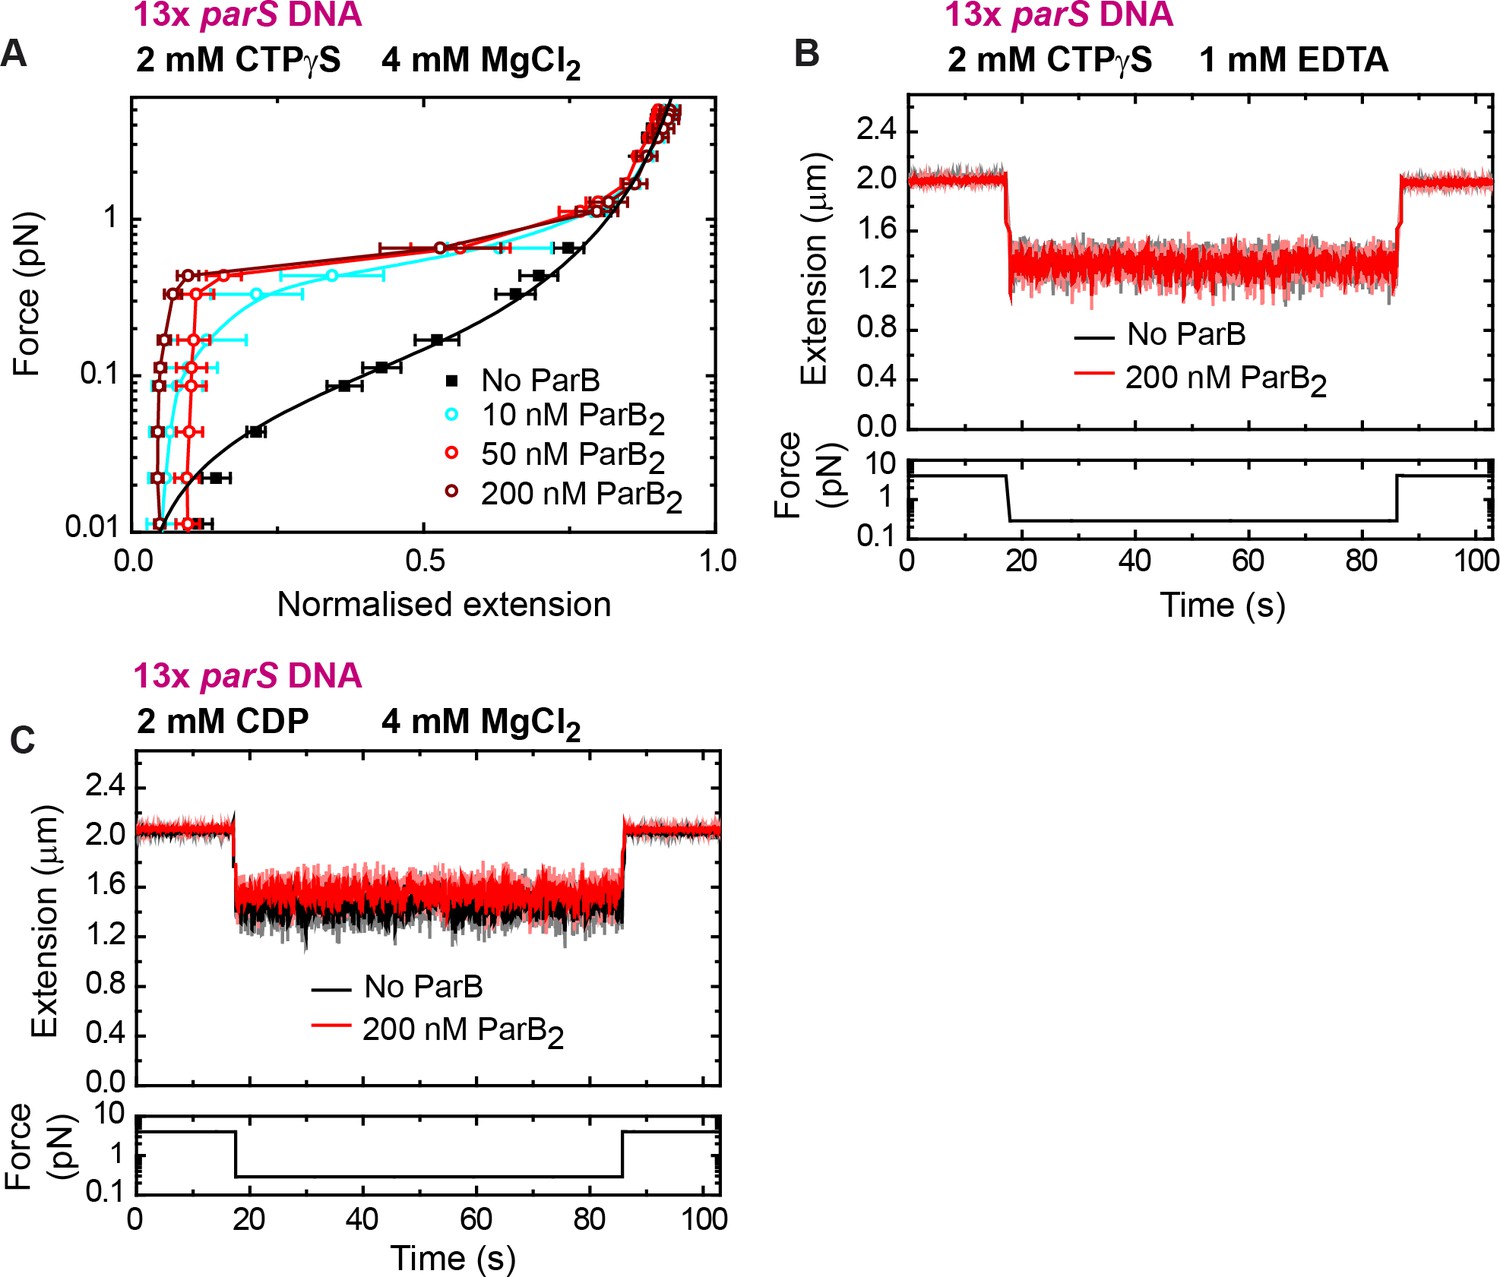
DNA condensation by nanomolar ParB requires cytidine triphosphate (CTP) binding but not hydrolysis.
(A) Average force-extension curves of 13× parS DNA molecules in the presence of 2 mM CTPγS, 4 mM MgCl2, and increasing concentrations of ParB. Results obtained with CTP (Figure 4D) and CTPγS were very similar. No ParB data represent force-extension curves of DNA taken in the absence of protein and are fitted to the worm-like chain model. Solid lines in condensed data are guides for the eye. Errors are standard error of the mean for measurements taken on different molecules (N ≥ 7). (B) Condensation assay of 13× parS DNA under 2 mM CTPγS and 1 mM EDTA conditions. DNA condensation by ParB and CTPγS requires Mg2+. (C) Condensation assay of 13× parS DNA under 2 mM cytidine diphosphate (CDP) and 4 mM MgCl2 conditions.
-
Figure 5—source data 1
Source data file for Figure 5.
- https://cdn.elifesciences.org/articles/67554/elife-67554-fig5-data1-v2.xlsx
Figure 6 with 2 supplements
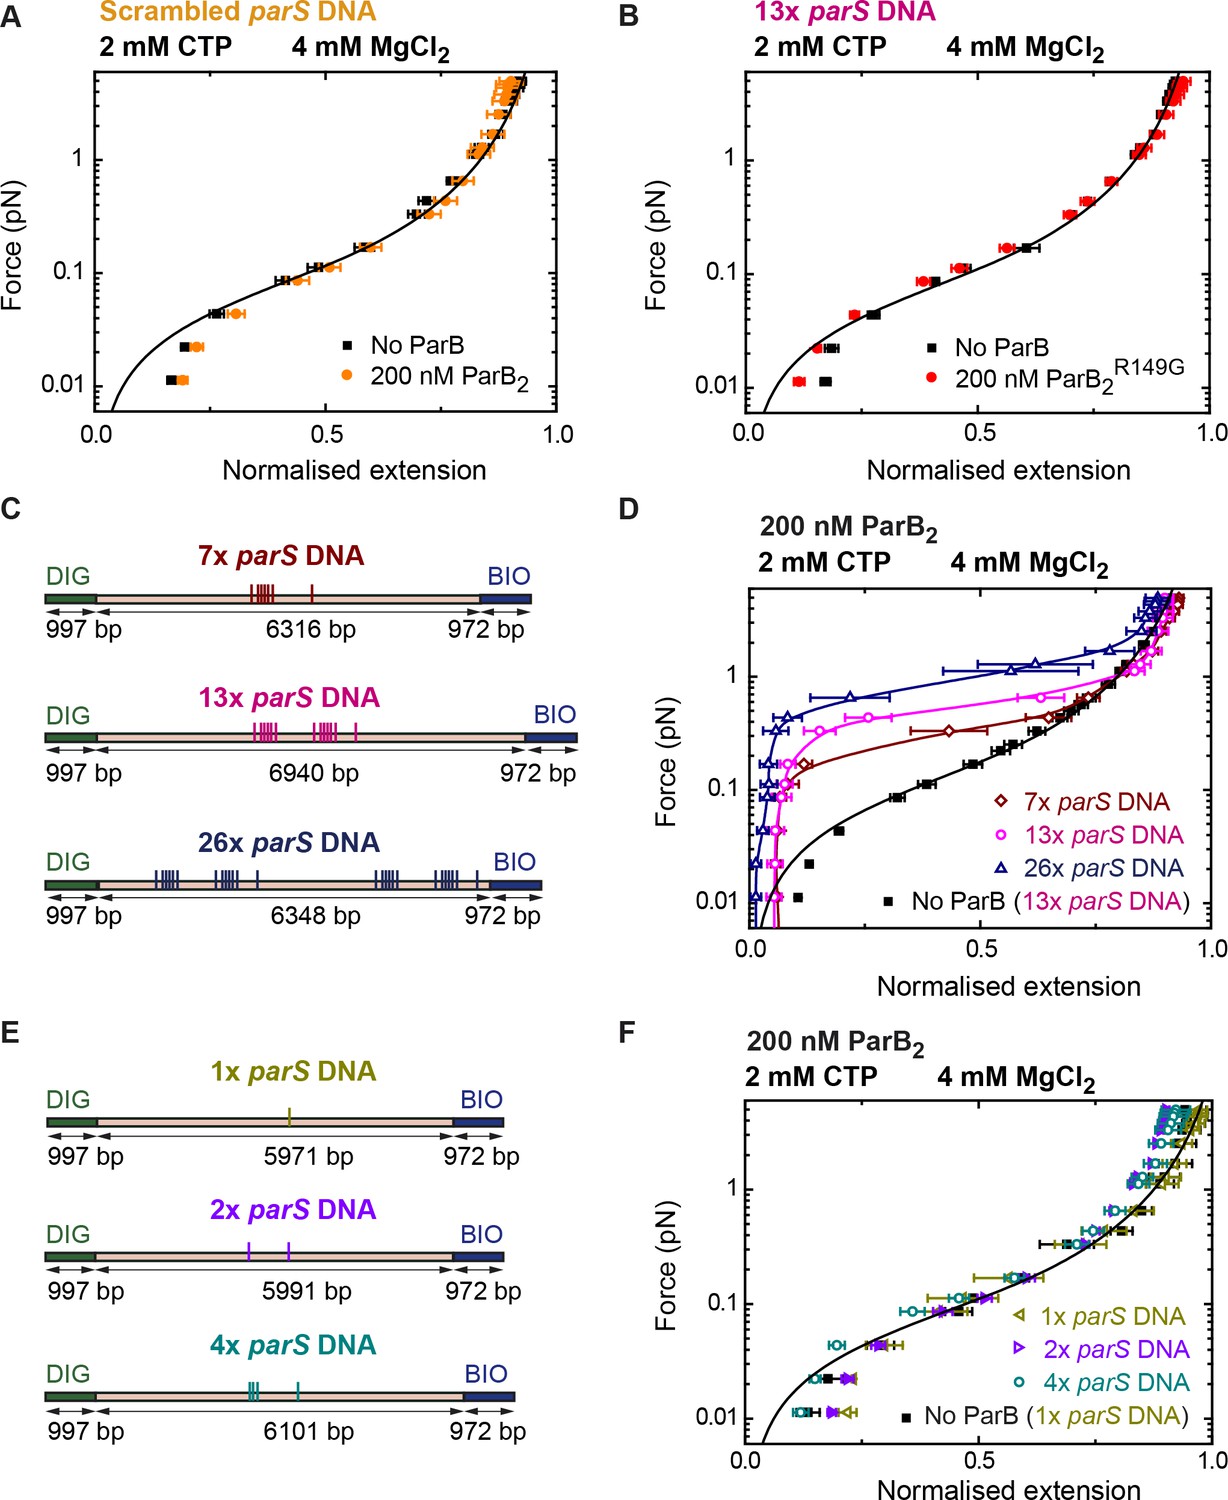
DNA condensation by nanomolar ParB is parS dependent.
(A) ParB does not condense scrambled parS DNA under standard cytidine triphosphate (CTP)-Mg2+ conditions. Errors are standard error of the mean of measurements on different molecules (N = 5). (B) The parS-binding mutant, ParBR149G, does not condense 13× parS DNA under standard CTP-Mg2+ conditions. Errors are standard error of the mean of measurements on different molecules (N = 14). (C) Schematic representation of DNA substrates containing 7, 13, and 26 copies of parS. The positions of the parS sites in the DNA cartoon are represented to scale. (D) Average force-extension curves of 7× parS DNA, 13× parS DNA, and 26× parS DNA obtained under standard CTP-Mg2+ conditions. The condensation force correlates with increasing number of parS sequences. Solid lines in condensed data are guides for the eye. Errors are standard error of the mean of measurements on different molecules (N ≥ 7). (E) Schematic representation of DNA substrates containing 1, 2, and 4 copies of parS. The positions of the parS sites in the DNA cartoon are represented to scale. (F) Average force-extension curves of 1× parS DNA, 2× parS DNA, and 4× parS DNA obtained under standard CTP-Mg2+ conditions. No condensation was observed for these three experiments due to the pulling force present in magnetic tweezers (MT) experiments. Errors are standard error of the mean of measurements on different molecules (N ≥ 7). No ParB data represent force-extension curves of DNA taken in the absence of protein and are fitted to the worm-like chain model.
-
Figure 6—source data 1
Source data file for Figure 6.
- https://cdn.elifesciences.org/articles/67554/elife-67554-fig6-data1-v2.xlsx
Figure 6—figure supplement 1
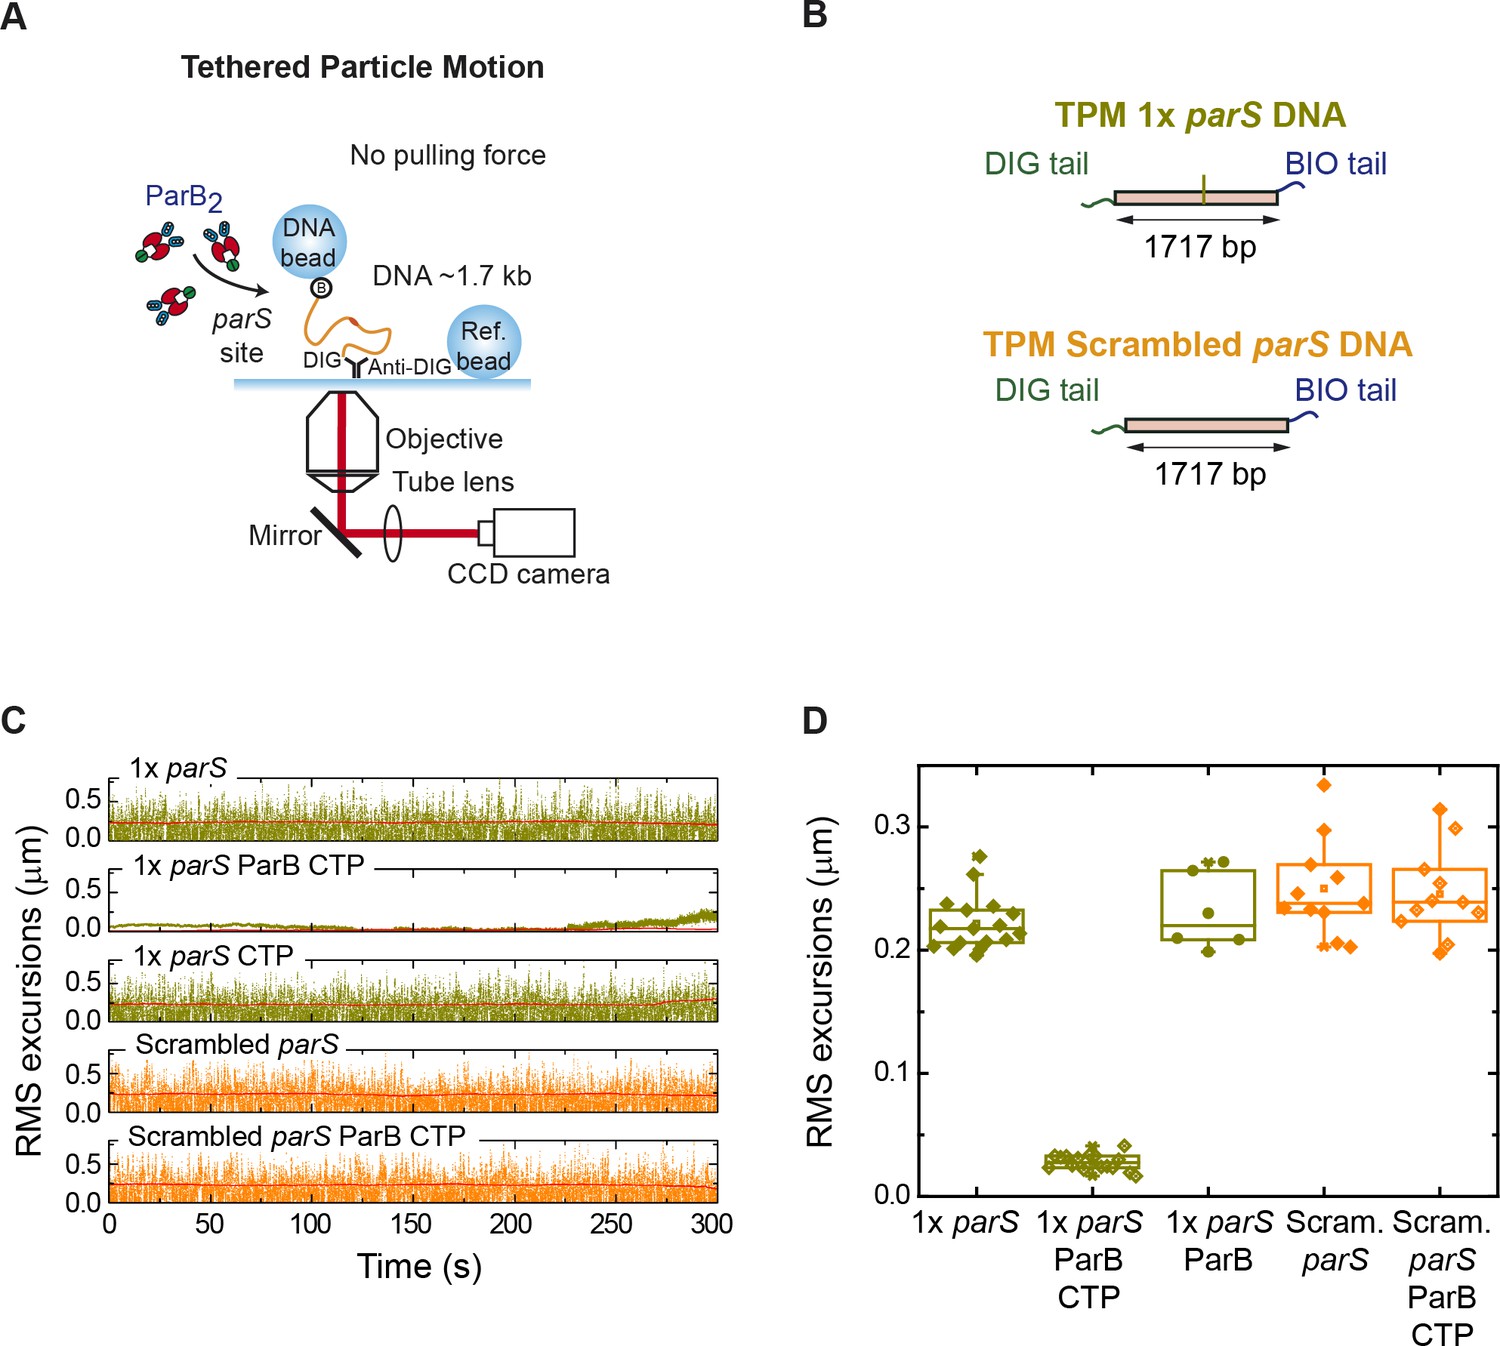
Tethered particle motion (TPM) experiments show single-parS DNA condensation by ParB.
(A) Cartoon of the TPM setup. Essentially, the same employed for magnetic tweezers (MT) experiments but without the magnets. (B) Schematic representation of the TPM 1× parS DNA and TPM scrambled parS DNA substrates used for TPM experiments. (C) Examples of time courses of root mean squared (RMS) and RMSτ excursions (see Materials and methods) of one tether under the indicated experimental conditions. (D) Box plot of mean RMSτ excursions of multiple tethers for different experimental conditions. ParB is able to condense single-parS DNA in the presence of CTP-Mg2+.
Figure 6—figure supplement 2
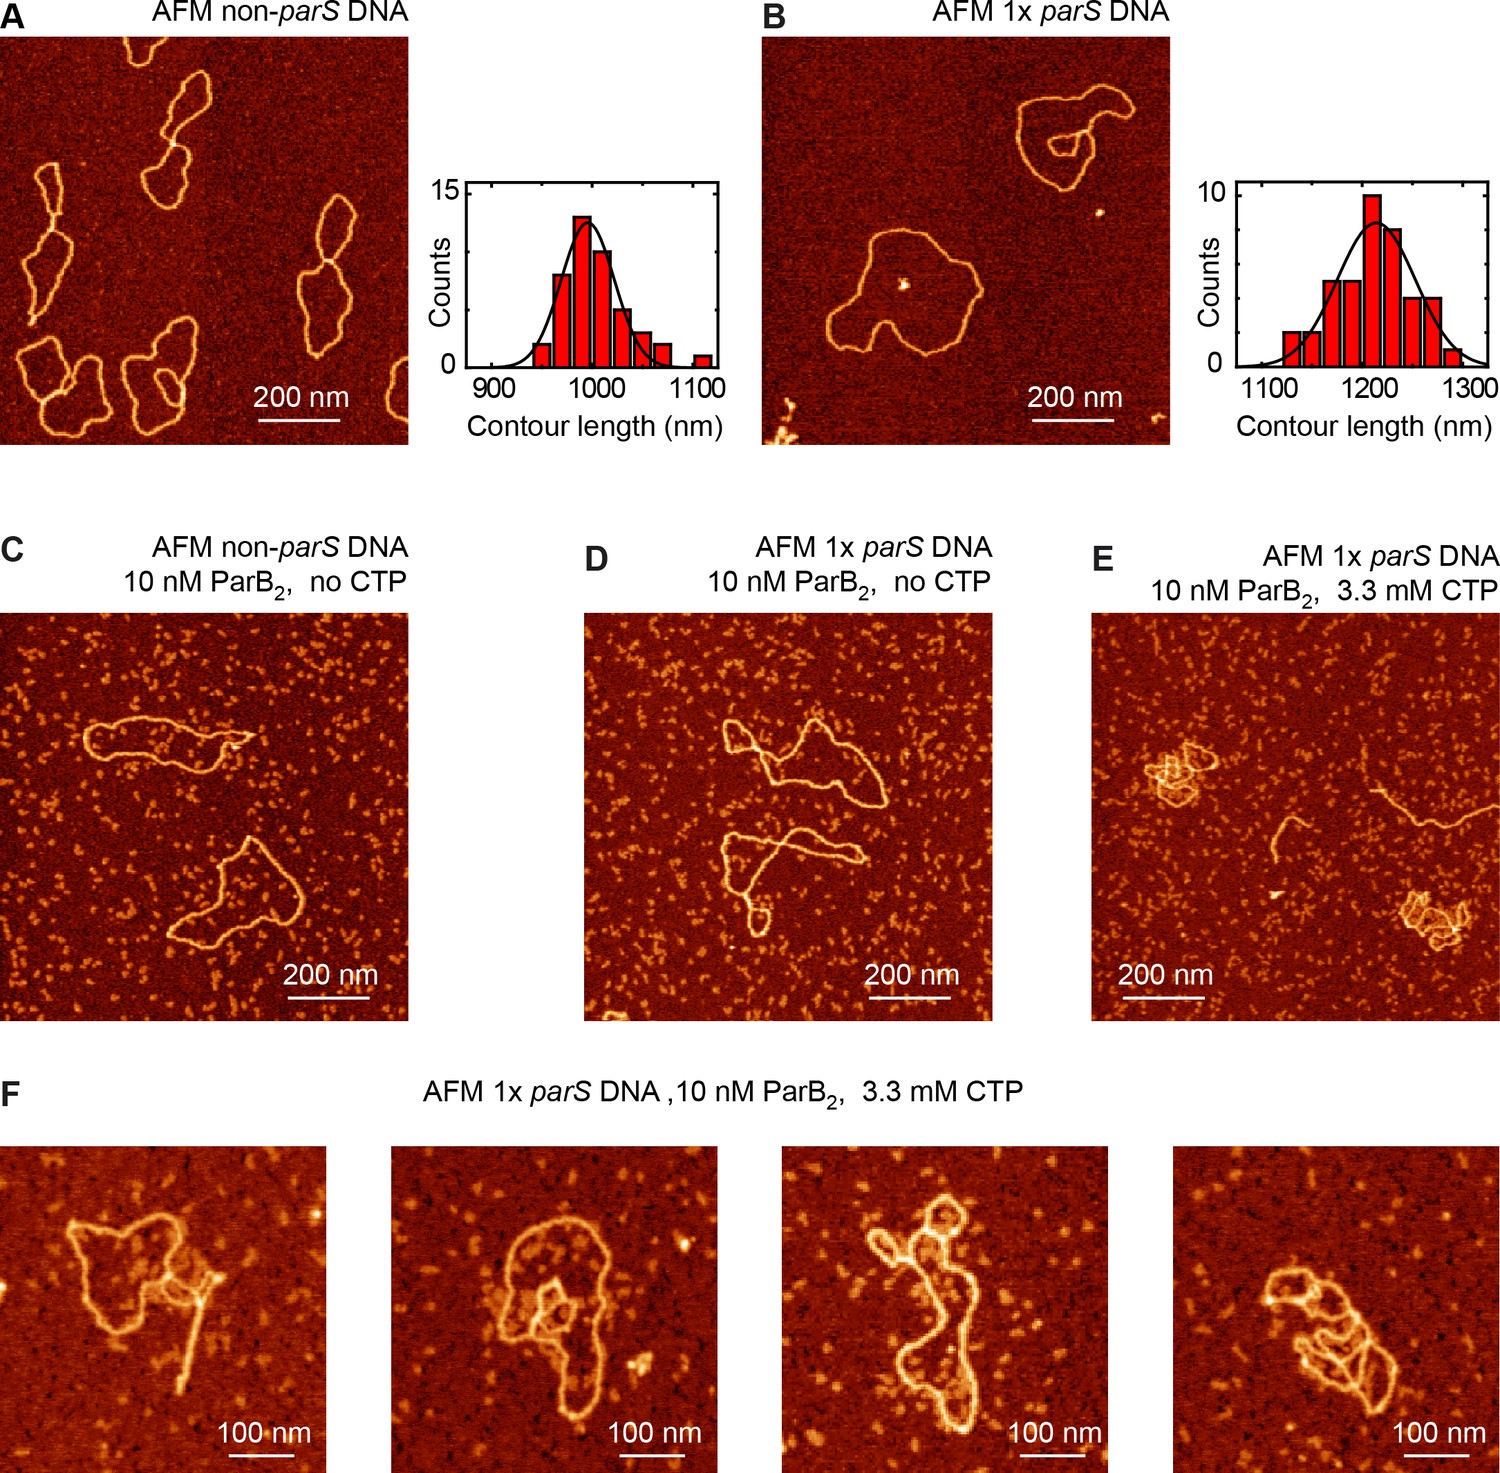
Atomic force microscopy (AFM) experiments show single-parS DNA condensation by ParB.
(A) AFM image of control non-parS DNA (left) and histogram of contour lengths (right, n = 44). (B) AFM image of AFM 1× parS DNA (left) and histogram of contour lengths (right, n = 41). (C) Characteristic AFM image of experiment including non-parS DNA and 10 nM ParB2 in the absence of cytidine triphosphate (CTP). No interaction between protein and DNA was observed. (D) Representative AFM image of experiment including 1× parS DNA and 10 nM ParB2 in the absence of CTP. No interaction between protein and DNA was observed. (E) Characteristic AFM image of experiment including 1× parS DNA, 10 nm ParB2, and 3.3 mM CTP. 1× parS plasmids appeared partially compacted due to the interaction with ParB. (F) Examples of individual 1× parS DNA molecules interacting with ParB under CTP conditions.
Figure 7 with 1 supplement
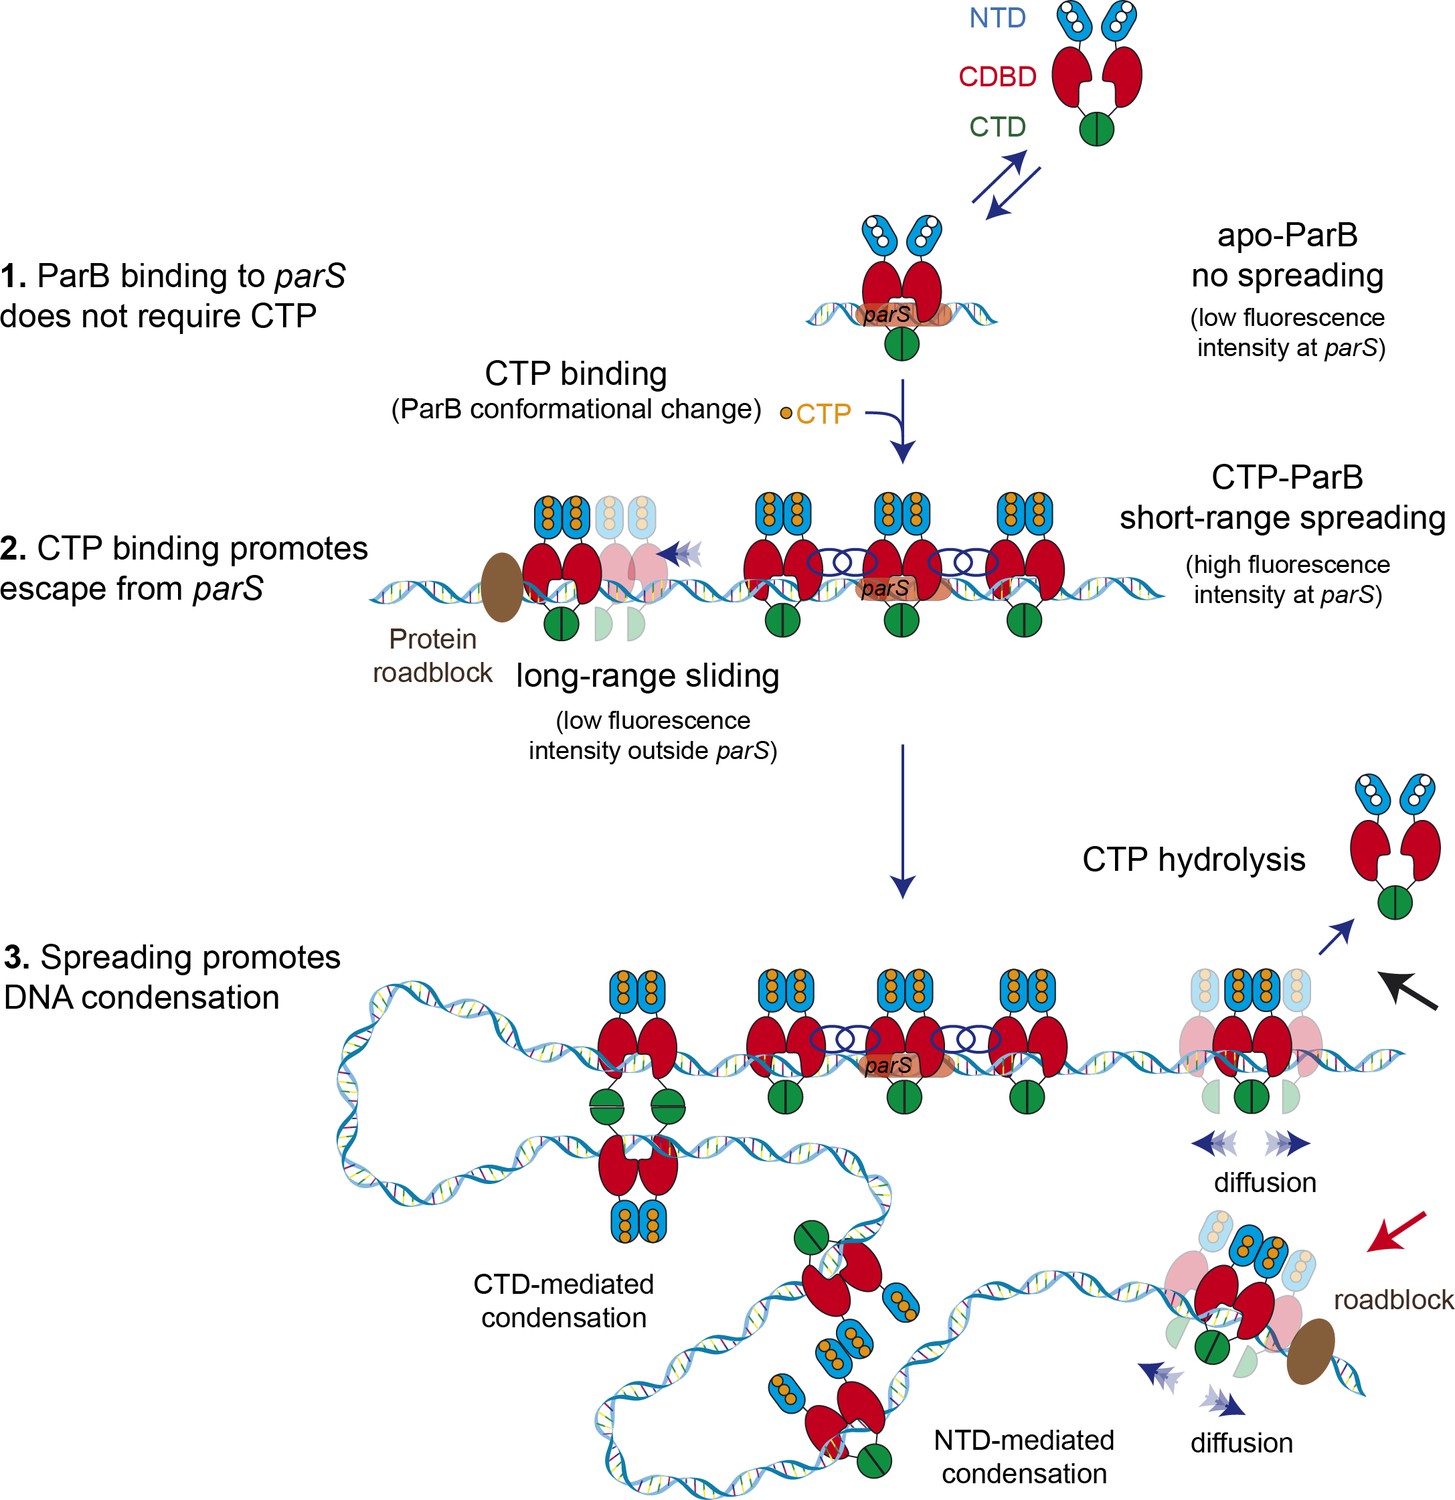
Model for ParB-dependent DNA condensation around parS sequences.
(Step 1) ParB binding to parS does not require cytidine triphosphate (CTP) as observed from C-trap experiments. ParS-bound apo-ParB does not spread from parS. (Step 2) CTP binding to ParB induces a conformational change to a sliding clamp which then escapes from parS to neighbouring non-specific DNA. Potential interactions between the ParB proteins around parS are represented by interlaced blue circles. Some ParB proteins are able to slide/diffuse long distances. (Step 3) ParB spreading and diffusion promotes the interaction with other CTP-ParB dimers through the C-terminal domain (CTD) of ParB (Fisher et al., 2017), resulting in DNA condensation by forming large DNA loops. Alternatively, other protein-protein interaction such those mediated by the N-terminal domain (NTD) (shown in figure) or the central DNA-binding domain (CDBD) of ParB could result in DNA condensation. CTP hydrolysis might be a means to recover ParB dimers from the DNA (black arrow). Protein roadblocks constrain diffusion of ParB proteins (red arrow).
Figure 7—figure supplement 1
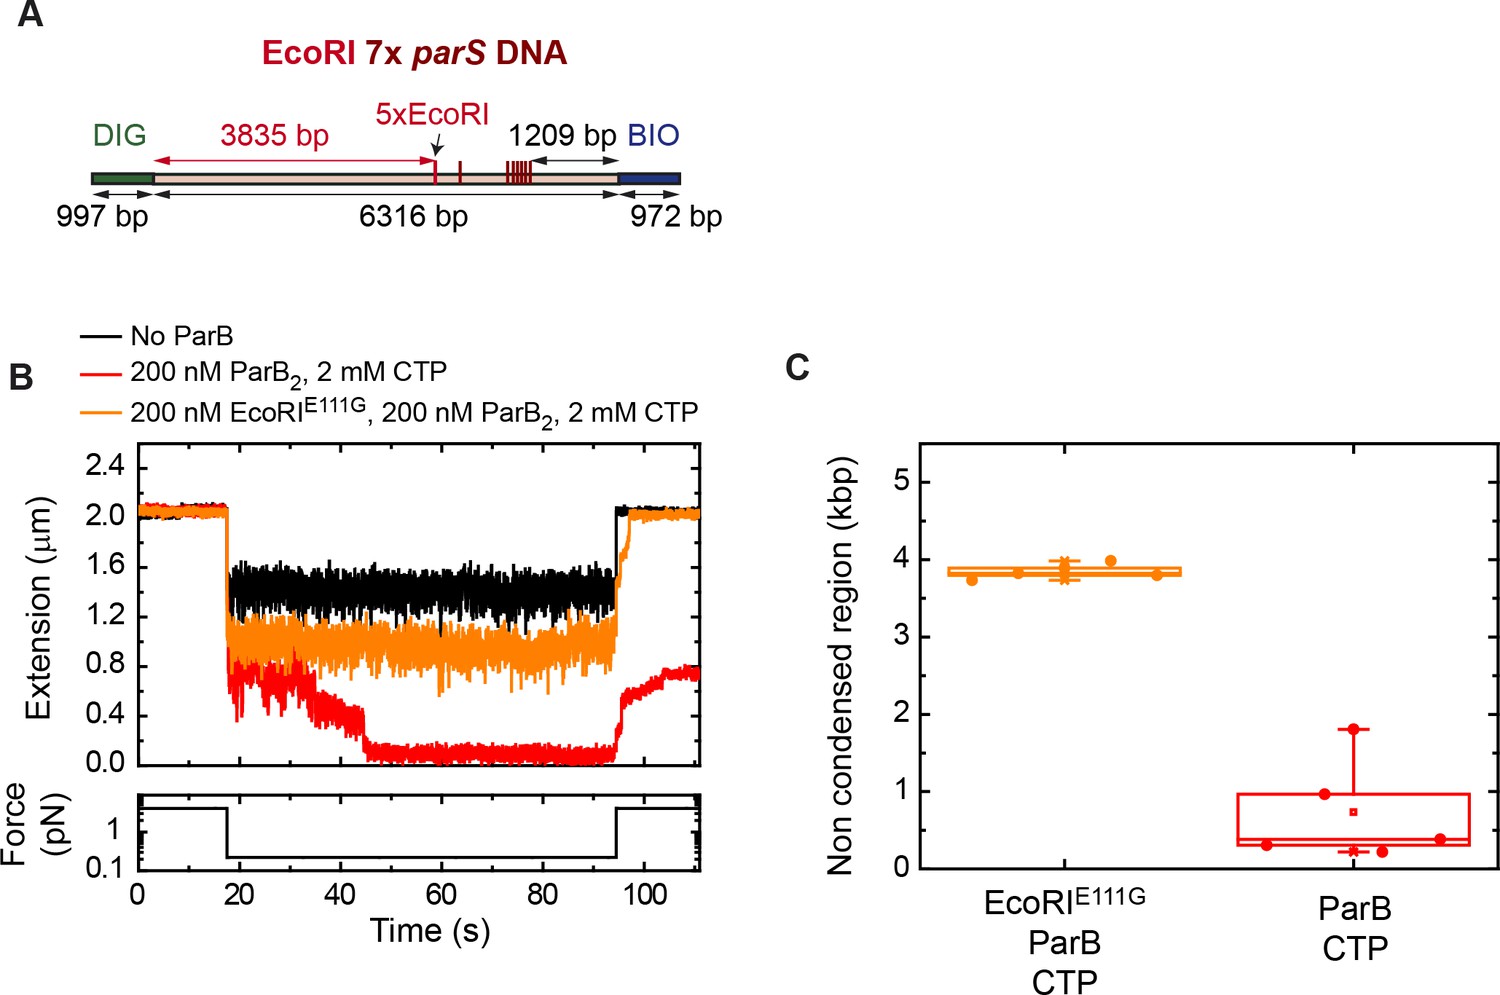
ParB diffusion is required for DNA condensation by ParB.
(A) Schematic representation of DNA substrate employed in these magnetic tweezers (MT) experiments. It contains a set of 5× EcoRI sites located at 3835 bp from the DIG labelled end, and 7× parS. The positions of the EcoRI and parS sites in the DNA cartoon are represented to scale. (B) Condensation assay using the EcoRI 7× parS DNA substrate under different experimental conditions. ParB partially condenses the DNA molecule when EcoRIE111G is present. (C) Quantification of the extension in base pairs of the non-condensed region under different experimental conditions. In the presence of EcoRIE111G, the length of the non-condensed region agrees well with the length of the region flanked by the DIG end and the EcoRI sites.
Author response image 1
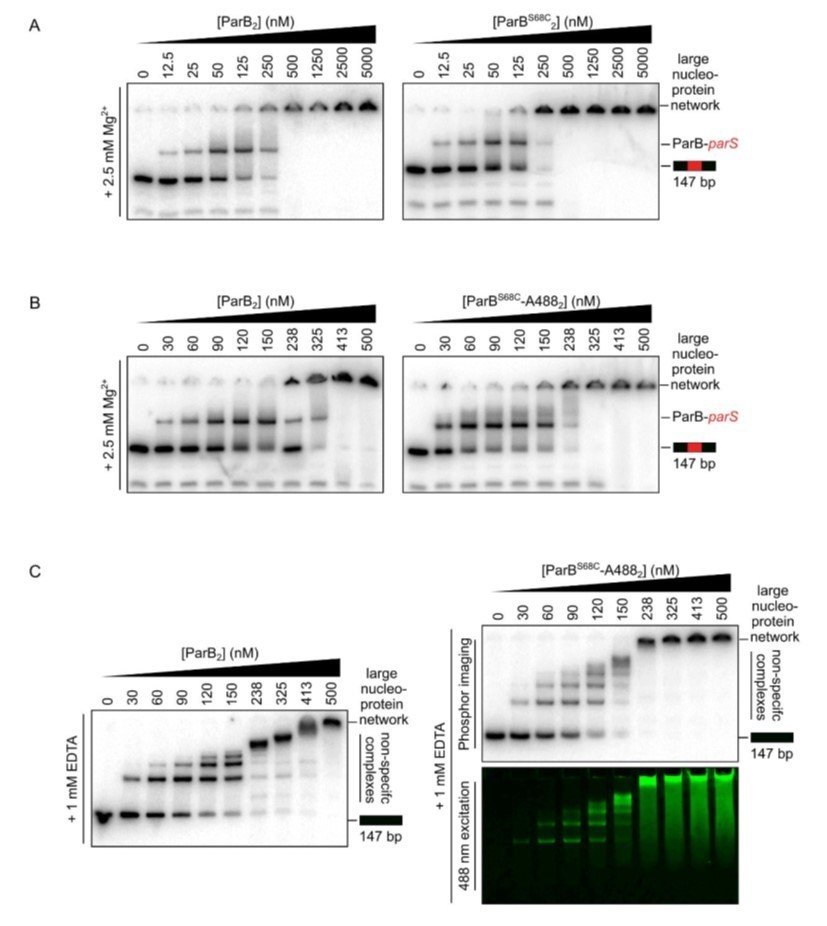
Representative TBM- and TBE-EMSAs assessing parS binding (A and B) and non-specific DNA-binding activity (C), respectively, of Alexa-488-labelled-ParB and its precursor, ParBS68C.
Wild-type-like specific and non-specific DNA-binding activity is retained. In-gel detection of the fluorescent protein corresponds to the pattern of nucleoprotein complexes.
Author response image 2
ParB spreading in the absence of EcoRI roadblocks using C-trap EcoRI 39x parS DNA.
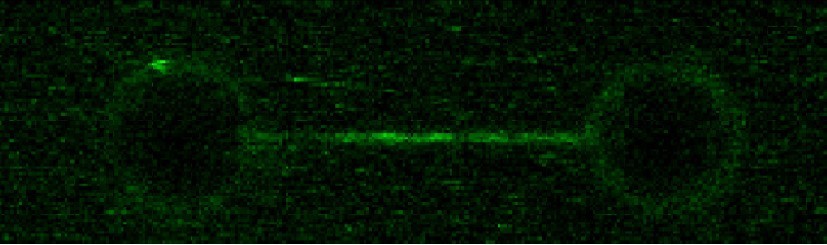
Author response image 3
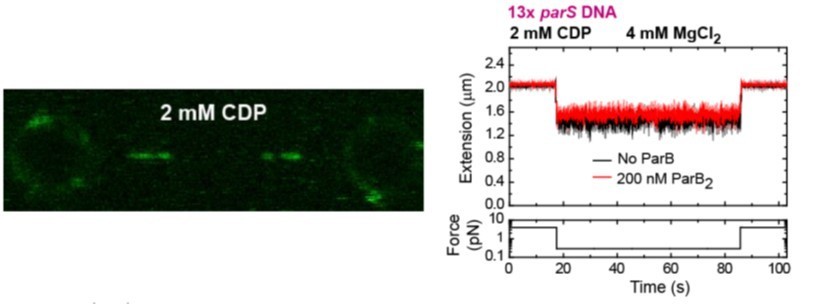
(left) C-trap scan showing ParB binding to parS at similar levels to the Apo-form of ParB, and not diffusion from parS.
(right) MT time-course showing absence of condensation in the presence of CDP and Mg2+.
Videos
Animation 1
ParB binding to parS and spreading to non-parS region.
Video built from individual C-trap scans showing ParB binding to parS, spreading to non-parS DNA, and photobleaching of the fluorescence dye.
Animation 2
ParB spreading is limited by protein roadblocks.
Video built from individual C-trap scans showing ParB binding to parS, and spreading to non-parS DNA up to the region confined by EcoRIE111G, and photobleaching of the fluorescence dye.
Additional files
-
Supplementary file 1
Sequences of DNA fragments used in this work.
- https://cdn.elifesciences.org/articles/67554/elife-67554-supp1-v2.docx
-
Supplementary file 2
DNA oligonucleotides used in this work.
- https://cdn.elifesciences.org/articles/67554/elife-67554-supp2-v2.docx
-
Transparent reporting form
- https://cdn.elifesciences.org/articles/67554/elife-67554-transrepform-v2.pdf
Download links
A two-part list of links to download the article, or parts of the article, in various formats.
Downloads (link to download the article as PDF)
Open citations (links to open the citations from this article in various online reference manager services)
Cite this article (links to download the citations from this article in formats compatible with various reference manager tools)
CTP promotes efficient ParB-dependent DNA condensation by facilitating one-dimensional diffusion from parS
eLife 10:e67554.
https://doi.org/10.7554/eLife.67554


