The induction of pyrenoid synthesis by hyperoxia and its implications for the natural diversity of photosynthetic responses in Chlamydomonas
- MSU-DOE Plant Research Laboratory, Michigan State University, United States
- Department of Plant Biology, Michigan State University, United States
- Great Lakes Bioenergy Research Center, Michigan State University, United States
- Center for Advanced Microscopy, Michigan State University, United States
- Corporate Strategic Research, ExxonMobil, United States
Figures
Figure 1
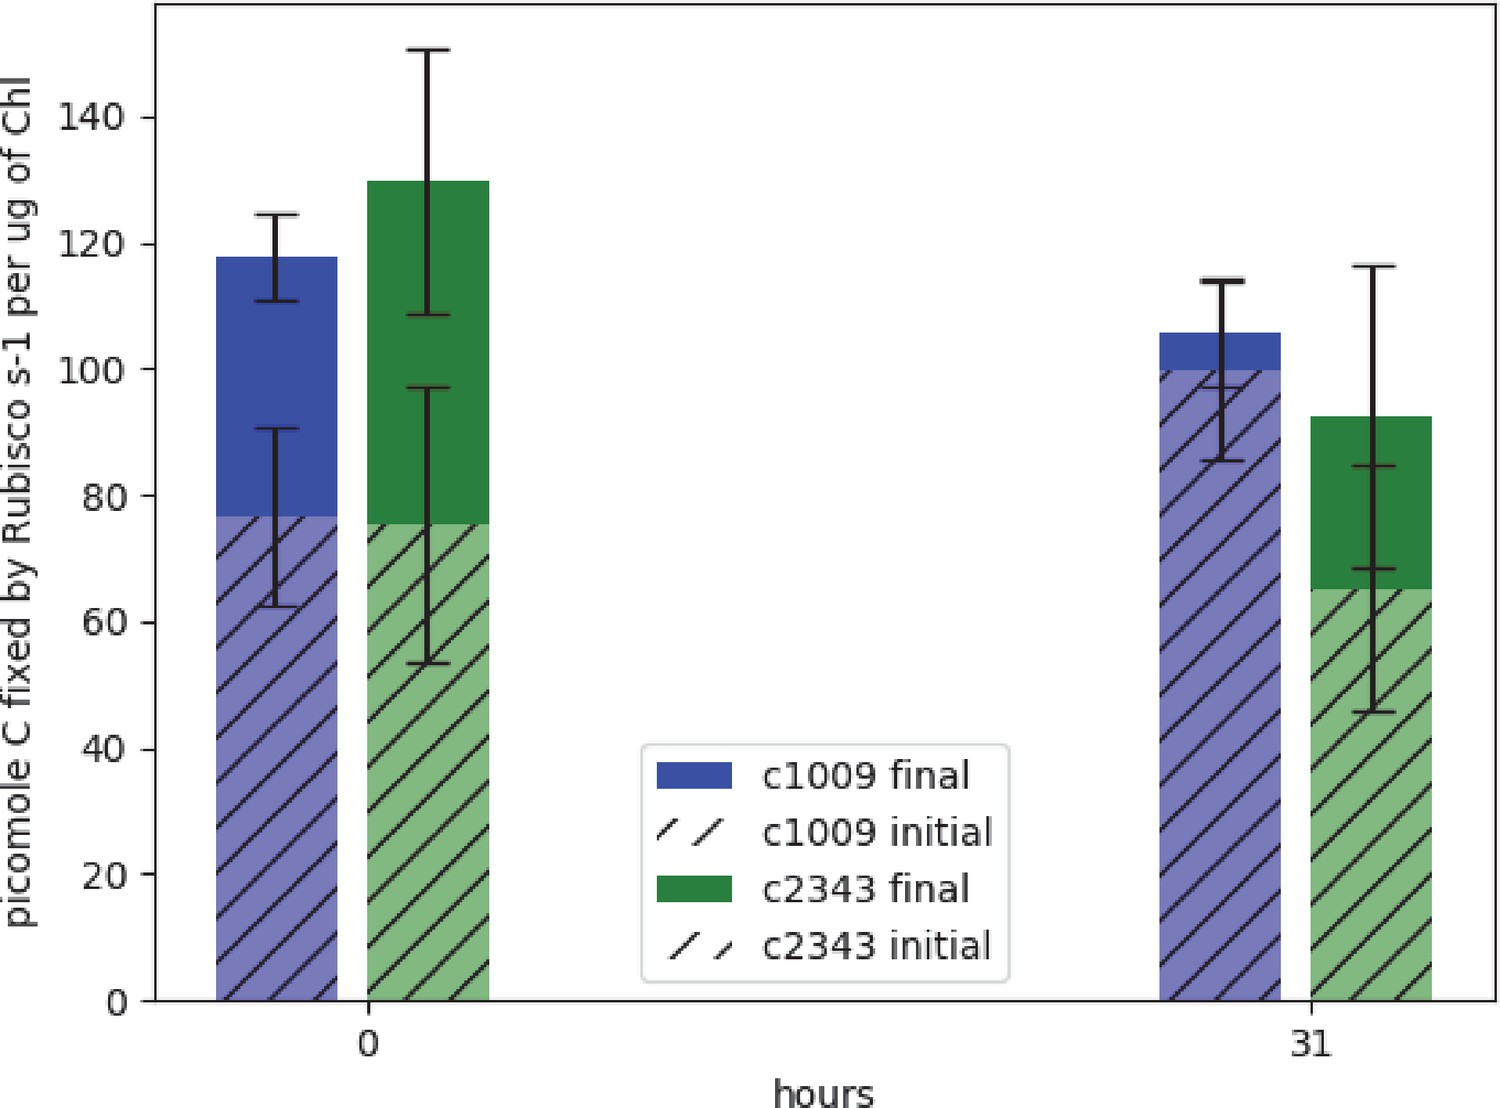
Graph of effects of hyperoxia on activity of rubisco in CC-1009 and CC-2343.
Raw extracts of the cells prior to (zero hours) and after exposure to hyperoxia (31 hr, see Materials and methods) were assayed rapidly (hatched bars), reflecting the native activation state, or after pre-incubation for 10 min in the presence of MgCl2, H12CO3-, and 6-phosphogluconate, which promotes reactivation of inhibited enzyme (solid bars). For the table of values see Supplementary file 1B. Error bars represent the standard deviation of the three biological replicates, each with three technical replicates.
Figure 2
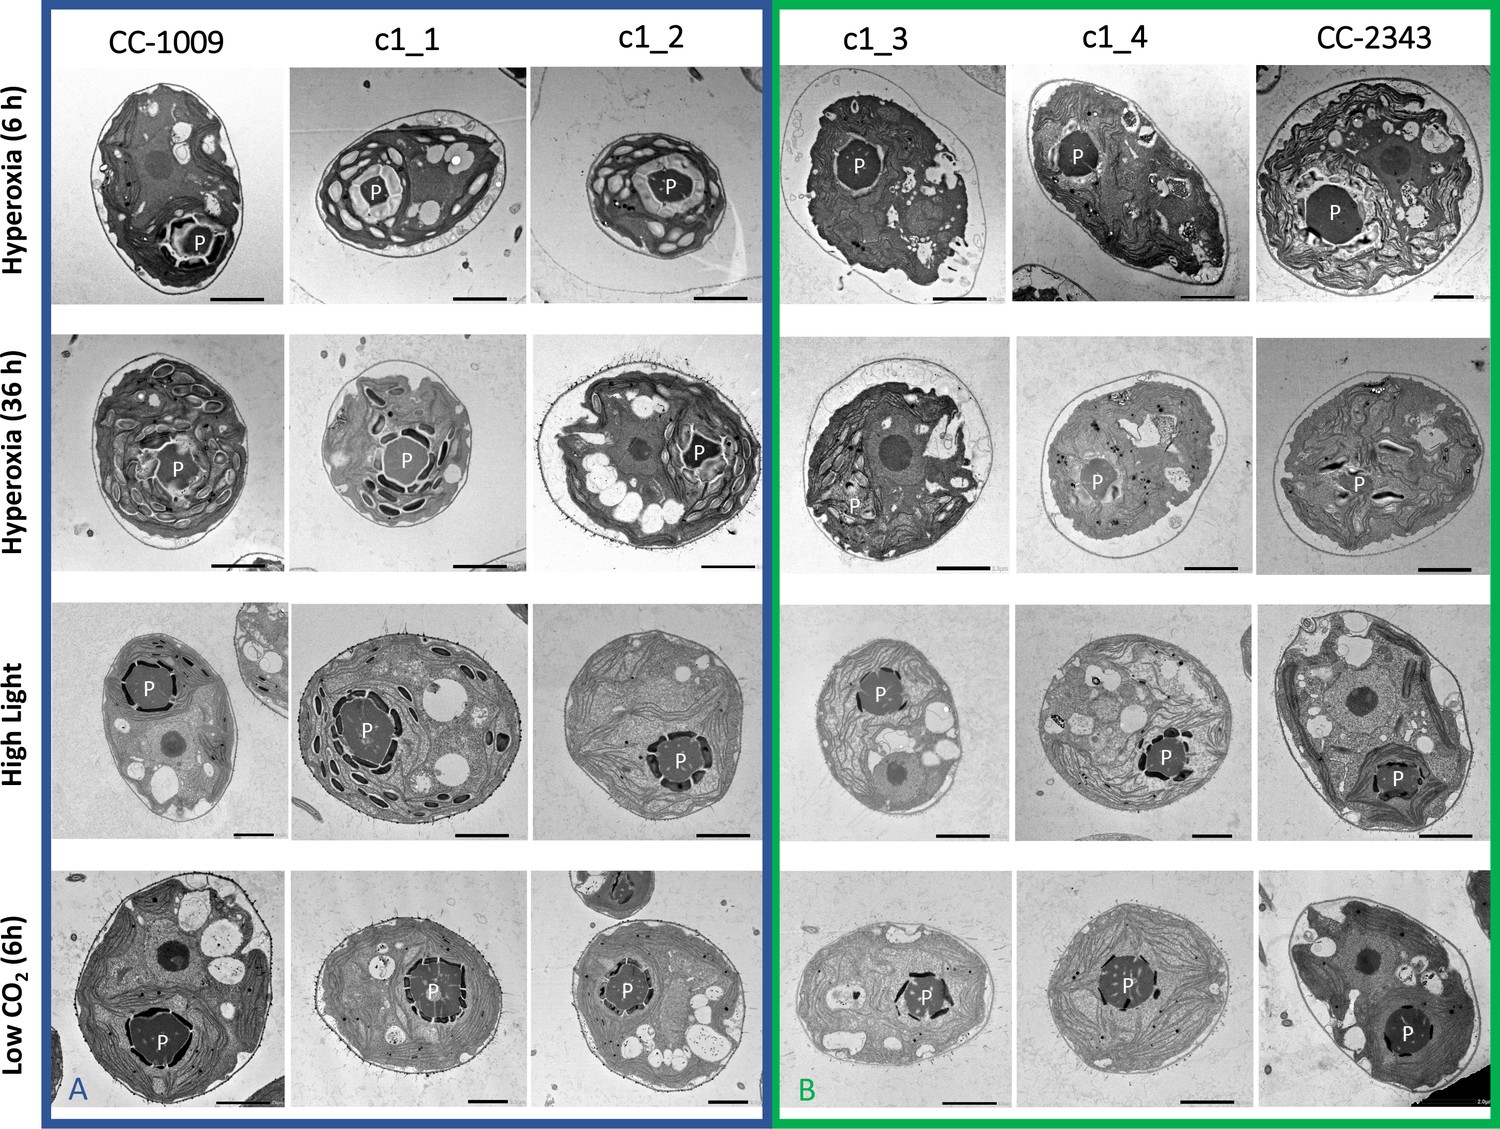
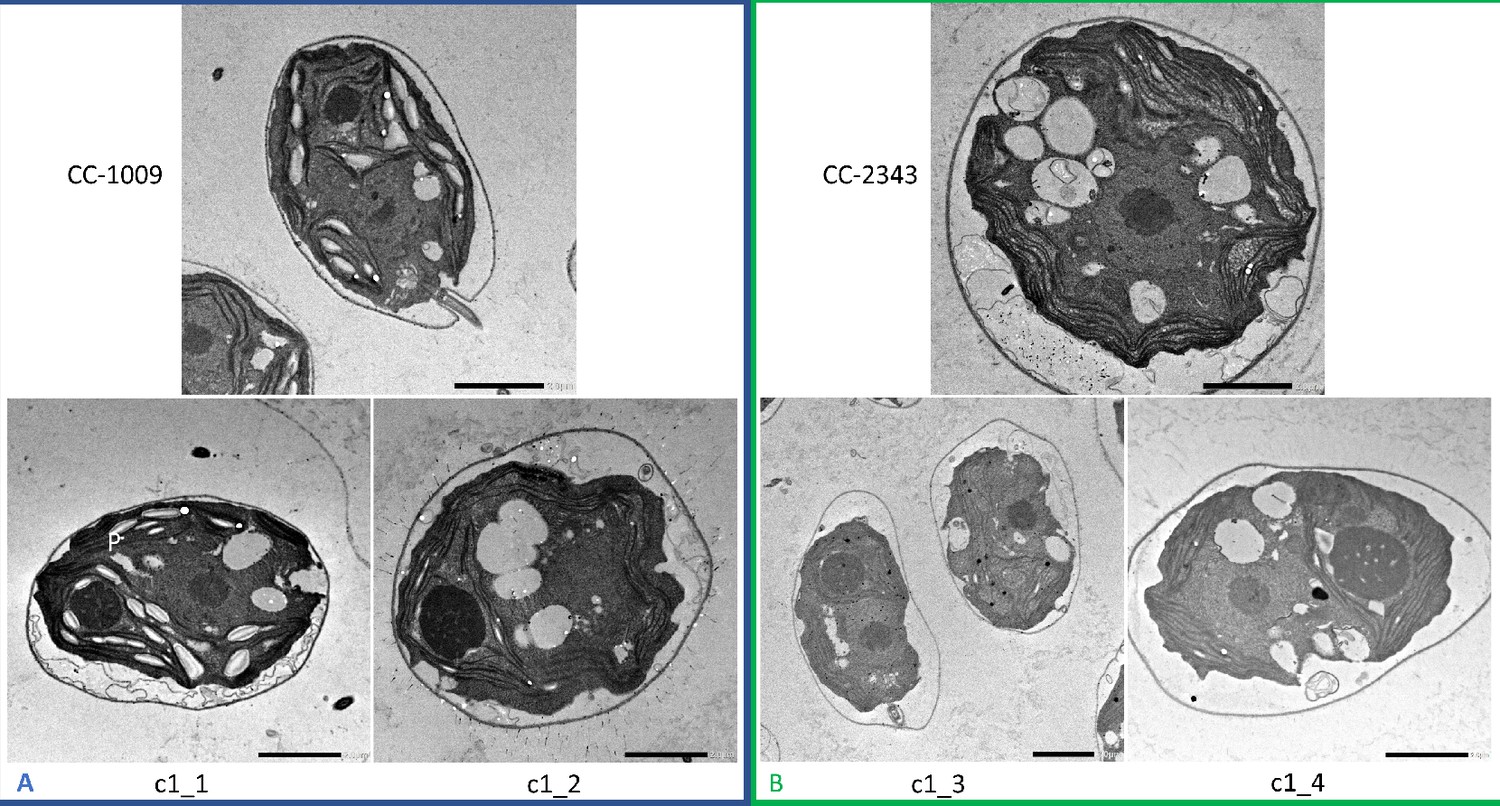
Representative TEM images of Chlamydomonas strains, the parents (CC-1009 & CC-2343), as well as their progeny c1_1, c1_2, c1_3, c1_4.
Panel A shows strains with clearly defined, continuous starch sheath rings around the pyrenoid compartments, while the strains in Panel B have fragmented and porous pyrenoids, particularly under hyperoxia. Under steady state conditions, cells are grown with 5 % CO2 with 14:10 hr (light:dark) sinusoidal illumination with peak light intensity of 2000 μmol m–2 s–1 PAR, in minimal 2NBH media. Here we show cells growing under hyperoxia (i.e. 95 % O2 and 5 % CO2) for 6 and 36 hr, near peak high light intensity under steady state, and low CO2 (6 hr). Cells were fixed at 11:00 am, at 1945 μmoles m–2 s–1 PAR. Pyrenoids are labeled with ‘P’. Scale bar = 2 μm.
Figure 3
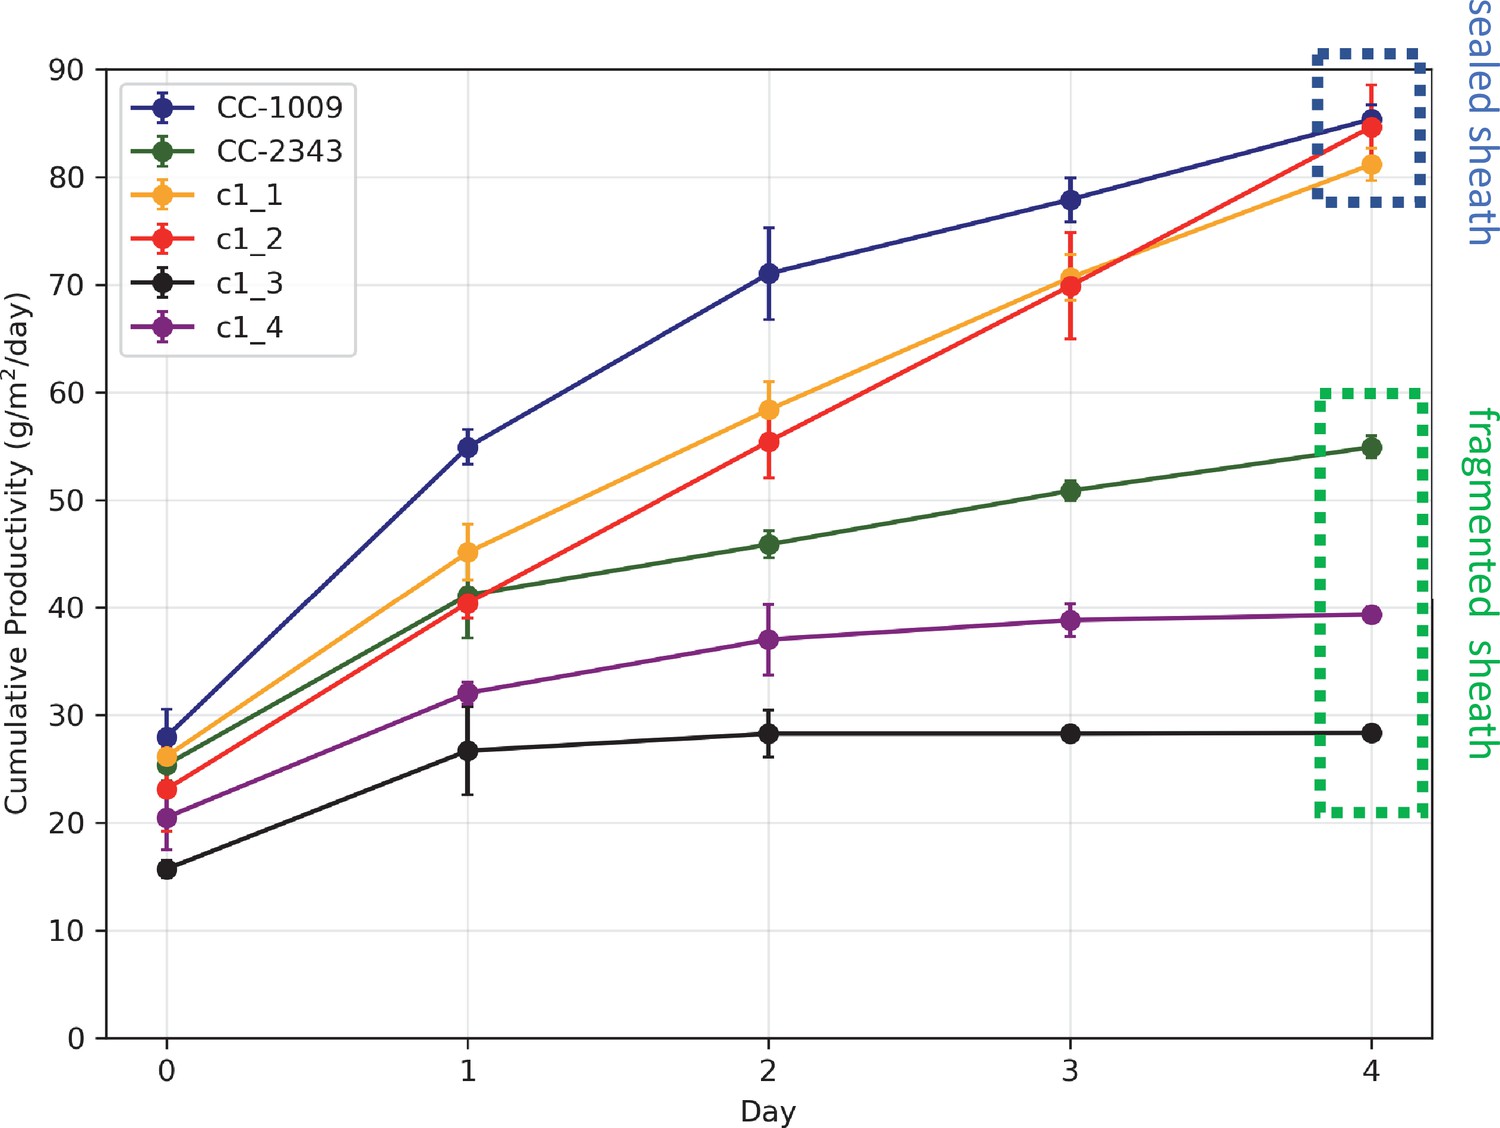
Cumulative biomass productivity following switching the bioreactors over to hyperoxia at dawn on day 0.
Strains CC-1009, c1_1, and c1_2, which all showed continuous, sealed pyrenoids at 6 hours (see Figure 2A) all continued to accumulate biomass after three days of hyperoxia, while CC-2343, c1_3, and c1_4, which had fragmented, porous pyrenoid (Figure 2B) structures, did not, with daily productivities hovering at zero. Visual inspection (via light microscopy) also revealed that the cultures of the intolerant lines by day 3 consisted of severely stressed or dead cells, while the tolerant lines showed cells with continued viability. Prior to exposure to hyperoxia, cultures were grown at steady state (with 5 % CO2 with 14:10 hr (light:dark) sinusoidal illumination with peak light intensity of 2000 μmoles m–2 s–1, in minimal 2NBH media) and at Day 0, the gas was switched to hyperoxia not at midnight but at dawn. Even at steady state, c1_3 had lower growth than the other strains, although this was not true when grown at other conditions (i.e. see Appendix 1—figure 7). Error bars represent standard deviation for three separate reactor experiments. By day 3, c1_3 always ceased growth. Even though productivities had just begun to decline at 6 hr, the pyrenoid structure (i.e. sealed vs. porous Figure 2) paralleled the eventual tolerances.
Figure 4
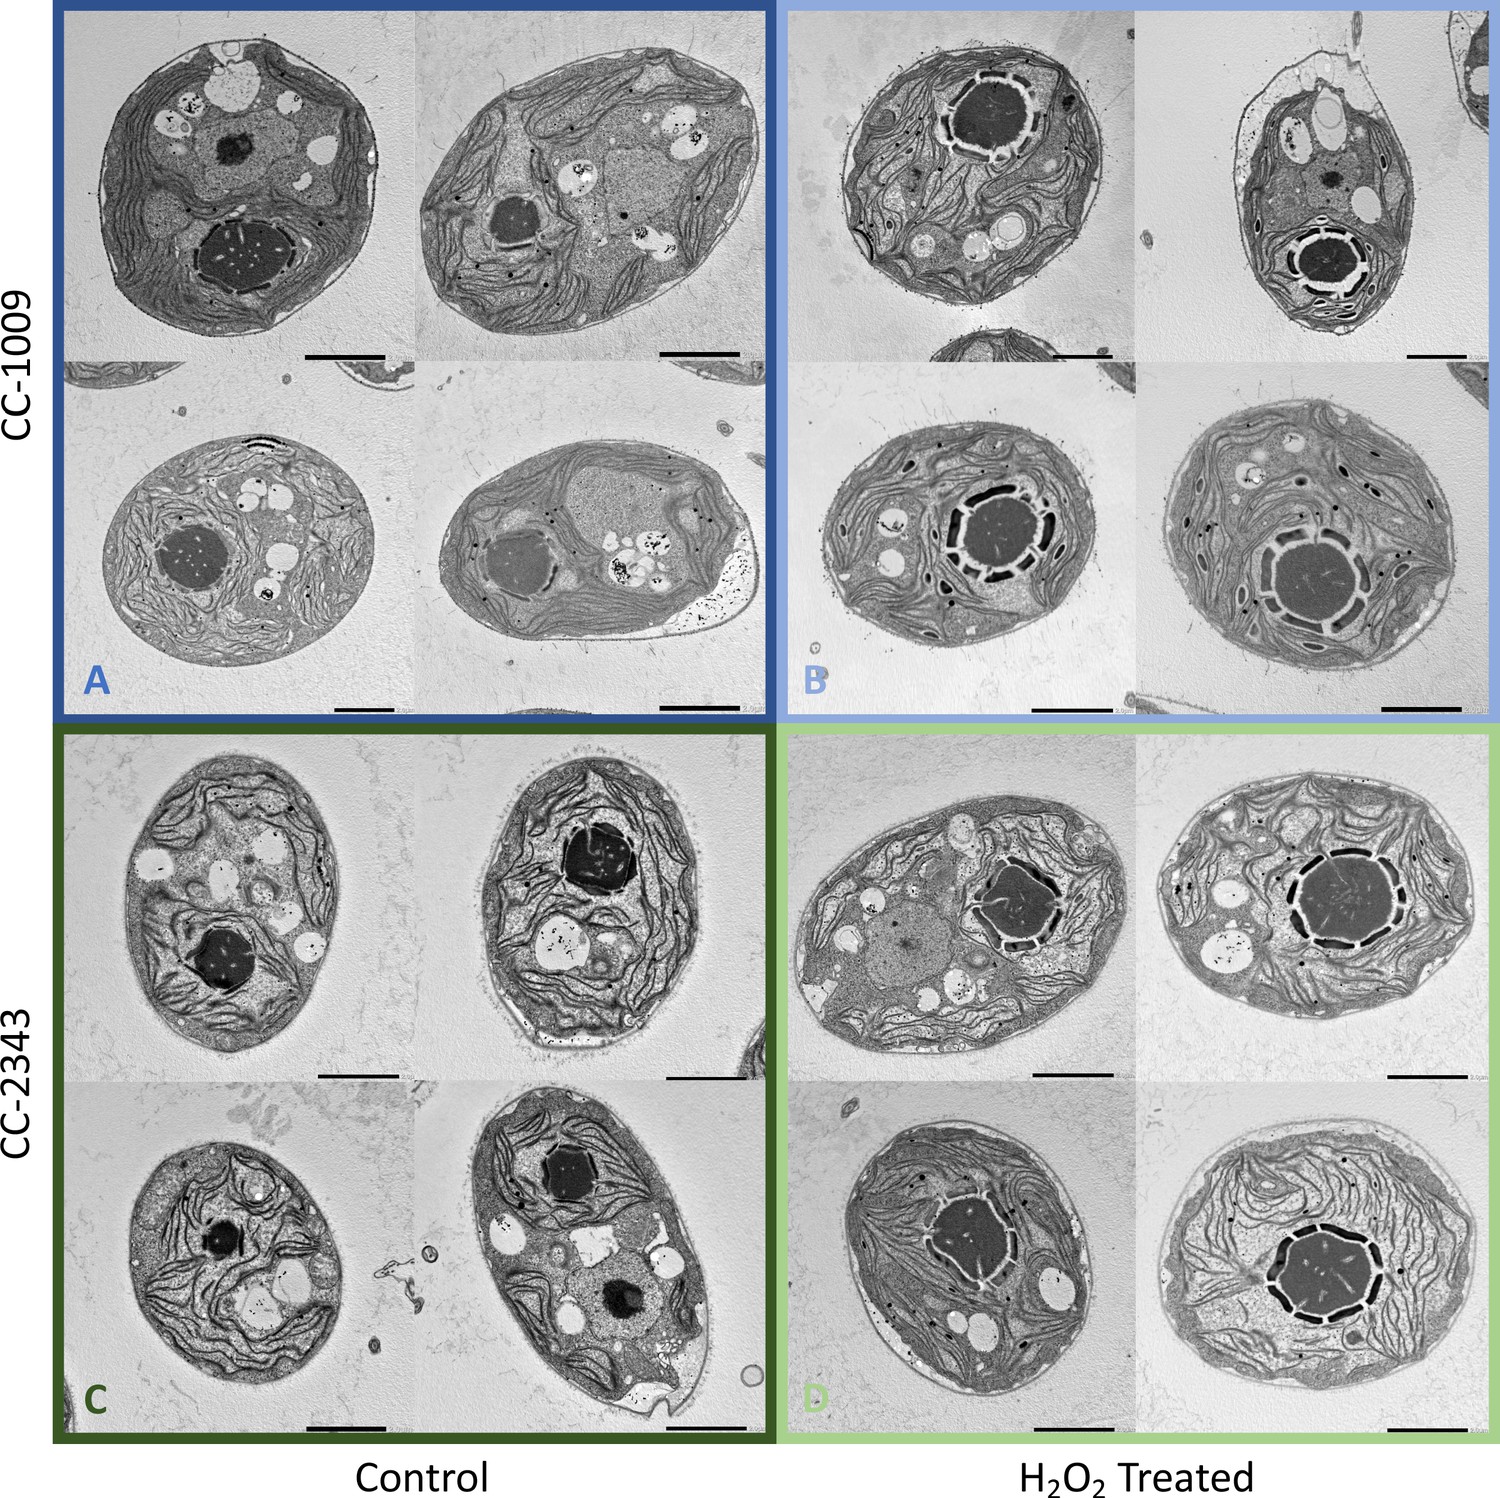
Representative TEM images of CC-1009 (Panels A and B) and CC-2343 (Panels C and D) control and cells treated, at 7:00 am in the morning, 2 hr after our sinusoidal light had turned on, with 100 μM of H2O2, and then exposed to 6 hr of low light (~85 μmol m–2 s–1 PAR) with saturating 5 mM bicarbonate in minimal 2NBH media.
Scale bar = 2 μm.
Figure 5
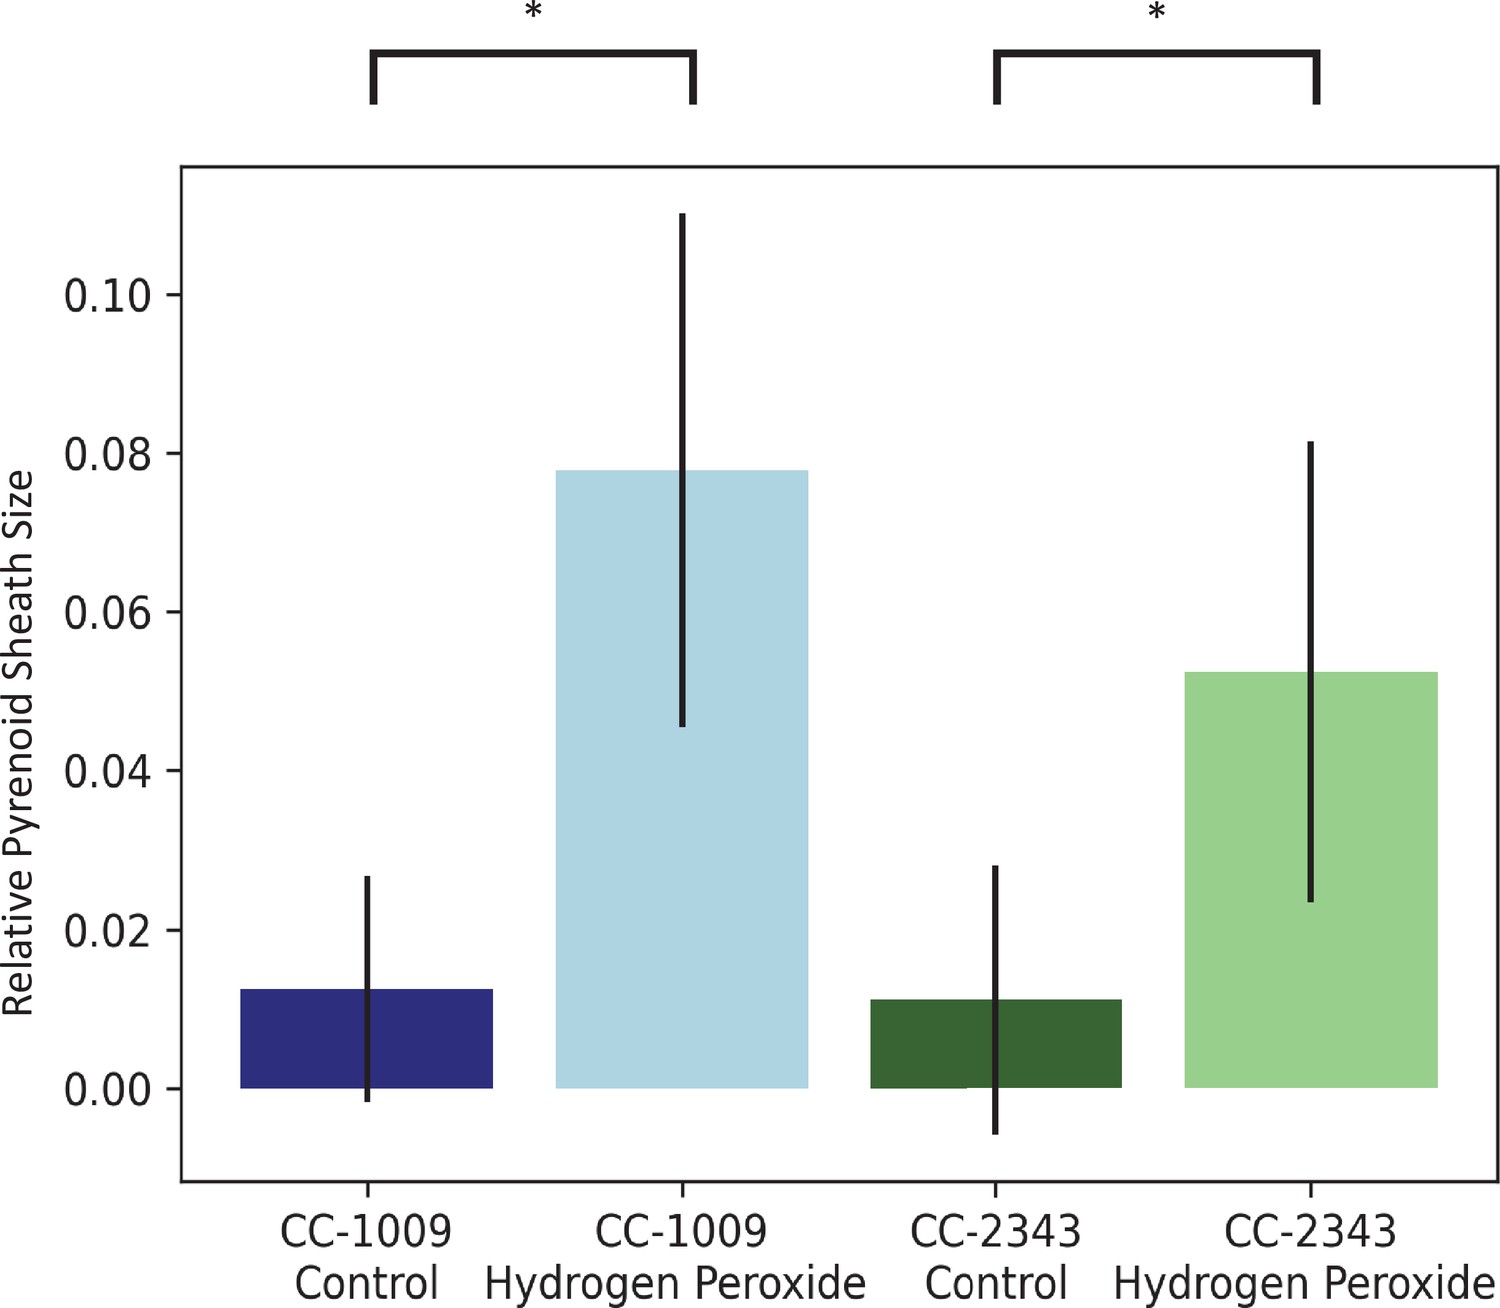
Image J Analysis of CC-2343 and CC-1009 cells, control (green, blue) and exposed to H2O2 (light green, light blue), normalized to cell size.
In response to pre-treatment with H2O2, pyrenoid sheath size increased. Relative pyrenoid sizes were estimated using the ImageJ program by measuring the visible projected areas of starch sheath in TEM images and compared to that of the projected areas of the cells. Error bars represent the standard deviation between the approximately 30 cells analyzed (See Figure 4 and Transparent Reporting Image 7-10). * p < 0.001.
Figure 6
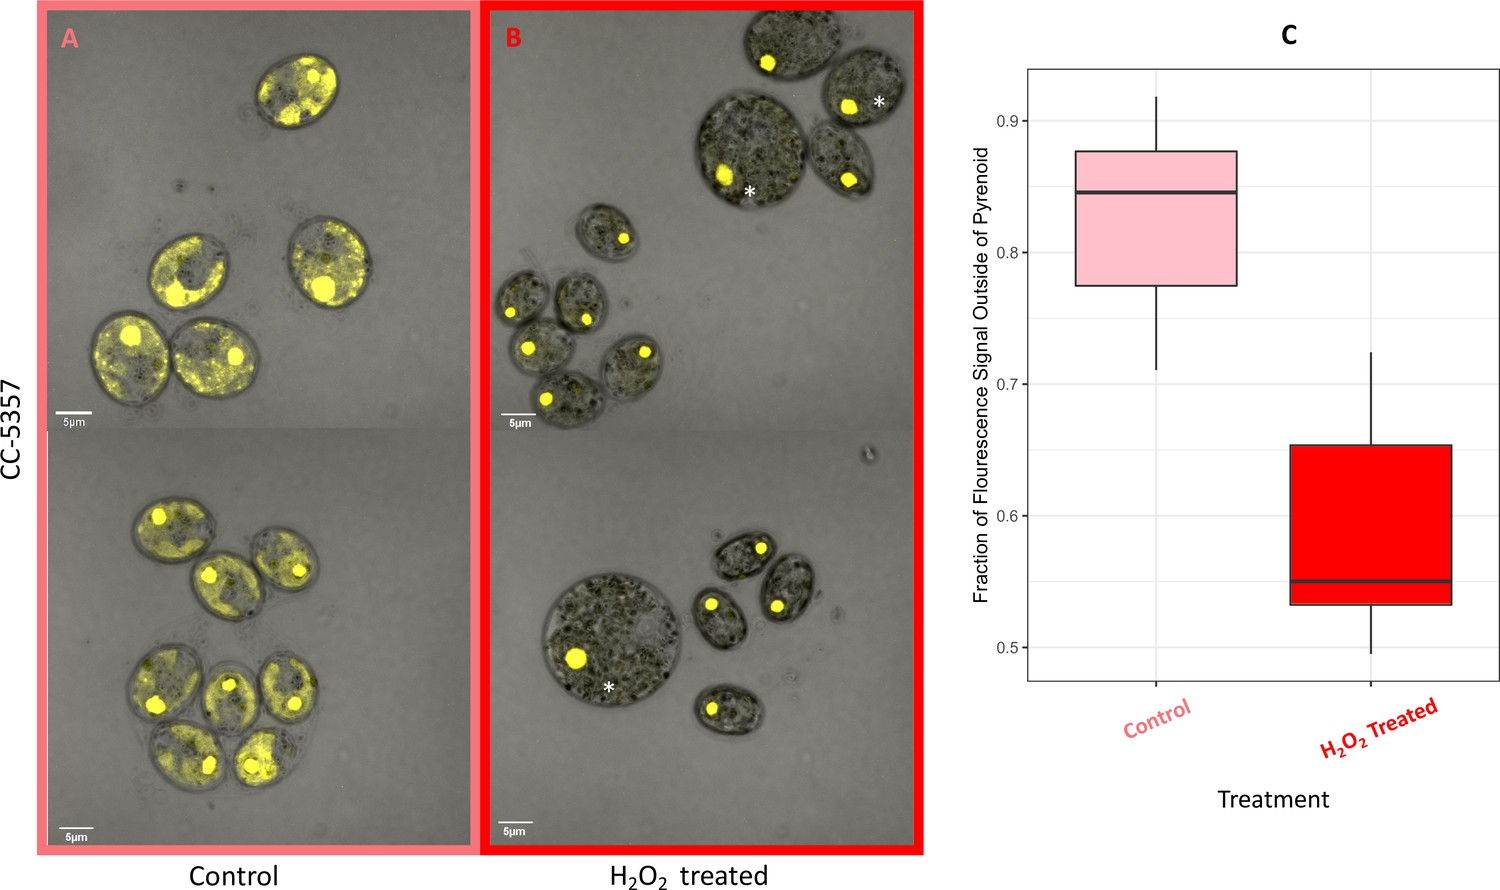
(Photos) Localization of rubisco determined by confocal microscopy of strain CC-5357, containing a RbcS1-Venus (Bar Graph, Panel C).
Average intensity of fluorescent signal within a cell, outside of the pyrenoid region, without (A, minus) and with (B, plus) the addition of hydrogen peroxide. The average fluorescence intensity of the delocalized Venus Fluorescent Protein-labeled rubisco within Chlamydomonas cells was measured using the Olympus FluoView 1,000 Advanced Software. For each cell measurement, a region encircling the Chlamydomonas cell membrane but excluding the pyrenoid was delineated and the average fluorescence intensity within the designated region was calculated. For each treatment, measurements were performed on approximately 20 cells from three separate areas, although more areas of cells were viewed to verify the consistency of the phenotype. Cells with * were excluded from analysis to allay concerns that they may be bloated and could bias results. Fluorescence was excited using 3 % Argon gas laser intensity. Fluorescence emission was recorded through 530–630 nm band pass filter using a photomultiplier detector with a high voltage of 831. Differences were statistically significant (p < 0.001). Scale bar = 5 μm.
Figure 7
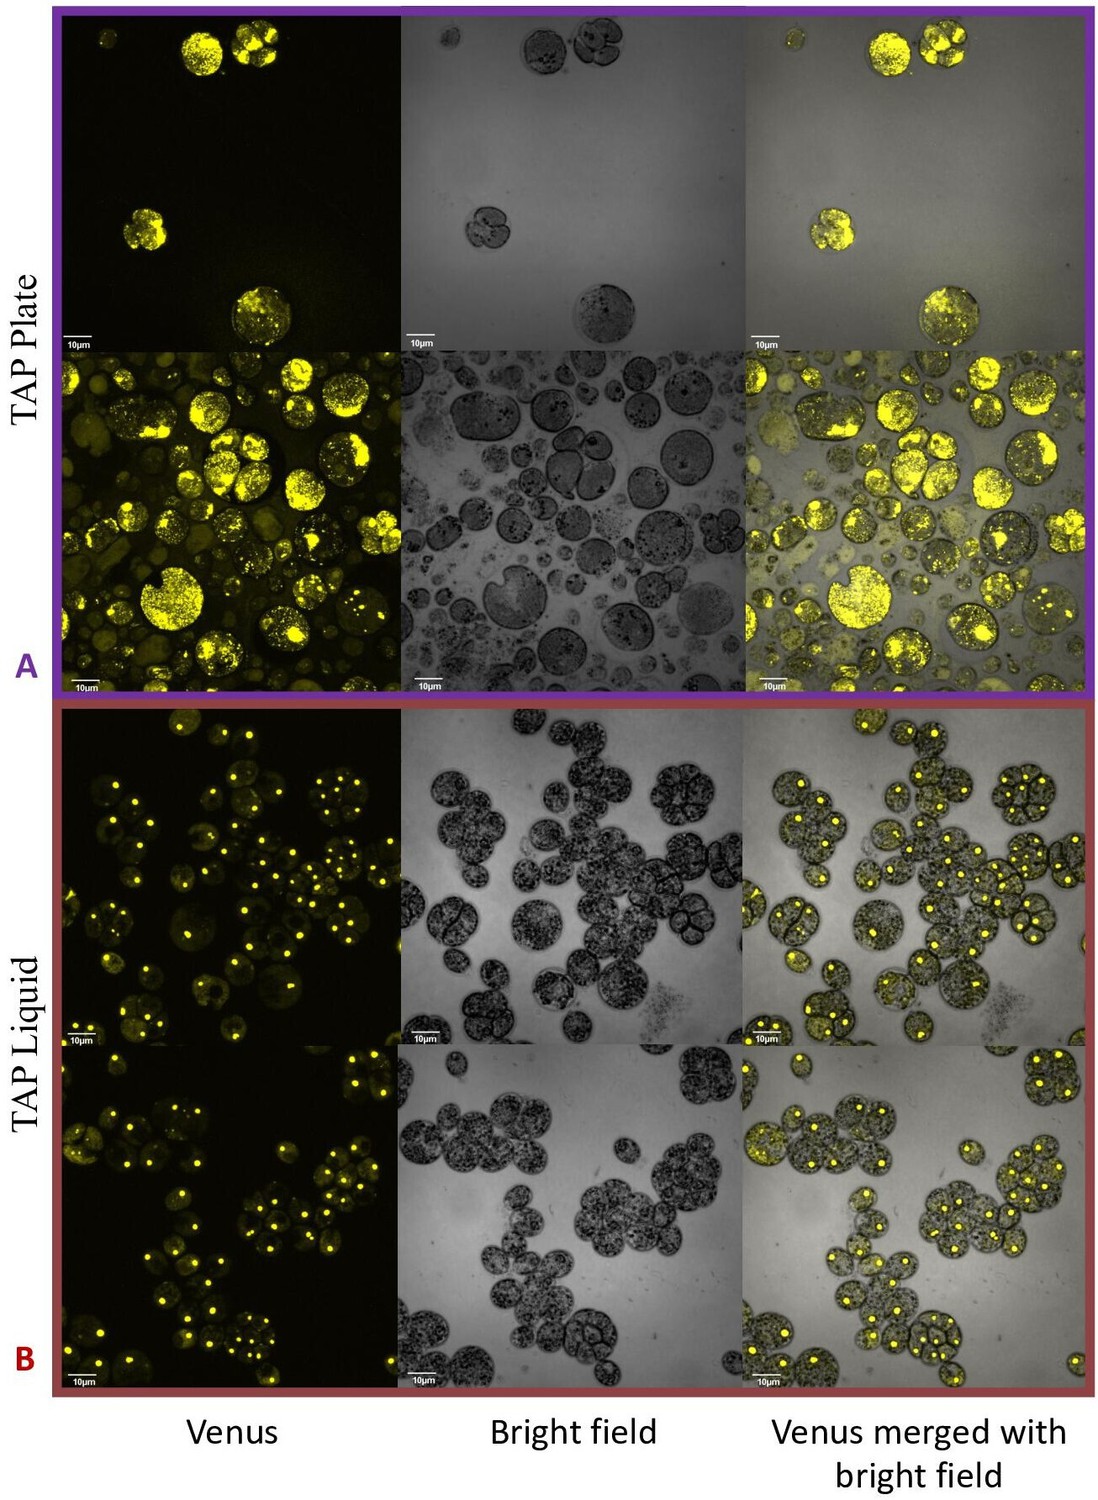
Confocal microscopy of CC-5357, which has a Venus labeled RbcS1, after being grown in on a TAP plate (Top, Panel A) showing rubisco completely de-localized and liquid TAP (bottom, Panel B), showing that rubisco has de-localized to some extent, but remains largely localized.
Scale bar = 10 μm.
Figure 8
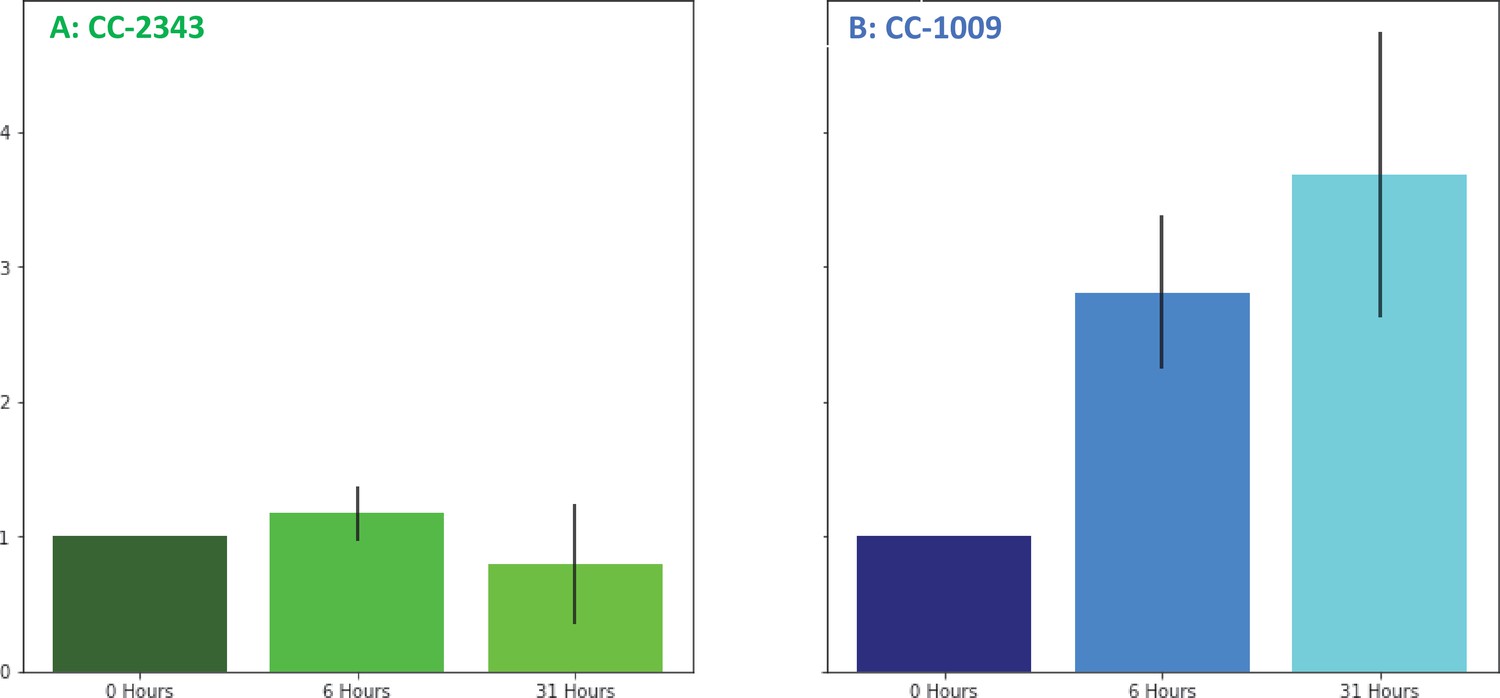
Changes in H2O2 in cellular extracts upon exposure to hyperoxia.
Cells of CC-2343 (Panel A) and CC-1009 (Panel B) were rapidly broken and extracts assayed using the Amplex Red method just prior to (0 hr) and at 6 and 31 hr exposure to 95 % O2, 5 % CO2, as described in Materials and methods. Values shown are normalized to those taken at 0 hr, when the values normalized to the extract’s protein contents were 3.37 μM for CC-2343 (Panel A) and 0.456 μM for CC-1009 (Panel B). Error bars represent the standard deviation among three biological replicates.
Figure 9
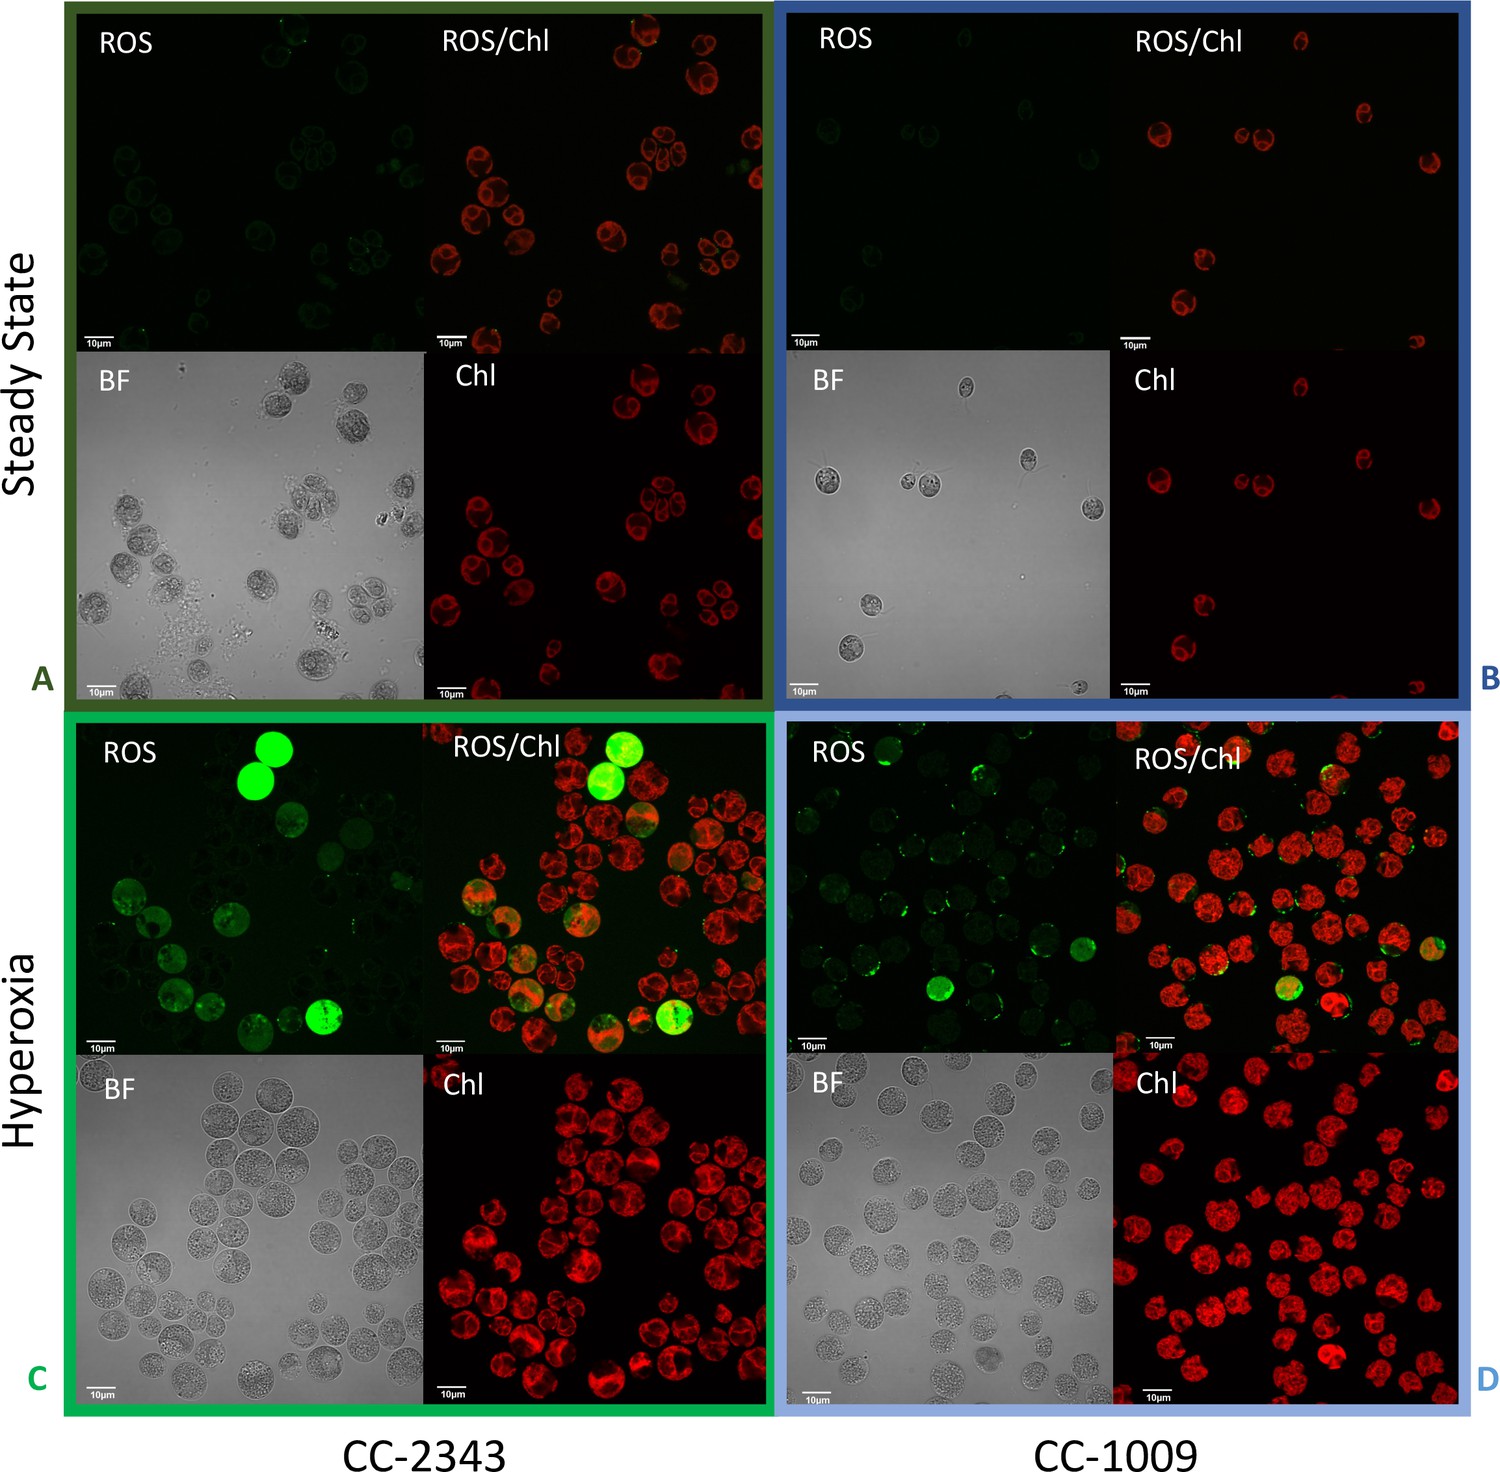
Confocal microscopy images of CC-2343 and CC-1009 showing ROS in cells growing at steady state (Panels A and B) and following exposure to approximately 31 hr of hyperoxia (Panels C and D) of CC-2343 and CC-1009.
H2DCFDA, a nonfluorescent probe that is converted into fluorescent dichlorofluorescein (DCF) by ROS, was used to detect the ROS. The ROS is indicated by the green fluorescence, while the auto-fluorescence of the chloroplasts is displayed in red. ROS, reactive oxygen species; Chl, chlorophyll; BF, bright field. Scale bars = 10 μm.
Figure 10
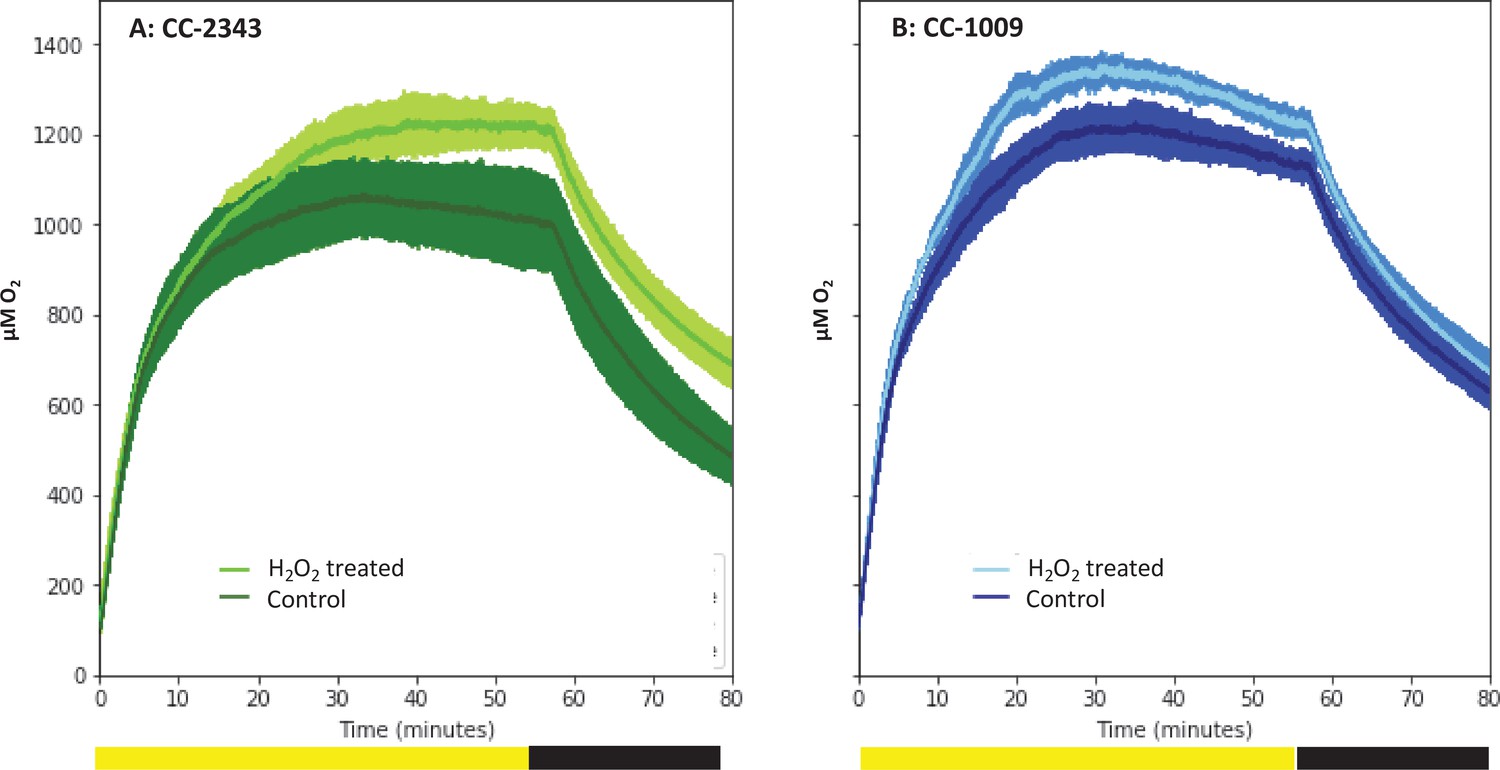
Oxygen evolution of strain CC-2343 (Panel A) and CC-1009 (Panel B) with and without the pre-treatment of 100 µM H2O2.
Shading represents 95 % confidence intervals between the three biological replicates for each treatment. At approximately 3500 seconds (denoted by yellow bar on x axis), the light was turned off denoted by black bar on x axis. All measurements were done on centrifugation-concentrated cells resuspended to the same chlorophyll concentration (40 μg/ml).
Appendix 1—figure 1
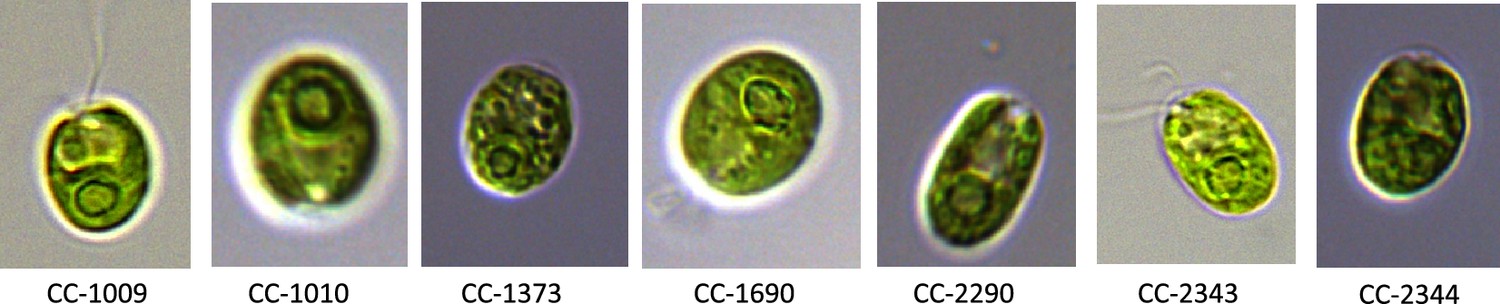
Exemplary pictures of ecotypes which were examined in this study showing various pyrenoid formations, with CC-1009 and CC-1010 exhibiting “closed” types.
Cultures were grown within flasks in minimal (2NBH) media under 50 μmoles m–2 s–1 of PAR.
Appendix 1—figure 2

Panel (A) Photo of five days after 50 ml of fresh 2NBH media was inoculated to 1 × 10⁵ cells/ml, and cultures were continuously bubbled with 5 % CO2 and 95 % O2.
Panel (B) Graph of cell counts and chlorophyll content. Error bars represent the standard deviation of the two biological replicates.
Appendix 1—figure 3
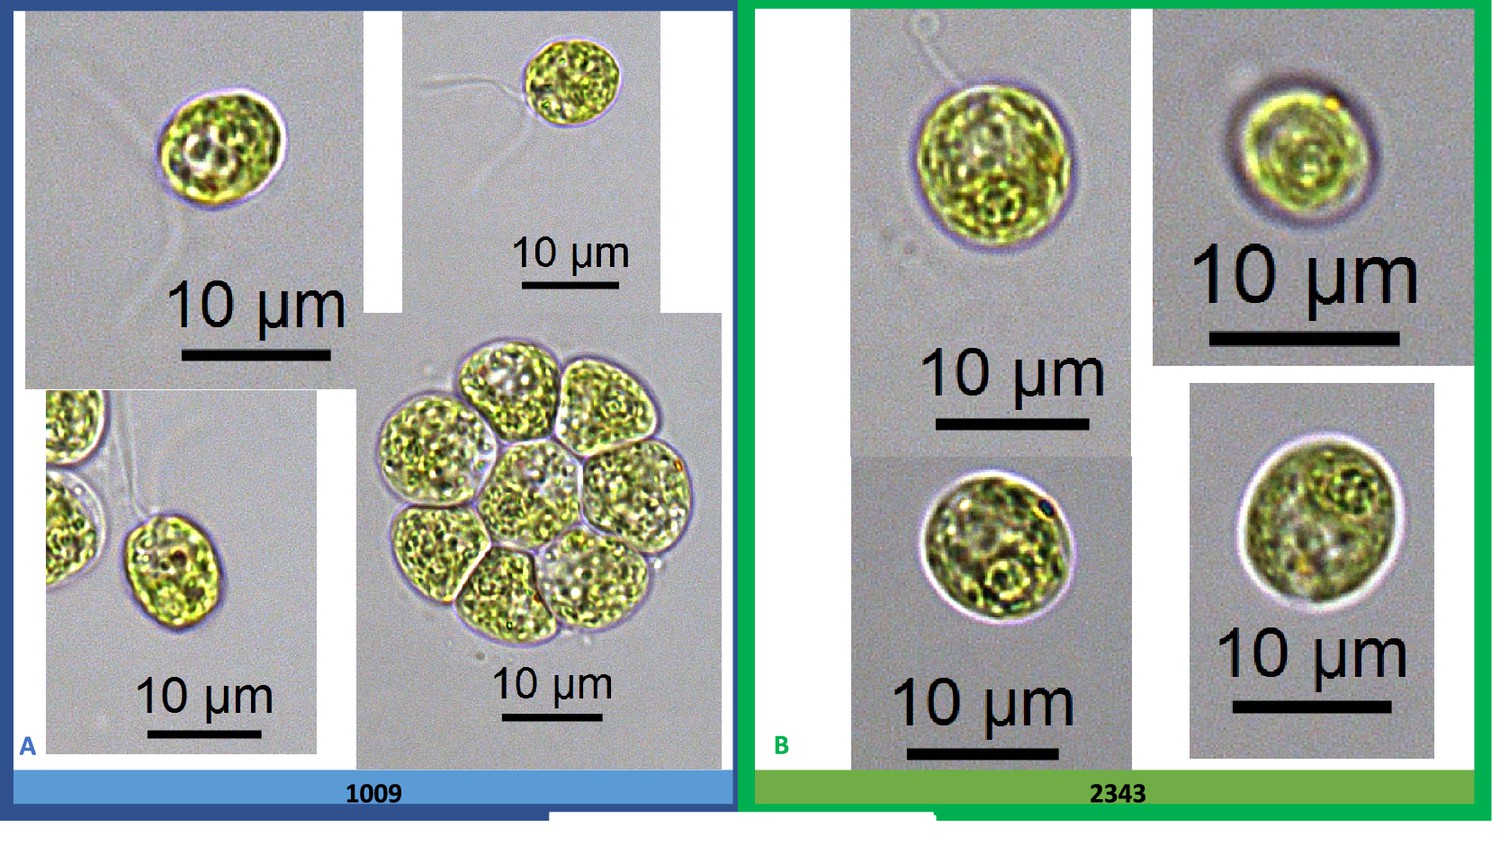
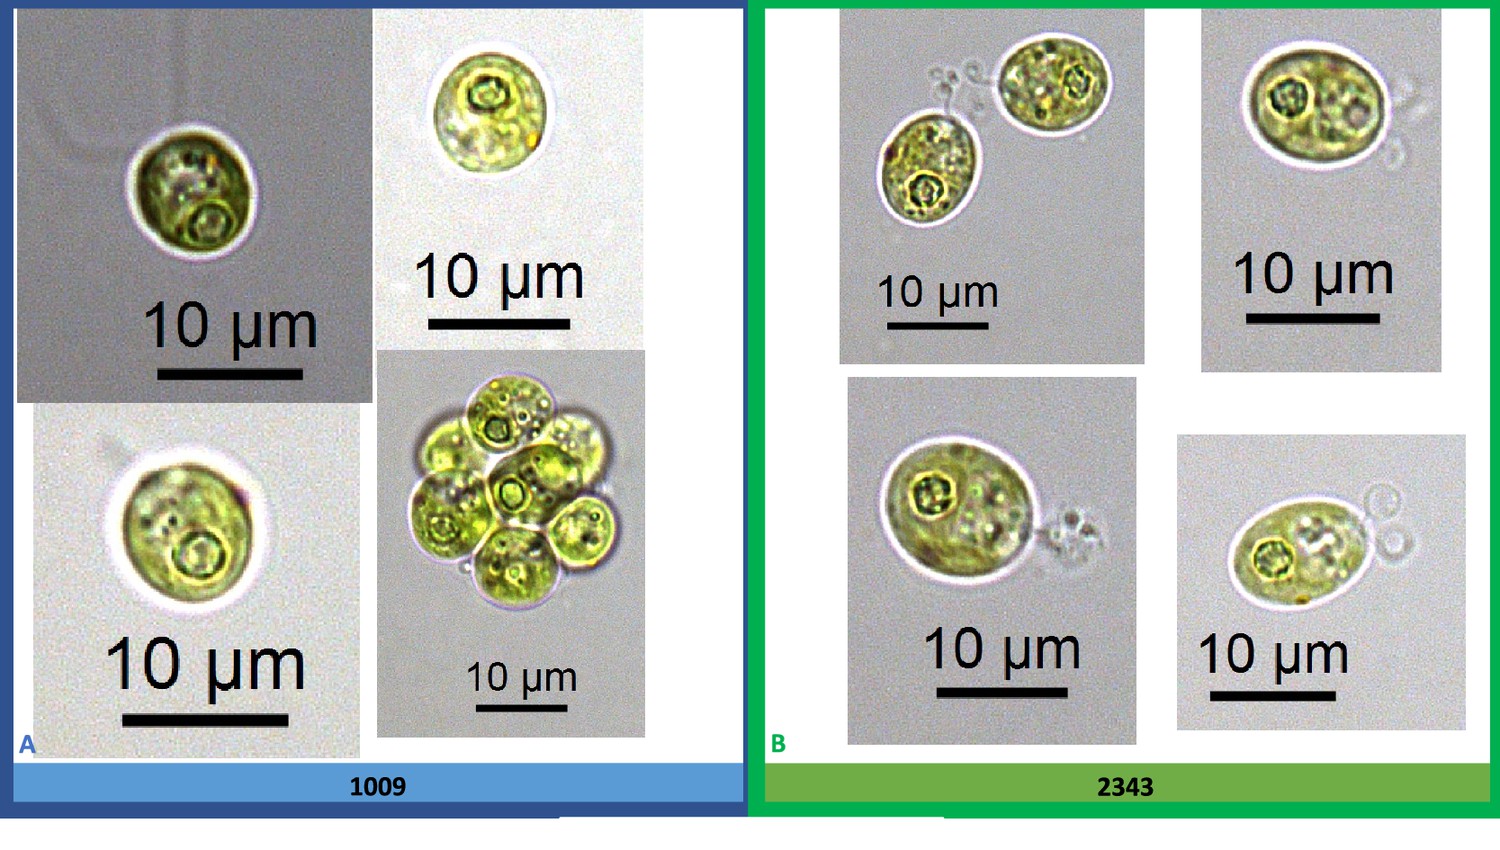
Exemplary light microscopy images of Chlamydomonas strains CC-1009 (Panel A) and CC-2343 (Panel B), while growing under saturating CO2.
Cells are growing with 5 % CO2 with one minute on/one minute off sparging, and 14:10 hour (light:dark) sinusoidal illumination with peak light intensity of 2000 μmoles m–2 s–1, in minimal 2NBH media. Cells here were viewed at approximately noon, at 2000 μmoles m–2 s–1.
Appendix 1—figure 4
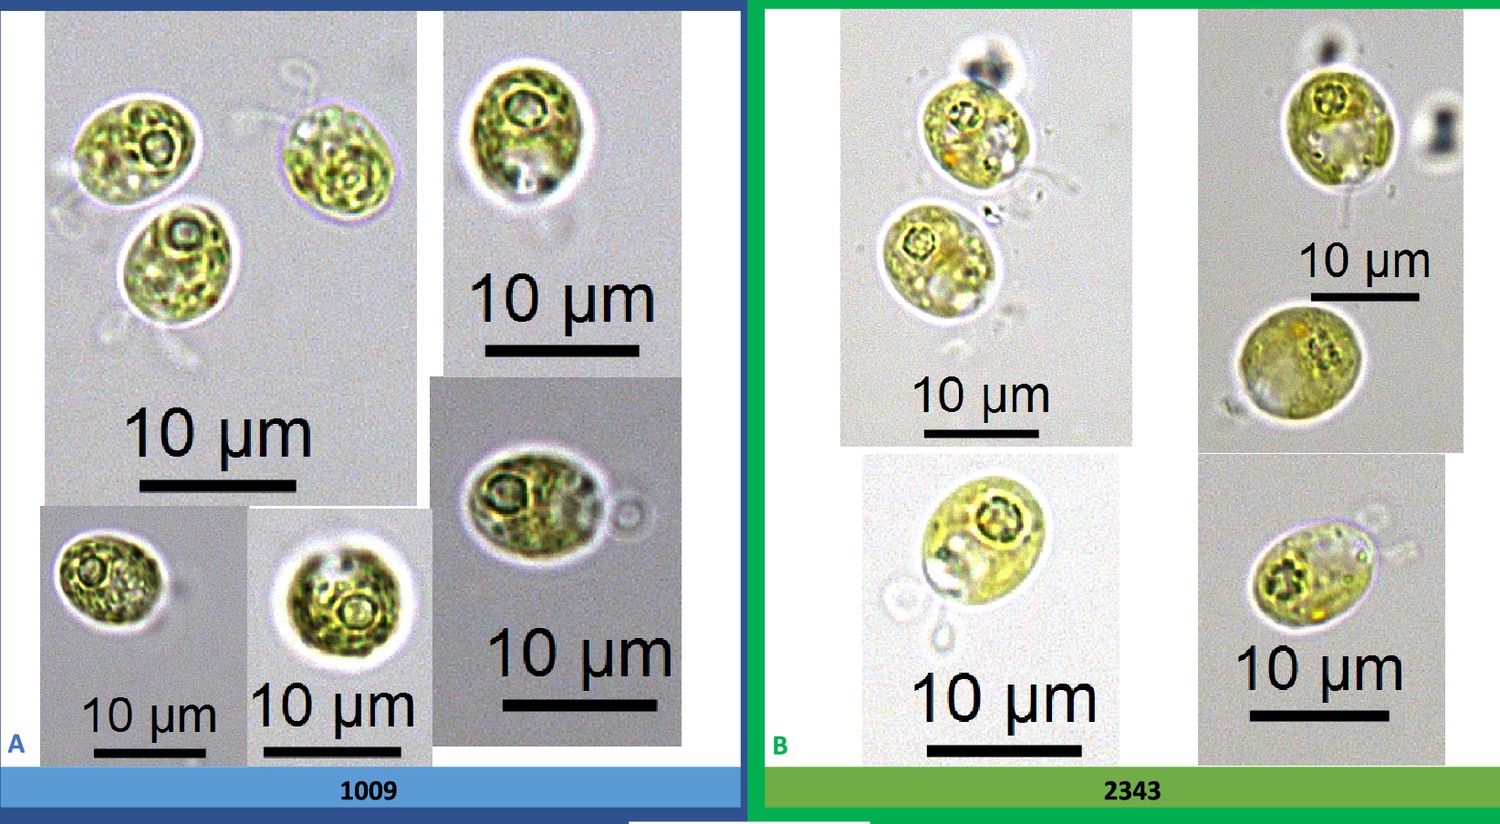
Exemplary light microscopy images of Chlamydomonas strains CC-1009 (Panel A) and CC-2343 (Panel B), after growing under saturating CO2 and hyperoxia for over 6 hours.
Pyrenoid starch sheaths were clearly visible. Cells are sparged with 5 % CO2 and 95 % O2, with one minute on/one minute off sparging, and 14:10 hour (light:dark) sinusoidal illumination with peak light intensity of 2000 μmoles m–2 s–1, in minimal 2NBH media. Prior to switching the gas to hyperoxia (i.e. 95 % O2 and 5 % CO2) cells had been grown in steady state conditions. Cells here were viewed around 1:00 pm, at ~1945 μmoles m–2 s–1.
Appendix 1—figure 5
Exemplary light microscopy images of Chlamydomonas strains (CC-1009 & CC-2343), after growing under saturating CO2 and hyperoxia for 31 hours.
Differences were observed between the pyrenoids of the cells in Panel A and Panel B, with the cells in Panel A showing more robust, continuous, sealed pyrenoids. Cells are sparged with 5 % CO2 and 95 % O2, with one minute on/one minute off sparging, and 14:10 hour (light:dark) sinusoidal illumination with peak light intensity of 2000 μmoles m–2 s–1, in minimal 2NBH media. Prior to switching the gas to hyperoxia (i.e. 95 % O2 and 5 % CO2) cells had been grown in steady state conditions. Cells here were viewed at noon, at 2000 μmoles m–2 s–1.
Appendix 1—figure 6
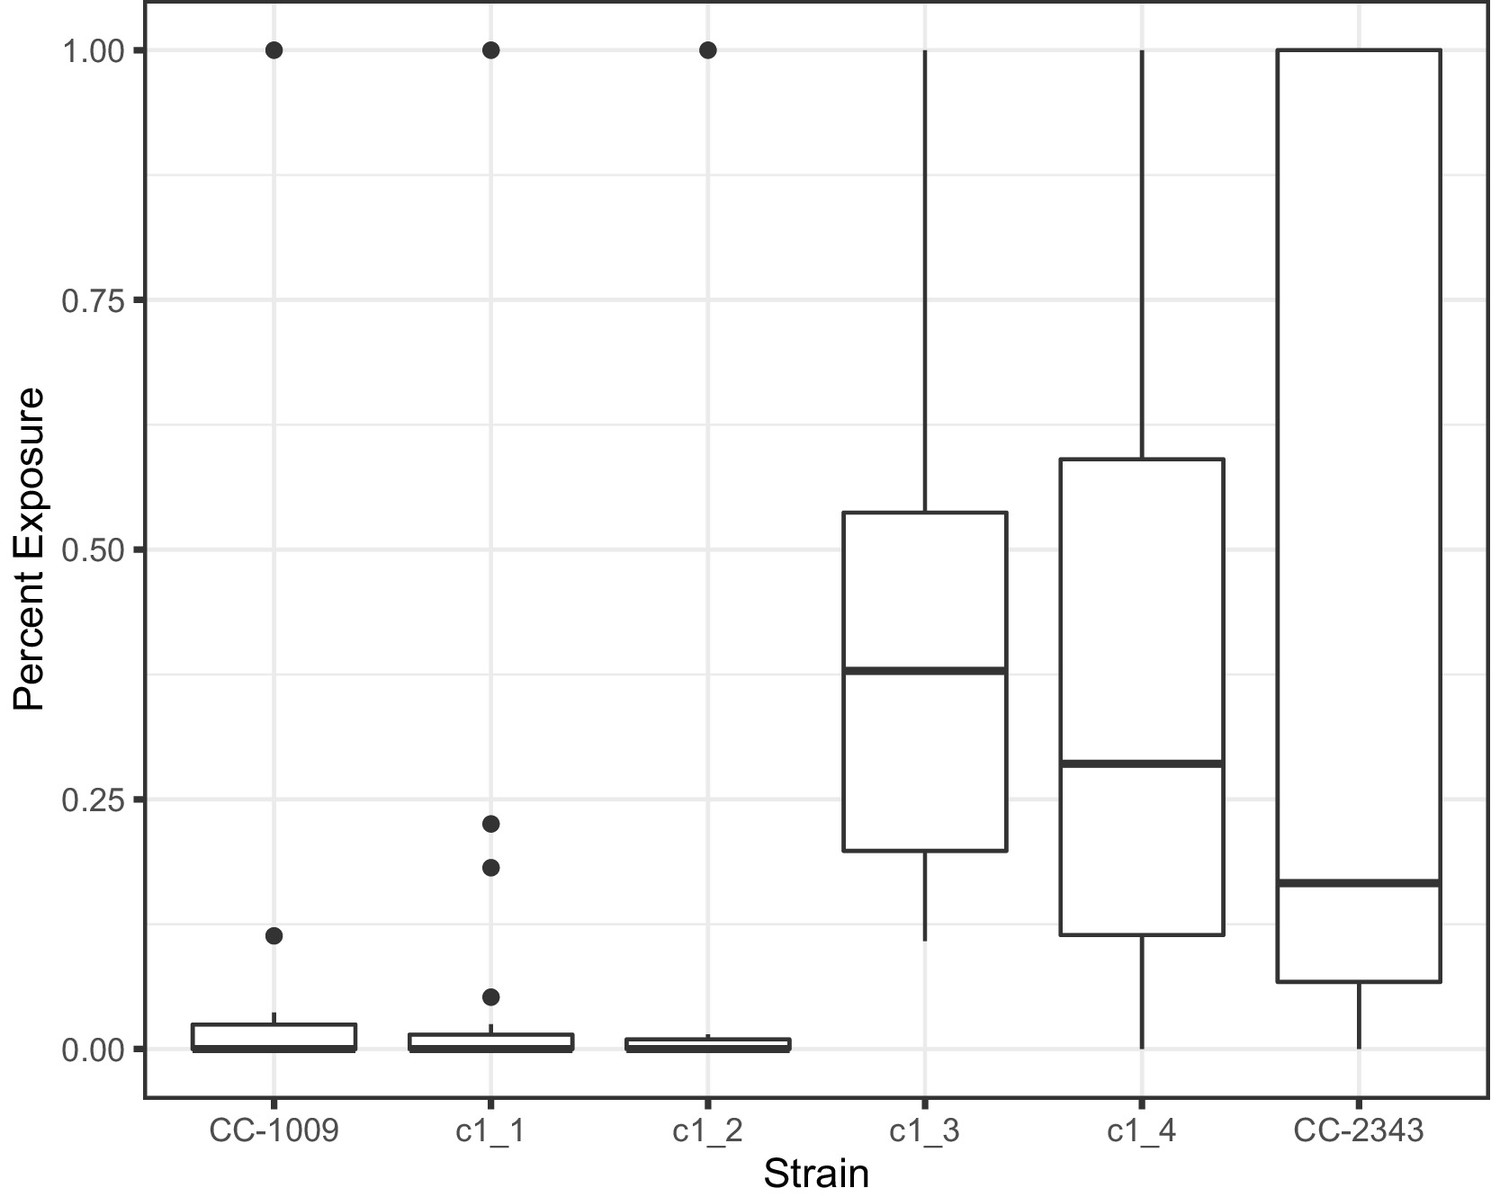
Measurement of percent of pyrenoid with gaps present in respective cell lines at 6 hours hyperoxia.
Statistically significant differences (P < 0.05) were found when comparing any of the lines with continuous pyrenoids (CC-1009, c1_1, and c1_2) to the lines with porous pyrenoids (CC-2343, c1_3, c1_4). At least 24 randomly selected cells were analyzed of each strain.
Appendix 1—figure 7
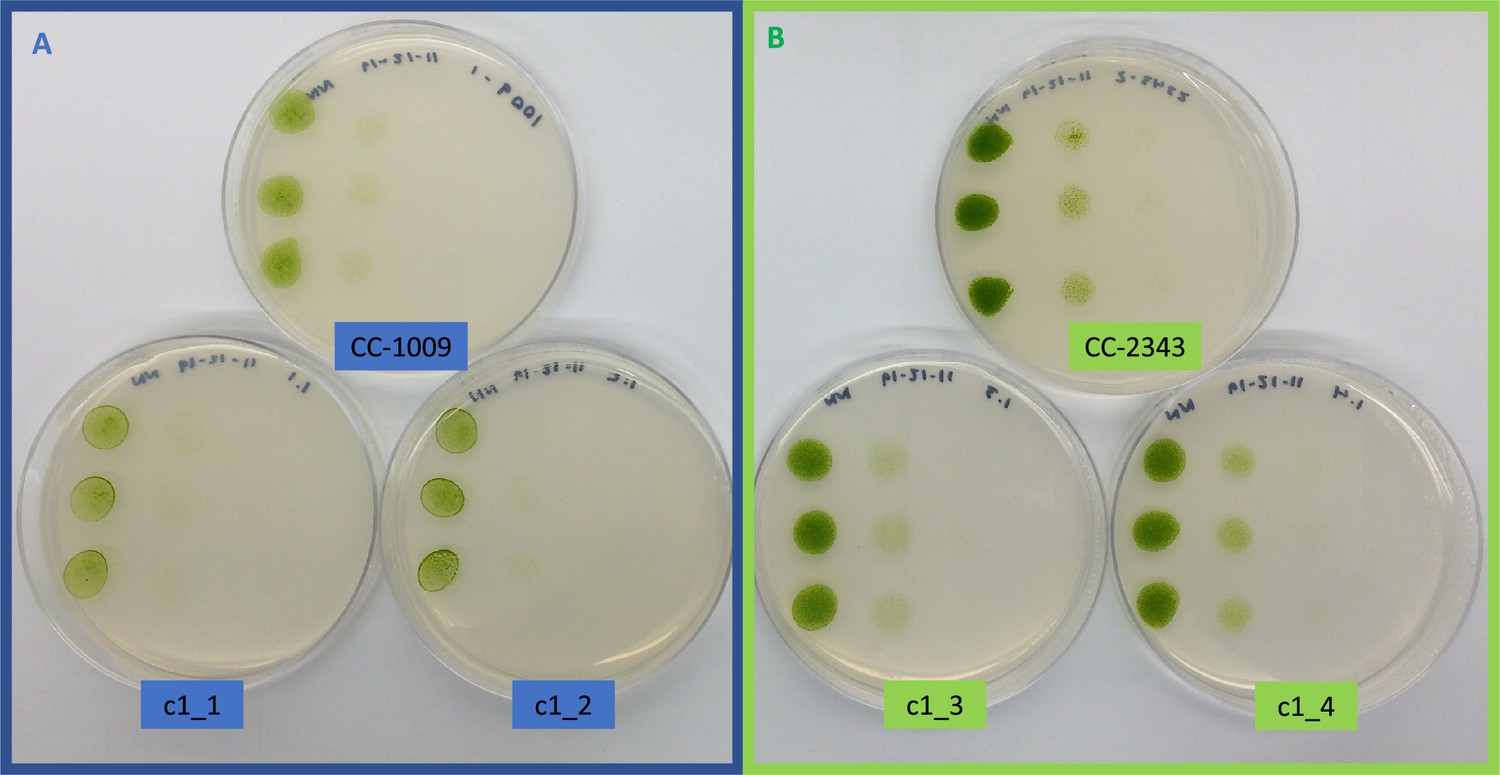
Growth of parents (CC-1009 and CC-2343) and F1 tetrad offspring following the serial dilution, by column, of a cultures on TAP agar plates.
Rows are replicate dilutions. Photo was taken 3 days after plating. The oxygen intolerant lines (Panel B) all clearly grew better than the tolerant line (Panel A). See Figure 3 for graph of oxygen tolerance.
Appendix 1—figure 8
ΦII values of spotted plates of parents and tetrad after one week, with c1_3, and c1_4 not showing any obvious higher level of electron transport, despite higher growth rates.
Measurements shown here were under 50 μmoles m–2 s–1 PAR, though similar results were obtained up to 1500 μmoles m–2 s–2.
Appendix 1—figure 9
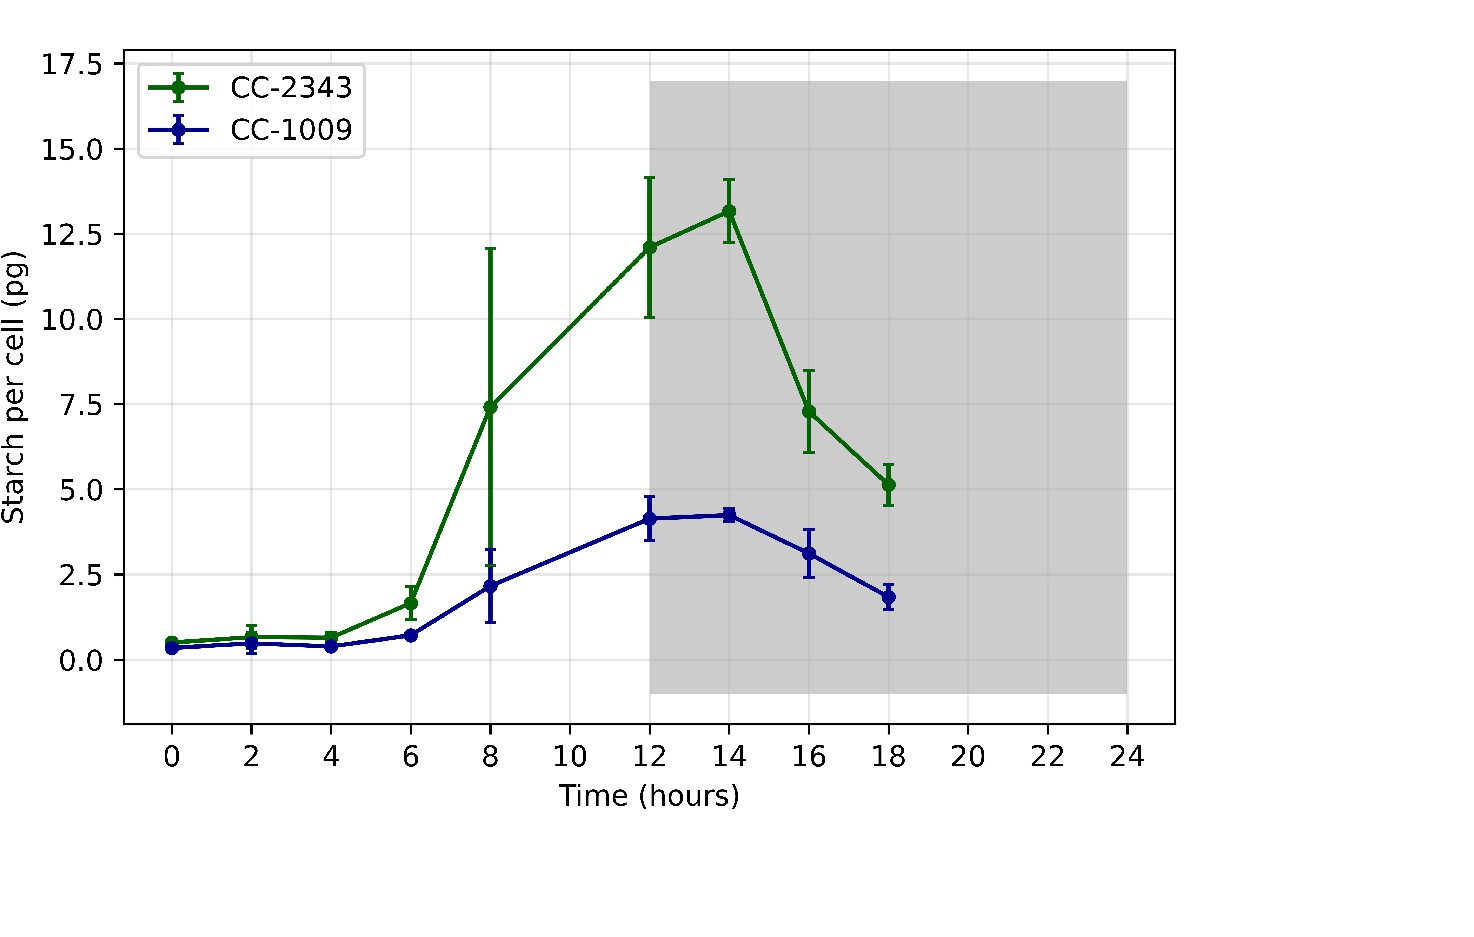
Total starch accumulated (pg/cell) in CC-1009 and CC-2343 cultures grown at steady state conditions, with 5 % CO2 with 14:10 hour (light:dark) sinusoidal illumination with peak light intensity of 2000 μmoles m–2 s–1, in minimal 2NBH media.
Appendix 1—figure 10
Representative TEM images of Chlamydomonas strains, the parents (CC-1009 & CC-2343), as well as their progeny c1_1, c1_2, c1_3, c1_4, having been sparged with CO2 for 30 seconds every hour during the night.
Under these conditions, both the strains in Panel A and B have not formed a pyrenoid starch sheath. Cells had been grown in steady state conditions in minimal 2NBH media, with 5 % CO2 in air with 14:10 hour (light:dark) sinusoidal illumination with peak light intensity of 2000 μmoles m–2 s–1. Cells here were fixed two hours after dawn, at 7:00 am, when light levels were 825 μmoles m–2 s–1. Pyrenoids appeared absent or mostly unsheathed in these conditions. Scale bar = 2 μm.
Appendix 1—figure 11
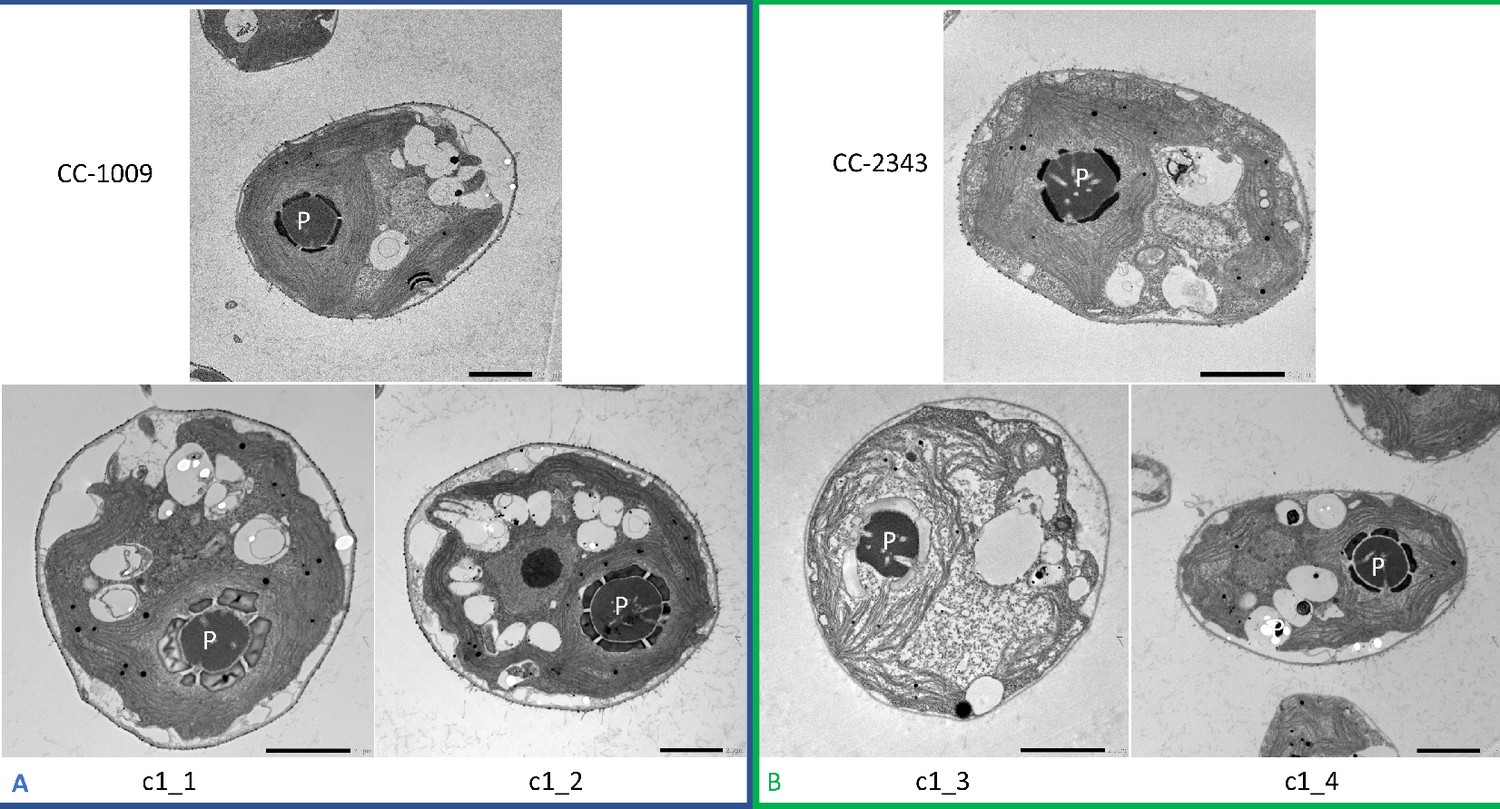
Representative TEM microscopy images of Chlamydomonas strains, the parents (CC-1009 & CC-2343), as well as their progeny c1_1, c1_2, c1_3, c1_4.
Images taken 31 hours after the culture had been switched to from 5 % to low (i.e. ambient) levels of CO2. Prior to switching the gas to ambient levels of CO2, cells had been grown in steady state conditions, with 5 % CO2 with 14:10 hour (light:dark) sinusoidal illumination with peak light intensity of 2000 μmoles m–2 s–1, in minimal 2NBH media. At this time point, the differences in the pyrenoids were not as apparent between the two groups (Panel A vs. B). Cells here were fixed at 11:00 am, at 1945 μmoles m–2 s–1. Pyrenoids are labeled with “P.” Scale bar = 2 μm.
Appendix 1—figure 12
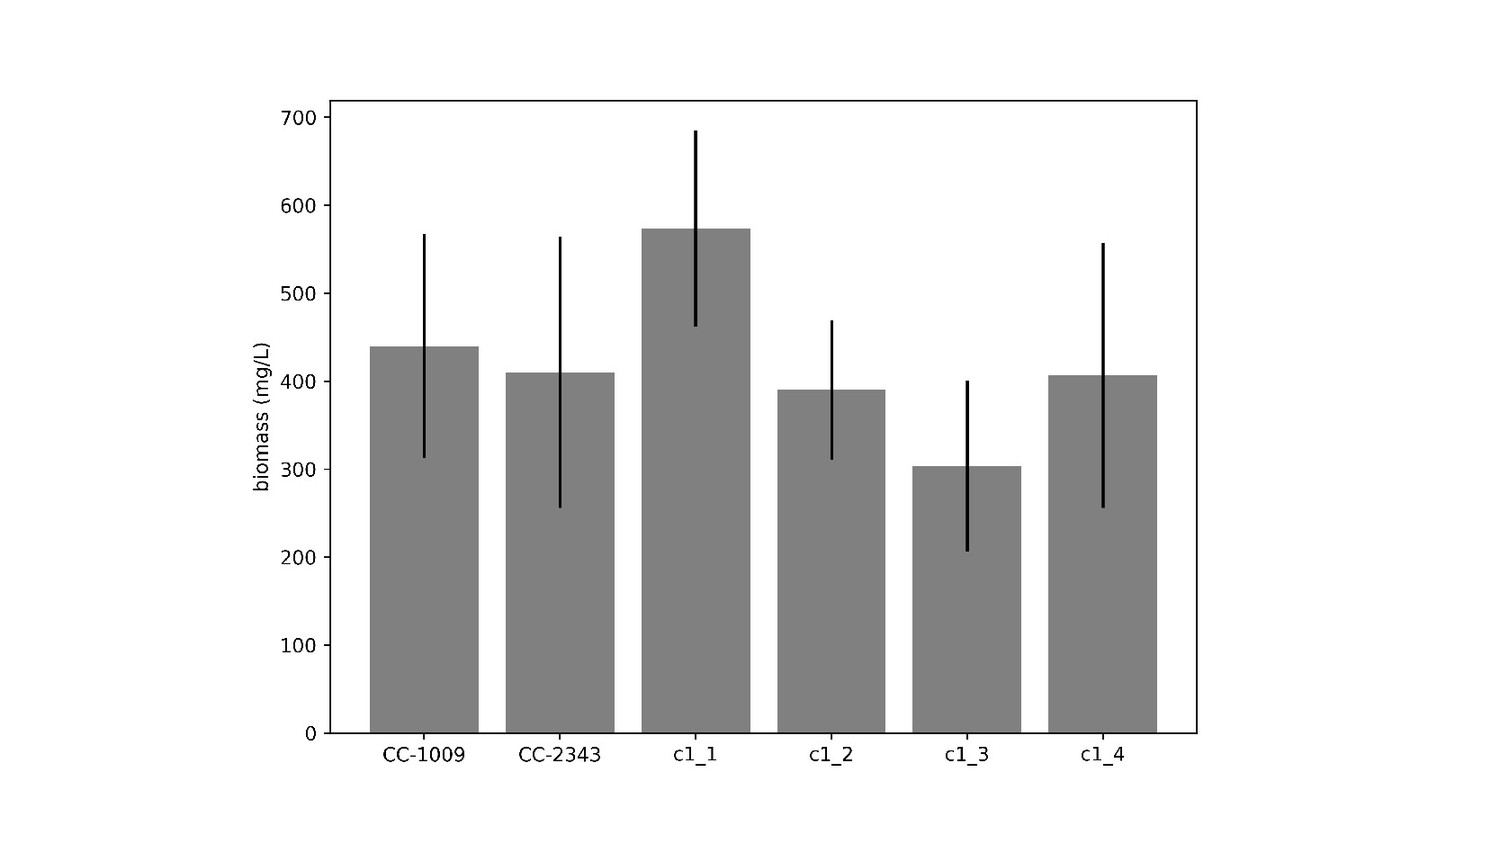
Biomass measurement of CC-1009, CC-2343, and tetrad progeny grown in flasks under 85 μmoles m–2 s–1 PAR and low CO2 for 4 days, after each flask was inoculated with 1 × 10⁵ cells/ml.
Measurements were based on ash free dry weight of three different biological replicates for each strain. Error bars represent the standard deviation of three biological replicates. There was no statistical difference between the parents (CC-1009 and CC-2343) and any progeny. Though c1_1 did have higher productivity that two of the other progeny, all of the lines were able to grow under low CO2 (i.e. none were high CO2 requiring).
Appendix 1—figure 13
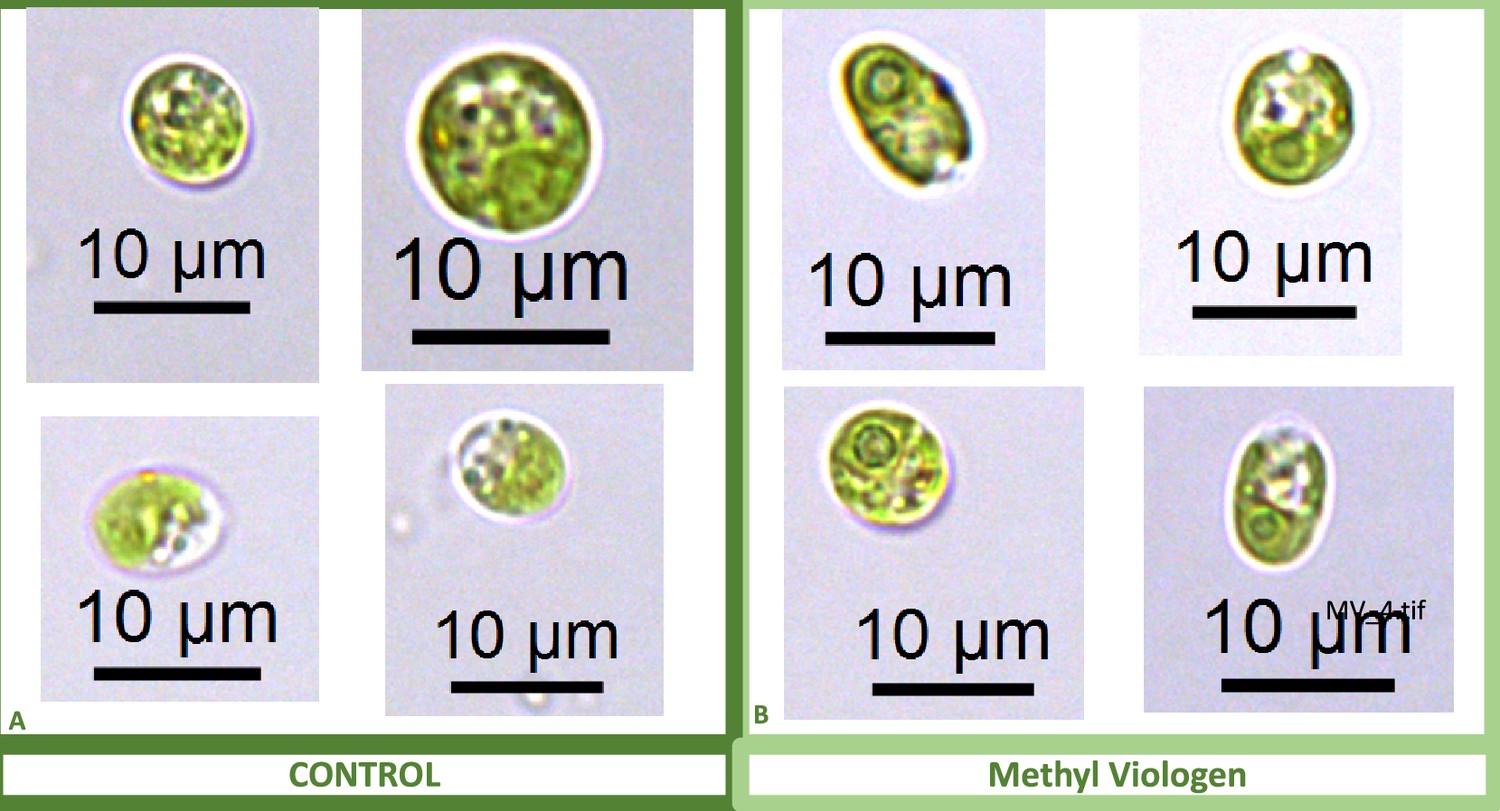
Representative light microscopy images of CC-2343 control (Panel A) and treated (Panel B) cells, two hours after our sinusoidal light had turned on, with 0.1 μM of methyl viologen, and then exposed to 6 hours of low light (~50 μmol m–2 s–1 PAR) with saturating (5 mM) bicarbonate in minimal 2NBH media.
Appendix 1—figure 14

Representative light microscopy images of CC-2343 control (Panel A) and treated (Panel B) cells, two hours after our sinusoidal light had turned on, with 4 mM of metronidazole, and then exposed to 6 hours of low light (~50 μmol m–2 s–1 PAR) with saturating 5 mM bicarbonate in minimal 2NBH media.
Appendix 1—figure 15
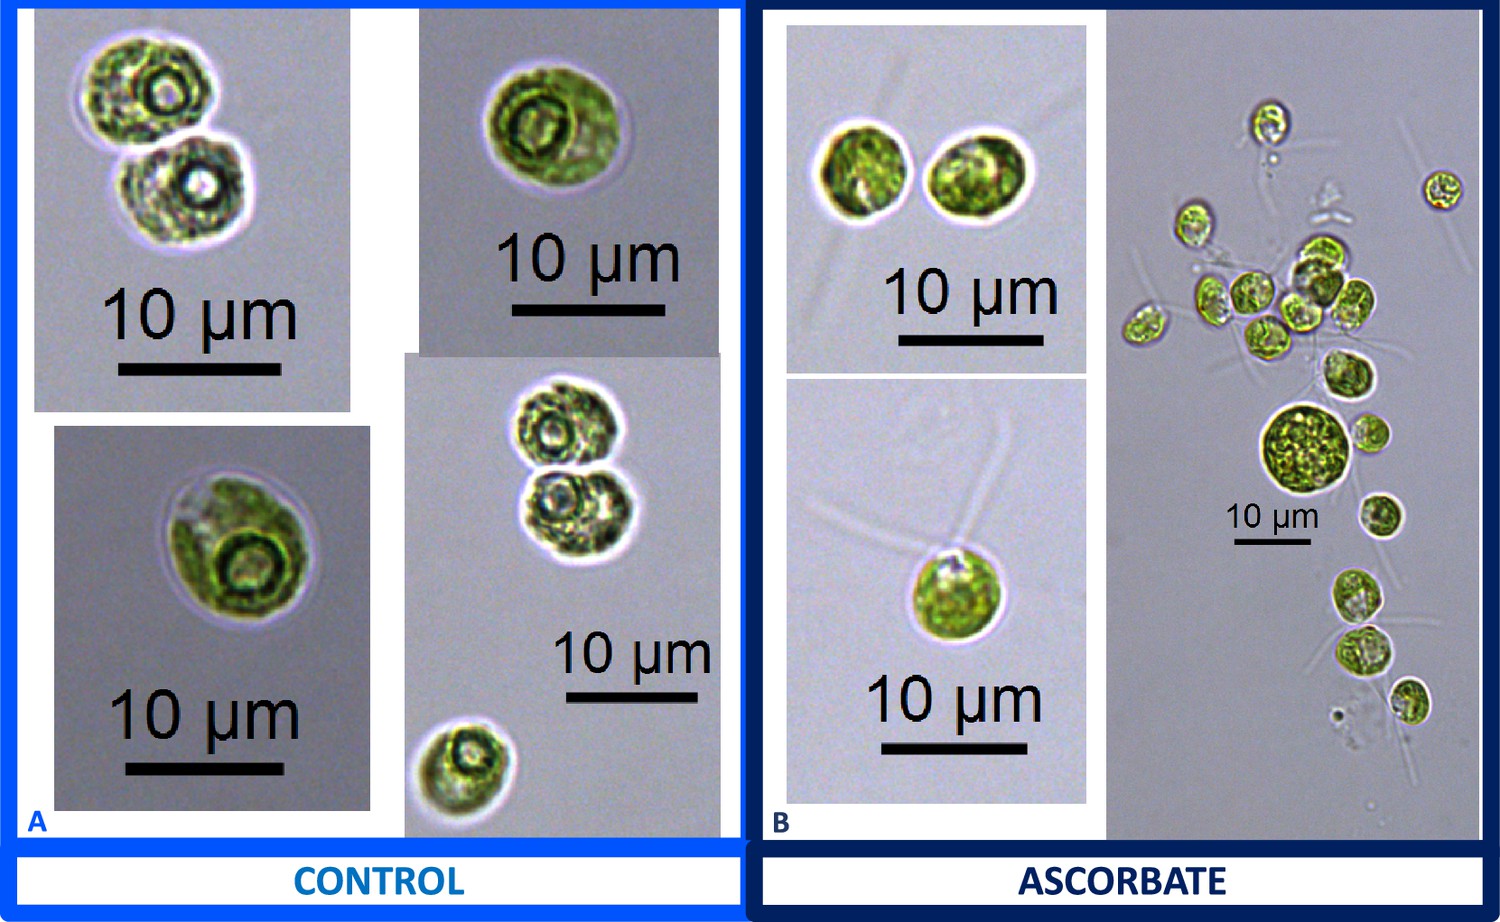
Representative light microscopy images of CC-1009 control (Panel A) and 10 mM ascorbate treated (Panel B) cells, grown for 24 hours while being bubbled with air (low CO2) in minimal 2NBH media under ~85 μmol m–2 s–1 PAR.
Appendix 1—figure 16
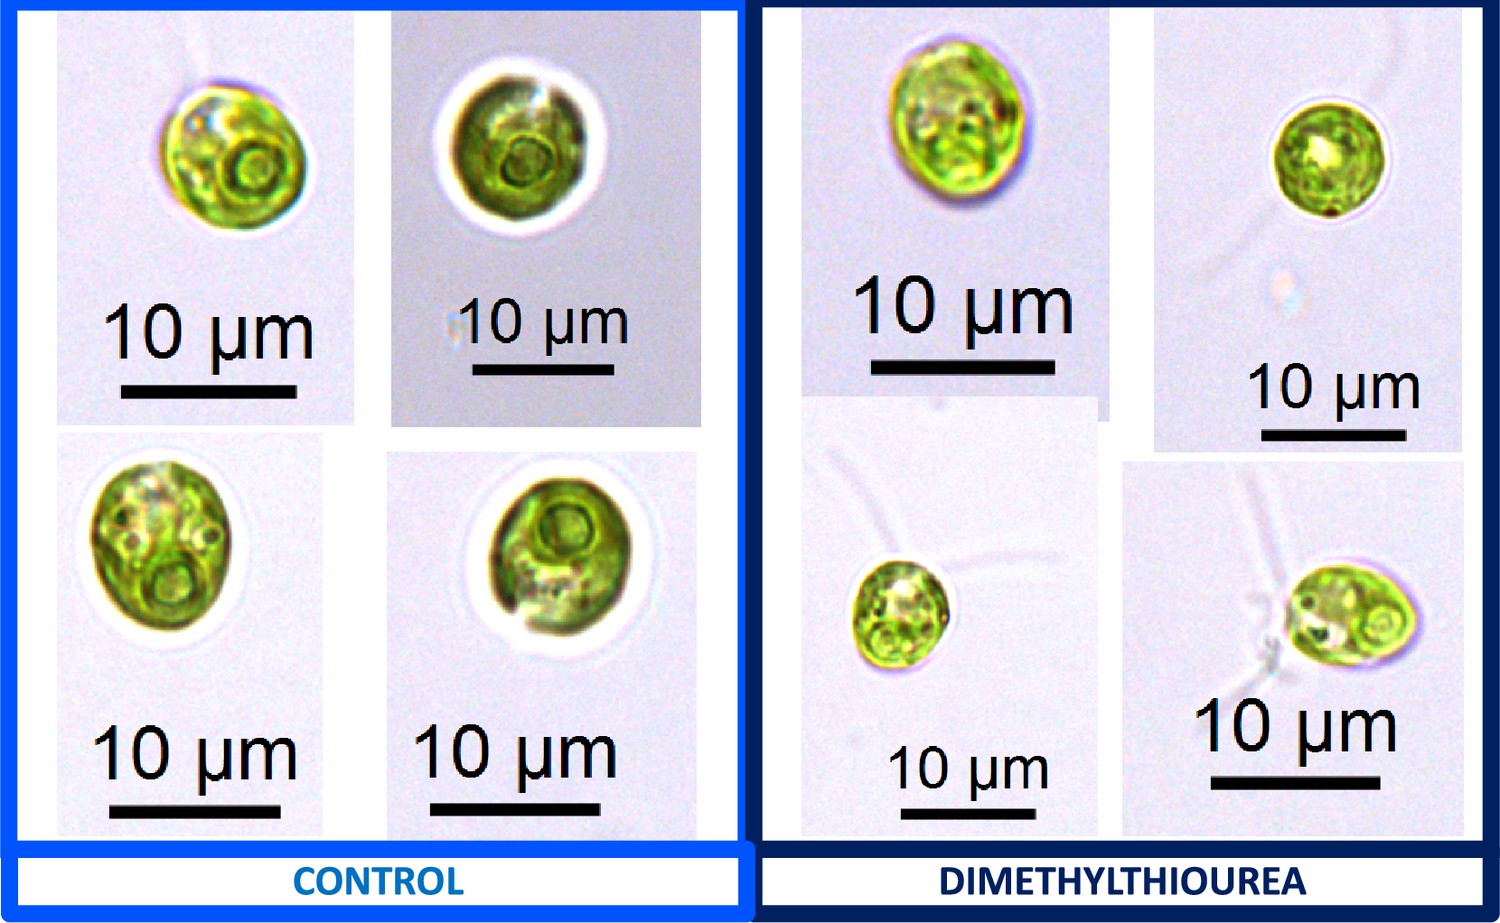
Representative light microscopy images of CC-1009 control (Panel A) and 15 mM dimethylthiourea treated (Panel B) cells, grown for 24 hours while being bubbled with air (low CO2) in minimal 2NBH media under ~85 μmol m–2 s–1 PAR.
Appendix 1—figure 17
Localization of rubisco, control cells (Panel A) and cells exposed to 100 μM H2O2 (Panel B), visualized by the Nikon A1 Confocal Laser Scanning Confocal Microscope confocal microscopy, in strain CC-5357, containing at RBCS1-Venus tag.
Scale bar = 10 μm. These images, along with those with the Olympus (Figure 6), indicate a clear change in rubisco localization, rather the simply a change in rubisco amount. Since confocal microscopy is designed to acquire a very thin optical section through the thickness of a single cell, it can be difficult to use confocal fluorescence microscopy to accurately measure total protein content within the 3-dimensional volume of a single cell. Acquisition of several images through the thickness of the cell may actually over estimate or under estimate the total fluorescence intensity, depending on the Z-step increment. However, when comparing these images of Venus Fluorescent Protein-labeled rubisco within Chlamydomonas cells acquired using the Nikon A1 confocal microscope, the fluorescence intensity of the pyrenoid matrix of most cells under control conditions (5 mM bicarbonate, no H2O2 treatment) was similar to or dimmer than the fluorescence intensity of the pyrenoid matrix within cells treated for six hours with 100 μM H2O2. In contrast, the fluorescence intensity of the Venus Fluorescent Protein-labeled rubisco located outside of the pyrenoid matrix was measurably higher in cells under control conditions compared to H2O2-treated cells. If the decrease in Venus Fluorescent Protein-labeled rubisco fluorescence located outside of the pyrenoid matrix in H2O2-treated cells was due to an overall decrease in rubisco production within the cell and not due to delocalization of the protein from the pyrenoid to the cytoplasm of the cell, then fluorescence intensity of the pyrenoid within H2O2-treated cells should show a comparable decrease in fluorescence intensity, which is not seen. Fluorescence was detected using 0.5 % 514 nm diode laser intensity. Fluorescence emission was recorded through 565/70 nm band pass filter using a Gallium Arsenide Phosphide (GaASP) detector (High Voltage = 47, offset –7).
Appendix 1—figure 18
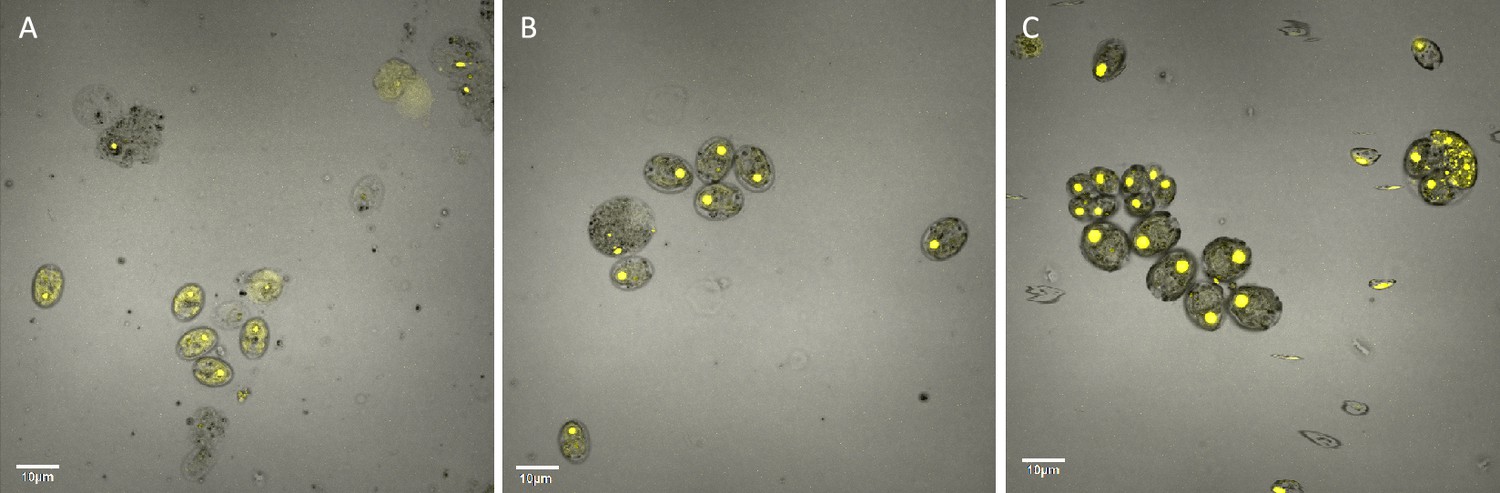
Localization of rubisco, control cells (Panel A), cells exposed to 0.1 μM methyl viologen (Panel B), and 8 mM metronidazole (Panel C) visualized by an Olympus FluoView 1,000 Confocal Laser Scanning Microscope, in strain CC-5357, containing a RBCS1-Venus tag.
Scale bar = 10 μm.
Appendix 1—figure 19
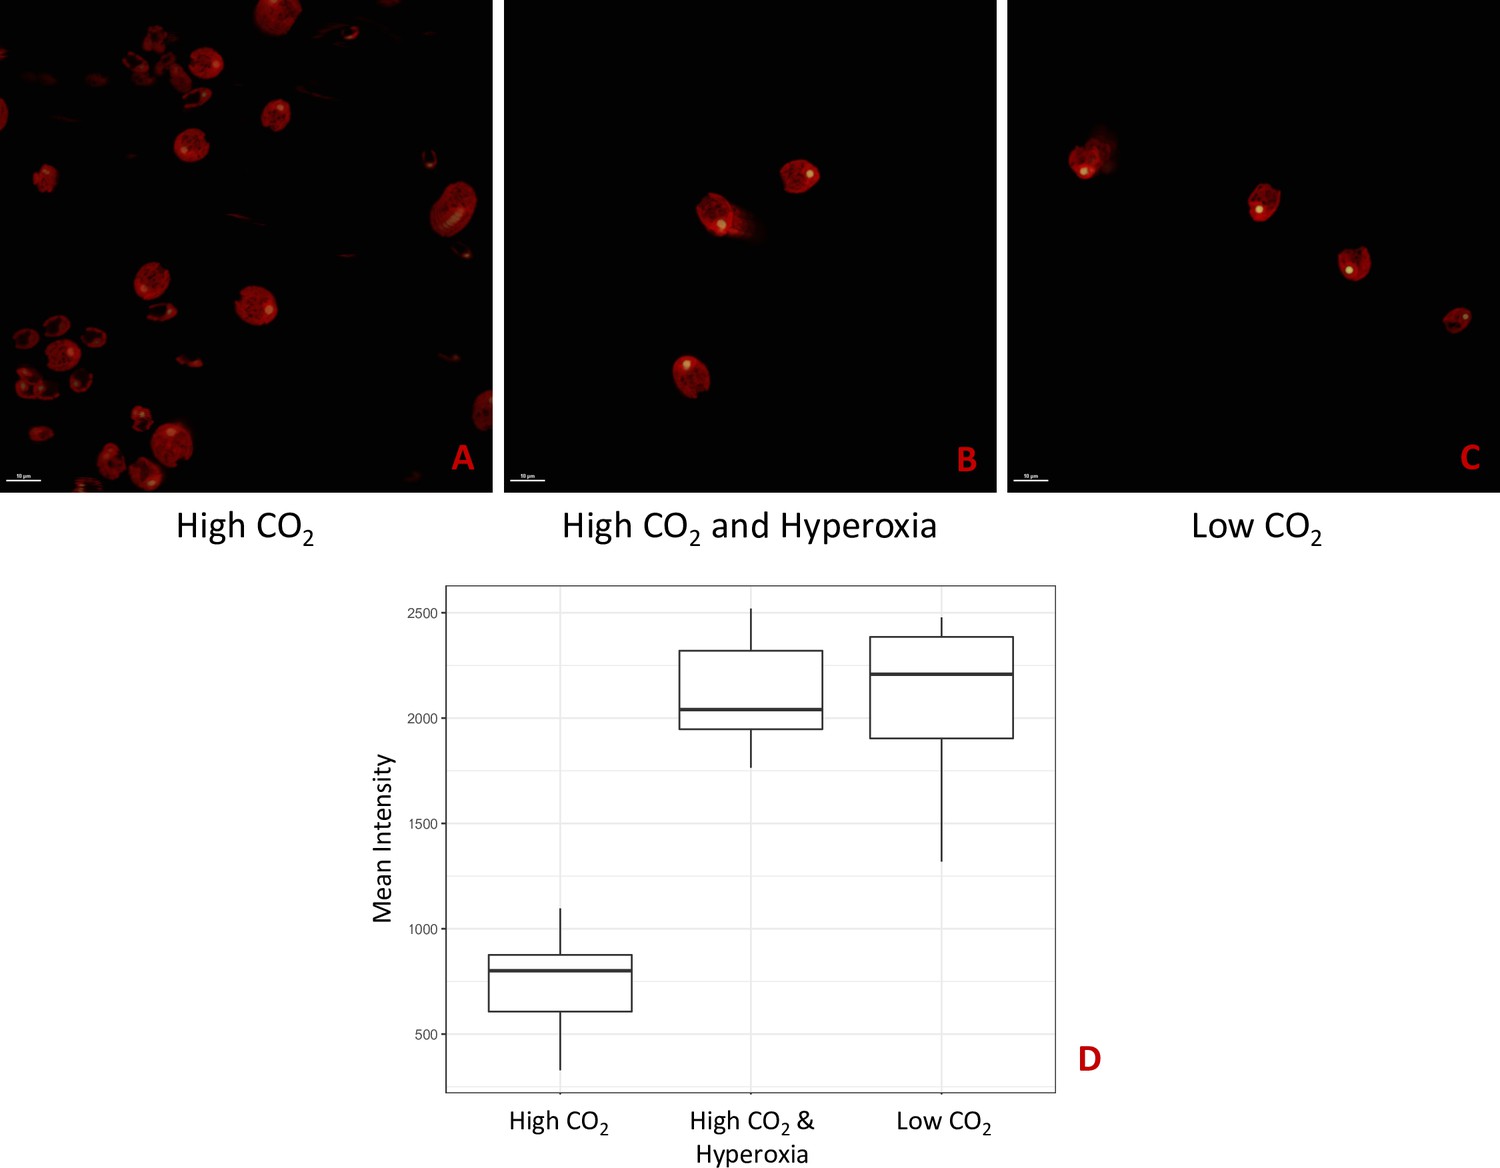
Strain CC-5357, containing a RbcS1-Venus, with Chlorophyll shown in red and RbcS1-Venus in yellow.
All cells were grown with 14:10 hour (light:dark) sinusoidal illumination with peak light intensity of 2000 μmol m-2 s-1 PAR, in HS media. Cells were sparged for 60 seconds every 15 minutes with either 5% CO2 (Panel A), 5% CO2 and 95% Oxygen (Panel B), or ambient air (i.e. low CO2) (Panel C). The average fluorescence intensity of the localized Venus Fluorescent Protein-labeled rubisco within the pyrenoids of Chlamydomonas cells was measured using the Nikon A1 Confocal Laser Scanning Microscope. Because the tagged rubisco was expressed with a PsaD (Photosystem I reaction center subunit II) promoter, the fluorescent signal may not be a conclusive proxy for rubisco amount and cannot be attributed to transcriptional responses to hyperoxia. However, the results are consistent with the fluorescent-tagged rubisco accumulating to a greater extent in the pyrenoids of cells exposed to hyperoxia, similar to what has been observed when cell are exposed to low CO2. Panel D shows the mean intensity of the Venus-tagged rubisco of the three treatments. Panels A, B, and C show representative images used to quantify this mean intensity. Significant differences (P < .0001) were found between the High CO2 and Hyperoxia; High CO2 and Low CO2 treatments. No difference was found between Hyperoxia and Low CO2. Scale bar = 10 μm.
Appendix 1—figure 20
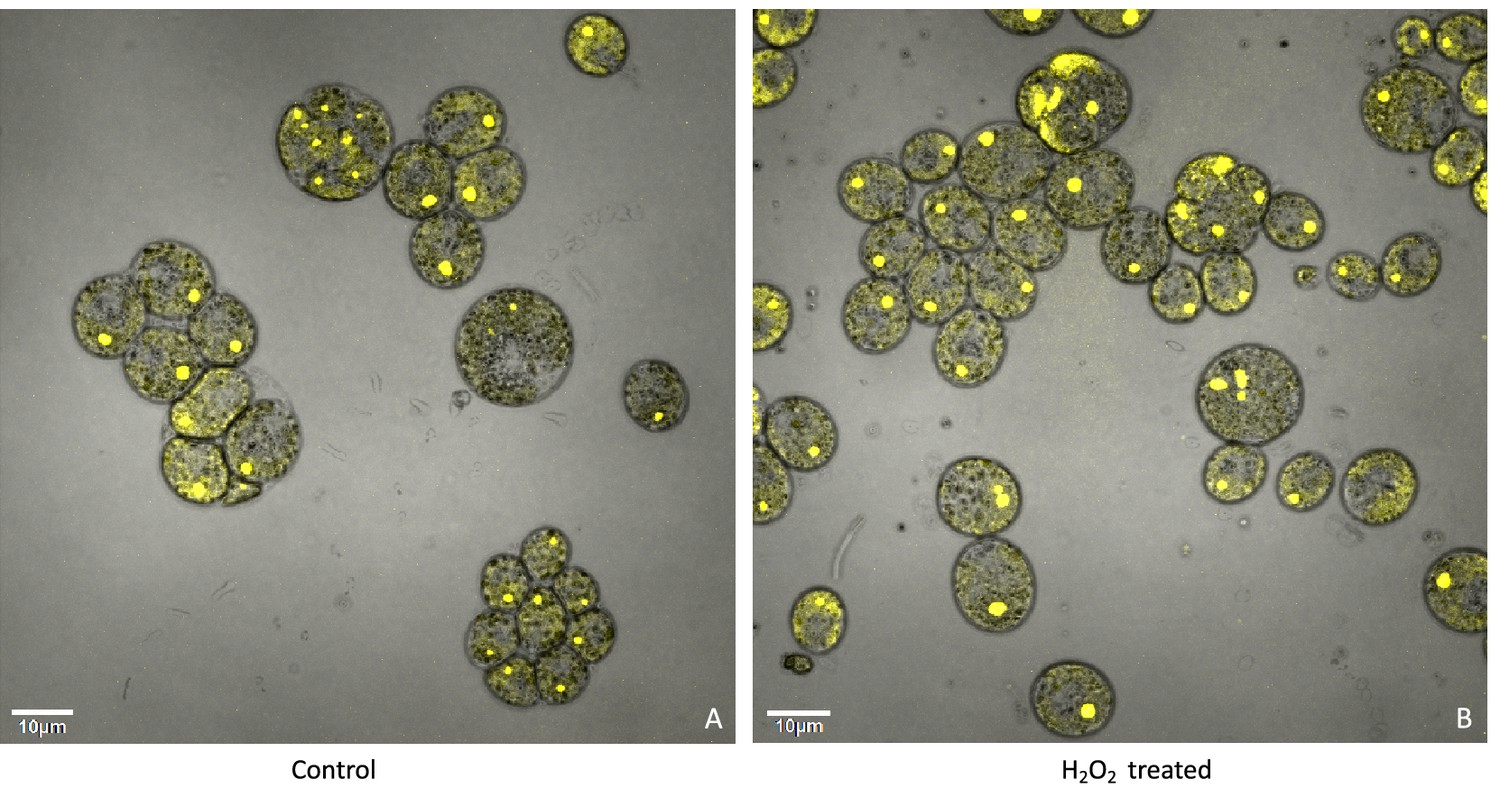
Confocal microscopy of liquid TAP-grown CC-5357, which has a Venus labeled RbcS1, treated without (Panel A) and with H2O2 (Panel B), showing no change in localization of rubisco.
Cultures were harvested from photobioreactors in the morning (two hours after the start of illumination) and diluted by half with fresh TAP media – without (control) or with addition of 100 μM of H2O2. After ten hours in low light (~85 μmol photons m–2 s–1), cells were then viewed with the confocal microscope. Scale bar = 10 μm.
Appendix 1—figure 21

Comparison of cells grown under steady state in liquid media (with 5 % CO2) versus cells grown on the surface of a TAP plate.
Both CC-2343 (Panel A) and CC-1009 (Panel B) showed losses of the starch sheath when grown on a TAP plate.
Appendix 1—figure 22
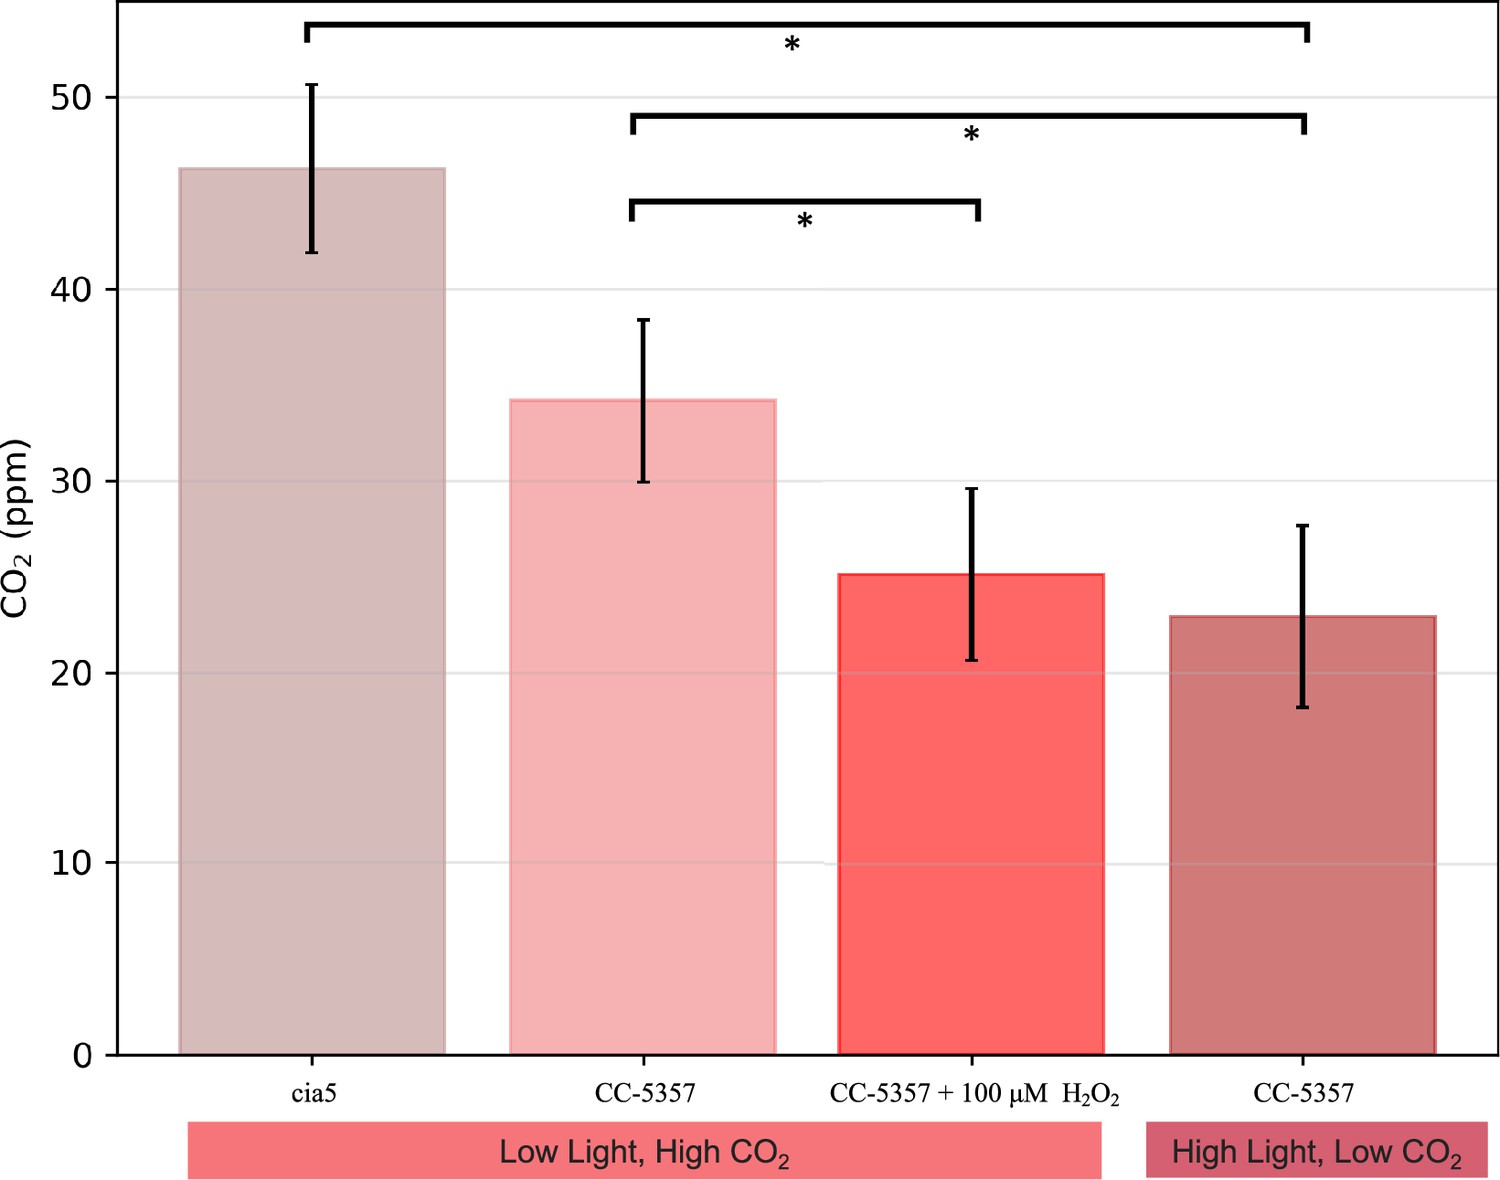
Ci compensation points, determined as in Methods, for a mutant defective in the CCM (cia5); CC-5357 cells grown under low light (10 µmol photons m–2 s–1 PAR) and high CO2, where CCM activity is expected to be low; CC-5357 cells grown under high CO2 and low light (10 µmol photons m–2 s–1 PAR) but pretreated for a minimum of 3 hours with 100 uM H2O2 to induce pyrenoid formation; and CC-5357 cells grown under high light (100 µmol photons m–2 s–1 PAR) and low CO2, where we expect high CCM activity.
Error bars represent standard deviation of at least five biological replicates. *P≤0.01.
Appendix 1—figure 23
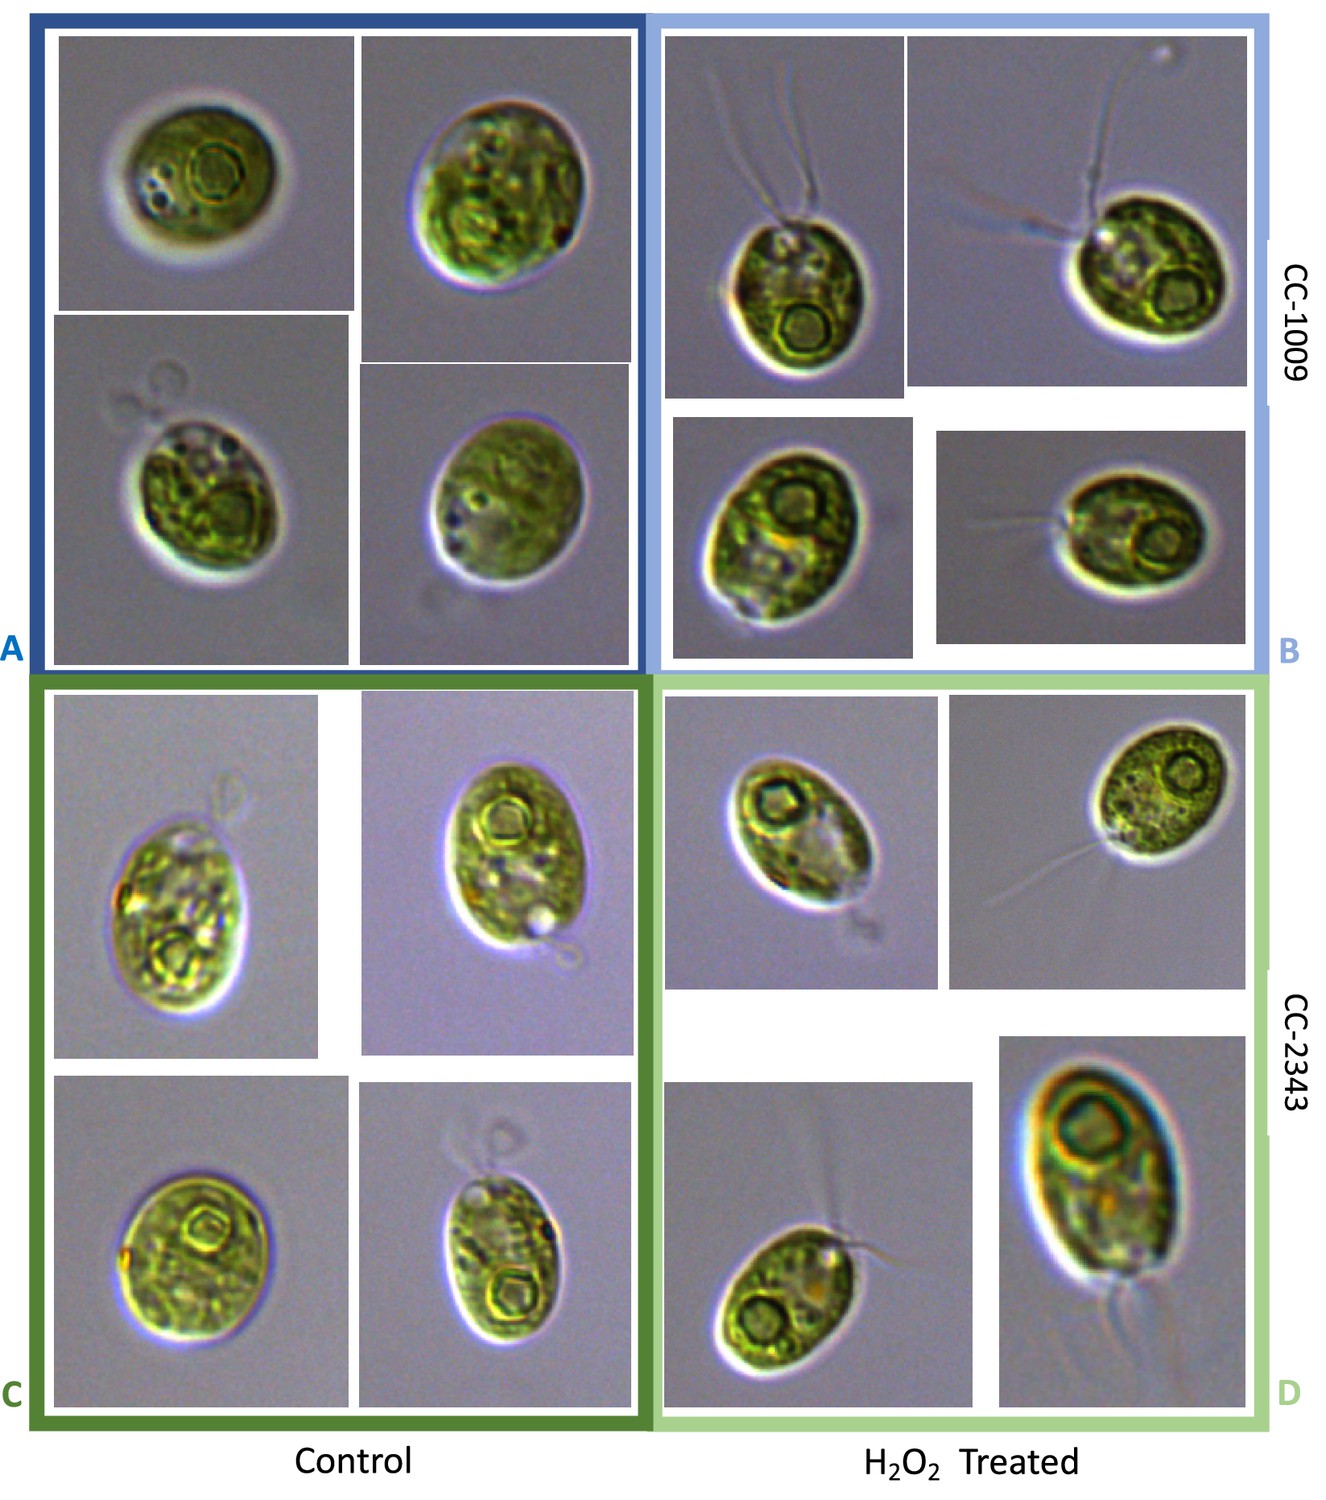
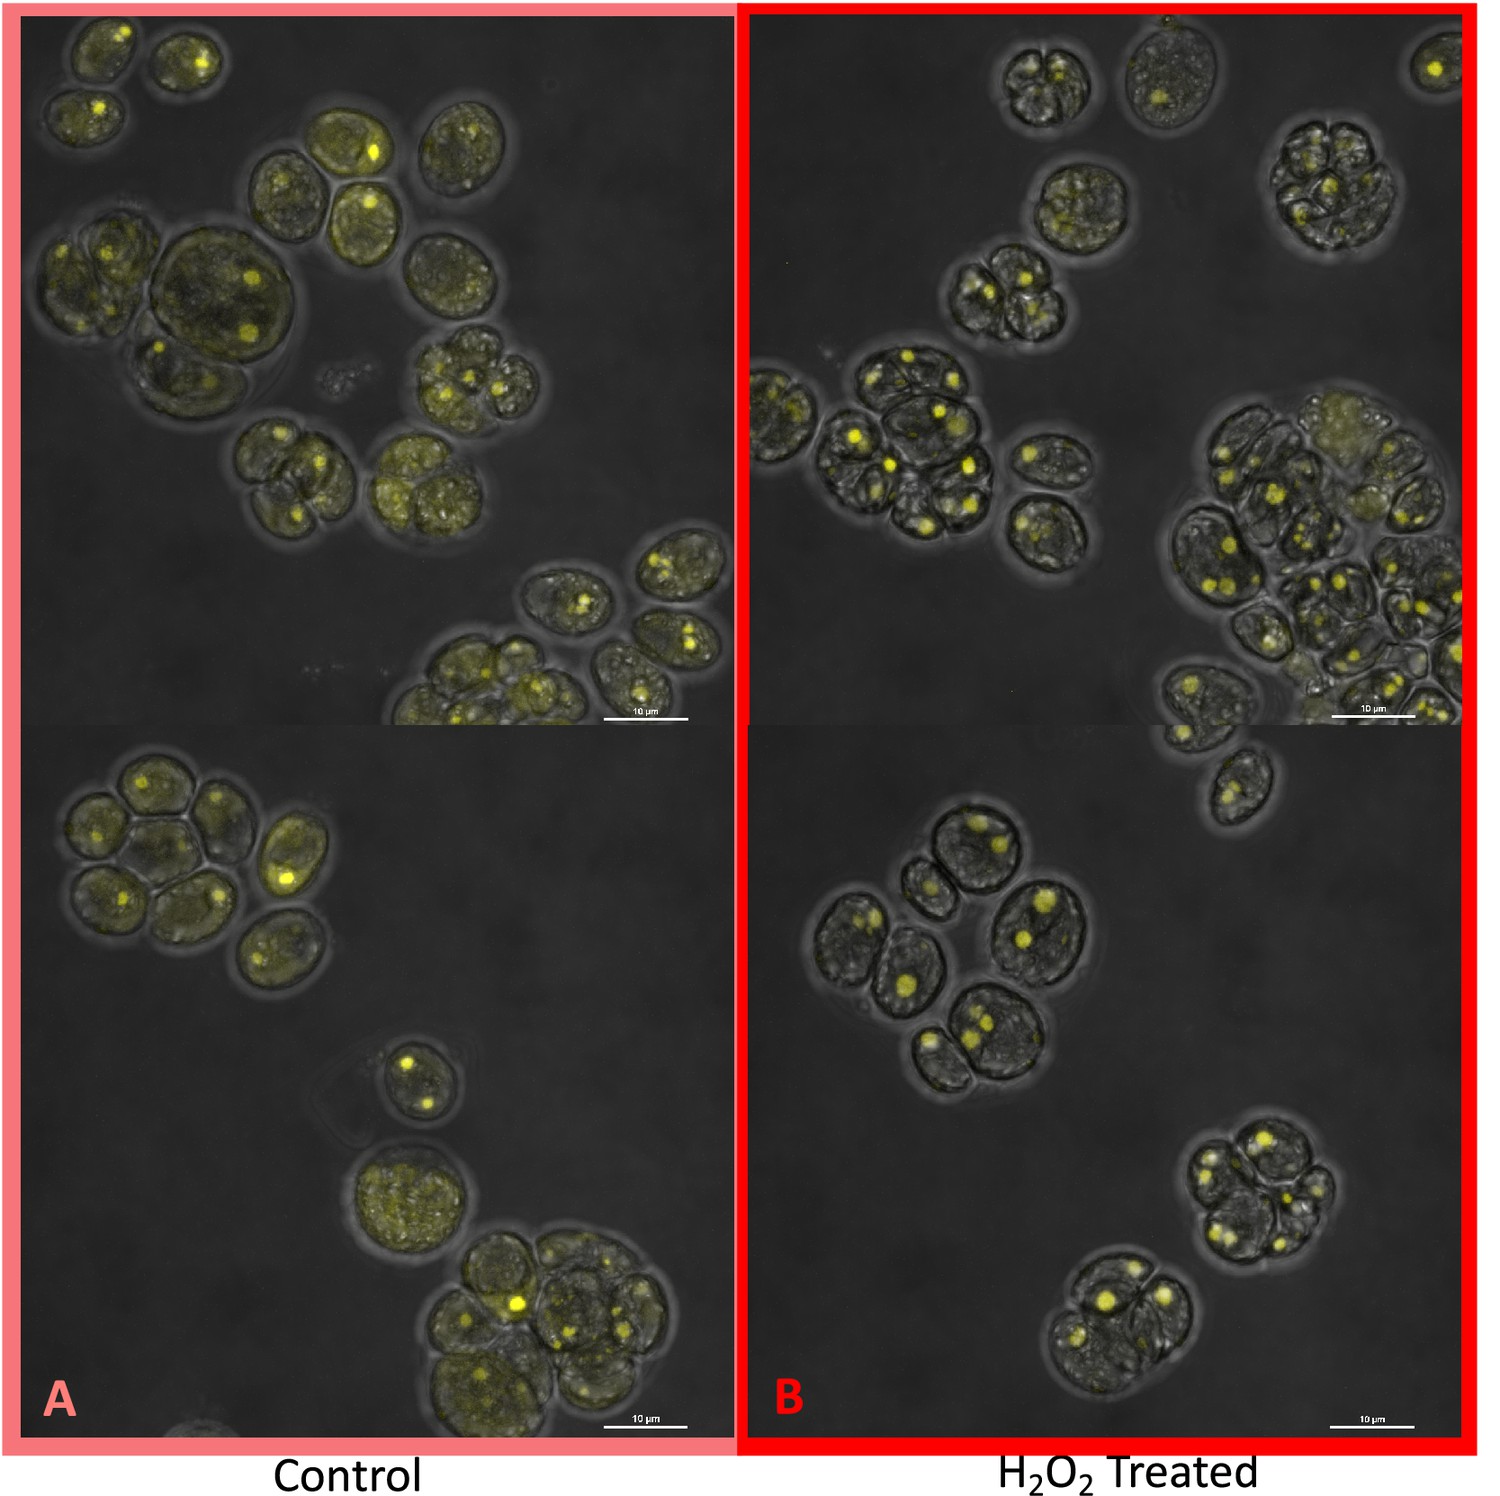
Representative light microscopy images of CC-1009 (Panels A & B) and CC-2343 (Panels C & D) control and cells treated, two hours after our sinusoidal light had turned on, with 100 μM of H2O2, and then exposed to 7 hours of low light (~50 μmoles photons m–2 s–1) with saturating 5 mM bicarbonate in minimal 2NBH media.
Appendix 1—figure 24
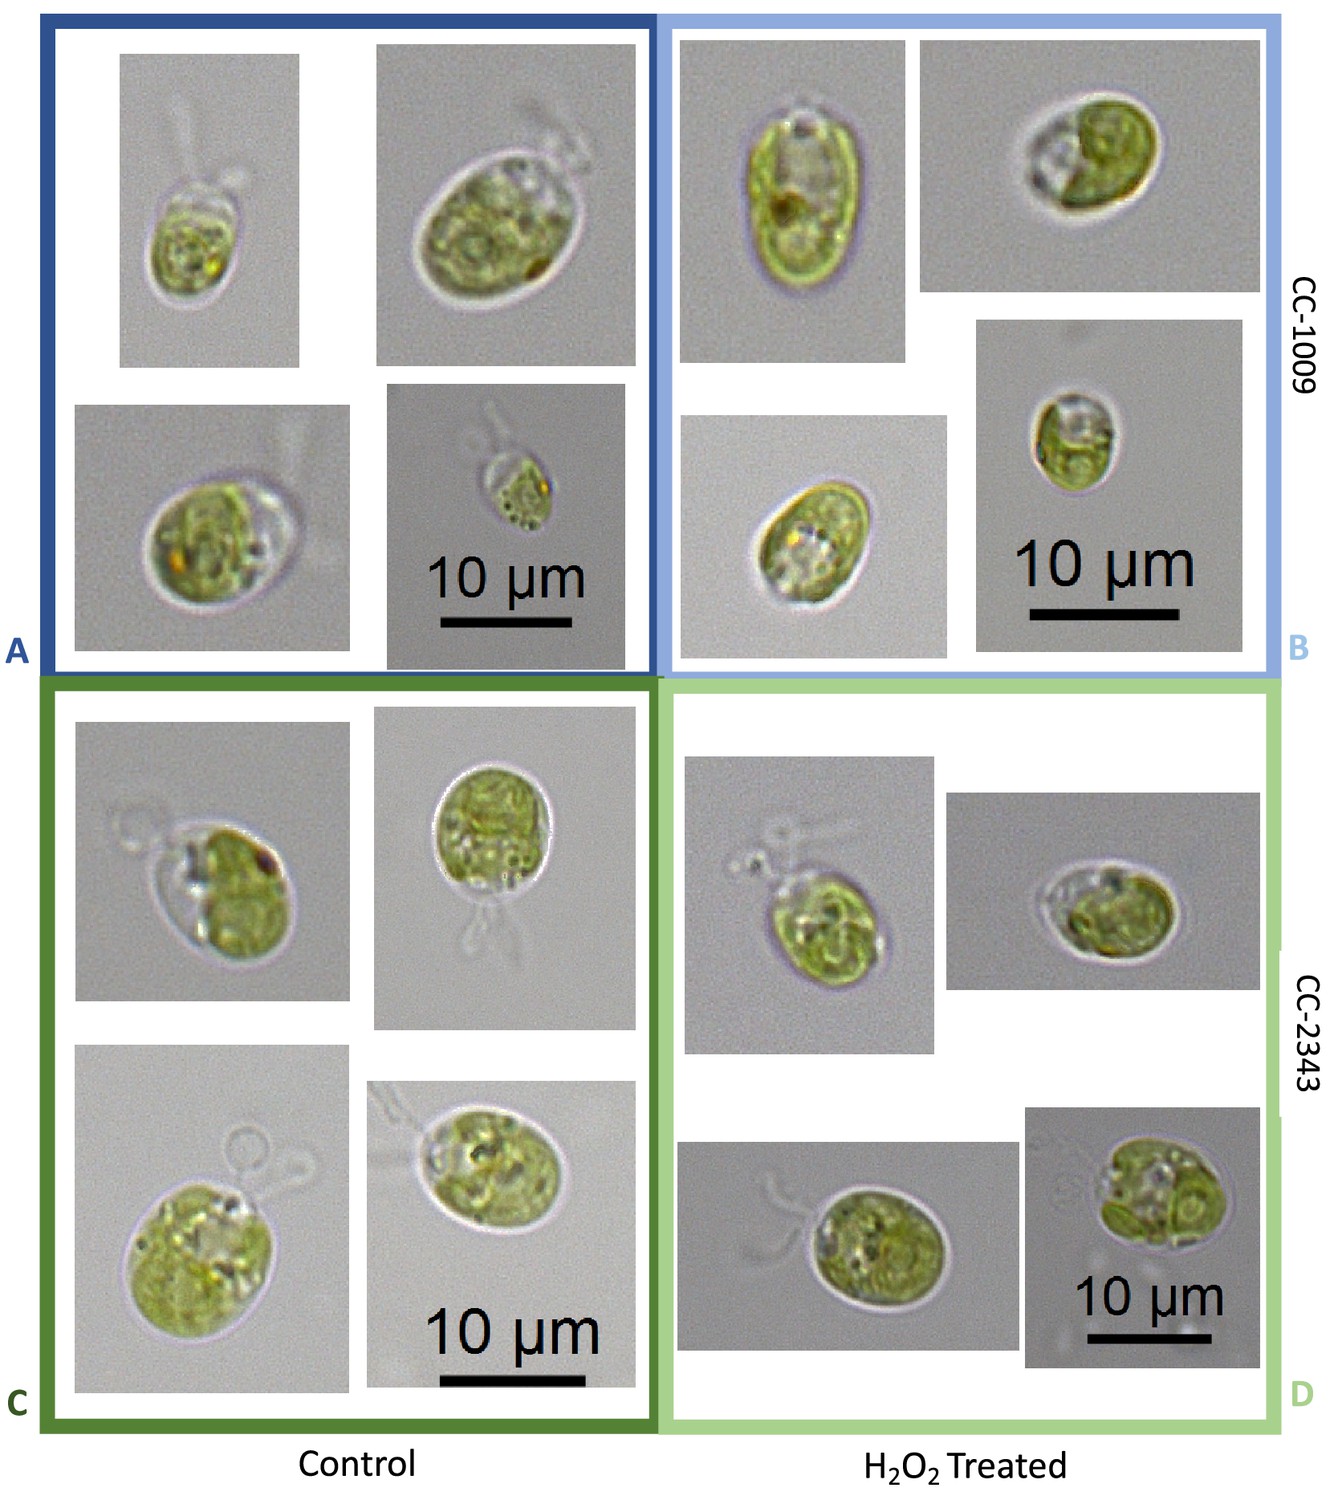
Representative light microscopy images of CC-1009 (Panels A & B) and CC-2343 (Panels C & D) control and cells treated, the light remaining off, with 100 μM of H2O2, and kept at 7 hours of dark with saturating 5 mM bicarbonate in minimal 2NBH media.
Author response image 1
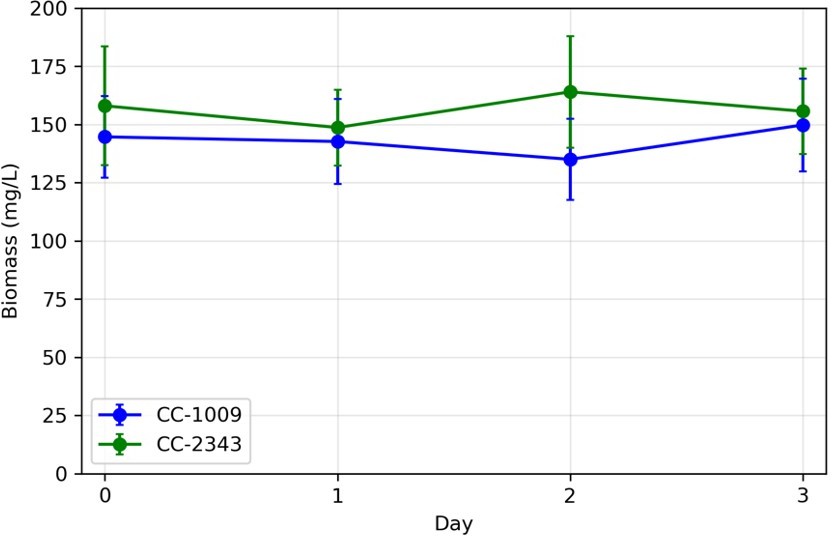
Variations in biomass (ash free dry weight) measured in turbidostat cultures in ePBR units.
Tables
Key resources table
| Reagent type (species) or resource | Designation | Source or reference | Identifiers | Additional information |
|---|---|---|---|---|
| Strain, strain background (Chlamydomonas reinhardtii) | CC-2343 | https://www.chlamycollection.org | CC-2343 wild type mt+ [Jarvik #224, Melbourne, FL] | Wild type isolated from Florida in 1988 Spanier et al., 1992 |
| Strain, strain background (Chlamydomonas reinhardtii) | CC-1009 | https://www.chlamycollection.org | CC-1009 wild type mt- [UTEX 89] | A descendant of a wild type collected in Amherst, MA in 1945 Pröschold et al., 2005 |
| Strain, strain background (Chlamydomonas reinhardtii) | CC-5357 | https://www.chlamycollection.org | CC-5357 RbcS1-Venus mt- | Contains a YFP tagged rubisco Mackinder et al., 2016 |
| Strain, strain background (Chlamydomonas reinhardtii) | CC-2702 | https://www.chlamycollection.org | CC-2702 mt+ | Cia5 mutant, lacks carbon concentrating mechanism Xiang et al., 2001 |
| Strain, strain background (Chlamydomonas reinhardtii) | c1_1 | This study | c1_1 mt+ | Tolerant to hyperoxia |
| Strain, strain background (Chlamydomonas reinhardtii) | c1_2 | This study | c1_2 mt+ | Tolerant to hyperoxia |
| Strain, strain background (Chlamydomonas reinhardtii) | c1_3 | This study | c1_3 mt- | Intolerant to hyperoxia |
| Strain, strain background (Chlamydomonas reinhardtii) | c1_4 | This study | c1_4 mt- | Intolerant to hyperoxia |
Additional files
-
Transparent reporting form
- https://cdn.elifesciences.org/articles/67565/elife-67565-transrepform1-v1.docx
-
Supplementary file 1
Supporting and additional data and figures.
- https://cdn.elifesciences.org/articles/67565/elife-67565-supp1-v1.docx
Download links
A two-part list of links to download the article, or parts of the article, in various formats.
Downloads (link to download the article as PDF)
Open citations (links to open the citations from this article in various online reference manager services)
Cite this article (links to download the citations from this article in formats compatible with various reference manager tools)
The induction of pyrenoid synthesis by hyperoxia and its implications for the natural diversity of photosynthetic responses in Chlamydomonas
eLife 10:e67565.
https://doi.org/10.7554/eLife.67565


