E2F/Dp inactivation in fat body cells triggers systemic metabolic changes
- University of Illinois at Chicago, United States
- Massachusetts General Hospital Cancer Center and Harvard Medical School, United States
Figures
Figure 1 with 1 supplement

The loss of E2F in fat body does not impair muscle formation.
(A) Confocal Z-stack-projected images of third instar larval body wall muscles ventral longitudinal 3 (VL3) (marked with white arrowhead) and ventral longitudinal 4 (VL4) from the segment A4 stained with Phalloidin, Dp::GFP, and DAPI. Anterior is to the left. Scale: 100 μm. (B) Box plot showing quantification of VL3 muscle area. Whiskers are min to max values, Kruskal-Wallis test followed by Dunn’s multiple comparisons test, **p<0.0001. n=9–12 animals per genotype. Three independent experiments were done. Full genotypes are (A–B) cg-GAL4/UAS-RFP,Dp[GFP], cg-GAL4/Dp[GFP],UAS-Dp[GD4444]-RNAi, UAS-RFP,Dp[GFP];Mef2-GAL4, and Dp[GFP],UAS-Dp[GD4444]-RNAi,Mef2-GAL4.
-
Figure 1—source data 1
Area measurements of the VL3 muscle (μm2) at the third instarlarva and the statistical analysis.
- https://cdn.elifesciences.org/articles/67753/elife-67753-fig1-data1-v2.xlsx
Figure 1—figure supplement 1
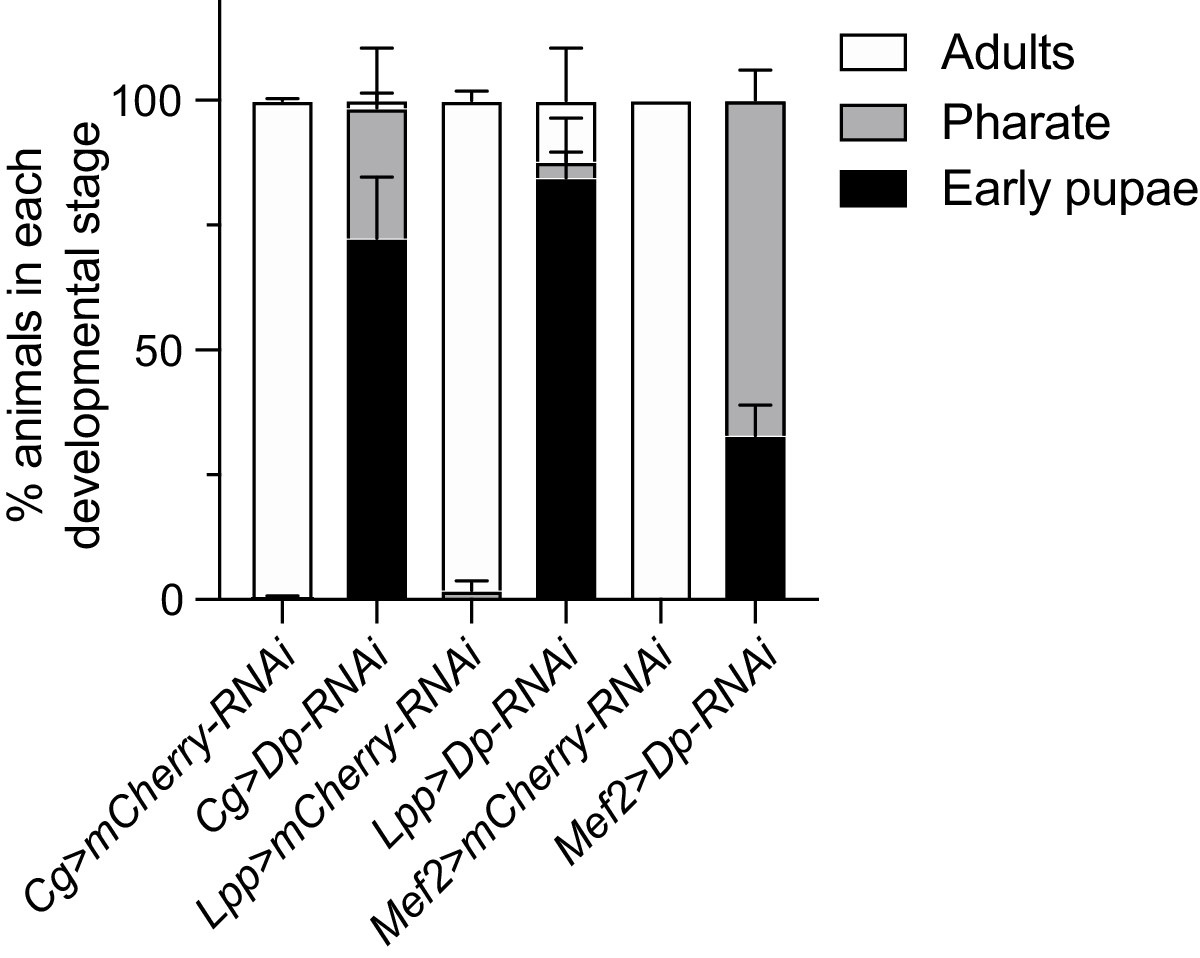
E2F in muscles and fat body is required for animal development.
Animal viability assessed by quantifying the percentage of animals at each developmental stage (adult, pharate, and early pupa). Data are presented as stacked bar plot, mean ± SEM, n=2 replicates per genotype, repeated as N=5–6 independent experiments. Full genotypes are cg-GAL4,UAS-mCherry-RNAi, cg-GAL4/UAS-Dp[GD4444]-RNAi, UAS-GC3Ai; Lpp-GAL4/UAS-mCherry-RNAi, UAS-GC3Ai/UAS-Dp[GD4444]-RNAi; Lpp-GAL4, Mef2-GAL4/UAS-mCherry-RNAi, and UAS-Dp[GD4444]-RNAi,Mef2-GAL4.
Figure 2 with 1 supplement
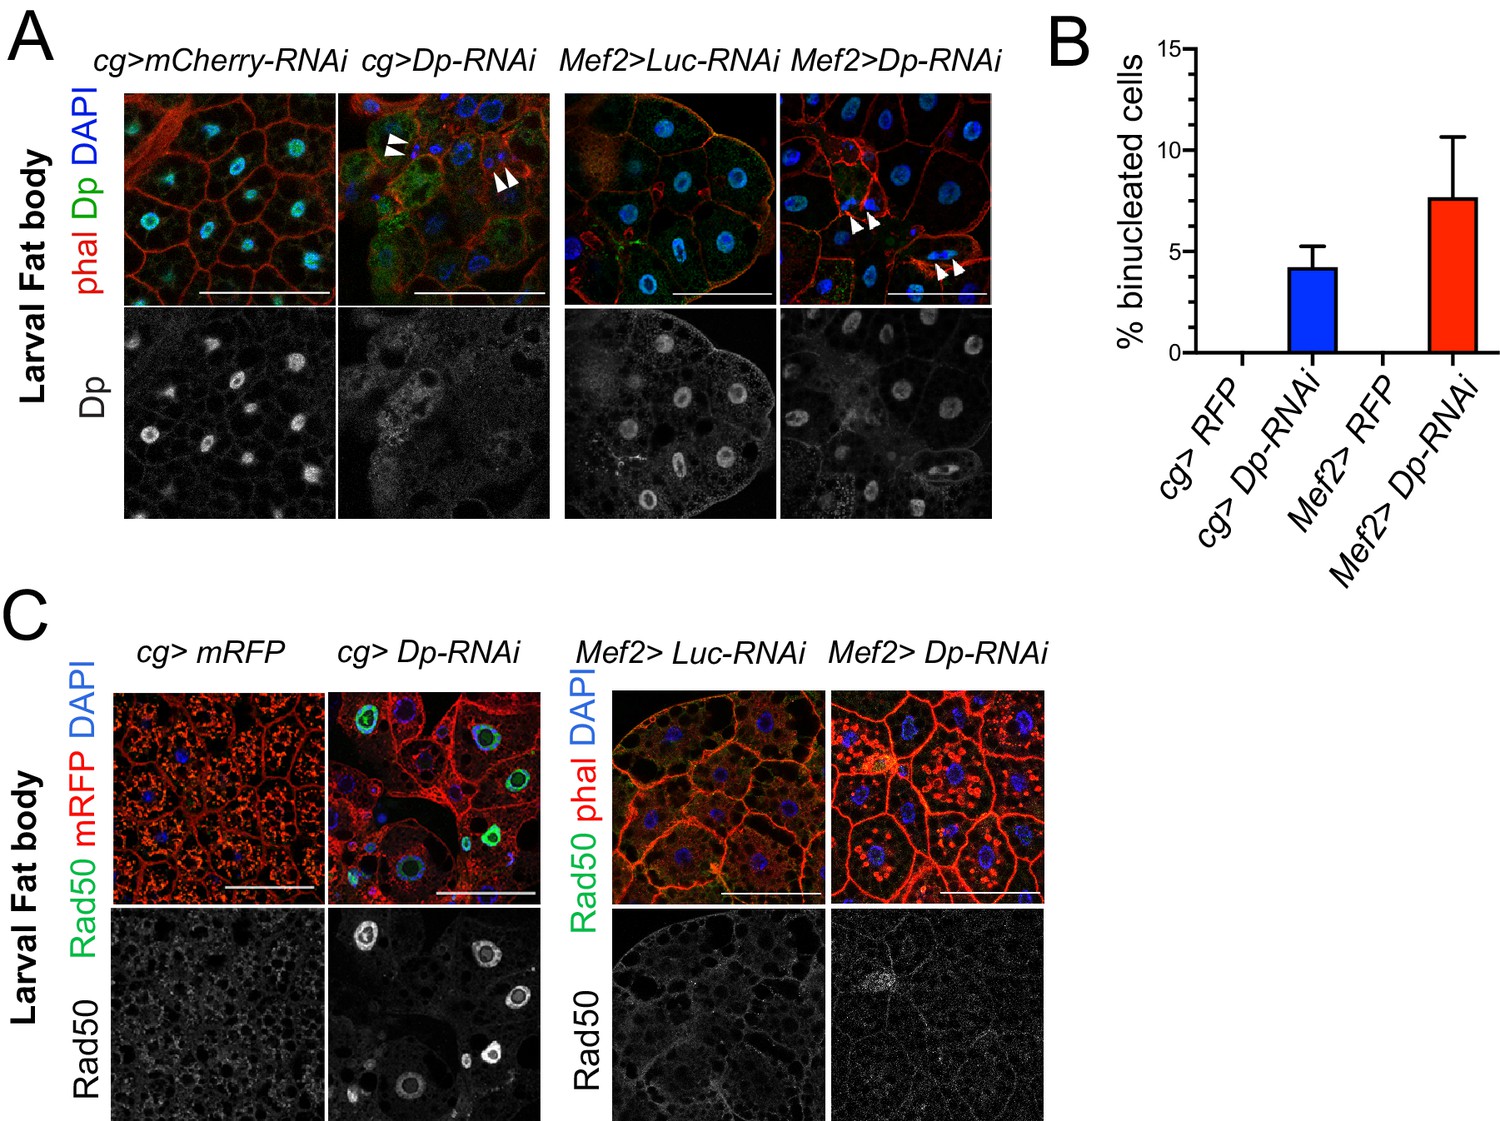
The loss of E2F in muscles has a systemic effect in the development of fat body.
(A) Confocal single plane images of third instar larval fat bodies stained with phalloidin, 4,6-diamidino-2-phenylindole (DAPI), and mouse anti-Dp antibody (Yun). White arrowheads point to newly formed binucleate cells. (B) Quantification of the percentage of binucleated cells in fat body. Date are presented as mean ± SD, n=415 cells for Mef2>Dp-RNAi, n=405 cells for cg>Dp-RNAi, and n=300 cells for each Mef2>Luc-RNAi and cg>Luc-RNAi, which did not show binucleates. Kruskal-Wallis test followed by Dunn’s multiple comparisons test, p<0.0001. Experiment was repeated two times. One representative experiment is shown. (C) Confocal single plane images of third instar larval fat bodies stained with Rad50, phalloidin, and DAPI. Scale: 100 μm. Full genotypes are (A) cg-GAL4;UAS-mCherry-RNAi, cg-GAL4/UAS-Dp[GD4444]-RNAi, Mef2-GAL4/ UAS-luciferase[JF01355]-RNAi, and UAS-Dp[GD4444]-RNAi; Mef2-GAL4, (B) cg-GAL4/UAS-RFP,Dp[GFP], cg-GAL4/Dp[GFP],UAS-Dp[GD4444]-RNAi, UAS-RFP,Dp[GFP];Mef2-GAL4, and Dp[GFP],UAS-Dp[GD4444]-RNAi,Mef2-GAL4, and (C) cg-GAL4,UAS-mRFP;UAS-luciferase[JF01355]-RNAi, cg-GAL4,UAS-mRFP/UAS-Dp[GD4444]-RNAi, Mef2-GAL4/UAS-luciferase[JF01355]-RNAi, and UAS-Dp[GD4444]-RNAi;Mef2-GAL4.
Figure 2—figure supplement 1

Loss of E2F induces binucleated cells in fat body.
(A) Confocal single plane images of third instar larval fat bodies stained with 4,6-diamidino-2-phenylindole (DAPI). Genotypes are E2f2 76Q1/c03344; E2f1 91/m729 compared to control w1118. (B) Confocal single plane images of third instar larval fat bodies stained with DAPI and phalloidin. Genotypes are UAS-GC3Ai/UAS-Dp[GD4444]-RNAi;Lpp-GAL4 compared to control UAS-GC3Ai; Lpp-GAL4/UAS-mCherry-RNAi. (C) Confocal single plane images of third instar larval fat bodies from Mef2>Luc-RNAi, Mef2>Dp-RNAi, and cg>DpRNAi larvae stained with anti-Mre11 antibodies, phalloidin, and DAPI. Scale: 100 μm. White arrowheads point to binucleated cells.
Figure 3
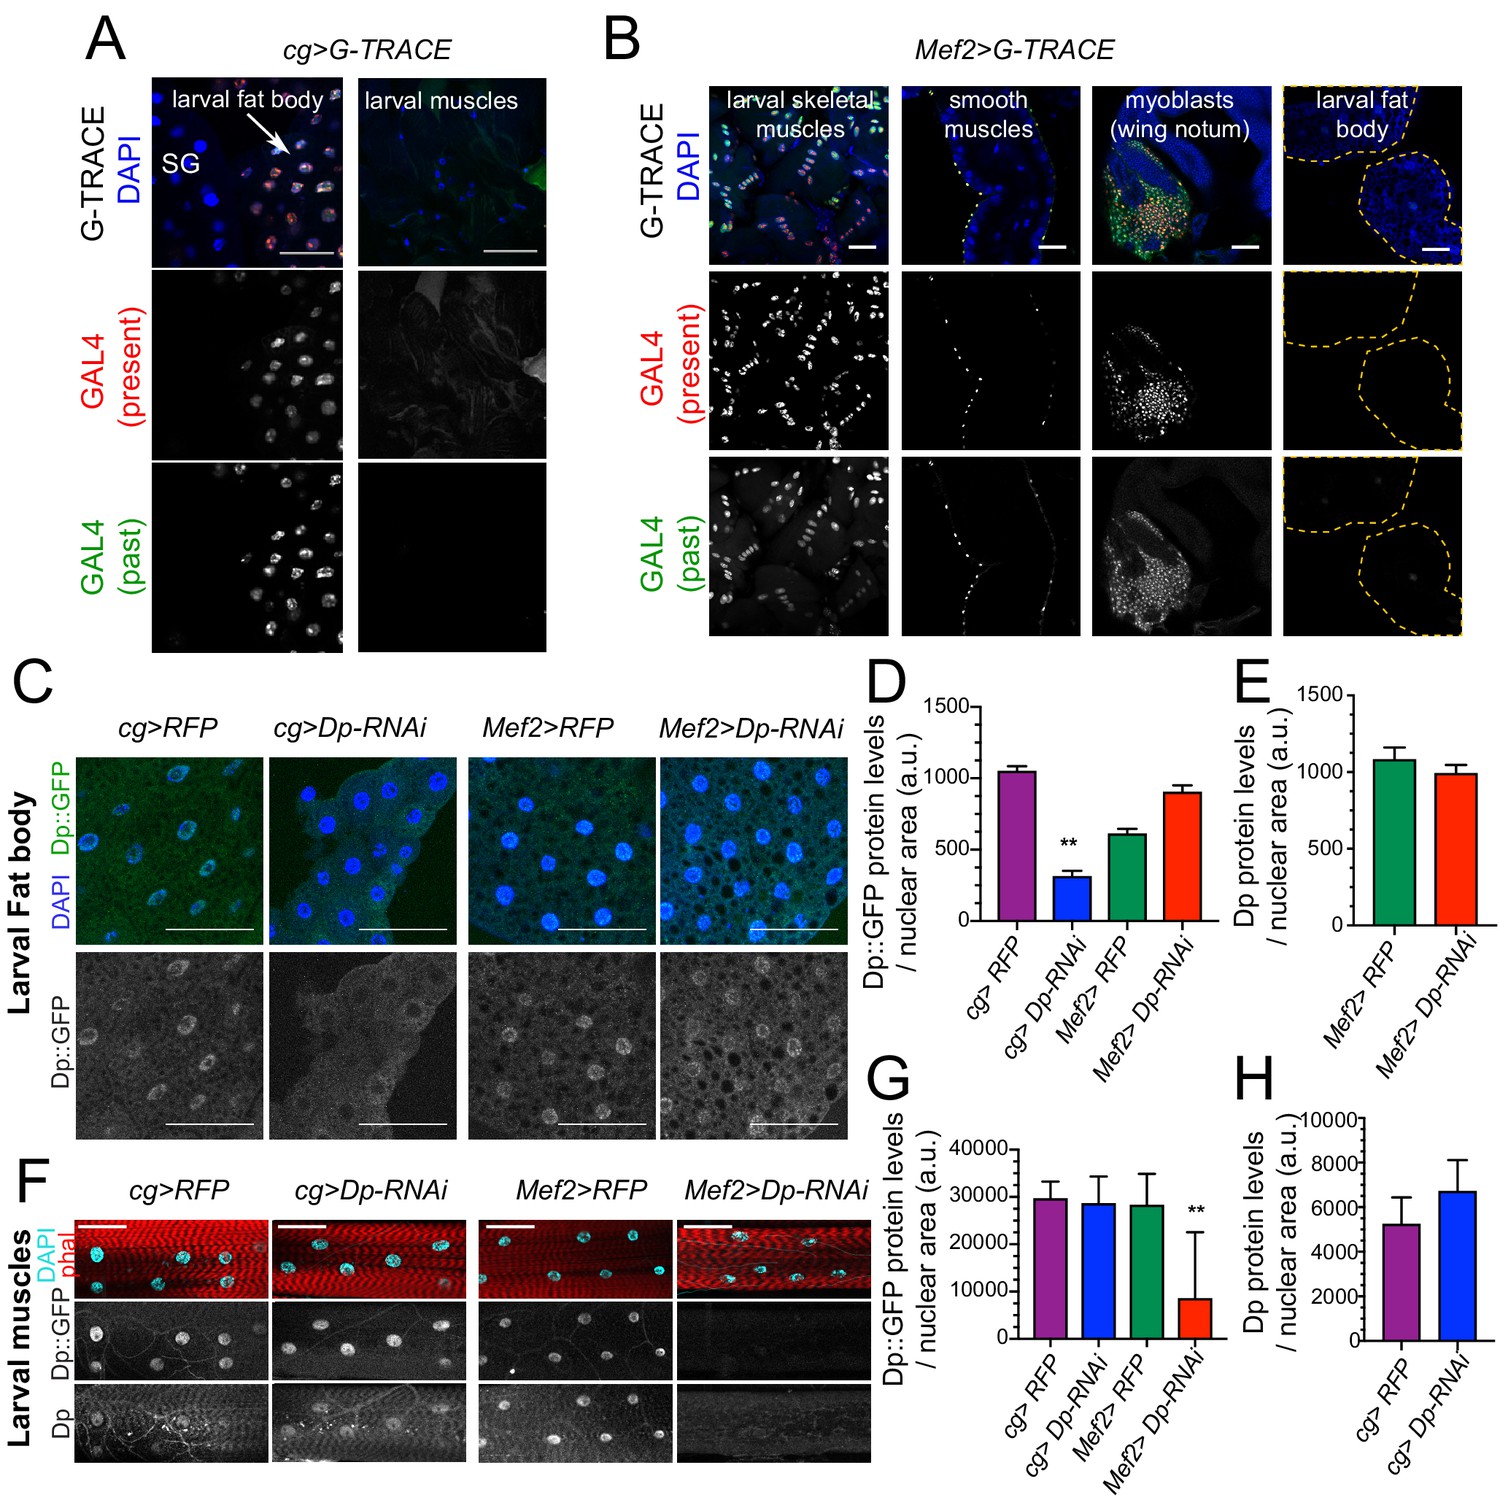
Dp expression is knock down in a tissue-specific manner.
(A–B) Lineage tracing of tissues dissected from third instar larvae stained with 4,6-diamidino-2-phenylindole (DAPI) and showing the lineage of cg-GAL4 (GFP) and the active GAL4 (RFP). (A) Confocal single plane images of cg>G-TRACE fat bodies, salivary glands, and muscles. Scale: 100 μm. (B) Confocal single plane images of Mef2>G-TRACE larval skeletal (body wall) and smooth (gut) muscles, adult myoblasts on the wing discs, and fat bodies. Scale: 50 μm. (C) Confocal single plane images of third instar larval fat bodies stained with DAPI and showing Dp::GFP tagged protein. White arrowheads indicate binucleated cells. Scale: 100 μm. (D) Quantification of Dp::GFP levels as shown in C, relative to nuclear area. Mean ± SEM, Kruskal-Wallis test followed by Dunn’s multiple comparisons test, **p<0.0001, n=11–20 per genotype. (E) Quantification of Dp protein levels relative to nuclear area in larval fat body of Mef2>RFP and Mef>Dp-RNAi animals. Mean ± SEM, Mann-Whitney test, p = 0.35, n=14 per genotype. (F) Confocal single plane images of third instar larval muscles immunostained with rabbit anti-Dp antibody (212), phalloidin, and DAPI. Scale: 50 μm. (G) Quantification of Dp::GFP levels as shown in F, relative to nuclear area. Mean ± SD, Kruskal-Wallis test followed by Dunn’s multiple comparisons test, **p = 0.0008, n=10–12 animals per genotype. (H) Quantification of Dp protein levels relative to nuclear area in larval fat body of cg>RFP and cg>Dp-RNAi animals. Mean ± SD, Mann-Whitney test, p = 0.07, n=6–9 per genotype. Full genotype: (A) cg-GAL4/UAS-gTRACE, (B) UAS-gTRACE,Mef2-GAL4, (C–H) cg-GAL4/UAS-mRFP,Dp[GFP], cg-GAL4/Dp[GFP],UAS-Dp [GD4444]-RNAi, UAS-mRFP,Dp[GFP];Mef2-GAL4, and Dp[GFP],UAS-Dp[GD4444]-RNAi,Mef2-GAL4.
Figure 4

Restoring E2F/Dp in muscles suppresses defect in Dp-deficient fat body.
(A) Confocal single plane images of third instar larval fat bodies immunostained with anti-Dp antibody (212), phalloidin, and 4,6-diamidino-2-phenylindole (DAPI). Note that Dp-/-;Mef2>Dp rescued animals do not show binucleated cells, but many nuclei are fragmented and decondensed. Scale: 50 μm. (B) Quantification of percentage of binucleated cells as in A. Data presented as bar plot showing mean ± SD, Kruskal-Wallis test followed by Dunn’s multiple comparisons test, ***p<0.0001, n=16 animals per genotype, two independent experiments were done. At least 606 cells were scored. (C) Confocal Z-stack-projected images of third instar larval body wall muscles ventral longitudinal 3 (VL3) (marked with white arrowhead) and ventral longitudinal 4 (VL4) from the segment A4 immunostained with rabbit anti-Dp antibody (212), phalloidin, and DAPI. Anterior is to the left. Scale: 100 μm. (D) Quantification of VL3 muscle area as in C. Data presented as box plot, whiskers min to max values, Kruskal-Wallis test followed by Dunn’s multiple comparisons test, ***p<0.0001, n=15 animals per genotype, except n=11 for Dp-/-, two independent experiments were done. Full genotypes are Dp+/Dpa3,cg-GAL4;UAS-Dp, DpExel7124/Dpa3,cg-GAL4, DpExel7124/Dpa3,cg-GAL4;UAS-Dp, DpExel7124/Dpa3; Mef2-GAL4/UAS-Dp.
-
Figure 4—source data 1
Area measurements of the VL3 muscles atthe third instar larva and the statistical analysis.
- https://cdn.elifesciences.org/articles/67753/elife-67753-fig4-data1-v2.xlsx
Figure 5 with 1 supplement
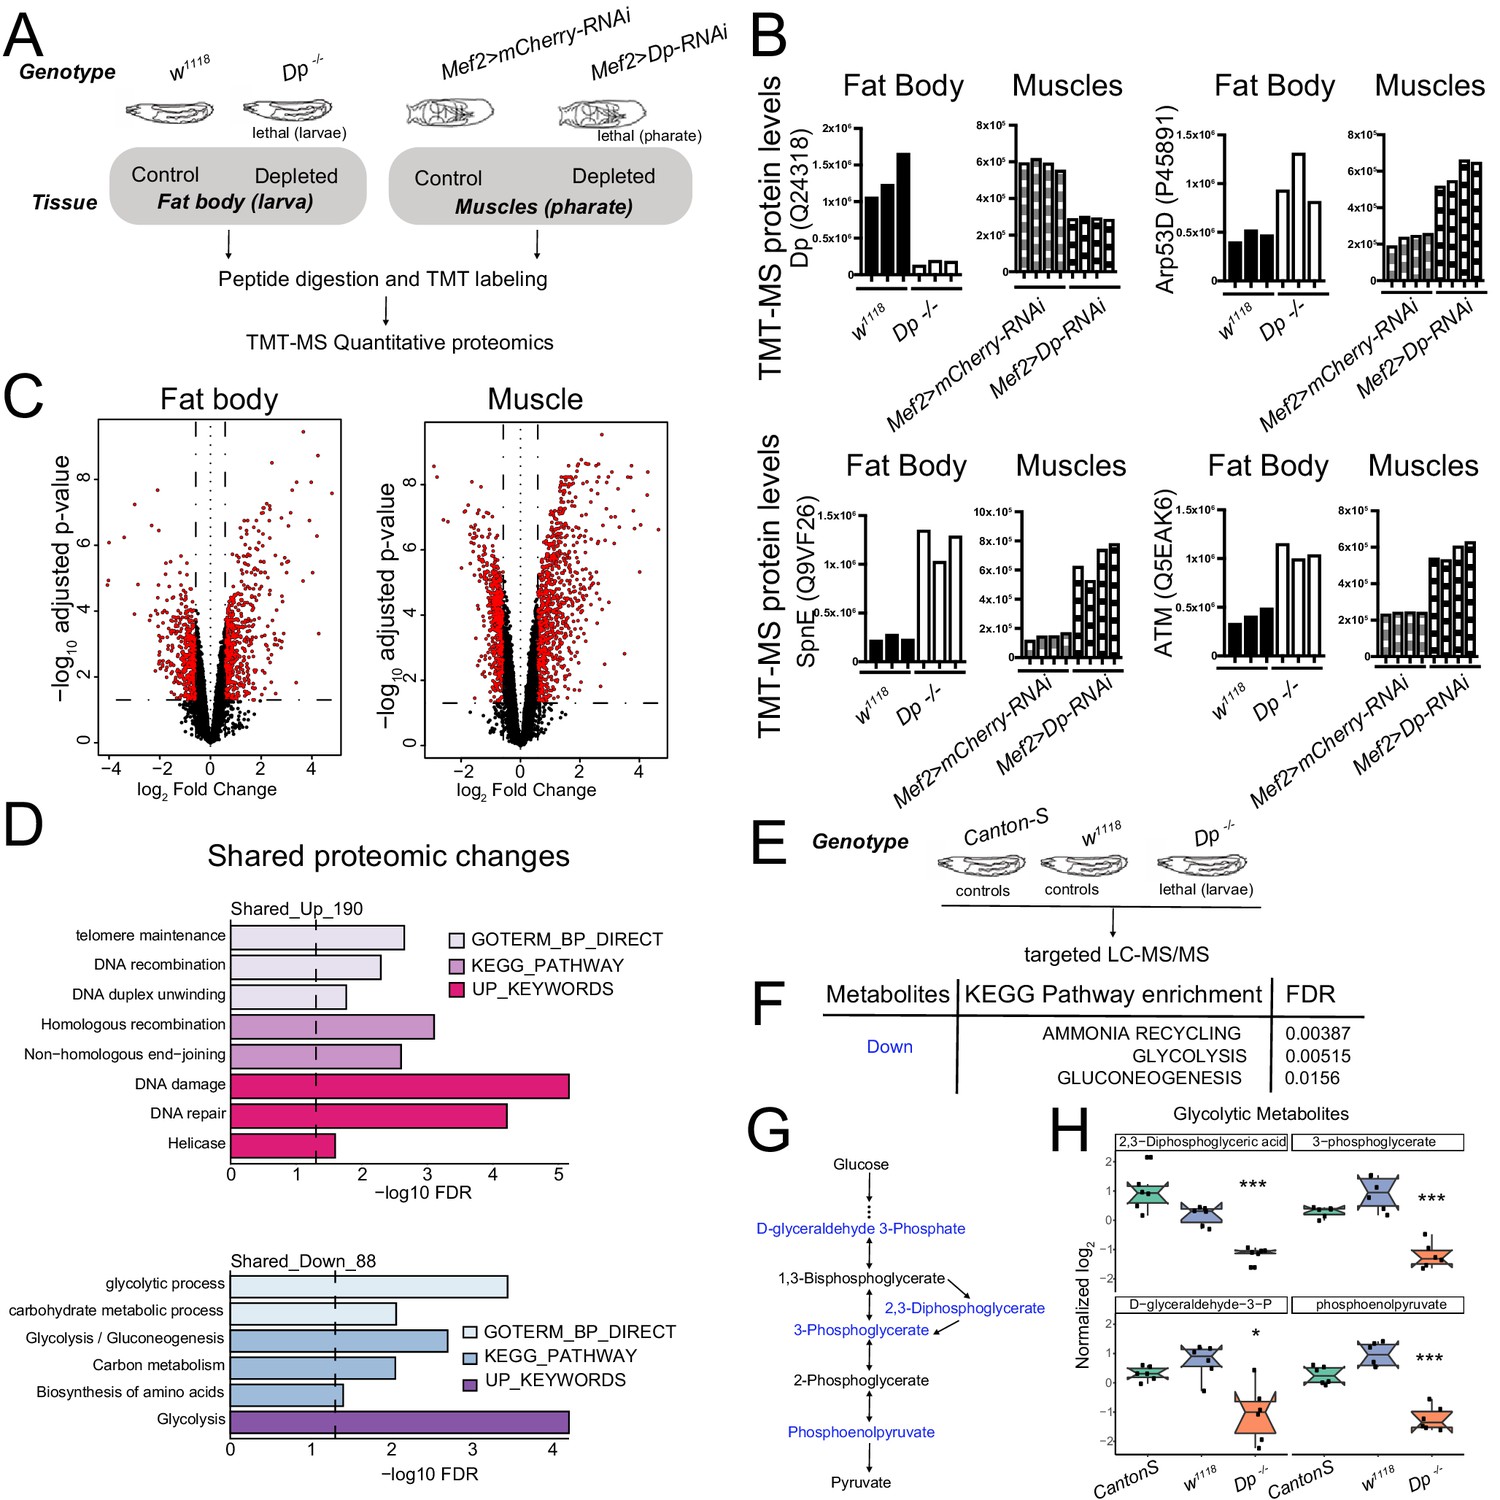
Loss of E2F/Dp impairs carbohydrate metabolism.
(A) Overview of tandem-mass tag-mass spectrometry (TMT-MS) profiles generated from third instar larval fat body in Dp-/- mutant and wild-type (WT) animals and from thoracic muscles in Mef2>Dp-RNAi and control animals staged at pharate; 6578 identified proteins in fat bodies and 5730 identified proteins in muscles. (B) TMT-MS intensities showing protein levels of Dp (Uniprot Q24318), E2F2/DP target protein Arp53 (Uniprot Q9VF26), SpnE (Uniprot P455891), and dATM (Uniprot Q5EAK6) in fat bodies and muscles. Data are represented as individual intensity value for each replicate, n = 3 per genotype in fat body and n=4 per genotype in muscles. (C) Volcano plots indicating proteins that are differentially expressed between larval WT and Dp-/- mutant fat bodies (left panel), and Mef2>mCherry-RNAi and Mef2>Dp-RNAi pharate muscles (right panel). Significant changes are shown in red (false discovery rate [FDR] < 0.05 and abs [fold change]>1.5). The x-axis is the log2 of the fold change and the y-axis is the negative log10 of the adjusted p-value. (D) DAVID functional annotation clustering analysis of proteomic changes in Dp-depleted tissue compared to WT that are in common between fat body and muscles. Upregulated (top panel, 190 proteins) and downregulated (bottom panel, 88 proteins) were analyzed separately. Dashed line indicates FDR=0.05. Only significant terms (FDR<0.05) are displayed. The categories GO term biological processes, KEGG pathway, and Up keywords are shown. (E) Overview of targeted liquid chromatography tandem mass spectrometry (LC-MS/MS) metabolomic profiles generated from whole third instar larvae. Dp-/- mutant animals were compared to two different WT animals (Canton-S and w1118). (F) KEGG pathway enrichment was done on metabolites that were significantly reduced in Dp-/- mutant compared to both controls. Only significant terms are shown (FDR<0.05). (G) Schematic of the flow of glycolysis toward pyruvate. Metabolites that are significantly reduced in Dp-/- mutant compared to controls are shown in blue. (H) Normalized levels of the metabolites D-glyceraldehyde 3-phosphate, 2,3-diphosphoglycerate, 3-phosphoglycerate, and phosphoenolpyruvate in Dp-/- mutant compared to controls w1118 and Canton-S. Data are represented as box plot, which extends from 25 to 75 percentiles; line marks median; whiskers extend to 25/75% plus 1.5 times the interquartile range. Values outside the whiskers are outliers. Welch’s ANOVA test, *p<0.05, *** p<0.001. n=6 per genotype. Full genotypes are (A–D) Dpa2/Dpa3, w1118, UAS-Dp[GD4444]-RNAi,Mef2-GAL4 and Mef2-GAL4/UAS-mCherry-RNAi (E–H) DpExel7124/Dpa3, w1118 and Canton-S.
Figure 5—figure supplement 1
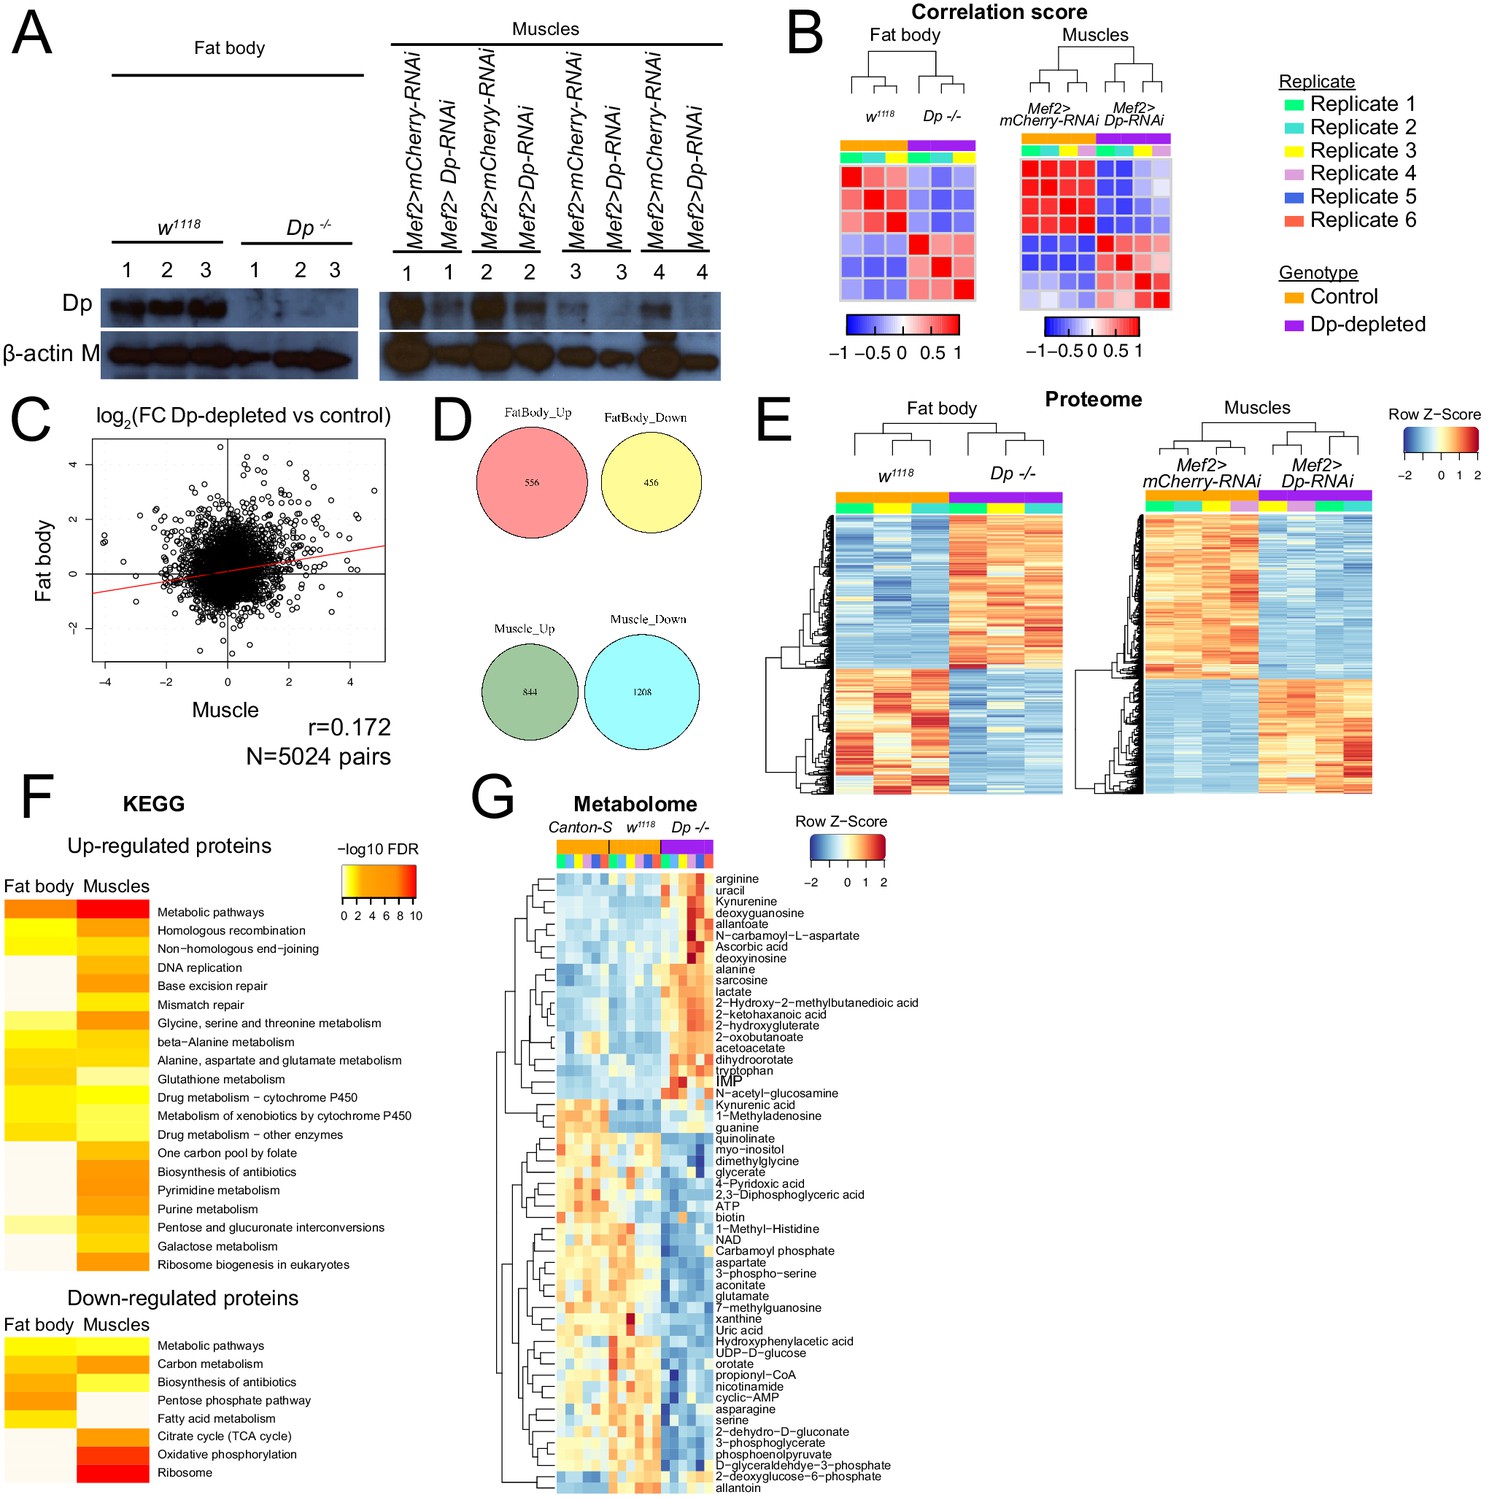
E2F/Dp-deficient muscles and fat bodies undergo severe changes in their proteome and metabolome.
(A) Western blot analysis of fat body (left panel) and muscle (right panel) protein lysates using the antibodies anti-Dp and anti-beta-actin as a loading control. n = 3 replicates per genotype for fat body and n=4 replicates per genotype for muscles. (B) Correlation score heatmap plots of log two median protein intensities across replicates from fat body (left panel) and muscle (right panel). (C) Correlation of log2FC between Dp-depleted tissue and wild type in fat body compared to muscles. Pearson correlation test, R=0.172, N=5024 pairs of proteins shared in both tissues. (D) Venn diagrams: 5024 identified proteins are shared across fat body and muscle proteomes; 556 and 844 proteins are up in Dp-depleted compared to control in fat body and muscles, respectively, and 456 and 1208 proteins are down in Dp-depleted compared to control in fat body and muscles, respectively. (E) Heatmap representation for hierarchically clustering of differentially expressed proteins (rows) between Dp-depleted tissue and control samples (column) in fat body (left panel) and muscle (right panel). n = 3 replicates per genotype for fat body and n=4 replicates per genotype for muscles. Normalized protein levels were clustered in upregulated as FC≥1.5 (red) and downregulated as FC ≤ −1.5 (blue), moderated t-test, false discovery rate (FDR)<0.05. (F) Enrichment of KEGG pathway among proteomic changes that are significantly increased (upregulated, FDR<0.05 and FC≥1.5, top panel) and reduced (downregulated, FDR<0.05 and FC ≤ −1.5, bottom panel) in Dp-depleted tissues compared with control tissue. Fat body is on the left and muscle on the right. (G) Heatmap representation showing hierarchically clustering of normalized metabolites (row) between Dp-/- mutant and both control samples (Canton-S and w1118, column) in third instar larva. Only significant changes to both controls are displayed, ANOVA test, FDR<0.05. n=6 replicates per genotype. Full genotypes are (A–F) Dpa2/Dpa3,w1118, UAS-Dp[GD4444]-RNAi,Mef2-GAL4 and Mef2-GAL4/UAS-mCherry-RNAi (G–H) DpExel7124/Dpa3, w1118 and Canton-S.
Figure 6 with 1 supplement
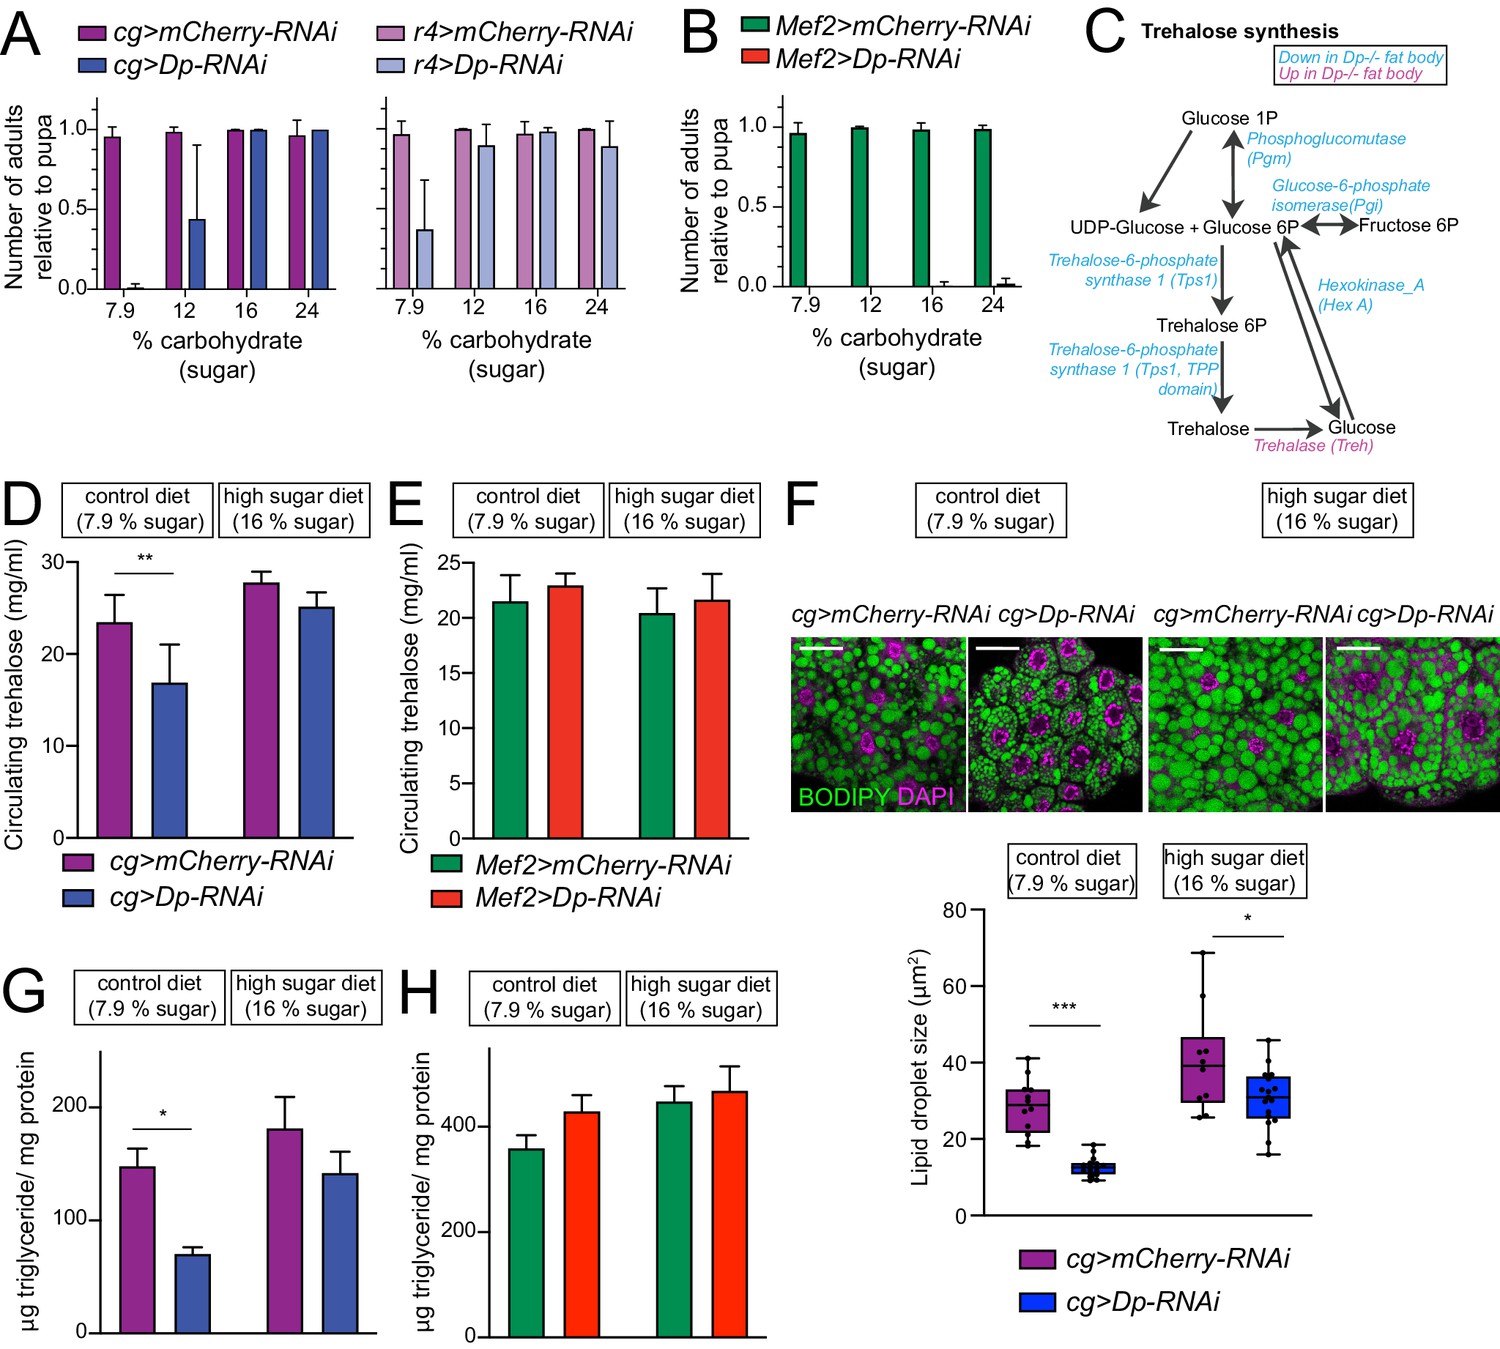
E2F/Dp in fat body exerts systemic effects modulated by sugar supplement.
(A–B) Number of viable adults (relative to pupa) fed on control diet (7.9% carbohydrate, 0.08% fat, and 1.9% protein) and increasing levels of sugar in food (12, 16% and 24% carbohydrate). Data are represented as mean ± SD, n = 6 repeats per condition. (A) Left panel: cg>mCherry RNAi and cg>DpRNAi, right panel: r4>mCherryRNAi and r4>DpRNAi. (B) Mef2>mCherry-RNAi and Mef2>Dp-RNAi. (C) Diagram of trehalose synthesis pathway. The enzymes that are significantly downregulated in Dp-deficient fat body are indicated in blue, and upregulated in magenta, based on proteome data. (D–E) Circulating trehalose levels measured in third instar larval hemolymph. (D) cg>mCherry-RNAi and cg>Dp-RNAi, and (E) Mef2>mCherry-RNAi and Mef2>Dp-RNAi larvae fed on control diet (7.9% carbohydrate) and high sugar diet (16% carbohydrate). Data are represented as mean ± SD, two-way ANOVA followed by Tukey’s multiple comparisons test, three independent experiments were done, one representative experiment is shown. (D) n = 6 per group and **p = 0.0005. (E) n = 3–6 per group and p = 0.5. (F) Top panel: Confocal single plane images of third instar larval fat bodies stained with 4,6-diamidino-2-phenylindole (DAPI) and BODIPY red. The cg>mCherry-RNAi and cg>Dp-RNAi animals were fed on control diet (7.9% carbohydrate) and supplemented with sugar (16% carbohydrate, high sugar diet). Scale: 40 μm. Bottom panel: Measurement of lipid droplet size in fat body. Data are represented as box and whiskers, min to max showing all points, n = 10–17 fat bodies per genotype, two-way ANOVA followed by Tukey’s multiple comparisons test, *p = 0.02, ***p < 0.0001, three independent experiments, one representative experiment is shown. (G–H) Triglycerides content measured in third instar larva and normalized to total protein content. (G) cg>mCherry-RNAi and cg>DpRNAi, and (H) Mef2>mCherry RNAi and Mef2>DpRNAi larvae fed on control diet (7.9% carbohydrate) and high sugar diet (16% carbohydrate). Data are represented as mean ± SEM, two-way ANOVA followed by Tukey’s multiple comparisons test, one representative experiment is shown, (G) n = 5–6 per group and *p = 0.004. Three independent experiments were done. (H) n = 5–6 per group and p = 0.2, two independent experiments were done. Full genotypes are (A) cg-GAL4,UAS-mCherry-RNAi, cg-GAL4/UAS-Dp[GD4444]-RNAi, r4-GAL4/UAS-mCherry-RNAi, UAS-Dp[GD4444]-RNAi/r4-GAL4 (B, E, H) Mef2-GAL4/UAS-mCherry-RNAi, and UAS-Dp[GD4444]-RNAi,Mef2-GAL4 (D, F, G) cg-GAL4,UAS-mCherry-RNAi and cg-GAL4/UAS-Dp[GD4444]-RNAi.
-
Figure 6—source data 1
Measurements of circulating trehaloselevels and the statistical analysis.
- https://cdn.elifesciences.org/articles/67753/elife-67753-fig6-data1-v2.xlsx
-
Figure 6—source data 2
Measurements of triglycerides levelsnormalized to protein content and the statistical analysis.
- https://cdn.elifesciences.org/articles/67753/elife-67753-fig6-data2-v2.xlsx
-
Figure 6—source data 3
Average values of the lipid droplet size measured for eachimage and the statistical analysis.
- https://cdn.elifesciences.org/articles/67753/elife-67753-fig6-data3-v2.xlsx
-
Figure 6—source data 4
MacroScript used to analyze particle size or LipidDroplets in ImageJ.
- https://cdn.elifesciences.org/articles/67753/elife-67753-fig6-data4-v2.txt
Figure 6—figure supplement 1
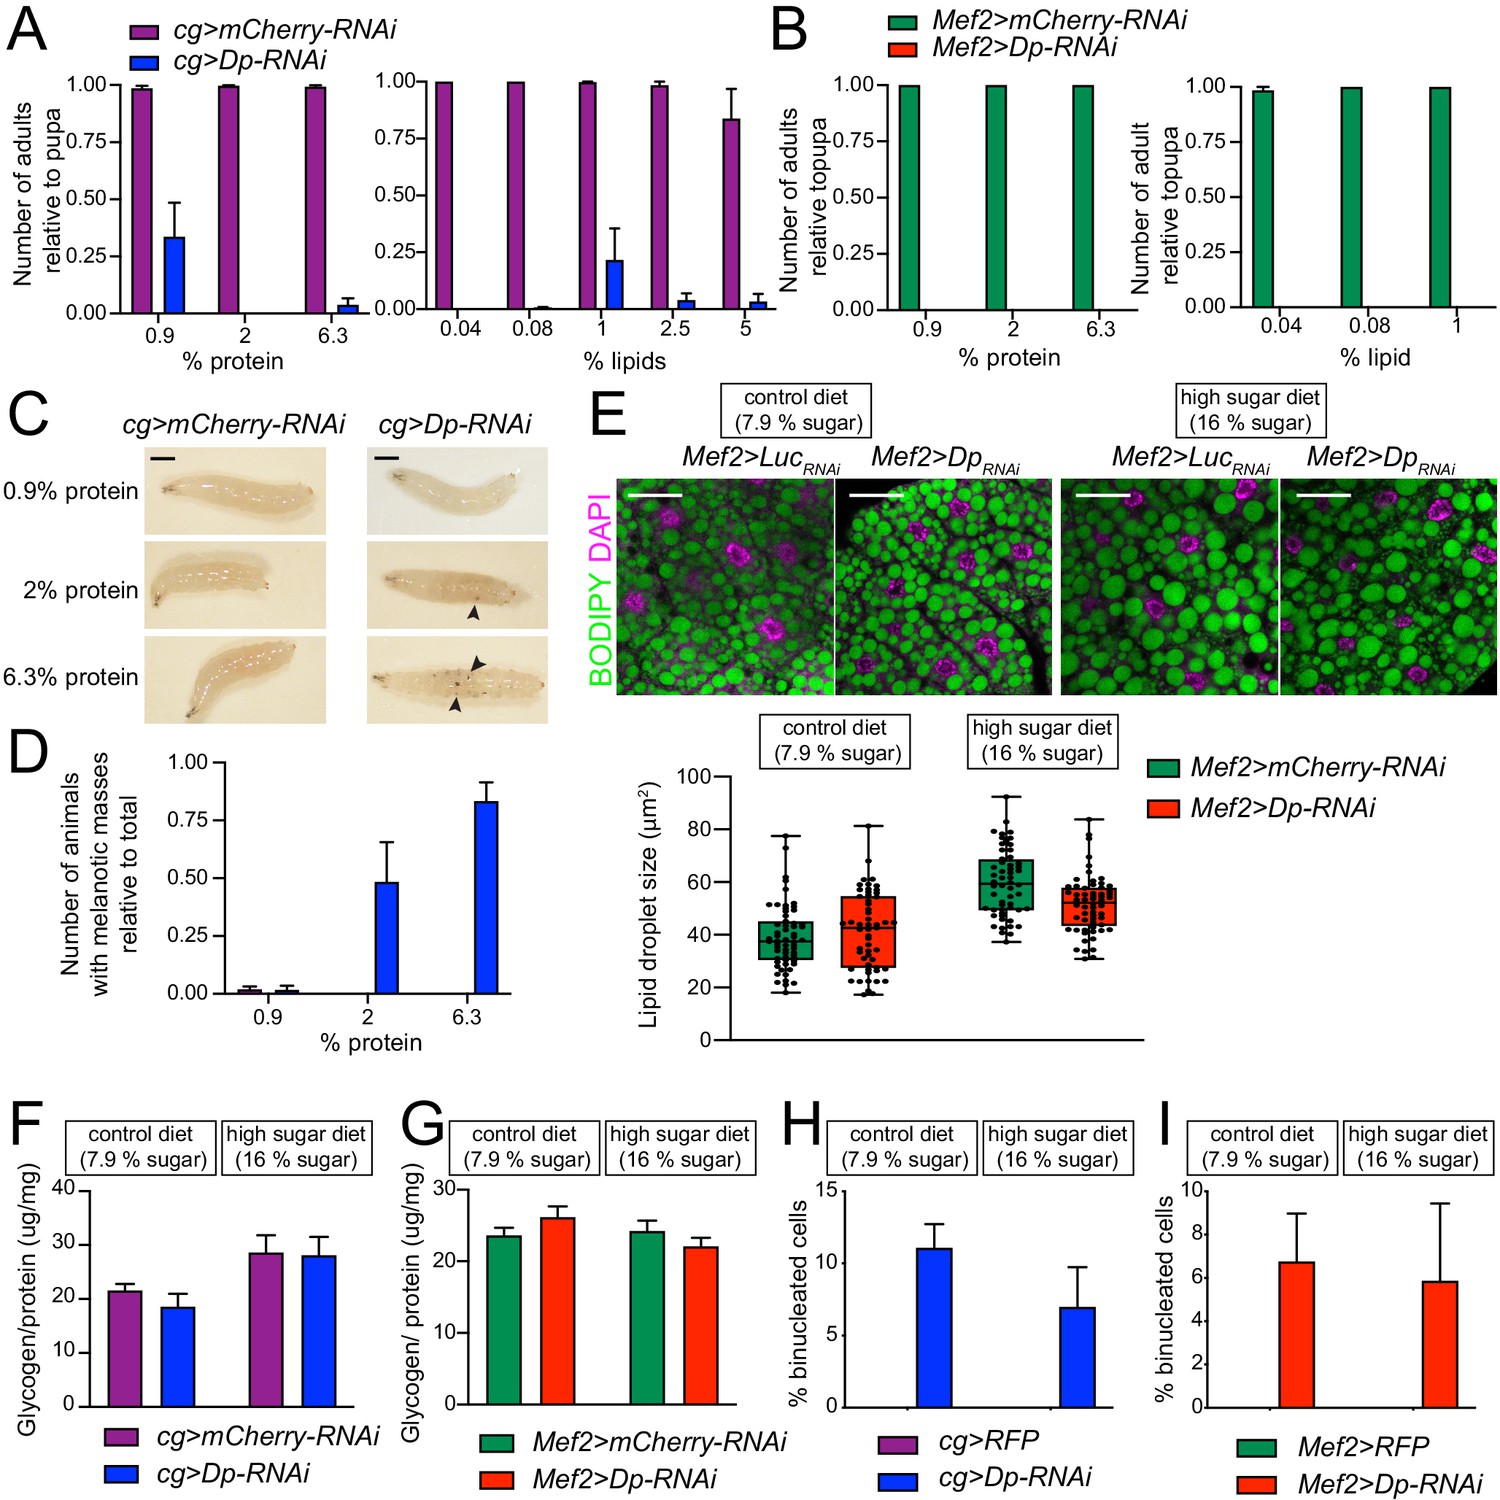
Supplementing food modifies viability of animals with E2F/Dp-deficient fat bodies.
(A–B) Number of viable adults (relative to pupa) fed on different food conditions. Left panel: Increasing levels of protein in food (0.9, 1.96% and 6.3% protein). Right panel: Increasing levels of fat in food (0.04, 0.08, 1.04, 2.5 and 5% lecithin). Data are represented as mean ± SEM, n = 2–4 samples per condition. Experiment was repeated at least three times. (A) cg>mCherry-RNAi and cg>Dp-RNAi, (B) Mef2>mCherry-RNAi and Mef2>Dp-RNAi. (C) Representative images of cg>mCherry-RNAi and cg>Dp-RNAi larvae fed on increasing levels of protein in food (0.9, 1.96% and 6.3% protein). Black arrowheads point to melanotic masses. Scale: 5 mm. (D) Quantification of number of larvae fed showing melanotic masses relative to total number of larvae harvested as in C. Data are represented as mean ± SEM, n=2–5. Three independent experiments were done. (E) Top panel: Confocal single plane images of third instar larval fat bodies stained with 4,6-diamidino-2-phenylindole (DAPI) and BODIPY. The Mef2>mCherry-RNAi and Mef2>Dp-RNAi animals were fed on control diet (7.9% carbohydrate) and supplemented with sugar (16% carbohydrate, high sugar diet). Scale: 40 μm. Bottom panel: Measurement of lipid droplet size in fat body. Data are represented as box and whiskers, min to max showing all points, n = 55–60 images per group in three independent experiments, two-way ANOVA (main effects only) followed by Tukey’s multiple comparisons test, p = 0.08 for variation between genotypes. (F–G) Total whole-body glycogen content normalized to protein content. Third instar larvae (F) cg>mCherry-RNAi and cg>Dp-RNAi (G) Mef2>mCherry-RNAi and Mef2>Dp-RNAi fed on control diet (7.9% carbohydrate, left panel) and high sugar diet (16% carbohydrate, right panel). Data are represented as mean ± SEM, n = 6 per genotype, three independent experiments were done, two-way ANOVA followed by Tukey’s multiple comparisons test, (F) p = 0.5 and (G) p = 0.9 for variation between genotypes. One representative experiment is shown. (H–I) Quantification of the percentage of binucleated cells in third instar larval fat bodies. (H) cg>mCherry-RNAi and cg>Dp-RNAi (I) Mef2>mCherry-RNAi and Mef2>Dp-RNAi were fed on control diet (7.9% carbohydrate) and high sugar diet (16% carbohydrate). Data are represented as mean ± SD, n>200 cells for Mef2>Dp-RNAi, and cg>Dp-RNAi, and n=200 cells for Mef2>RFP and cg>RFP, which did not show binucleated cells. Full genotypes are (A, C–D, F) cg-GAL4,UAS-mCherry-RNAi, cg-GAL4/UAS-Dp[GD4444]-RNAi (B, E) Mef2-GAL4/UAS-mCherry-RNAi, and UAS-Dp[GD4444]-RNAi,Mef2-GAL4 (H) cg-GAL4/UAS-RFP,Dp[GFP], cg-GAL4/Dp[GFP],UAS-Dp[GD4444]-RNAi, and (I) UAS-RFP,Dp[GFP];Mef2-GAL4, and Dp[GFP],UAS-Dp[GD4444]-RNAi,Mef2-GAL4.
Tables
Key resources table
| Reagent type (species) or resource | Designation | Source or reference | Identifiers | Additional information |
|---|---|---|---|---|
| Gene (Drosophila melanogaster) | DP transcription factor; Dp | NA | Flybase:FBgn0011763 | |
| Genetic reagent (Drosophila melanogaster) | UAS-Dp-RNAi | Vienna Drosophila Resource Center | Flybase:FBst0450633 | |
| Genetic reagent (Drosophila melanogaster) | Dp[a3] | PMID:15798191, 9271122 | ||
| Genetic reagent (Drosophila melanogaster) | Dp[a4] | PMID:15798191, 9271122 | ||
| Genetic reagent (Drosophila melanogaster) | Df(2R)Exel7124 | PMID:15798191, 9271122 | Flybase:FBab0038034; RRID:BDSC_7872 | |
| Genetic reagent (Drosophila melanogaster) | UAS-Dp | PMID:8670872; 9657151; 26823289 | ||
| Genetic reagent (Drosophila melanogaster) | Dp[GFP]; P{PTT-GA}DpCA06954 | PMID:17194782 | ||
| Genetic reagent (Drosophila melanogaster) | P{Cg-GAL4.A}2 | Bloomington Drosophila Stock Center | Flybase:FBti0027802; RRID:BDSC_7011 | |
| Genetic reagent (Drosophila melanogaster) | P{GAL4-Mef2.R}3 | Bloomington Drosophila Stock Center | Flybase:FBst0027390; RRID:BDSC_27390 | |
| Genetic reagent (Drosophila melanogaster) | P{VALIUM20-mCherry}attP2 | Bloomington Drosophila Stock Center | Flybase:FBti0143385; RRID:BDSC_35785 | |
| Genetic reagent (Drosophila melanogaster) | UAS-Luc-RNAi ; P{y[+t7.7] v[+t1.8]=TRiP.JF01355}attP2 | Bloomington Drosophila Stock Center | Flybase:FBti0130444; RRID:BDSC_31603 | |
| Genetic reagent (Drosophila melanogaster) | r4-GAL4 | Bloomington Drosophila Stock Center | Flybase:FBti0132496; RRID:BDSC_33832 | |
| Genetic reagent (Drosophila melanogaster) | P{Lpp-GAL4.B}3 | Bloomington Drosophila Stock Center | Flybase:FBti0185670; RRID:BDSC_84317 | |
| Genetic reagent (Drosophila melanogaster) | G-TRACE | Evans et al., 2009 | ||
| Genetic reagent (Drosophila melanogaster) | Canton-S | Bloomington Drosophila Stock Center | Flybase:FBst0064349 | |
| Genetic reagent (Drosophila melanogaster) | w1118 | Bloomington Drosophila Stock Center | FLYB:FBst0003605; RRID:BDSC_3605 | |
| Antibody | Mouse monoclonal anti-dDP (Yun6) | PMID:8670872 | RRID:AB_2889822 | (1:10) |
| Antibody | Rabbit polyclonal anti-Dp antibodies (#212) | PMID:12975318 | NA | (1:300) |
| Antibody | FITC Goat polyclonal anti-GFP (ab6662) | Abcam | RRID:AB_305635 | (1:500) |
| Antibody | Guinea pig anti-Rad50 | PMID:19520832 | NA | (1:100) |
| Antibody | Guinea pig anti-Mre11 | PMID:19520832 | NA | (1:100) |
| Peptide, recombinant protein | Porcine trehalase | Sigma | T8778-1UN | |
| Peptide, recombinant protein | Amyloglucosidase | Sigma | A1602 | |
| Peptide, recombinant protein | Triglyceride reagent | Sigma | T2449 | |
| Commercial assay or kit | Glucose (HK) assay reagent | Sigma | G3293 | |
| Chemical compound, drug | Triglyceride reagent | Sigma | T2449 | |
| Chemical compound, drug | Trehalose | Sigma | 90208 | |
| Chemical compound, drug | Glucose standard solutions | Sigma | G3285 | |
| Chemical compound, drug | Free glycerol reagent | Sigma | F6428 | |
| Chemical compound, drug | BODIPY 493/503 | Invitrogen | D3922 | 0.5 µg/ml |
| Chemical compound, drug | Bradford standard assay | Bio-Rad | 500–0006 | |
| Software, algorithm | ImageJ 1.52k5 | National Institutes of Health, Bethesda, MD https://imagej.nih.gov/ij/ | RRID:SCR_003070 | |
| Software, algorithm | Photoshop CC 2019 | Adobe Systems | RRID:SCR_014199 | |
| Software, algorithm | Functional Annotation Clustering – DAVID platform | https://david.ncifcrf.gov/summary.jsp | RRID:SCR_001881 | |
| Software, algorithm | Metaboanalyst | http://www.metaboanalyst.ca | RRID:SCR_015539 | |
| Software, algorithm | GraphPad Prism version 9.0.1 | GraphPad Software | RRID:SCR_002798 | |
| Software, algorithm | R | R Project for Statistical Computing | RRID:SCR_001905 |
Additional files
-
Supplementary file 1
Proteins identified and quantified by tandem-mass tag-mass spectrometry (TMT-MS) normalized intensities for 6580 proteins in fat body and 5730 in muscles.
Third instar larval w1118 and Dp-/- were collected. Fat body was dissected in three replicates for each genotype. Mef2>mCherry-RNAi and Mef2>Dp-RNAi were collected at pharate stage. Thoracic muscles were dissected in four replicates for each genotype.
- https://cdn.elifesciences.org/articles/67753/elife-67753-supp1-v2.xls
-
Supplementary file 2
Proteomic effect of E2F/Dp loss in larval fat body and thoracic muscles.
Tandem-mass tag-mass spectrometry (TMT-MS) data were log transformed and fold change was calculated between E2f/Dp-depleted tissue and control. Only 5024 proteins detected in both tissue are displayed here. Third instar larval fat body from w1118 and Dp-/- was collected. Mef2>mCherry-RNAi and Mef2>Dp-RNAi were collected at pharate stage and thoracic muscles were dissected
- https://cdn.elifesciences.org/articles/67753/elife-67753-supp2-v2.xls
-
Supplementary file 3
Enrichment analysis for KEEG pathways using the functional annotation analysis in DAVID.
List of upregulated and downregulated proteins in fat body and muscles were selected for enrichment analysis using cutoff FDR<5%, and FC>1.5 and FC<1.5, respectively.
- https://cdn.elifesciences.org/articles/67753/elife-67753-supp3-v2.xls
-
Supplementary file 4
Functional annotation clustering for common changes between fat body and muscle.
Upregulated and downregulated proteins that are in common between fat body and muscle were selected for DAVID functional annotation tool. Annotation terms were clustered based on similarity.
- https://cdn.elifesciences.org/articles/67753/elife-67753-supp4-v2.xls
-
Supplementary file 5
Raw values for metabolomics dataset.
Third instar larval Dp-/- mutant and controls, Canton-S and w1118, were profiled by liquid chromatography tandem mass spectrometry (LC-MS/MS). Original and preprocessing data. N/A means no detectable peak was found for that metabolite in that sample.
- https://cdn.elifesciences.org/articles/67753/elife-67753-supp5-v2.xls
-
Supplementary file 6
Normalized values for only significantly altered metabolites between Dp-/- mutant and two controls, Canton-S and w1118.
Third instar larval Dp-/- mutant and controls, Canton-S and w1118, were profiled by liquid chromatography tandem mass spectrometry (LC-MS/MS). Data were normalized, median centered by metabolite, and scaled. Only metabolites that were significantly altered in the Dp-/- mutant when compared to both the Canton S and w1118 genotypes are displayed.
- https://cdn.elifesciences.org/articles/67753/elife-67753-supp6-v2.xls
-
Supplementary file 7
Overrepresented KEGG pathways from altered metabolites in Dp mutant.
Enrichment analysis of the KEGG metabolic pathways.
- https://cdn.elifesciences.org/articles/67753/elife-67753-supp7-v2.xls
-
Supplementary file 8
Fly food medium composition semi-defined fly food was adapted from Lee and Micchelli, 2013.
- https://cdn.elifesciences.org/articles/67753/elife-67753-supp8-v2.xls
-
Transparent reporting form
- https://cdn.elifesciences.org/articles/67753/elife-67753-transrepform-v2.docx
Download links
A two-part list of links to download the article, or parts of the article, in various formats.
Downloads (link to download the article as PDF)
Open citations (links to open the citations from this article in various online reference manager services)
Cite this article (links to download the citations from this article in formats compatible with various reference manager tools)
E2F/Dp inactivation in fat body cells triggers systemic metabolic changes
eLife 10:e67753.
https://doi.org/10.7554/eLife.67753


