Single-cell transcriptome analysis defines heterogeneity of the murine pancreatic ductal tree
- Diabetes Center, University of California, San Francisco, United States
- Center for Bioengineering and Tissue Regeneration, University of California, San Francisco, United States
- CoLabs, University of California, San Francisco, United States
- Bakar ImmunoX Initiative, University of California, San Francisco, United States
- Department of Pharmacology, University of North Carolina at Chapel Hill, United States
- Lineberger Comprehensive Cancer Center, University of North Carolina at Chapel Hill, United States
- Division of Hematology and Oncology, Department of Medicine and Helen Diller Family Comprehensive Cancer Center, University of California, San Francisco, United States
- Evergrande Center for Immunologic Diseases, Harvard Medical School and Brigham and Women's Hospital, United States
- Department of Medicine, Division of Rheumatology, University of California, San Francisco, United States
- Department of Surgery, University of North Carolina at Chapel Hill, United States
- Parker Institute for Cancer Immunotherapy, United States
- Department of Pathology, University of California, San Francisco, United States
Figures
Figure 1 with 1 supplement
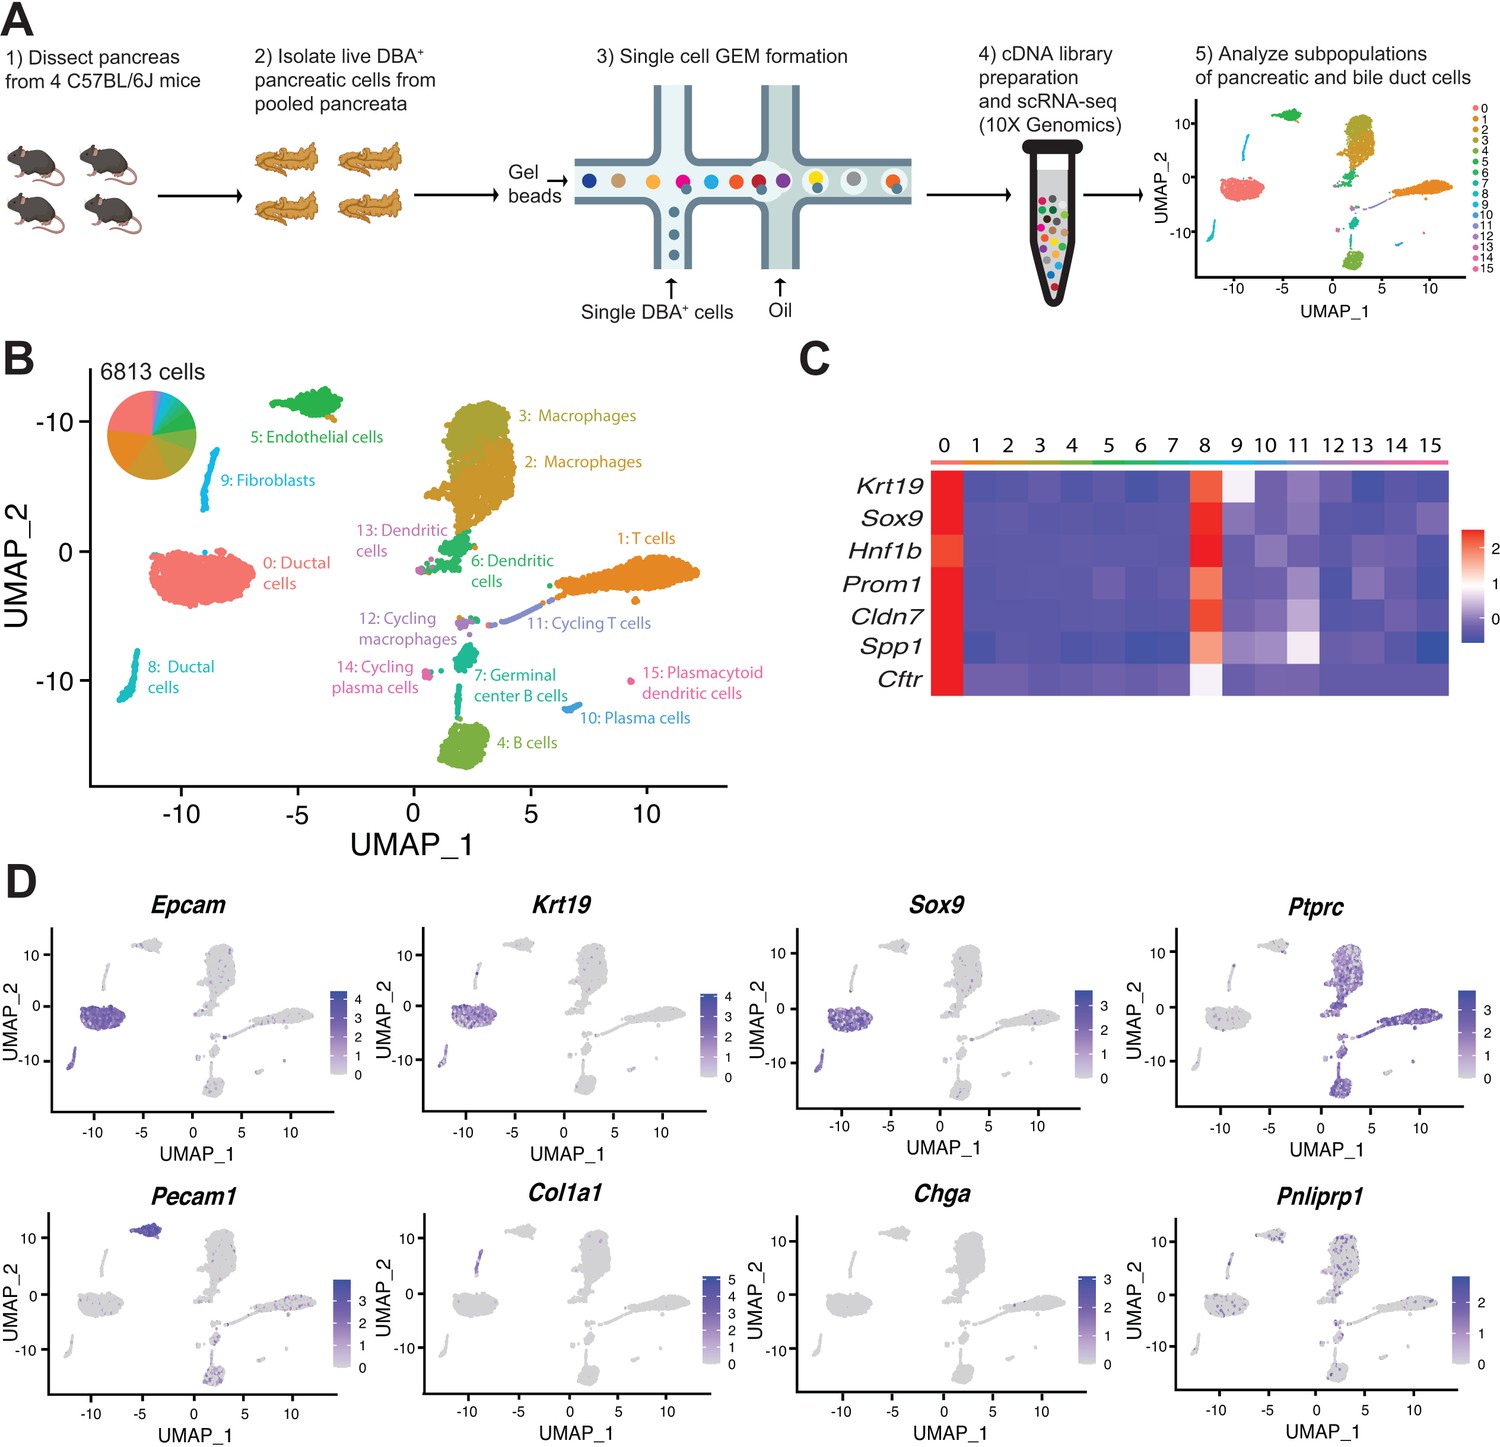
Transcriptomic map of DBA+pancreatic cells.
(A) Schematic of experiment workflow. (B) The Uniform Manifold Approximation and Projection depicts murine pancreatic DBA+ cells obtained using the protocol. (C) A matrix plot shows average expression of ductal cell markers in all clusters, identifying clusters 0 and 8 as ductal cells. (D) Feature plots illustrate markers of various cell types including epithelial (Epcam), ductal (Krt19 and Sox9), CD45+ immune cells (Ptprc), endothelial cells (Pecam1), fibroblasts (Col1a1), endocrine cells (Chga), and acinar cells (Pnliprp1). We observed low-level expression of acinar cell markers uniformly across all clusters that is likely contaminating acinar cell mRNA.
-
Figure 1—source data 1
Number of cells and average number of genes and transcripts in all DBA+ clusters.
- https://cdn.elifesciences.org/articles/67776/elife-67776-fig1-data1-v2.xlsx
-
Figure 1—source data 2
Differentially expressed genes in all DBA+ clusters.
- https://cdn.elifesciences.org/articles/67776/elife-67776-fig1-data2-v2.xlsx
Figure 1—figure supplement 1
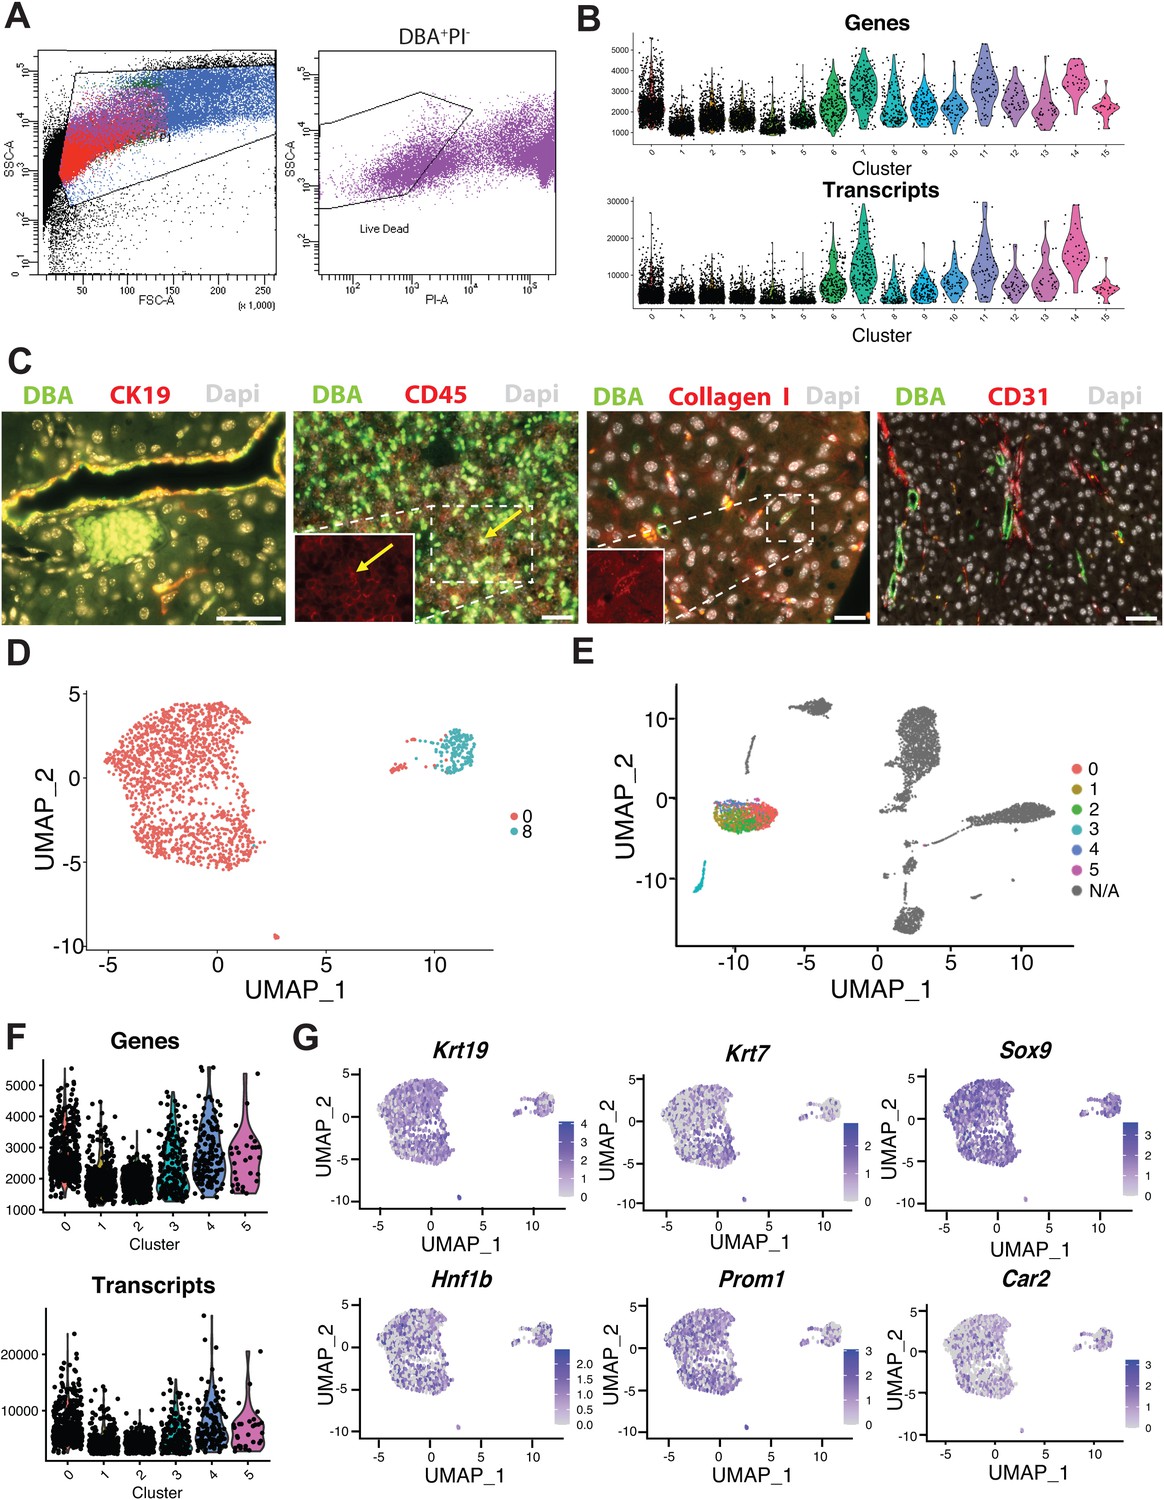
Features of DBA+ (clusters 0–15) and ductal (clusters 0–5) cells.
(A) The sorting strategy for live, DBA+ pancreatic cells is displayed. The graph on the left shows the cells plotted by forward and side scatter. In this graph, red cells are PI+, purple cells are DBA+PI-, and blue and green cells are doublets. The graph on the right shows the gating strategy used to sort DBA+PI- pancreatic cells. (B) The number of genes and transcripts for each cell in clusters 0–15 is shown. (C) Co-immunofluorescence labeling identifies CK19+DBA+ and Collagen I+DBA+ copositive pancreatic cells and CD45+DBA+ copositive pancreatic lymph node cells. Pancreatic CD31+ cells are not DBA+. A yellow arrow points to a copositive cell. Scale bars are 50 µm. (D) The plot shows whether a ductal cell (from the 0–15 cluster dataset) is in cluster 0 or 8 in the 0–5 cluster Uniform Manifold Approximation and Projection (UMAP). (E) This plot depicts the location of the ductal clusters 0–5 in the 0–15 cluster UMAP. (F) Violin plots show the number of genes and transcripts in each cell for ductal clusters 0–5. (G) Feature plots depict expression of genes normally enriched in pancreatic duct cells.
Figure 2 with 3 supplements
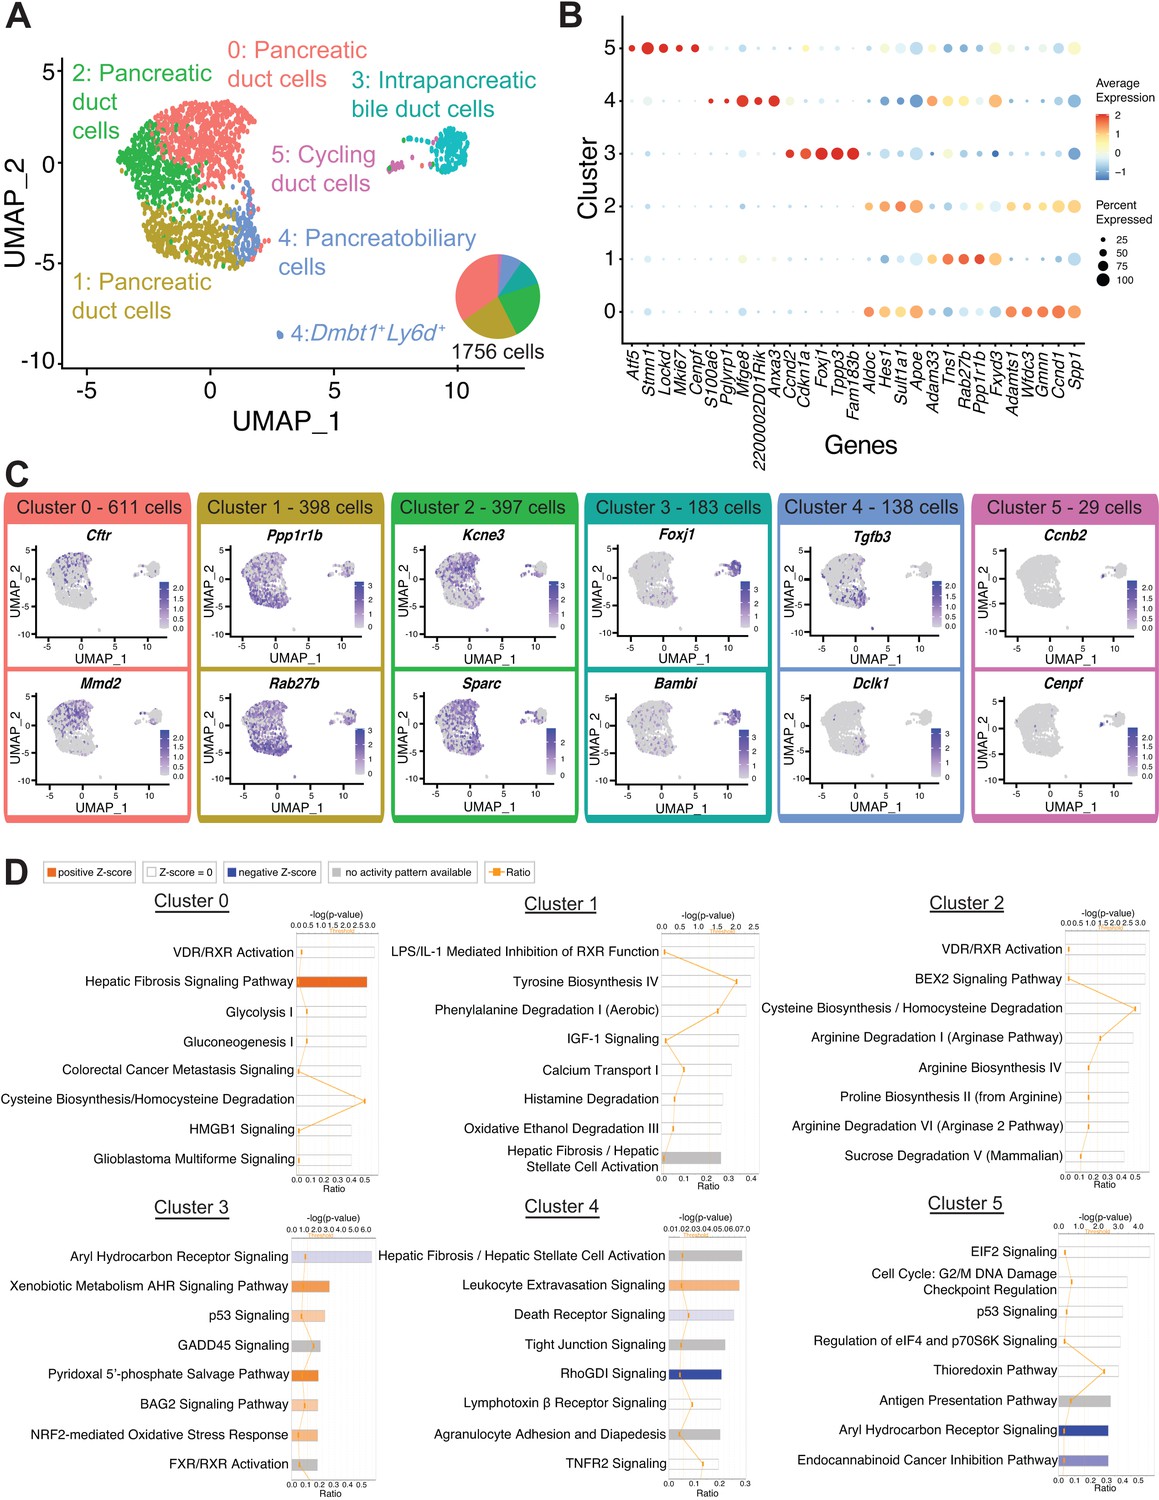
Transcriptomic map of DBA+pancreatic duct cells.
(A) Uniform Manifold Approximation and Projection (UMAP) depicts identity of clusters. (B) The dot plot shows the top five significantly differentially expressed genes (DEGs) with the highest fold change for each cluster. (C) Feature plots show expression of significantly DEGs for clusters 0, 1, 3, 4, and 5. Cluster 2 is characterized by lack of or low-level expression of significantly DEGs found in other clusters. (D) Ingenuity pathways analysis (IPA) results show the top eight deregulated pathways when comparing a cluster to all other clusters. The ratio line indicates the fraction of molecules significantly altered out of all molecules that map to the canonical pathway from within the IPA database. A positive z-score represents upregulation, and a negative z-score indicates downregulation of a pathway in that cluster when compared to all other clusters. A gray bar depicts significant overrepresentation of a pathway, the direction of which cannot yet be determined.
-
Figure 2—source data 1
Differentially expressed genes in all DBA+ duct clusters.
- https://cdn.elifesciences.org/articles/67776/elife-67776-fig2-data1-v2.xlsx
-
Figure 2—source data 2
Ingenuity pathways analysis results for all DBA+ duct clusters.
- https://cdn.elifesciences.org/articles/67776/elife-67776-fig2-data2-v2.xls
-
Figure 2—source data 3
Ingenuity pathways analysis upstream regulator analysis results for all DBA+ duct clusters.
- https://cdn.elifesciences.org/articles/67776/elife-67776-fig2-data3-v2.xls
-
Figure 2—source data 4
Number of cells and average number of genes and transcripts in all DBA+ duct clusters.
- https://cdn.elifesciences.org/articles/67776/elife-67776-fig2-data4-v2.xlsx
Figure 2—figure supplement 1
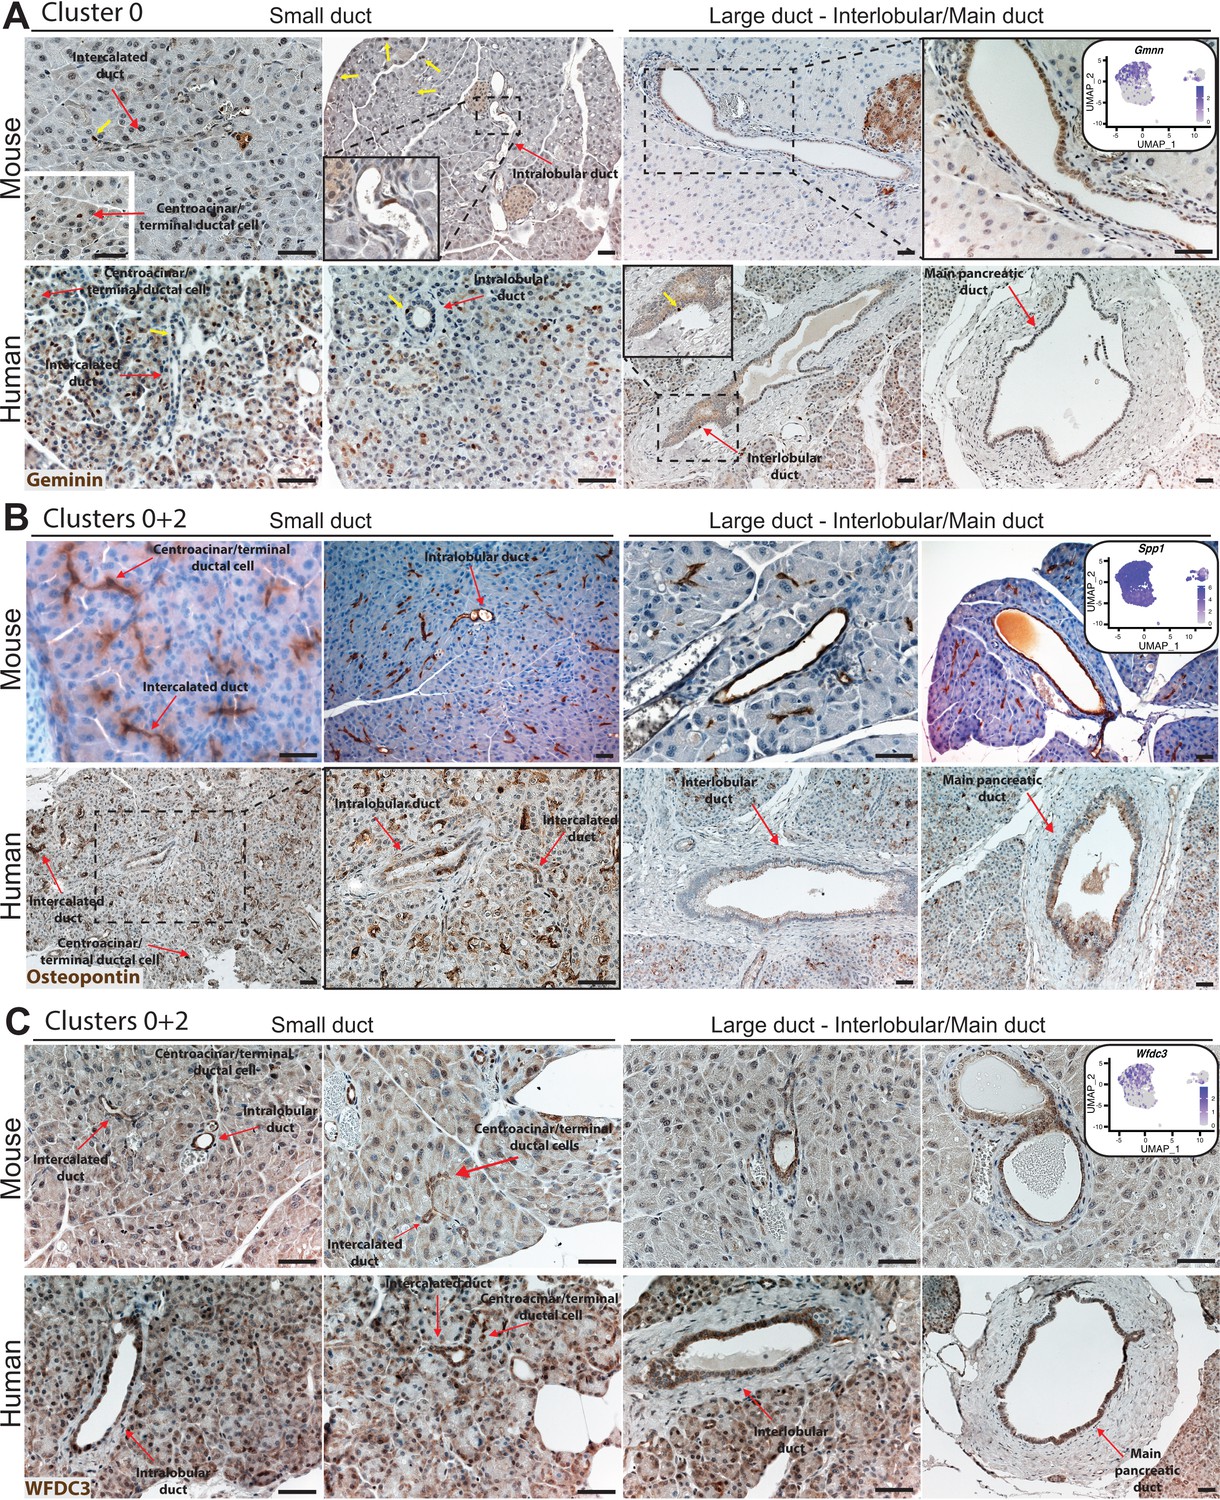
IHC illustrates expression of markers in clusters 0 and 2 in the mouse and human ductal tree.
(A) Geminin is expressed in rare ductal cells and acinar cells in the mouse and human pancreas. Yellow arrows point to geminin-positive cells. (B) Osteopontin expression is observed in all duct cell types throughout the mouse and human ductal tree as well as in acinar cells. (C) WFDC3 is expressed in all duct cell types in the mouse and human pancreas and in acinar cells. Red arrows point to the indicated duct type. Scale bars are 40 µm.
Figure 2—figure supplement 2
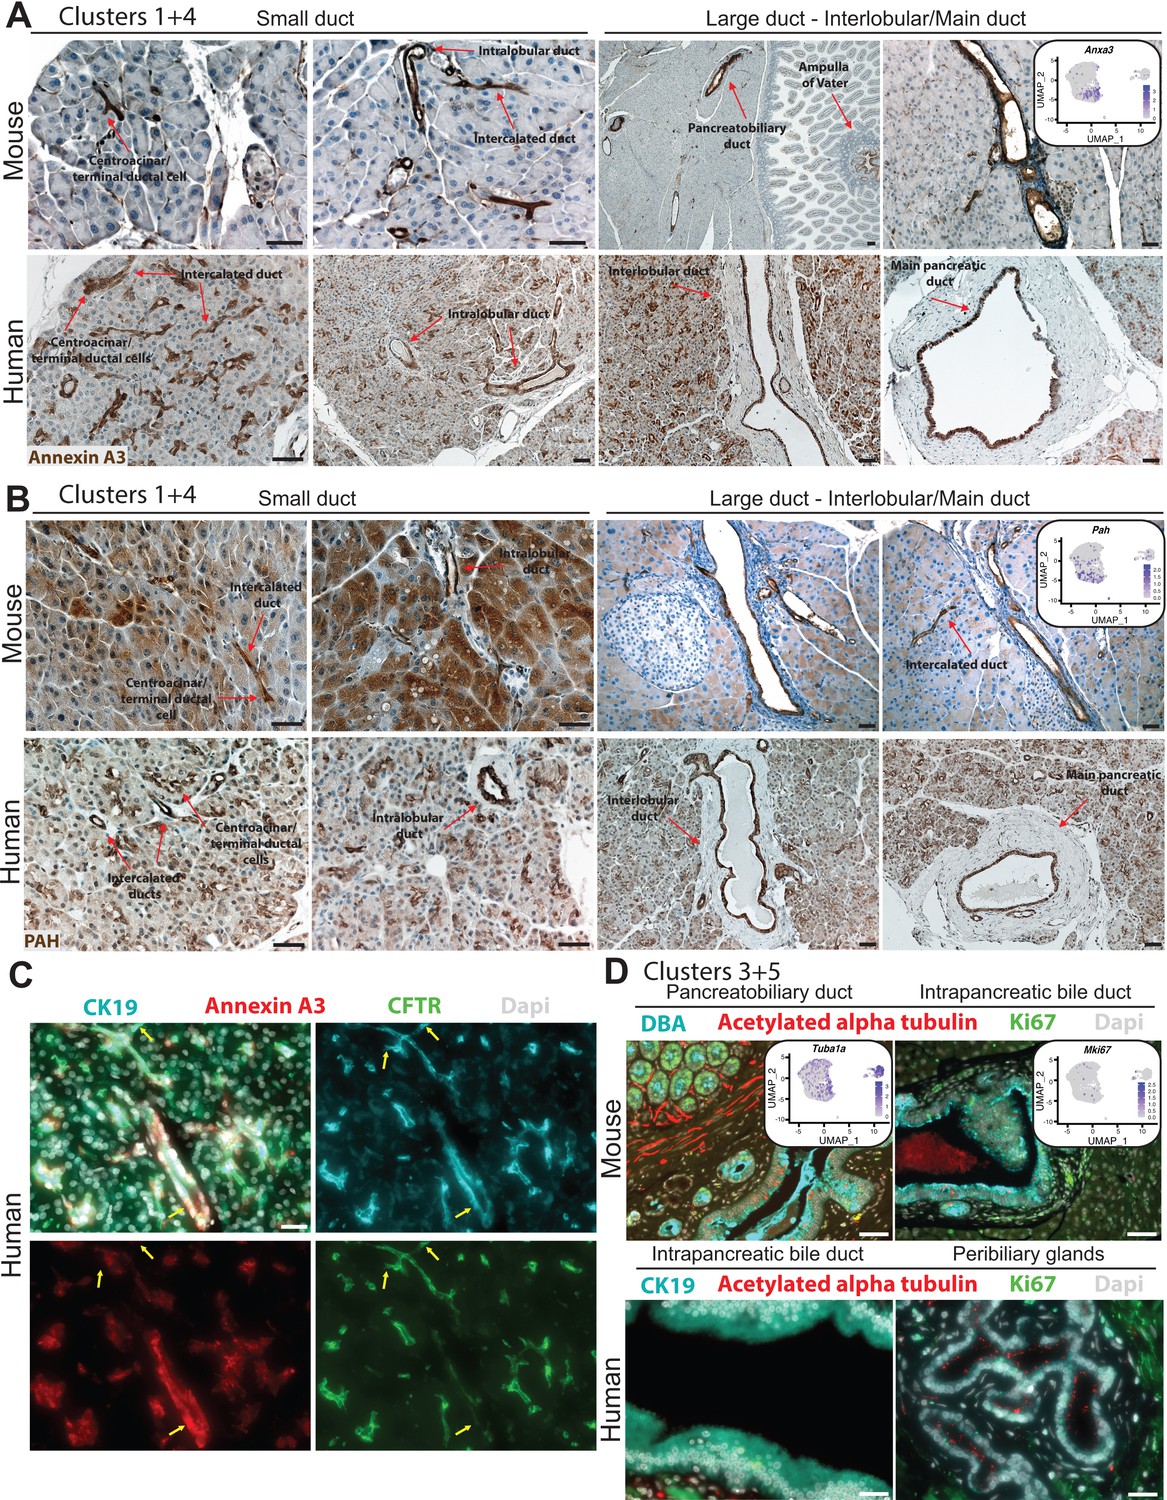
IHC and IF depict expression of markers in clusters 1, 3, 4, and 5 in mouse and human pancreas duct cells.
(A) Annexin A3 expression is observed in all ductal cell types in the mouse and human pancreas. The left mouse IHC image under Large duct – Interlobular/Main duct shows Annexin A3 cytoplasmic expression in pancreatobiliary cells and cells within the Ampulla of Vater. Scale bars are 40 µm. (B) PAH is expressed in all duct types throughout the mouse and human ductal tree as well as in acinar cells. Scale bars are 40 µm. (C) Yellow arrows point to heterogeneous expression of ductal markers CFTR, Annexin A3, and CK19 in human pancreatic duct cells. Scale bars are 20 µm. (D) Proliferating and acetylated alpha tubulin-positive duct cells are observed in the intrapancreatic bile duct, peribiliary glands, and pancreatobiliary cells in mouse and human. Scale bars are 50 µm.
Figure 2—figure supplement 3
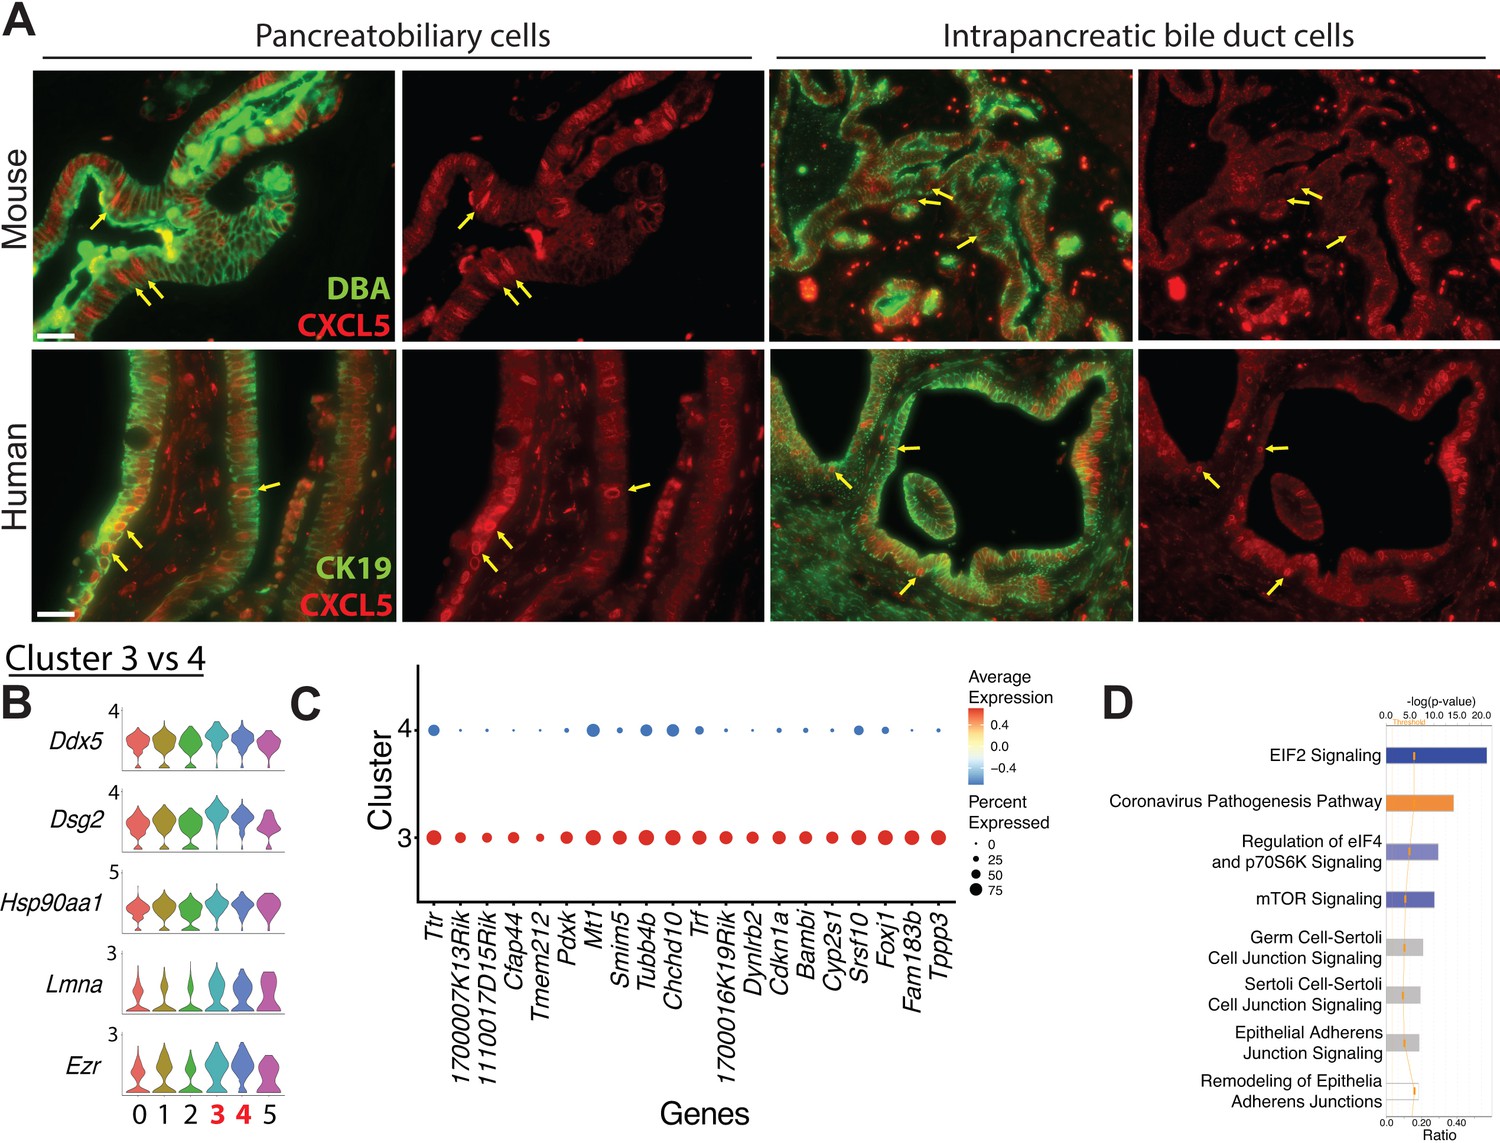
Characteristics of intrapancreatic bile duct and pancreatobiliary cells.
(A) CXCL5, another marker of the Dmbt1+Ly6d+ subpopulation,-positive cells are located in murine and human intrapancreatic bile duct cells, peribiliary glands, and pancreatobiliary cells. Yellow arrows point to ductal cells displaying upregulated CXCL5. Scale bars are 50 µm. (B) Stacked violin plots show expression of five genes, which are upregulated in clusters 3 and 4. (C) The dot plot shows the top 20 differentially expressed genes ranked by fold change when comparing cluster 3 vs. 4.
-
Figure 2—figure supplement 3—source data 1
Differentially expressed genes comparing duct cluster 3 vs. 4.
- https://cdn.elifesciences.org/articles/67776/elife-67776-fig2-figsupp3-data1-v2.xlsx
-
Figure 2—figure supplement 3—source data 2
Ingenuity pathways analysis results comparing duct cluster 3 vs. 4.
- https://cdn.elifesciences.org/articles/67776/elife-67776-fig2-figsupp3-data2-v2.xls
-
Figure 2—figure supplement 3—source data 3
Ingenuity pathways analysis upstream regulator analysis comparing duct cluster 3 vs. 4.
- https://cdn.elifesciences.org/articles/67776/elife-67776-fig2-figsupp3-data3-v2.xls
Scheme 1
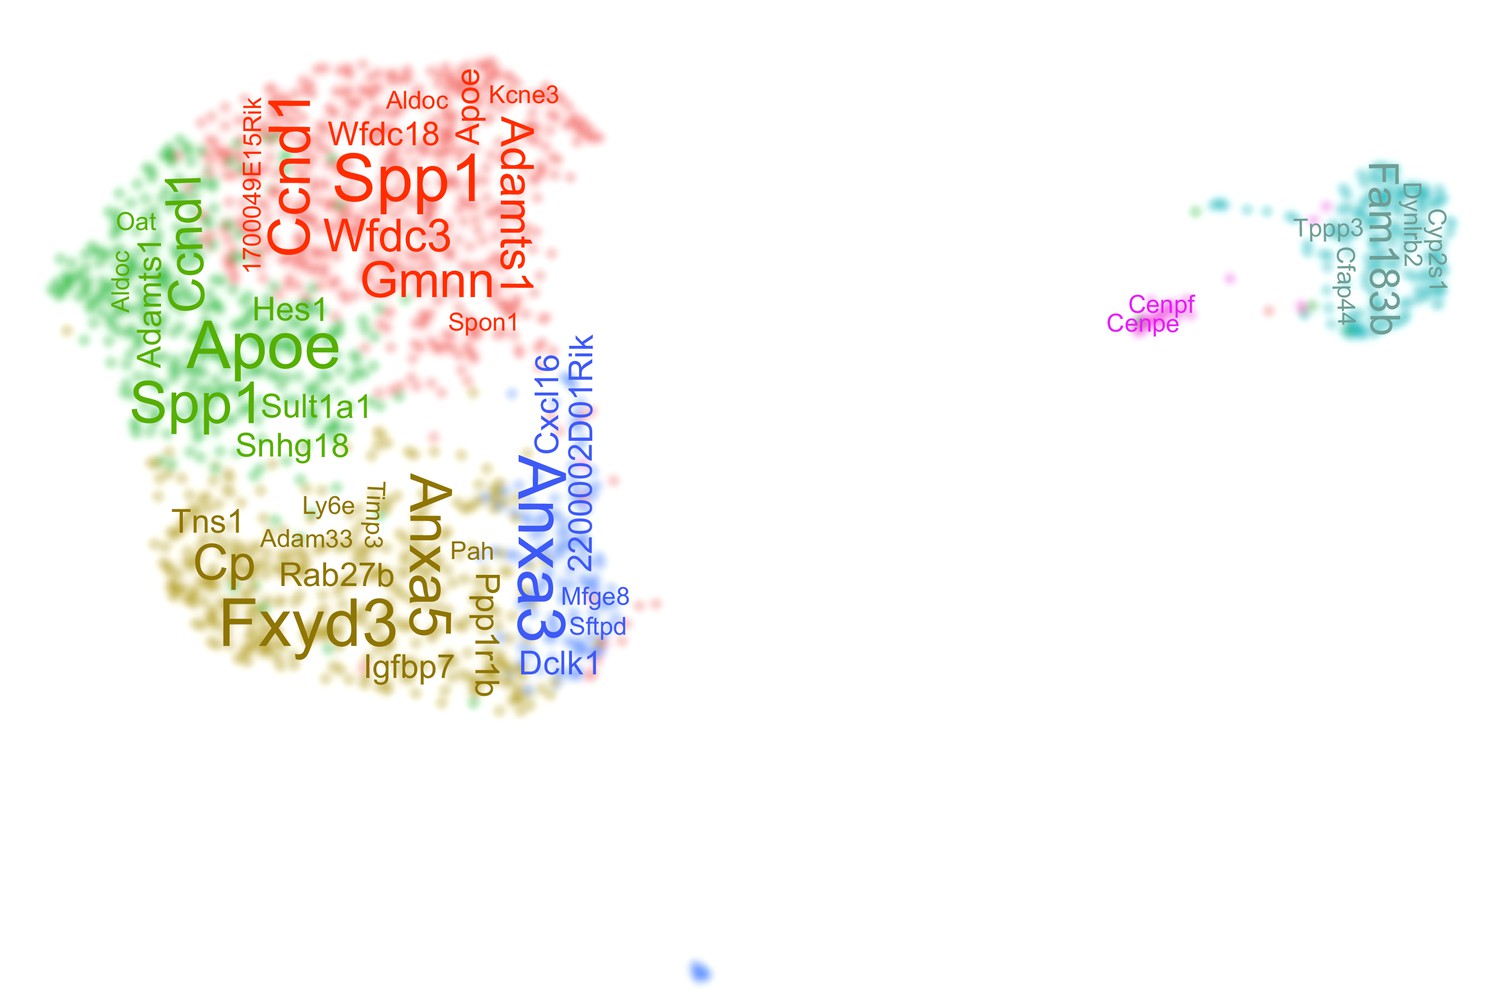
A word cloud depicts the top differentially expressed genes in each duct cluster.
Figure 3 with 3 supplements
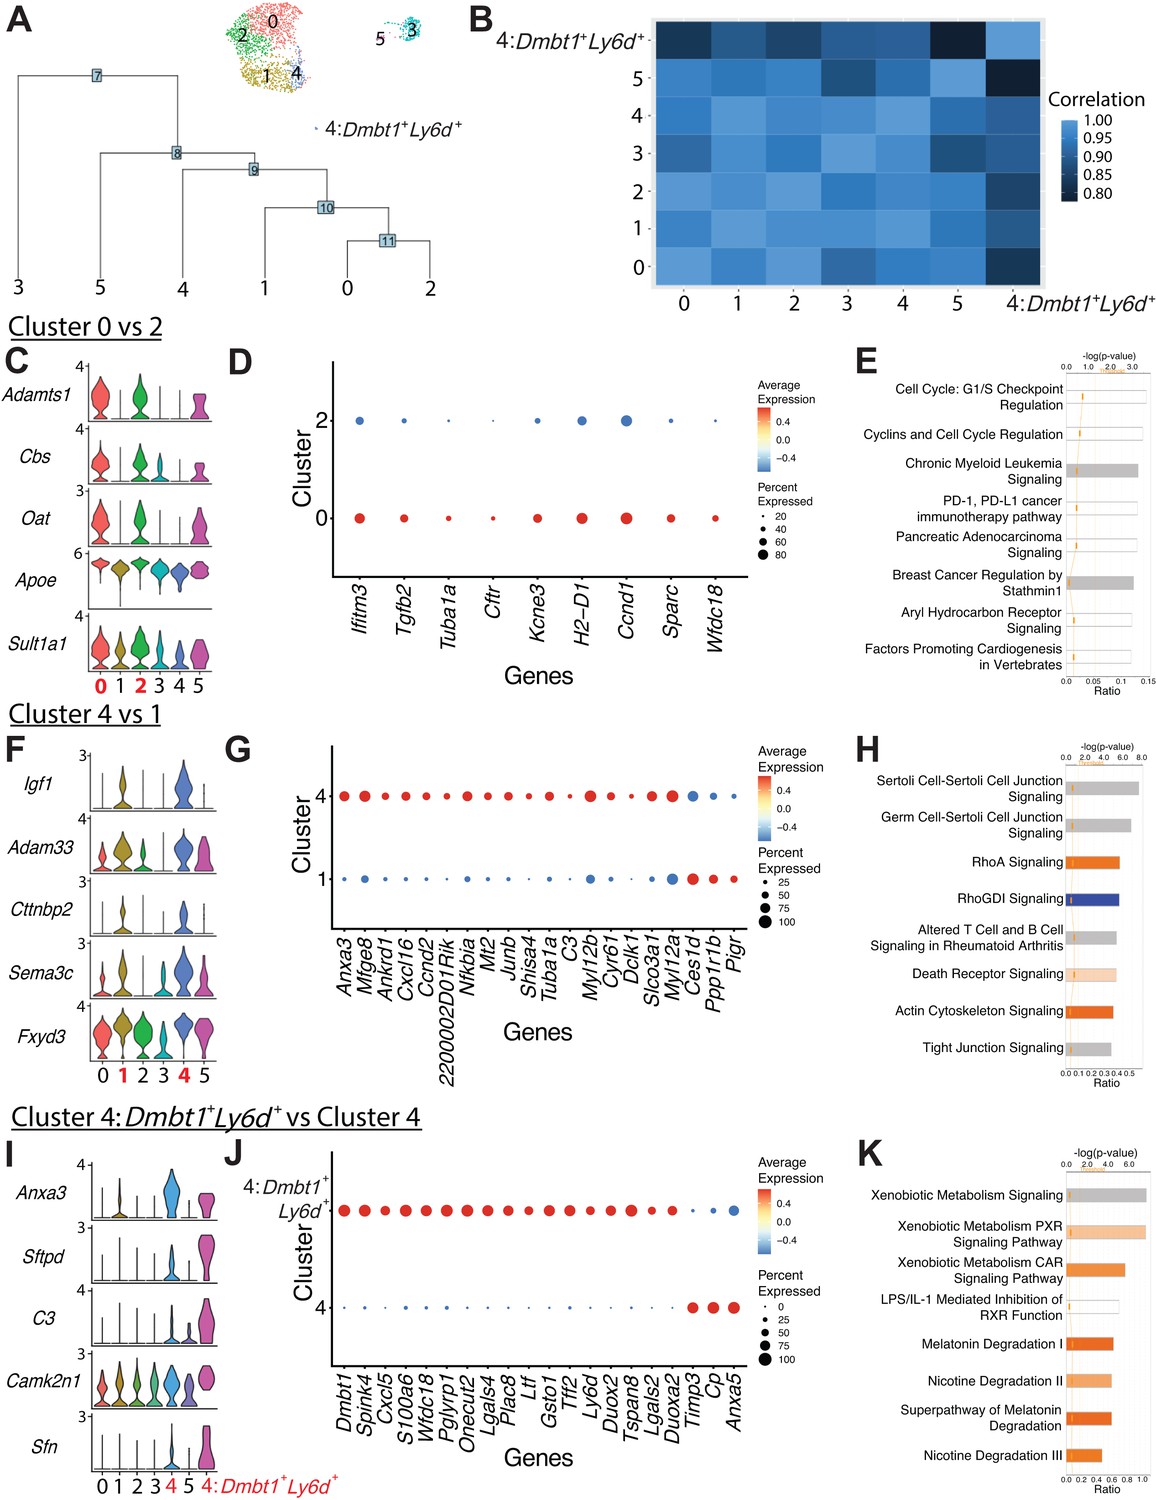
Comparison of ductal clusters 0 vs. 2, 4 vs. 1, and 4 vs. 4:Dmbt1+Ly6d+.
(A) The cluster dendrogram created using dims (used to define the cluster) shows the Euclidean relationships between clusters. The tree is calculated in the principal component analysis space. The genes used to define the tree were set as the variable features of the object. (B) Pearson’s correlation calculated using average gene expression is depicted. (C) Stacked violin plots show five differentially expressed genes (DEGs) sharing similar expression patterns in clusters 0 and 2. (D) The dot plot shows all nine DEGs found when comparing cluster 0 vs. 2. (E) The top eight altered pathways from ingenuity pathways analysis (IPA) comparing cluster 0 vs. 2 are depicted. (F) Stacked violin plots show five DEGs sharing similar expression patterns in clusters 4 and 1. (G) The dot plot shows the top 20 DEGs ranked by fold change when comparing cluster 4 vs. 1. (H) The top eight deregulated pathways from IPA comparing cluster 4 vs. 1 are depicted. (I) Stacked violin plots of five DEGs sharing similar expression patterns in clusters 4:Dmbt1+Ly6d+ and 4. (J) The dot plot shows the top 20 DEGs ranked by fold change when comparing clusters 4:Dmbt1+Ly6d+ and 4. (K) The top eight changed pathways from IPA comparing clusters 4:Dmbt1+Ly6d+ and 4 are depicted.
-
Figure 3—source data 1
Differentially expressed genes comparing duct cluster 0 vs. 2, duct cluster 4 vs. 1, and duct cluster 4-Dbmt1+Ly6d+ vs. 4.
- https://cdn.elifesciences.org/articles/67776/elife-67776-fig3-data1-v2.xlsx
-
Figure 3—source data 2
Ingenuity pathways analysis results comparing duct cluster 0 vs. 2, duct cluster 4 vs. 1, and duct cluster 4-Dbmt1+Ly6d+ vs. 4.
- https://cdn.elifesciences.org/articles/67776/elife-67776-fig3-data2-v2.xls
-
Figure 3—source data 3
Ingenuity pathways analysis upstream regulator analysis comparing duct cluster 0 vs. 2, duct cluster 4 vs. 1, and duct cluster 4-Dbmt1+Ly6d+ vs. 4.
- https://cdn.elifesciences.org/articles/67776/elife-67776-fig3-data3-v2.xls
Figure 3—figure supplement 1
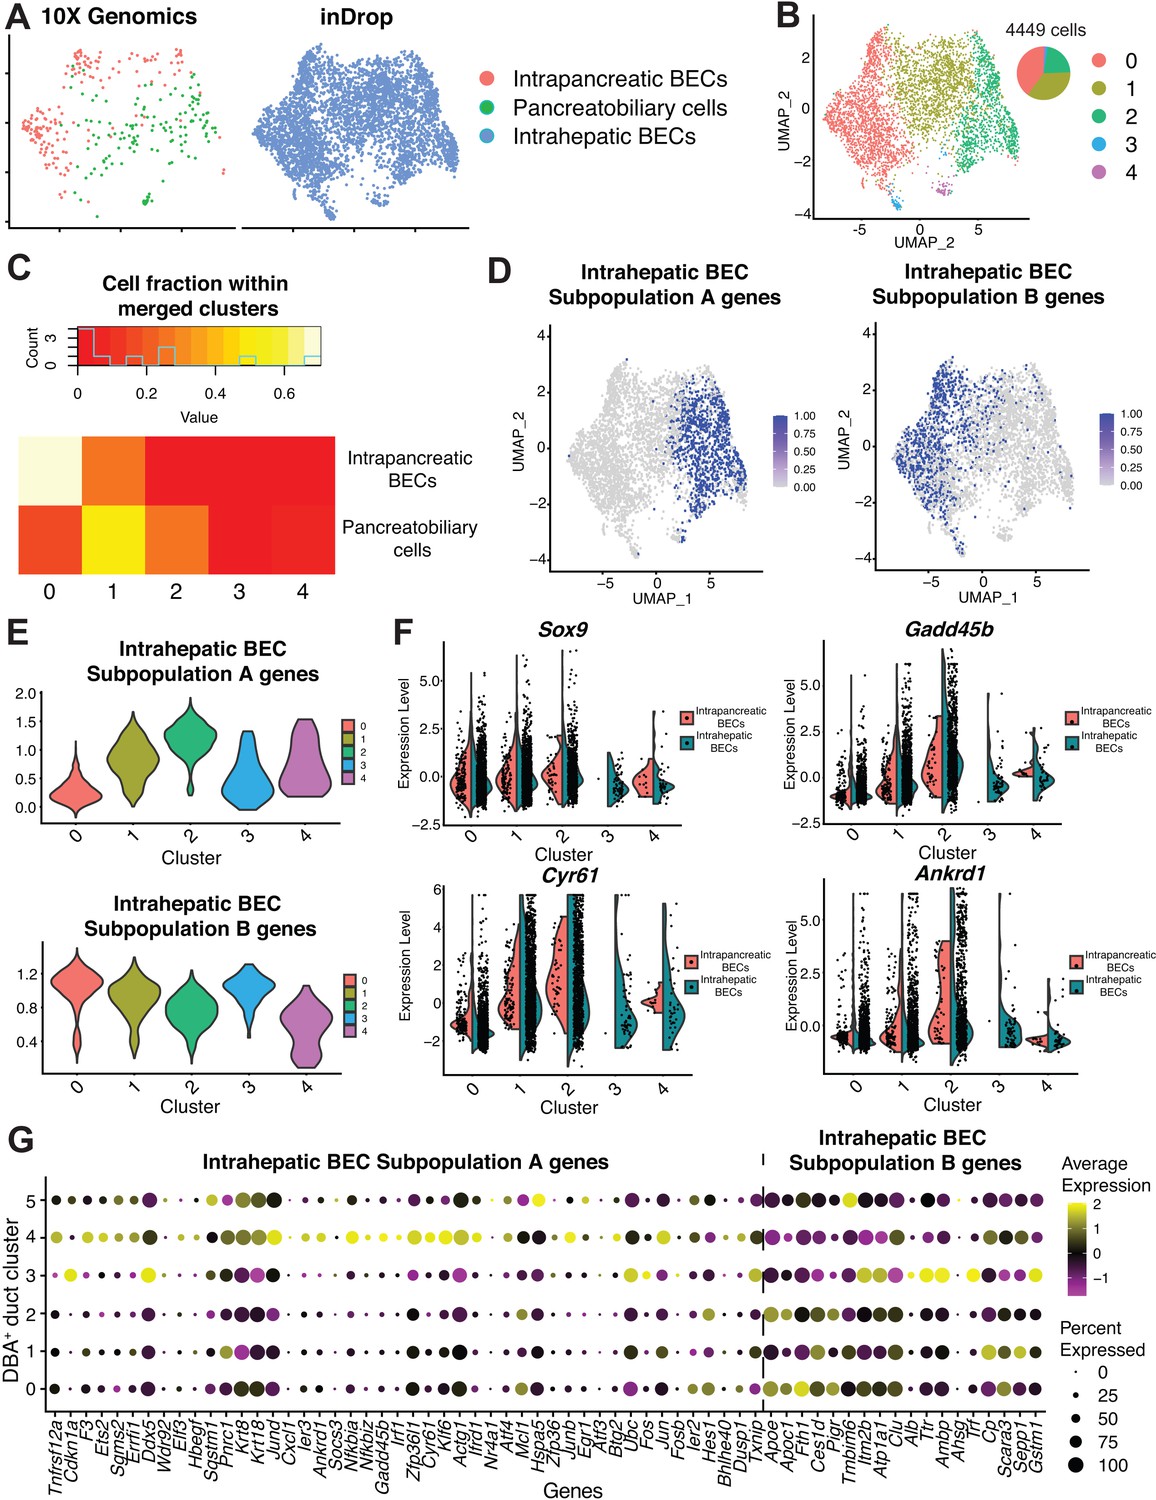
Alignment to an adult murine hepatic biliary epithelial cell (BEC) dataset.
(A) Uniform Manifold Approximation and Projection (UMAP) showing alignment of adult murine hepatic BECs (blue) to our murine intrapancreatic bile duct cells (red) and pancreatobiliary cells (green). (B) Clustering of merged datasets defines five clusters. (C) Intrapancreatic bile duct cells in DBA+ duct cluster 3 are primarily located within the merged clusters 0 and 1, and pancreatobiliary cells in DBA+ duct cluster 4 are primarily located within the merged clusters 1 and 2. The heatmap shows the percent of cells from our clusters 3 and 4 within each of the merged clusters 0–4. (D) Feature plots depict the 75th percentile and higher of cells expressing the published gene signatures of hepatic BEC subpopulation A and B, respectively. (E) Cells in clusters 1, 2, and 4 have the strongest enrichment for subpopulation A genes, while cells in clusters 0, 1, and 3 have the strongest enrichment for subpopulation B genes in the merged dataset. (F) Dual violin plots show expression of the ductal marker Sox9 and the YAP1 targets Cyr61, Ankrd1, and Gadd45b in the merged clusters. (G) Dot plot shows expression of hepatic BEC subpopulation A and B genes, analyzed by t-SNE, in Figure 1D of Pepe-Mooney et al., 2019 in our murine pancreas DBA+ duct clusters 0–5.
-
Figure 3—figure supplement 1—source data 1
Number of cells and average number of genes and transcripts for merged BEC–DBA+ duct clusters 3 and 4 dataset. BEC: biliary epithelial cell.
- https://cdn.elifesciences.org/articles/67776/elife-67776-fig3-figsupp1-data1-v2.xlsx
-
Figure 3—figure supplement 1—source data 2
Differentially expressed genes in merged BEC–DBA+ duct clusters 3 and 4 dataset. BEC: biliary epithelial cell.
- https://cdn.elifesciences.org/articles/67776/elife-67776-fig3-figsupp1-data2-v2.xlsx
Figure 3—figure supplement 2
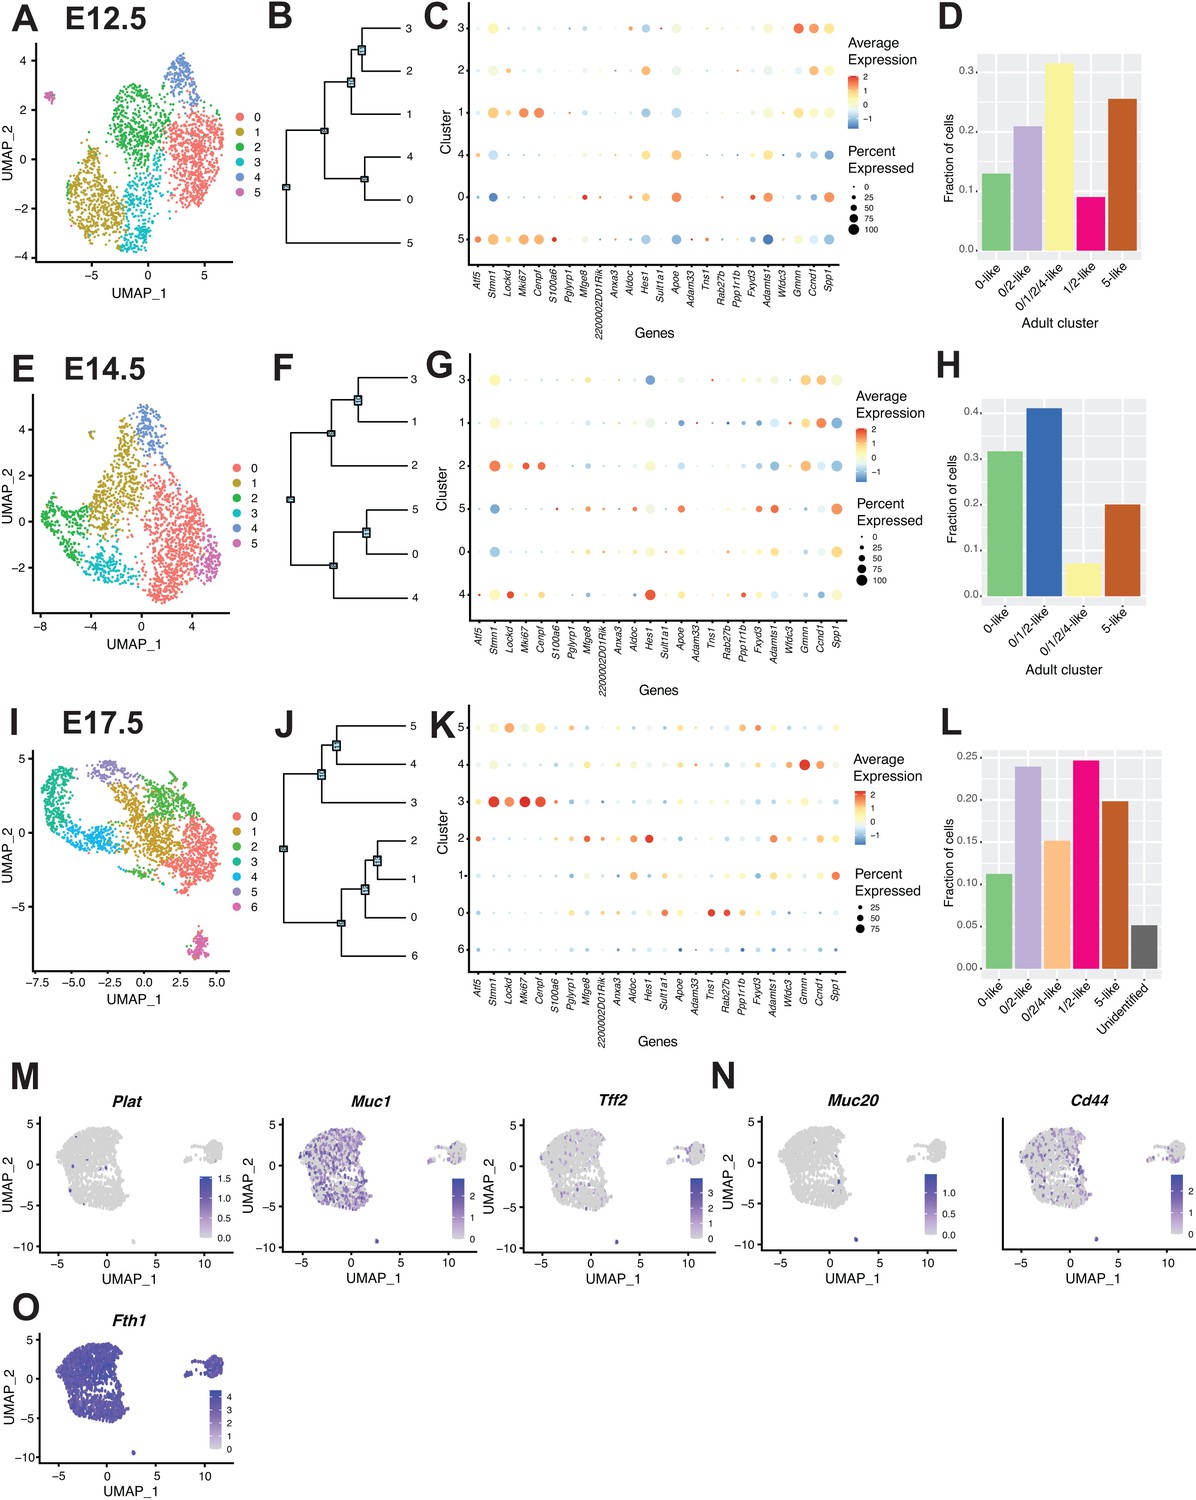
Analysis of pancreas duct cells during development.
(A, E, I) Uniform Manifold Approximation and Projections (UMAPs) depict ductal clusters evident at E12.5, E14.5, and E17.5, respectively. (B, F, J) Cluster dendrograms created using dims (used to define the cluster) show the Euclidean relationships between clusters at E12.5, E14.5, and E17.5, respectively. (C, G, K) Dot plots show expression of the top five genes defining adult C57BL/6J duct subpopulations in developmental biology samples at E12.5, E14.5, and E17.5, respectively. (D, H, L) Fraction of cells similar to adult C57BL/6J duct subpopulations (based on gene expression) at E12.5, E14.5, and E17.5, respectively. The developmental model shows cells that are transitioning between defined adult clusters. (M, N) Feature plots of genes that characterize subpopulations of mouse and human duct cells in Baron et al., 2016. (O) Feature plot showing Fth1 expression, which typifies a human pancreas duct subpopulation in Grün et al., 2016.
Figure 3—figure supplement 3
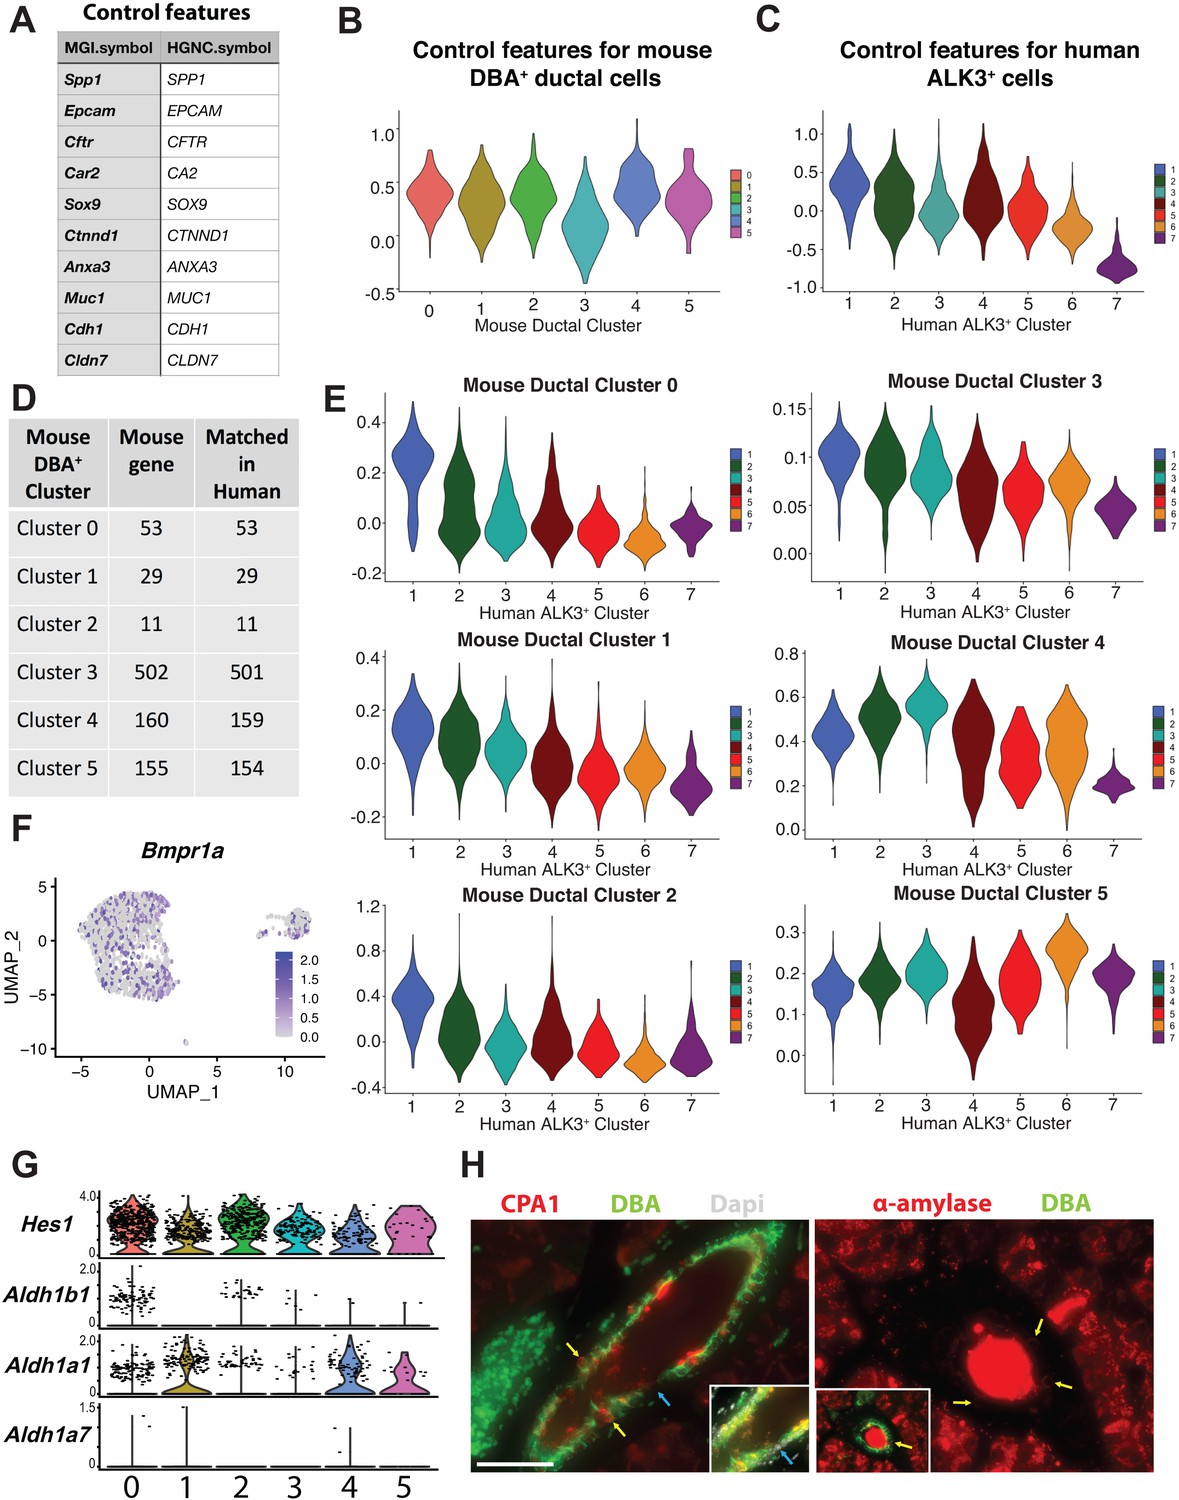
Comparison of DBA+ lectin sorted mouse pancreas duct subpopulations to ALK3+ human pancreas duct subpopulations.
(A–E) Aggregated expression of control feature sets shown in panel (A) was subtracted from the average expression levels of differentially expressed genes (DEGs) for each cluster 0–5 on a single-cell level to determine the AddModuleScore comparing each DBA+ pancreas ductal cluster to ALK3+ human pancreas clusters. Panel (D) shows the number of DEGs in murine DBA+ pancreas duct clusters 0–5 that have a human homolog and could be used in this comparison. (F) Bmpr1a is expressed in a subset of murine DBA+ pancreas duct cells. (G) Stacked violin plots depict expression of centroacinar/terminal ductal cell markers Hes1, Aldh1b1, Aldh1a1, and Aldh1a7 in DBA+ pancreas duct clusters 0–5. (H) Immunostaining identifies ducto-acinar cells in murine pancreas. Yellow arrows point to CPA1 or α-amylase-positive murine ductal cells. Similar to other murine ductal cell markers (Figure 1—figure supplement 1G), DBA lectin also shows heterogenous expression in murine pancreatic duct cells. Blue arrows point to a DBA lectin-negative duct cell. The scale bar is 50 µm.
Figure 4
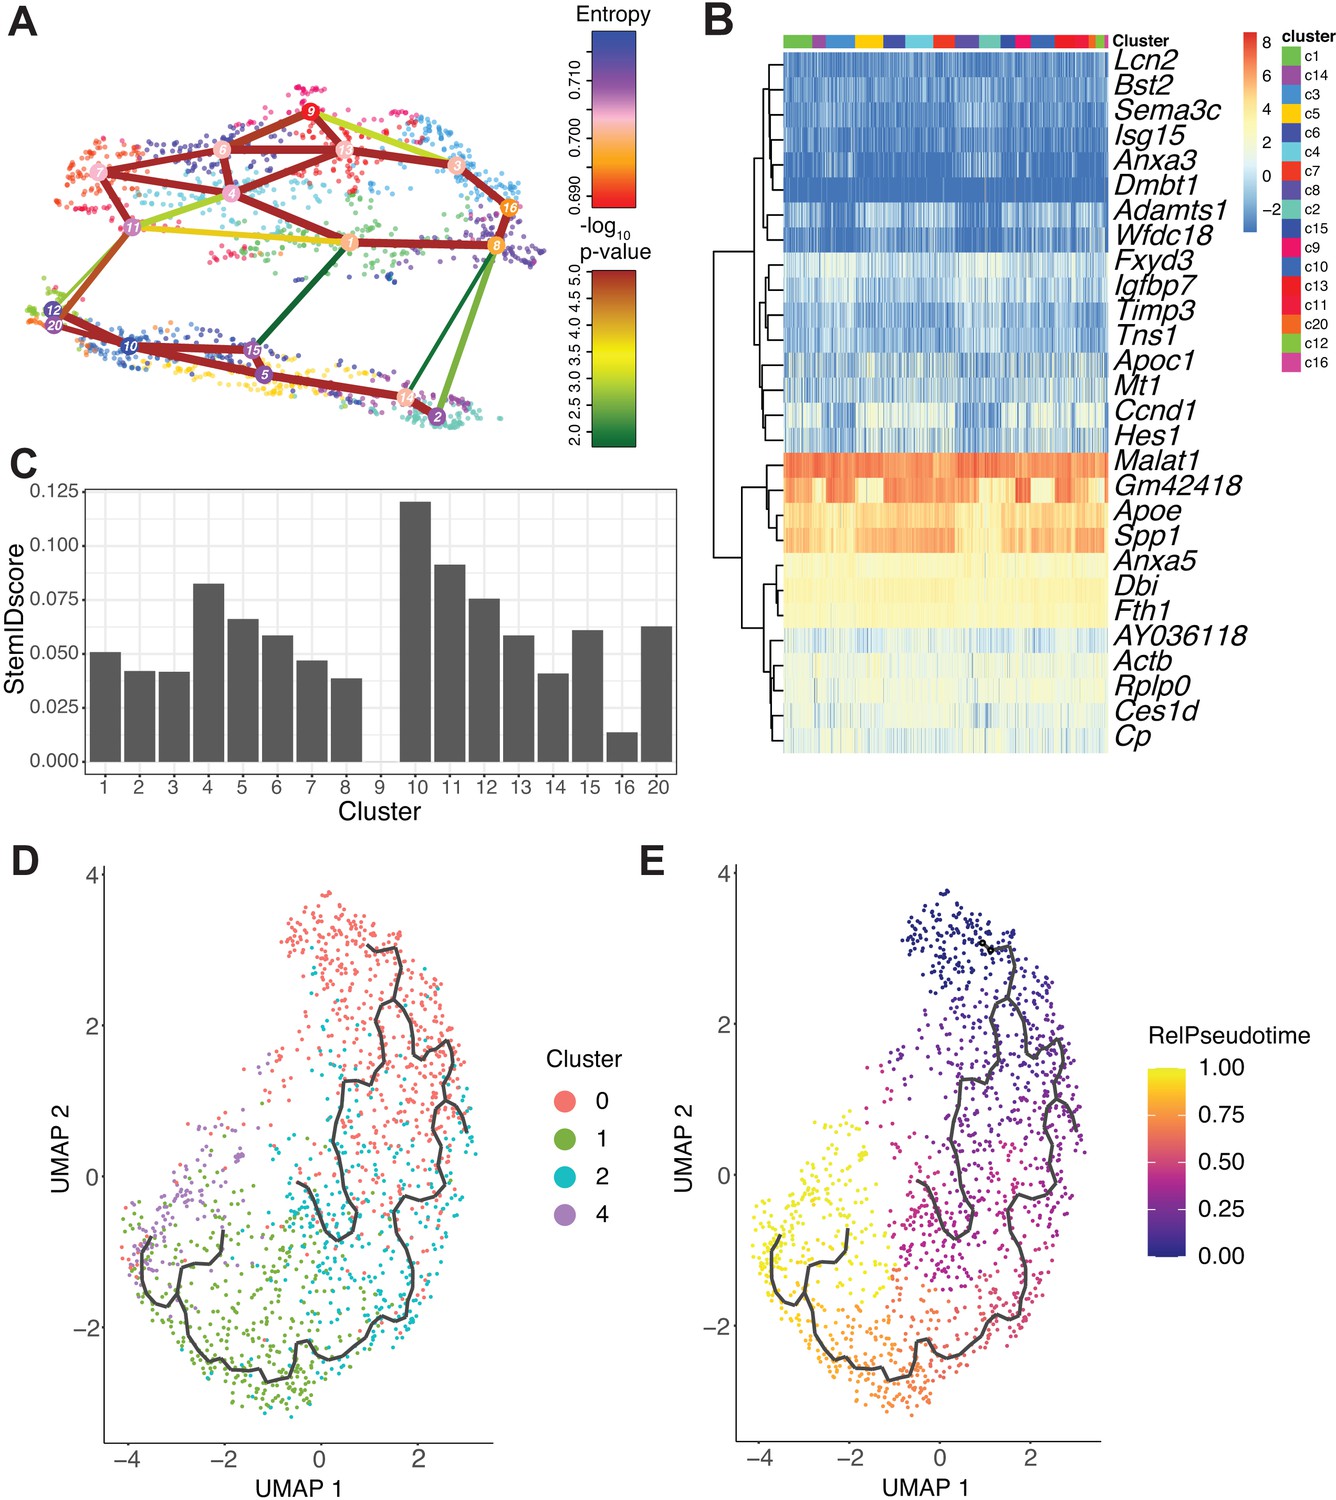
RaceID3/StemID2 predict clusters 0 and 2 have the highest progenitor potential.
(A) The lineage tree inferred by StemID2 is shown in the RaceID3 clusters. Node color represents the level of transcriptome entropy, edge color describes the level of significance, and edge width describes link score. (B) Heat map depicts expression of top five differentially expressed genes in RaceID3 clusters with false discovery rate < 0.01 and fold change > 1.2. (C) StemID2 scores for RaceID3 clusters are graphed. (D) Monocle 3 clustering of murine DBA+ duct clusters 0, 1, 2, and 4 is depicted. (E) Each cell’s relative pseudotime value is depicted that is a measurement of the distance between its position along the trajectory and the starting point (cluster 0).
Figure 5 with 1 supplement
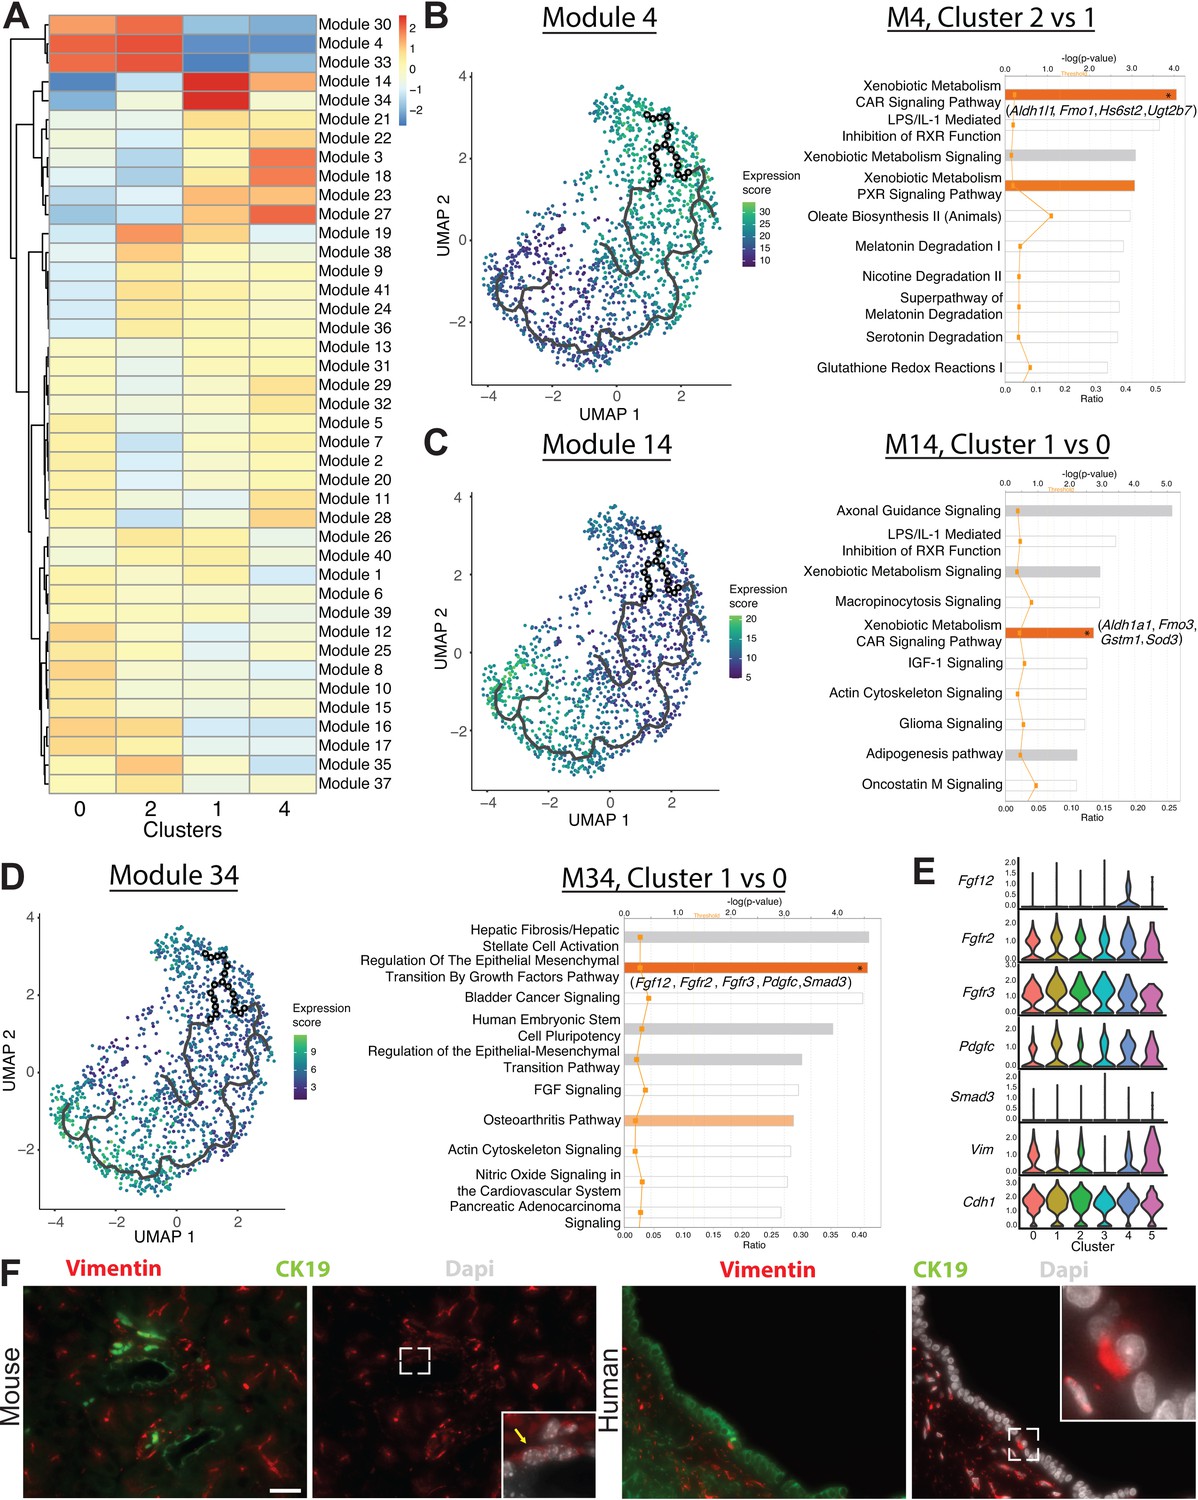
Monocle 3 analysis reveals an epithelial-mesenchymal axis in pancreatic duct cells.
(A) Expression changes of the modules generated by Monocle 3 analysis are shown for each cluster. (B–D) Expression of modules 4, 14, and 34 along with select ingenuity pathways analysis results of the top 10 deregulated pathways are shown. Genes in parenthesis are altered in the pathway containing an asterisk in the bar. (E) Stacked violin plots show expression of genes in the regulation of the epithelial-mesenchymal transition by growth factors pathway in DBA+ duct clusters 0–5. (F) Immunofluorescence depicts CK19+ vimentin+ copositive pancreatic duct cells in mouse (yellow arrow) and human. The main pancreatic duct is shown for humans. Scale bars are 50 µM.
-
Figure 5—source data 1
Ingenuity pathways analysis results comparing select modules in Monocle 3 analysis.
- https://cdn.elifesciences.org/articles/67776/elife-67776-fig5-data1-v2.xls
-
Figure 5—source data 2
Ingenuity pathways analysis upstream regulator analysis comparing select modules in Monocle 3 analysis.
- https://cdn.elifesciences.org/articles/67776/elife-67776-fig5-data2-v2.xls
-
Figure 5—source data 3
Log fold change analysis comparing select modules in Monocle 3 analysis.
- https://cdn.elifesciences.org/articles/67776/elife-67776-fig5-data3-v2.xlsx
Figure 5—figure supplement 1
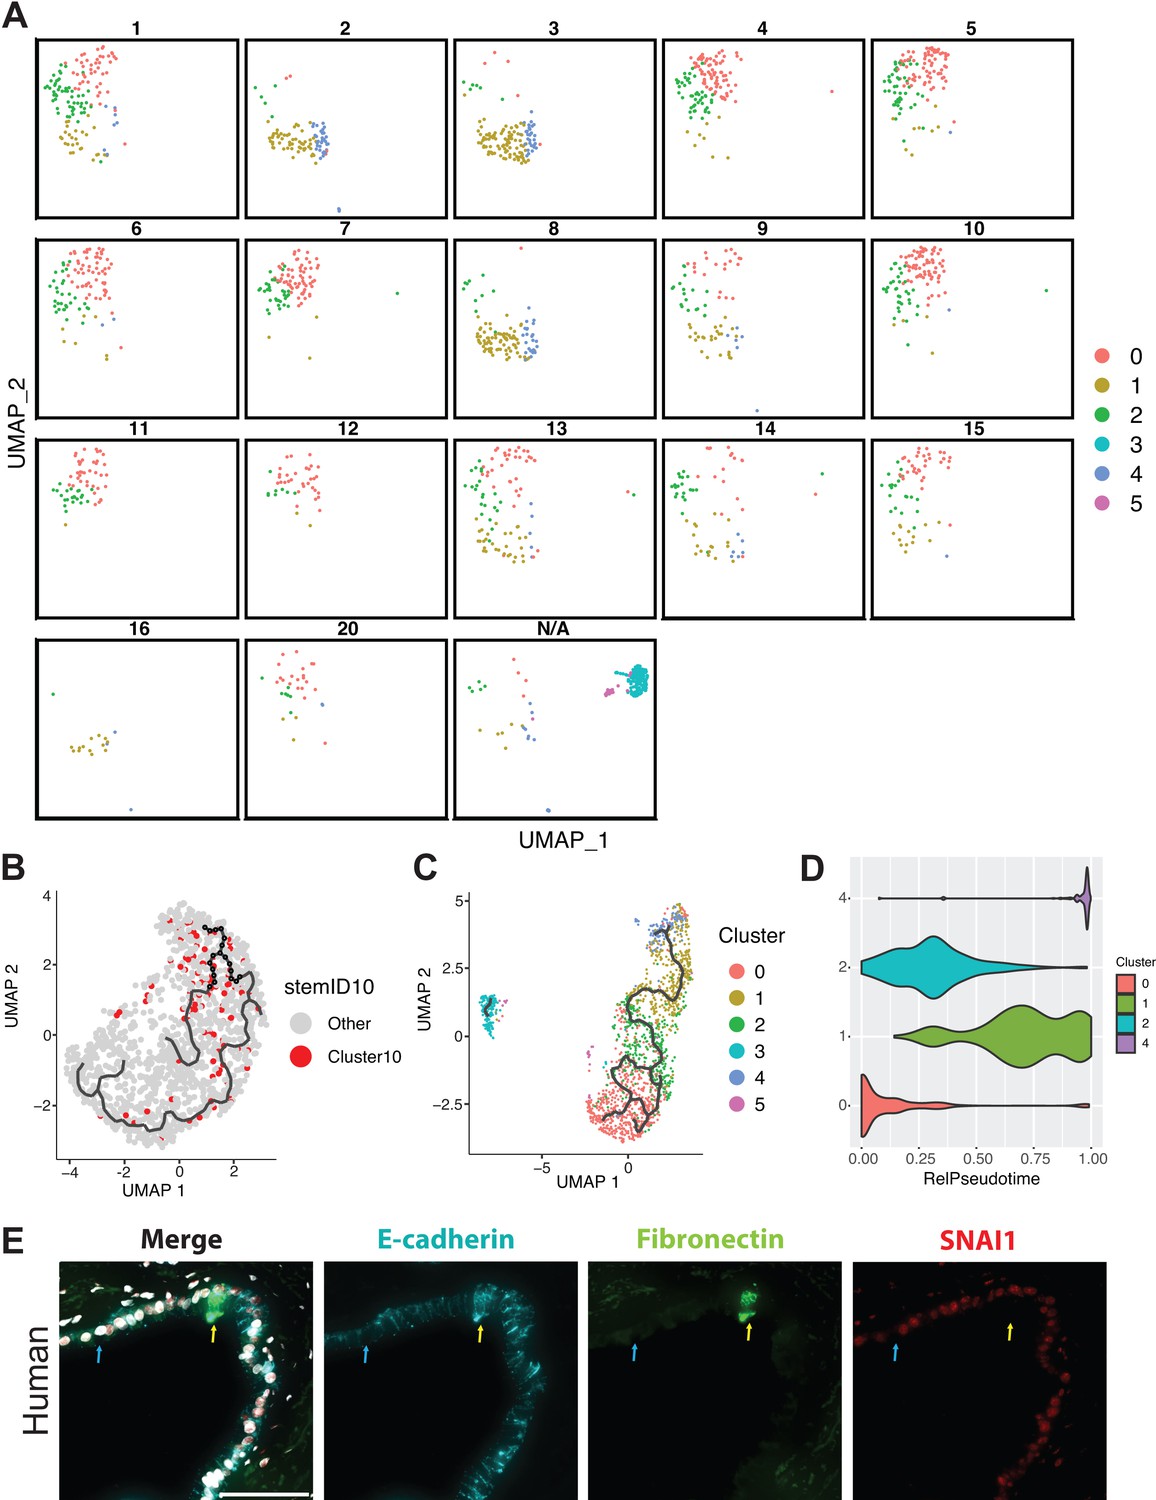
RaceID3 clusters and Monocle 3 analysis.
(A) The location of DBA+ duct cluster 0, 1, 2, and 4 cells in RaceID3 clusters are depicted in Seurat space. Clusters 3 and 5 were not included in this analysis, and all clusters with <10 cells were also removed. All removed cells are depicted in the N/A square. (B) RaceID3 cluster 10 cells, which have the highest StemID2 score, are depicted in the Monocle 3 Uniform Manifold Approximation and Projection (UMAP). (C) The Monocle 3 UMAP and trajectory are shown when DBA+ duct clusters 0–5 are all included in the analysis. (D) A violin plot showing the distribution of cells along the relative pseudotime axis, split by DBA+ duct clusters, is shown. Cluster 4 appears to be the most differentiated from the inferred root, cluster 0. (E) Co-immunofluorescence depicts fibronectin, e-cadherin, and SNAI1 expression in human pancreatic ducts. A blue arrow points to a SNAI1-negative cell, and a yellow arrow points to two fibronectin-positive cells. Scale bar is 50 µm.
Figure 6 with 1 supplement
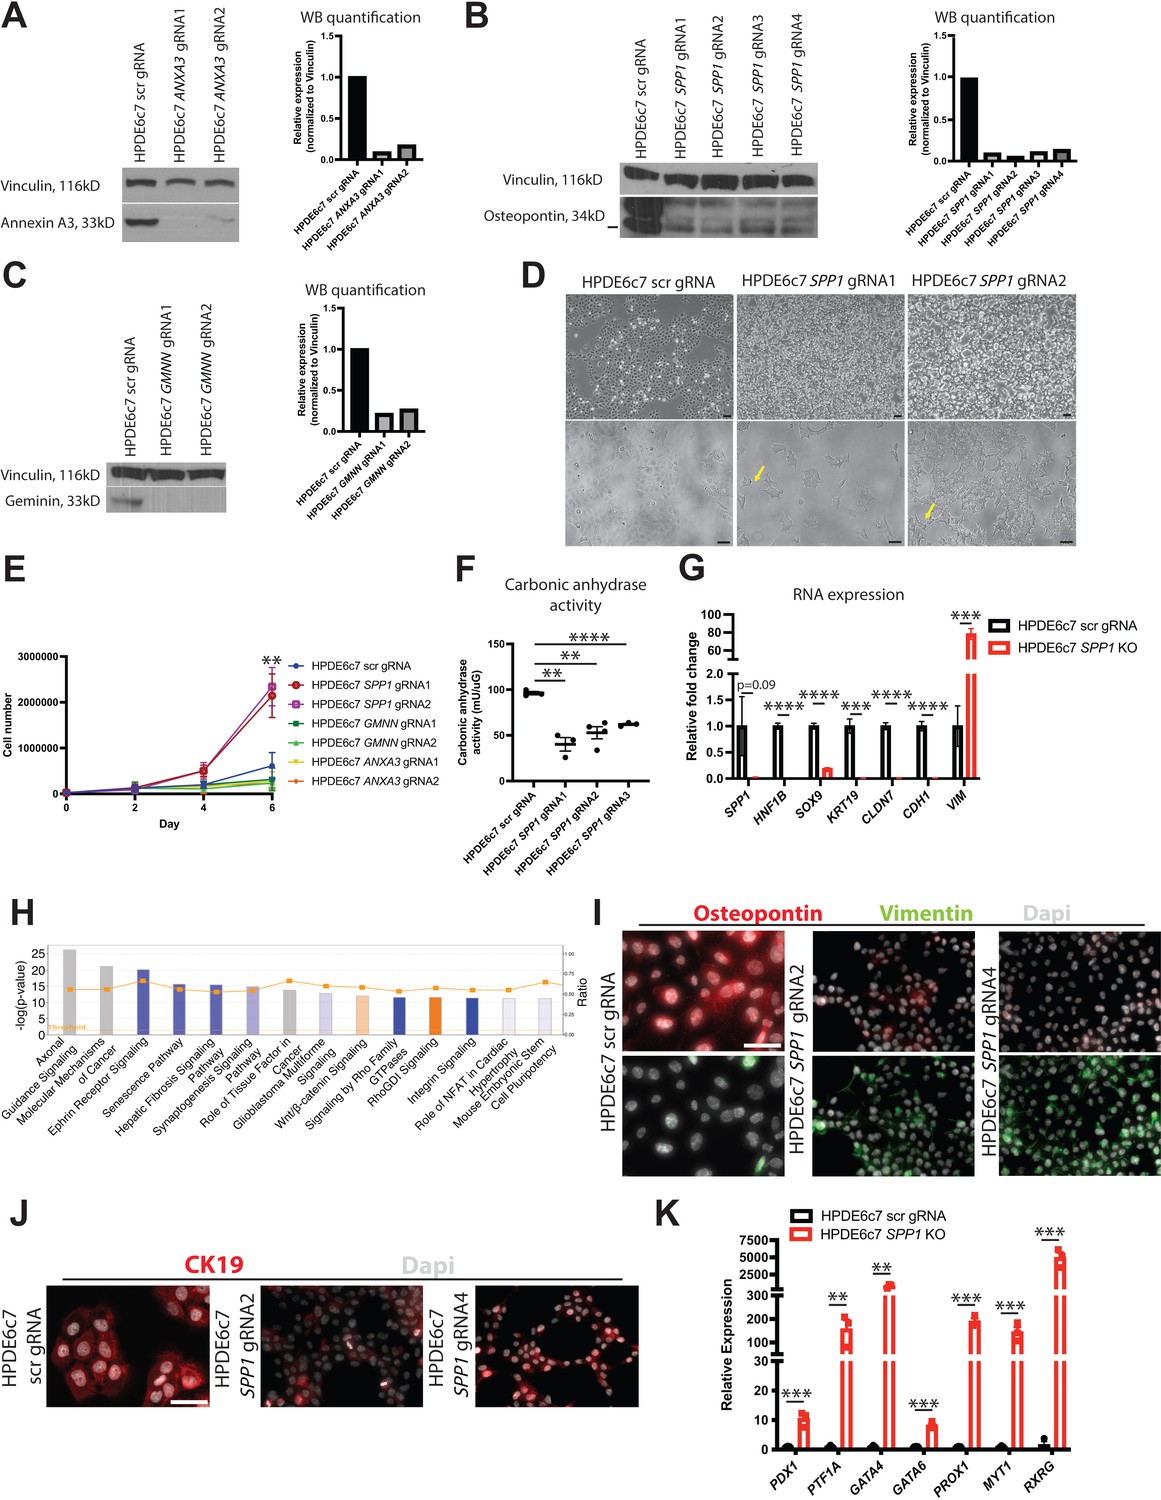
SPP1 loss promotes a progenitor-like state in human pancreatic duct cells.
(A–C) Western blot and quantification of western blot images shows expression of Annexin A3, osteopontin, and geminin in knockout (KO) HPDE6c7 lines and the control. (D) Brightfield images show changes in cellular morphology of HPDE6c7 SPP1 KO lines. Yellow arrows point to filipodia. Scale bars are 100 µm. (E) Cell counting demonstrates a significant increase in cell number at day 6 in HPDE6c7 SPP1 KO cells when compared to the HPDE6c7 scrambled (scr) gRNA control (p=0.0089 for HPDE6c7 SPP1 gRNA1 and p=0.0042 for HPDE6c7 SPP1 gRNA2). (F) Significantly decreased carbonic anhydrase activity is observed in HPDE6c7 SPP1 KO lines when compared to the control. (G) Relative fold changes calculated using rpm values of mesenchymal and duct markers are shown. Average counts (normalized to library size) for SPP1 are 84.0 ± 47.3 (scr) and 2.1 ± 0.4 (KO), HNF1B are 434.9 ± 24.8 (scr) and 0.5 ± 0.3 (KO), SOX9 are 1,617.0 ± 87.2 (scr) and 302.4 ± 35.3 (KO), KRT19 are 17,458.1 ± 2,367.2 (scr) and 60.7 ± 60.7 (KO), CLDN7 are 3,381.1 ± 222.9 (scr) and 17.6 ± 3.7 (KO), CDH1 are 8,995.8 ± 805.9 (scr) and 109.1 ± 29.0 (KO), and VIM are 84.1 ± 32.4 (scr) and 6,577.2 ± 513.7 (KO). (H) The top 14 deregulated pathways from ingenuity pathways analysis are shown comparing HPDE6c7 SPP1 KO vs. HPDE6c7 scr gRNA control. (I) Immunocytochemistry (ICC) demonstrated reduced osteopontin expression in HPDE6c7 gRNA2 and HPDE6c7 SPP1 gRNA4 when compared to HPDE6c7 scr gRNA. Vimentin ICC depicts organized intermediate filaments in HPDE6c7 SPP1 gRNA2 and HPDE6c7 SPP1 gRNA4 while HPDE6c7 scr gRNA cells show diffuse, light labeling. Scale bar is 50 µm. (J) CK19 ICC shows organized intermediate filaments in HPDE6c7 scr gRNA cells while HPDE6c7 SPP1 gRNA2 and HPDE6c7 SPP1 gRNA4 cells display punctate CK19 labeling, where present. Scale bar denotes 50 µm. (K) qPCR results of pancreatic progenitor markers are shown for HPDE6c7 scr gRNA control and HPDE6c7 SPP1 KO lines.
-
Figure 6—source data 1
Differentially expressed genes comparing HPDE6c7 SPP1 knockout vs. HPDE6c7 scrambled gRNA.
- https://cdn.elifesciences.org/articles/67776/elife-67776-fig6-data1-v2.xlsx
-
Figure 6—source data 2
Ingenuity pathways analysis results comparing HPDE6c7 SPP1 knockout vs. HPDE6c7 scrambled gRNA.
- https://cdn.elifesciences.org/articles/67776/elife-67776-fig6-data2-v2.xls
-
Figure 6—source data 3
Ingenuity pathways analysis upstream regulator analysis comparing HPDE6c7 SPP1 knockout vs. HPDE6c7 scrambled gRNA.
- https://cdn.elifesciences.org/articles/67776/elife-67776-fig6-data3-v2.xls
-
Figure 6—source data 4
Filtered normalized (to library size) counts for RNA-seq of HPDE6c7 scr gRNA and HPDE6c7 SPP1 knockout cell lines.
- https://cdn.elifesciences.org/articles/67776/elife-67776-fig6-data4-v2.xlsx
Figure 6—figure supplement 1
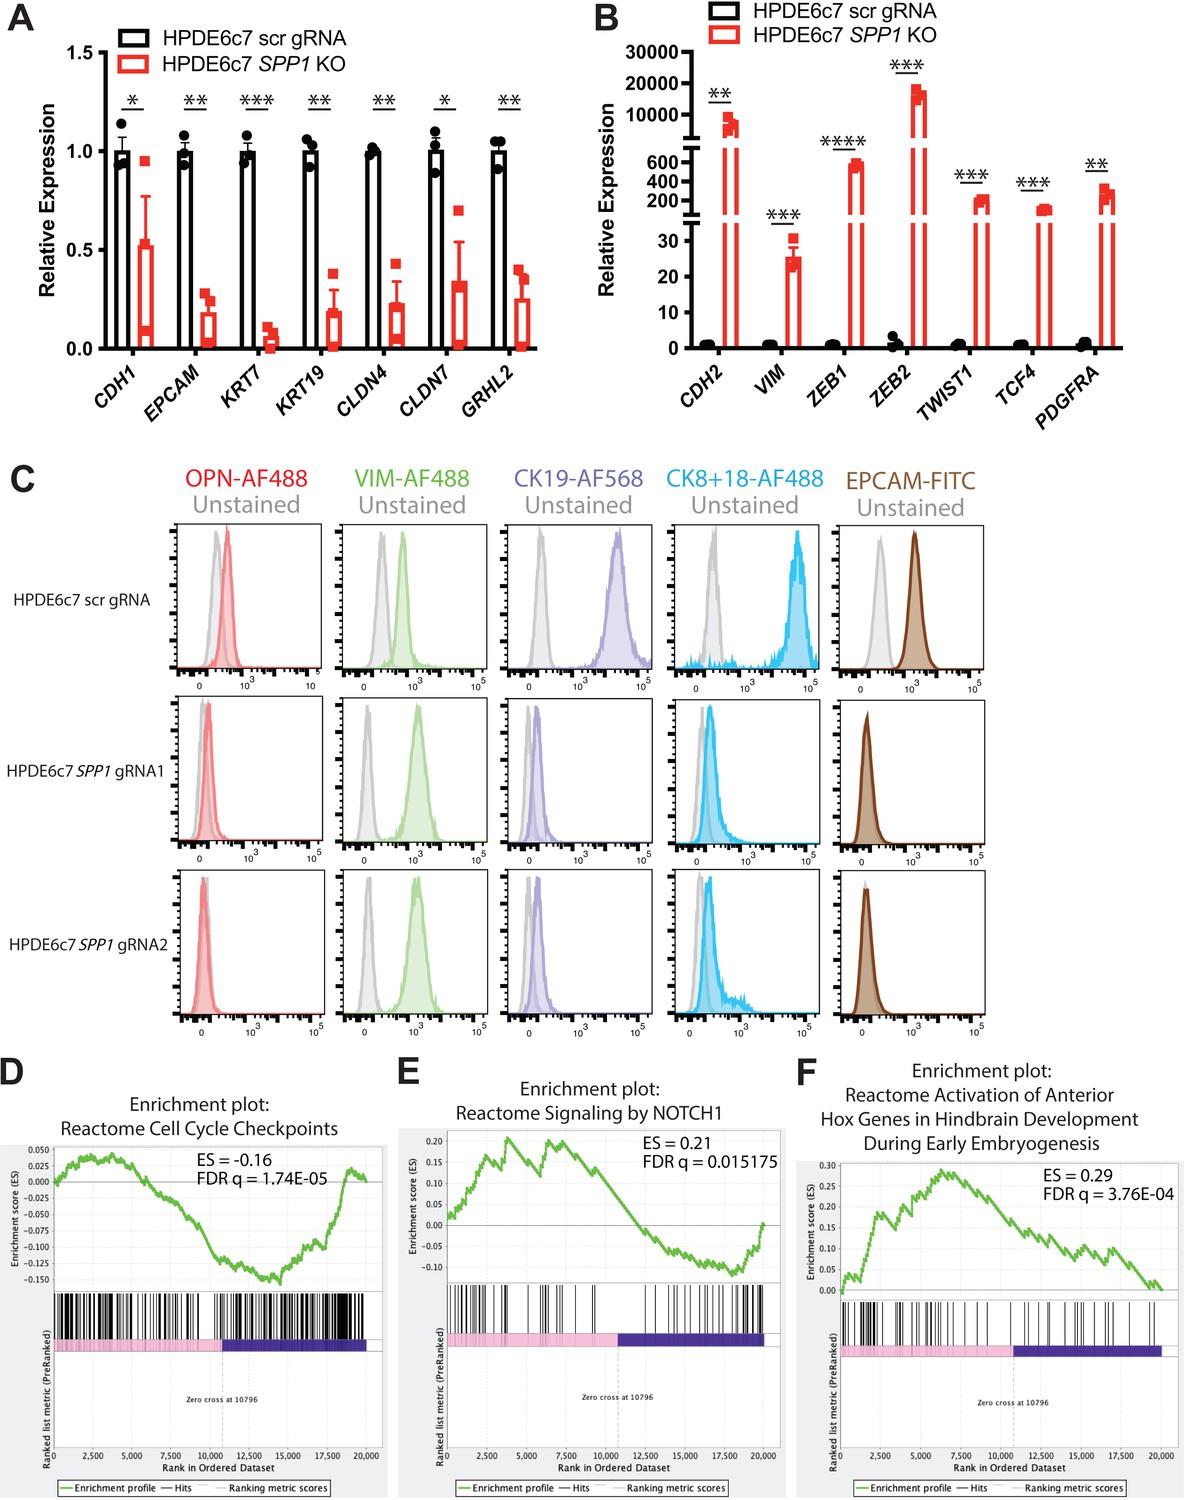
Characterization of DBA+ murine ductal markers.
qPCR analysis of epithelial (A) and mesenchymal (B) markers in HPDE6c7 SPP1 knockout (KO) lines and the HPDE6c7 scrambled (scr) gRNA control is shown. (C) Flow cytometry profiles of select markers in HPDE6c7 SPP1 KO lines and the HPDE6c7 scr gRNA control are depicted. (D–F) Gene set enrichment analysis enrichments plots for select pathways are depicted.
Figure 7
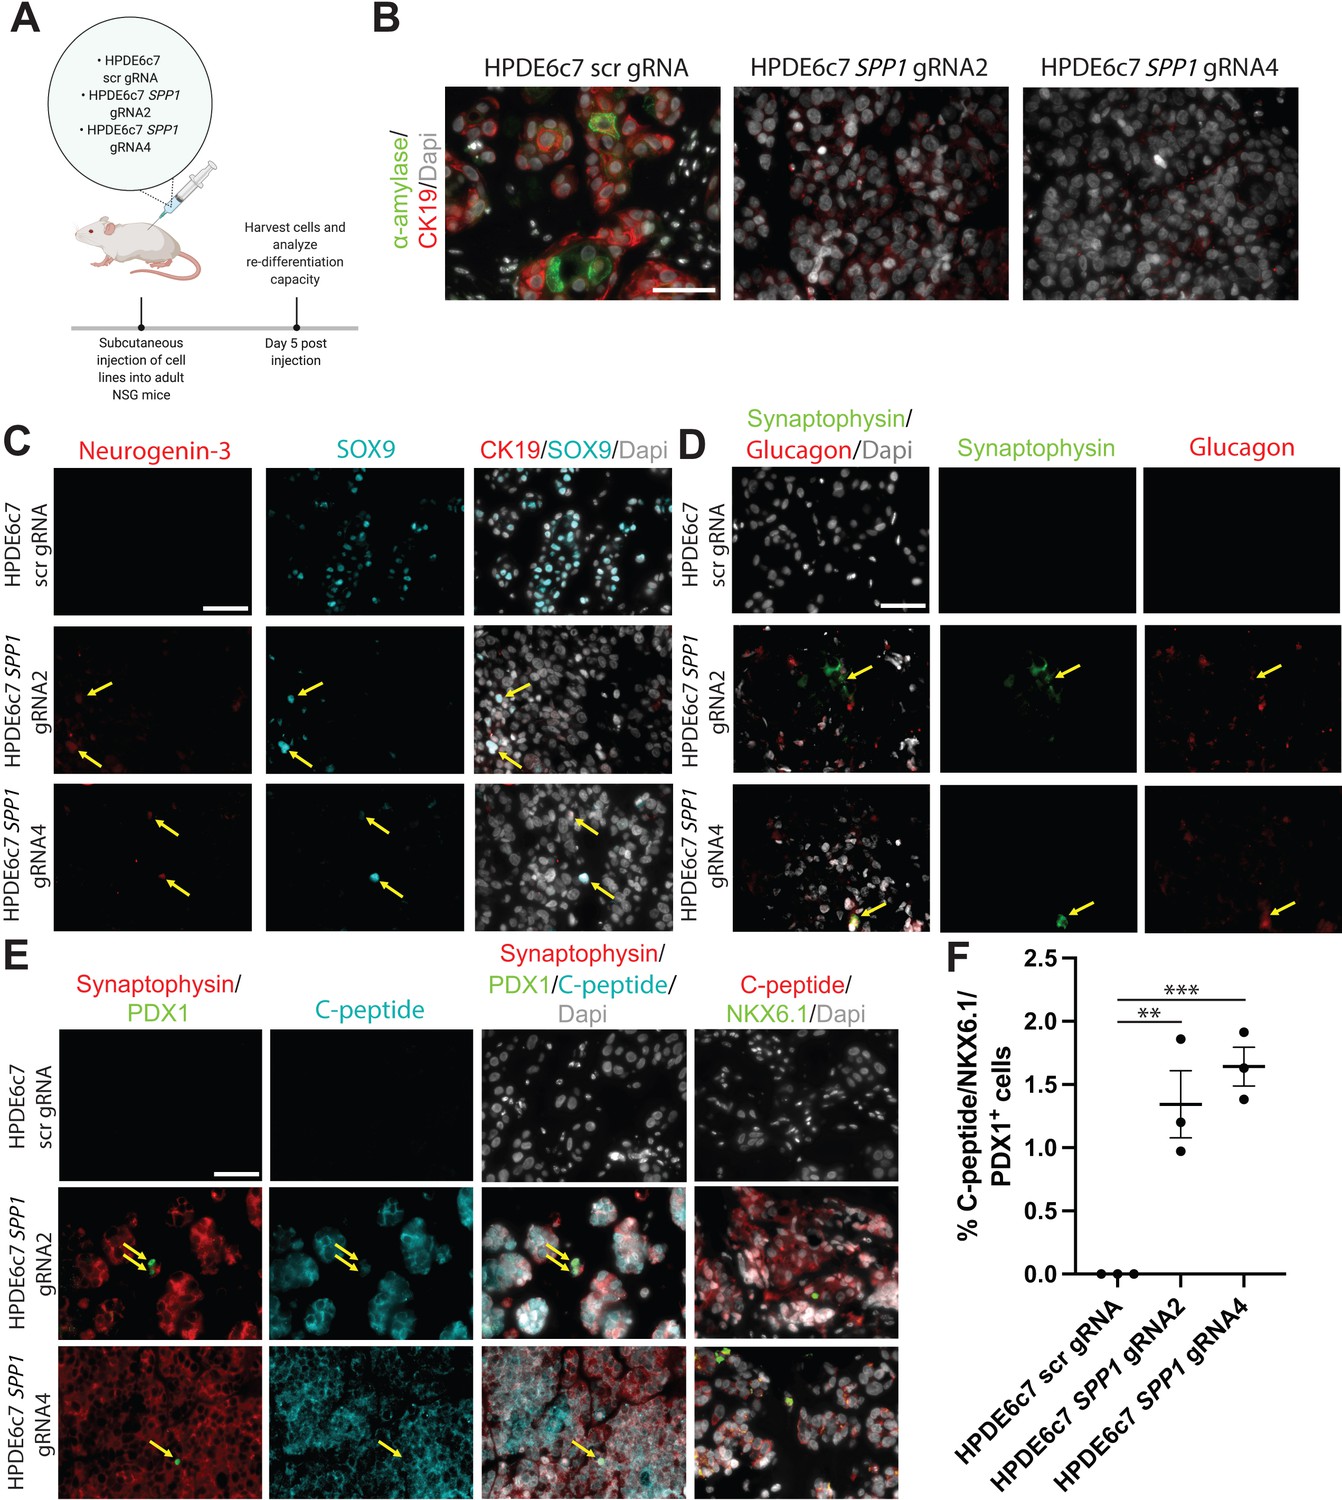
HPDE SPP1 knockout (KO) cells are capable of differentiating into cells with endocrine appearance, including cells exhibiting α- and β-like appearance, but not duct-like or acinar-like cells in vivo.
(A) Schematic of in vivo experiment. (B) Immunofluorescence (IF) shows CK19+ α-amylase+ double-positive HPDE6c7 scrambled (scr) gRNA cells. (C) IF depicts NGN3+ SOX9+ double-positive HPDE6c7 SPP1 KO cells (yellow arrows). (D) Synaptophysin+ Glucagon+ double-positive cells (yellow arrows) are detected in HPDE6c7 SPP1 KO cells. (E) C-peptide, synaptophysin, NKX6.1, and PDX1 expression are evident in HPDE6c7 SPP1 KO cells. C-peptide, synaptophysin, and PDX1 triple-positive cells are highlighted with yellow arrows. (F) The percentage of C-peptide+, NKX6.1+, and PDX1+ triple-positive cells for HPDE6c7 scr gRNA cells is 0, HPDE6c7 SPP1 gRNA2 is 1.343 ± 0.266, and HPDE6c7 SPP1 gRNA 4 cells is 1.642 ± 0.153. All scale bars in this figure are 50 µm.
Figure 8 with 3 supplements
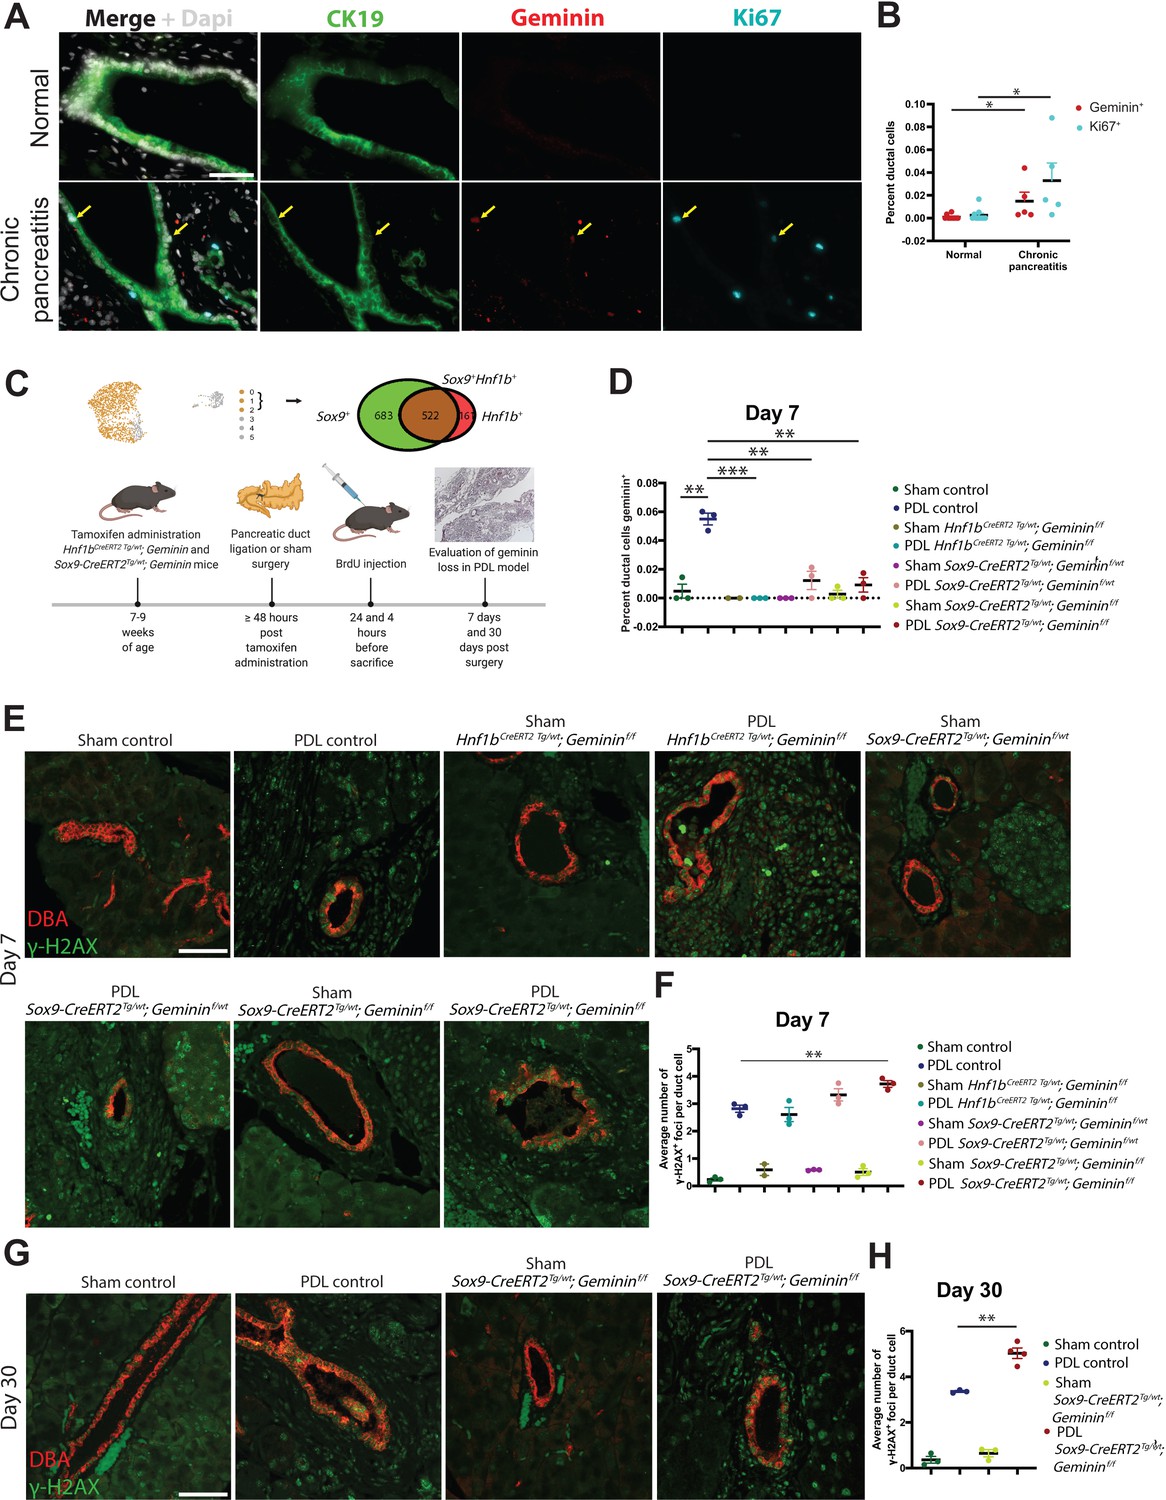
Geminin is a regulator of genomic stability in mouse pancreatic duct cells during chronic pancreatitis (CP).
(A, B) High-magnification immunofluorescence (IF)images and quantification show a significant increase in proliferation in pancreatic duct cells in CP patients when compared to normal human pancreatic duct cells. Yellow arrows point to Geminin+ Ki67+ copositive cells. (C) A schematic of tamoxifen and BrdU administration is shown. The Uniform Manifold Approximation and Projection depicts the pancreatic cells (clusters 0–2) that were analyzed in this experiment. The Venn diagram shows the number of cells in clusters 0–2 that are SOX9+, HNF1B+, and SOX9+HNF1B+ copositive. (D) Quantification of Geminin-positive ductal cells at day 7 in Sox9-CreERT2Tg/wt; Gemininf/f, Sox9-CreERT2Tg/wt; Gemininf/wt, Hnf1bCreERT2 Tg/wt; Gemininf/f and control mice is depicted. (E, F) Representative IF images and quantification of γ-H2AX-positive foci are shown at day 7 in the pancreatic duct ligation (PDL) transgenic models. (G, H) Representative IF images and quantification of γ-H2AX-positive foci are shown at day 30 in the Sox9-CreERT2Tg/wt; Gemininf/f and control PDL models. All scale bars in this figure are 50 µm.
Figure 8—figure supplement 1
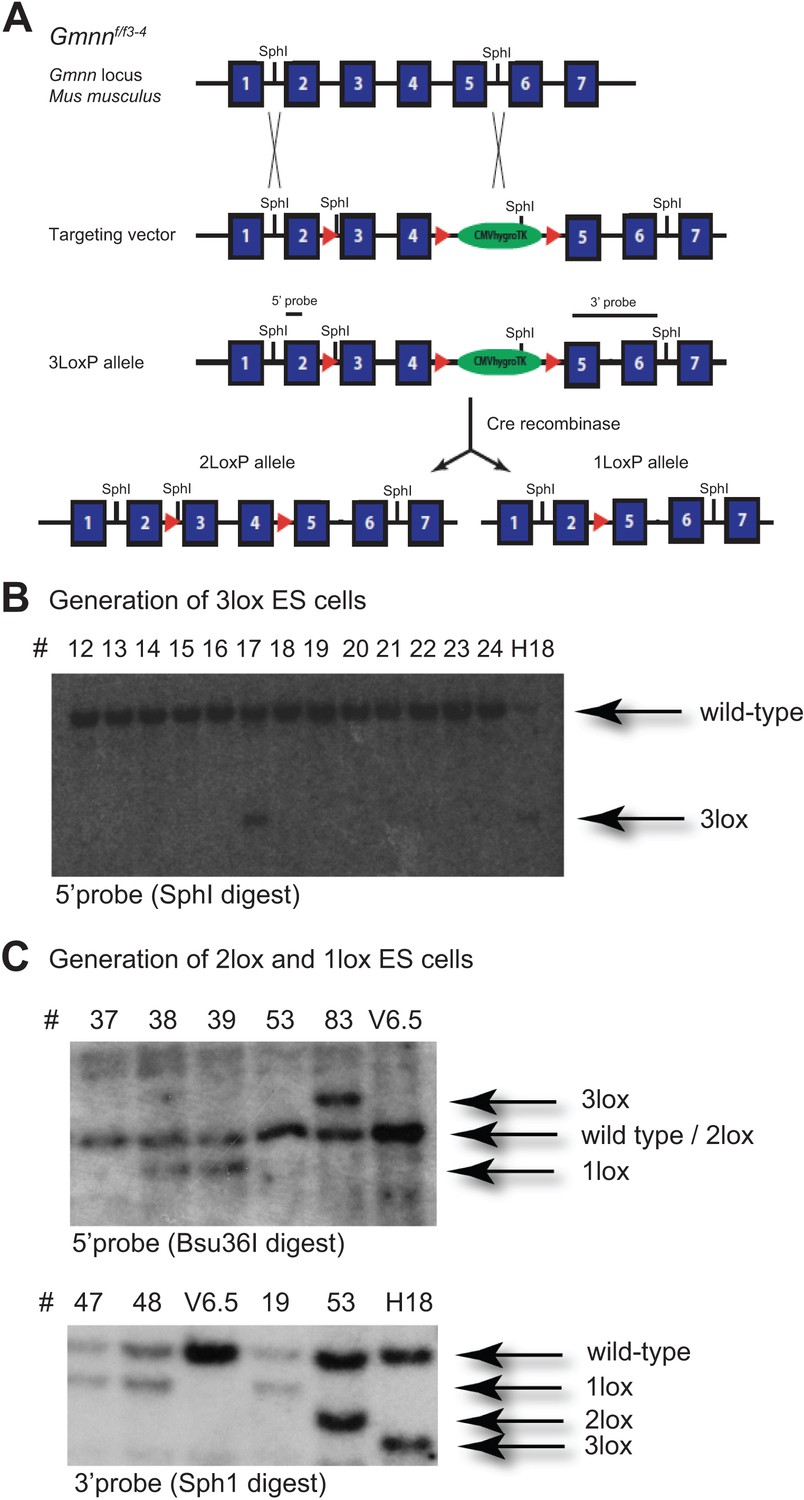
Generation of 2loxP and 1loxP heterozygous ES cells for mouse Geminin.
(A) The targeting strategy to generate a conditional knockout (KO) allele for Geminin in ES cells is shown. The exact distance between individual exons and their relative sizes is not shown. ES cells heterozygous for the 3loxP allele were obtained through homologous recombination. A Cre recombinase was used to generate ES cells harboring either the 2loxP allele or the 1loxP allele in vitro. A SphI restriction site was introduced with the leftmost loxP site to allow screening for its presence by Southern blot analysis. (B) The 5′ probe was used in conjunction with a SphI digest. Besides the wild-type allele, a fragment of about 2.5 kb is expected for the 3loxP allele as indicated. Clone 17 and clone H18 tested positive. (C) Clone H18 was chosen for Cre treatment in vitro. Using a Bsu36I digest and the 5′ probe, the 2loxP allele displays a single fragment of the same size as the wild-type allele, whereas the 1loxP allele produces a smaller fragment. Bsu36I restriction sites are omitted in the schematic shown in (A) for clarity. The 3′ probe clearly distinguishes between wild-type, 1loxP, 2loxP, and 3loxP alleles with a SphI digest. Clone 53 was identified as an ES cell clone heterozygous for the conditional 2loxP allele and used for blastocyst injection.
Figure 8—figure supplement 2
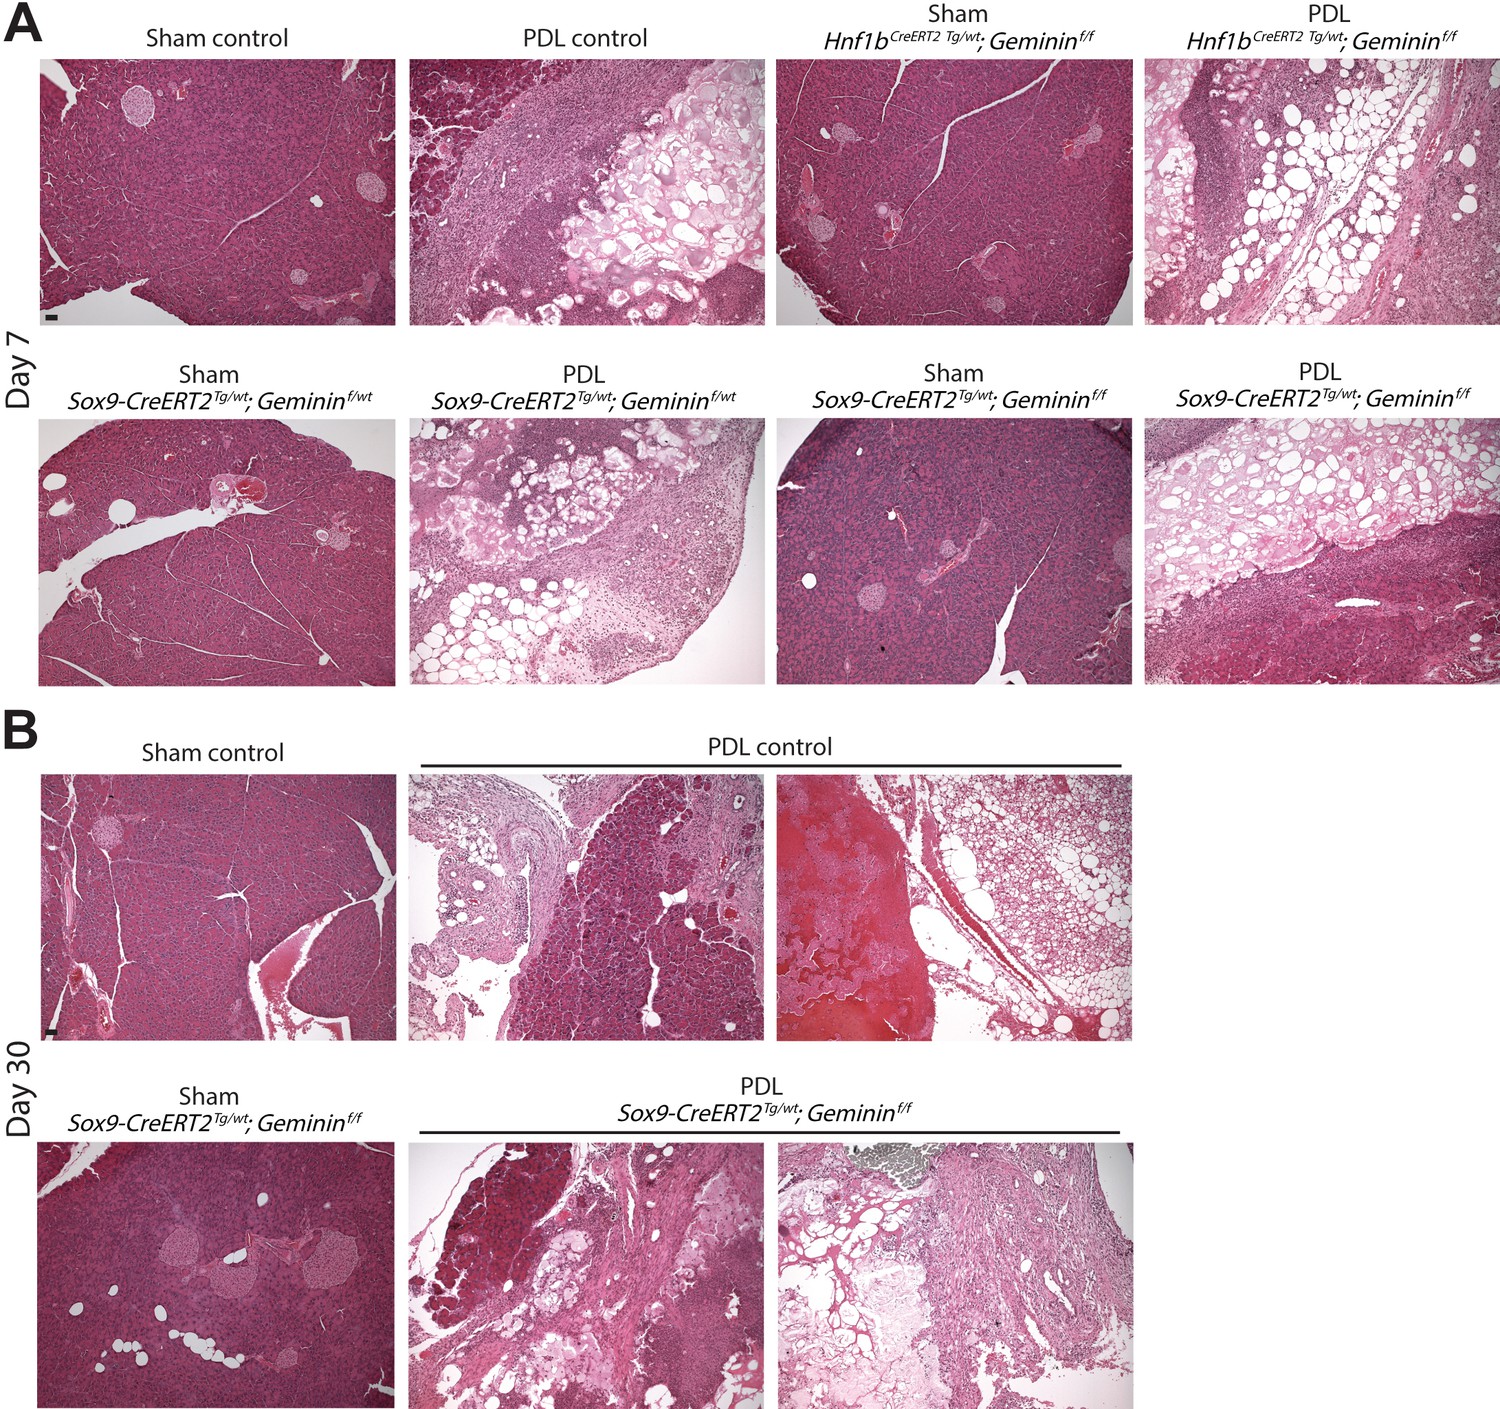
Histology of transgenic pancreatic duct ligation (PDL) models.
(A, B) Representative hematoxylin and eosin images of PDL transgenic models at days 7 and 30 are shown. Scale bars are 40 µm.
Figure 8—figure supplement 3
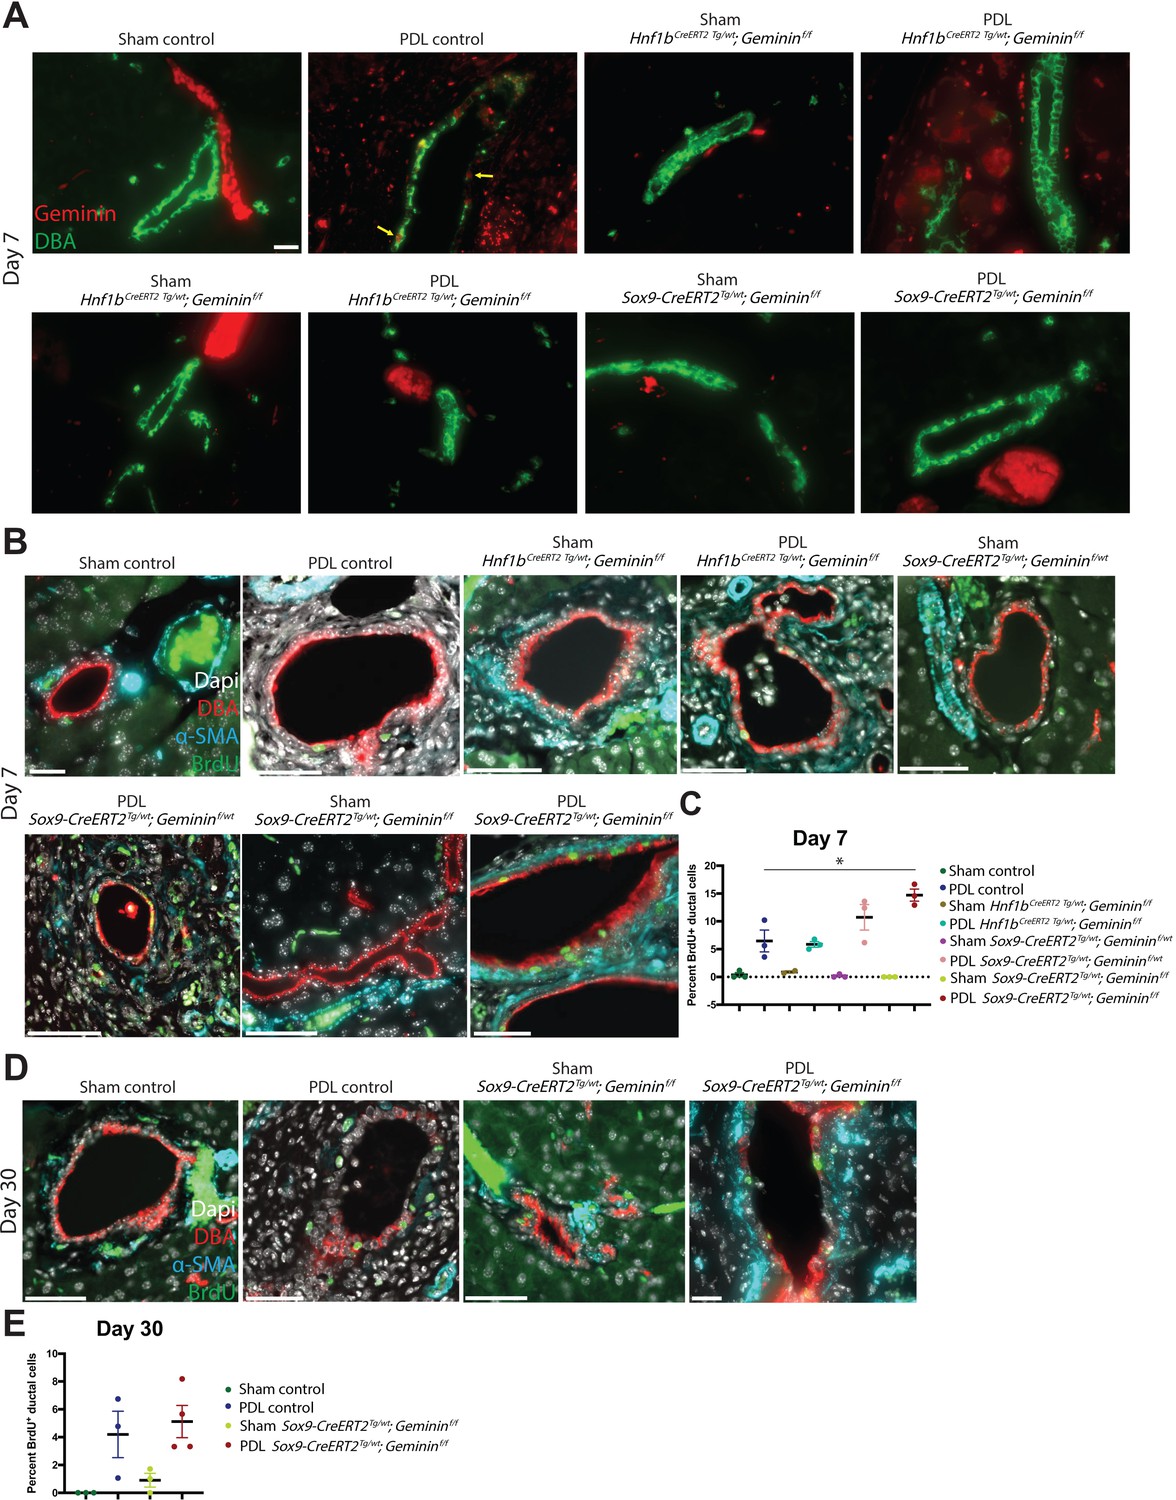
Geminin loss causes a transient proliferation response in Sox9-CreERT2Tg/wt; Gemininf/f mice.
(A) Representative immunofluorescence (IF) images of the quantification shown in Figure 8D are depicted. Scale bar is 20 µm. (B, C) IF images and quantification of BrdU-positive pancreatic ductal cells are shown at day 7 in the pancreatic duct ligation (PDL) transgenic models. Scale bars are 50 µm. (D–E) IF images and quantification of BrdU-positive pancreatic ductal cells are shown at day 30 in the Sox9-CreERT2Tg/wt; Gemininf/f and control PDL models. Scale bars are 50 µm.
Additional files
-
Supplementary file 1
Expression scoring of markers of subpopulations of pancreatic duct cells.
This table depicts a summary of expression scoring of selected markers for subpopulations of pancreatic duct cells in mouse and human tissue. Homogeneous refers to an observed uniform expression level and pattern within a particular ductal cell type. Heterogeneous means that either the observed expression level or pattern varies among cells within a particular ductal cell type.
- https://cdn.elifesciences.org/articles/67776/elife-67776-supp1-v2.pptx
-
Supplementary file 2
The list of antibodies used in this study.
- https://cdn.elifesciences.org/articles/67776/elife-67776-supp2-v2.xlsx
-
Supplementary file 3
The list of gRNA sequences used in this study.
- https://cdn.elifesciences.org/articles/67776/elife-67776-supp3-v2.xlsx
-
Supplementary file 4
The list of qPCR primer sequences used in this study.
- https://cdn.elifesciences.org/articles/67776/elife-67776-supp4-v2.xlsx
-
Transparent reporting form
- https://cdn.elifesciences.org/articles/67776/elife-67776-transrepform-v2.docx
Download links
A two-part list of links to download the article, or parts of the article, in various formats.
Downloads (link to download the article as PDF)
Open citations (links to open the citations from this article in various online reference manager services)
Cite this article (links to download the citations from this article in formats compatible with various reference manager tools)
Single-cell transcriptome analysis defines heterogeneity of the murine pancreatic ductal tree
eLife 10:e67776.
https://doi.org/10.7554/eLife.67776


