Genetic code expansion enables visualization of Salmonella type three secretion system components and secreted effectors
- Mechanobiology Institute, T-Lab, 5A Engineering Drive 1, National University of Singapore, Singapore
- Biochemistry and Molecular Biology, University of Texas Medical Branch, United States
Figures
Figure 1

Scheme for site-specific fluorescent labeling of SPI-2 effectors.
(A) Chemical structure of 4-azidophenylalanine (AzF), 7-(Hydroxy-coumarin-4-yl) ethylglycine (Hco), trans-Cyclooct-2-en – L - Lysine (TCO*Lys), BDP-DBCO, and SiR-tetrazine. (B) Incorporation of a ncAA in a SPI-2 effector is schematically represented. A plasmid carrying the gene for an effector of interest (green) and an orthogonal suppressor tRNA (dark blue)/aminoacyl synthetase (orange) pair are introduced into the bacterial cell by transformation. The amber stop codon (TAG, red) replaces a native codon at a permissive site within the sequence of the effector gene. The ncAA (red stars) is supplemented in the growth medium. Inside the cell, the orthogonal synthetase specifically charges the orthogonal suppressor tRNA with the desired ncAA through a catalytic reaction driven by ATP. The ncAA-acylated tRNA which contains a CUA anticodon, then enters the ribosomal machinery and incorporates the attached ncAA into the effector in response to the complementary amber codon on the effector mRNA (black). Once released from the ribosome, the tRNA can be further reused for ncAA amino-acylation by the cognate synthetase. The full-length polypeptide chain of the effector site-specifically carries the ncAA and undergoes folding and assembly into a functioning effector protein. The newly formed effector is translocated into the host cell through the T3SS. The secreted SPI-2 effectors incorporated with ncAA can be labeled by an externally added fluorophore. (C) Reaction scheme of effector labeling with a genetically encoded azide-containing protein. An azide-containing amino acid (AzF) is genetically incorporated into a protein (SifA) and the azido group reacts with a conjugation reagent containing dibenzocyclooctyne (BDP-DBCO) through SPAAC. (D) Reaction scheme for the copper-free click reaction with a fluorogenic tetrazine dye. An ncAA with a strained alkene group (e.g. TCO-Lys, as shown here) incorporated into an effector protein (SsaP) reacts with tetrazine‐coupled dyes (SiR-Tz) through SPIEDAC click reaction. Dyes coupled to tetrazine are only fluorescent (magenta) after successful labeling.
Figure 2 with 5 supplements
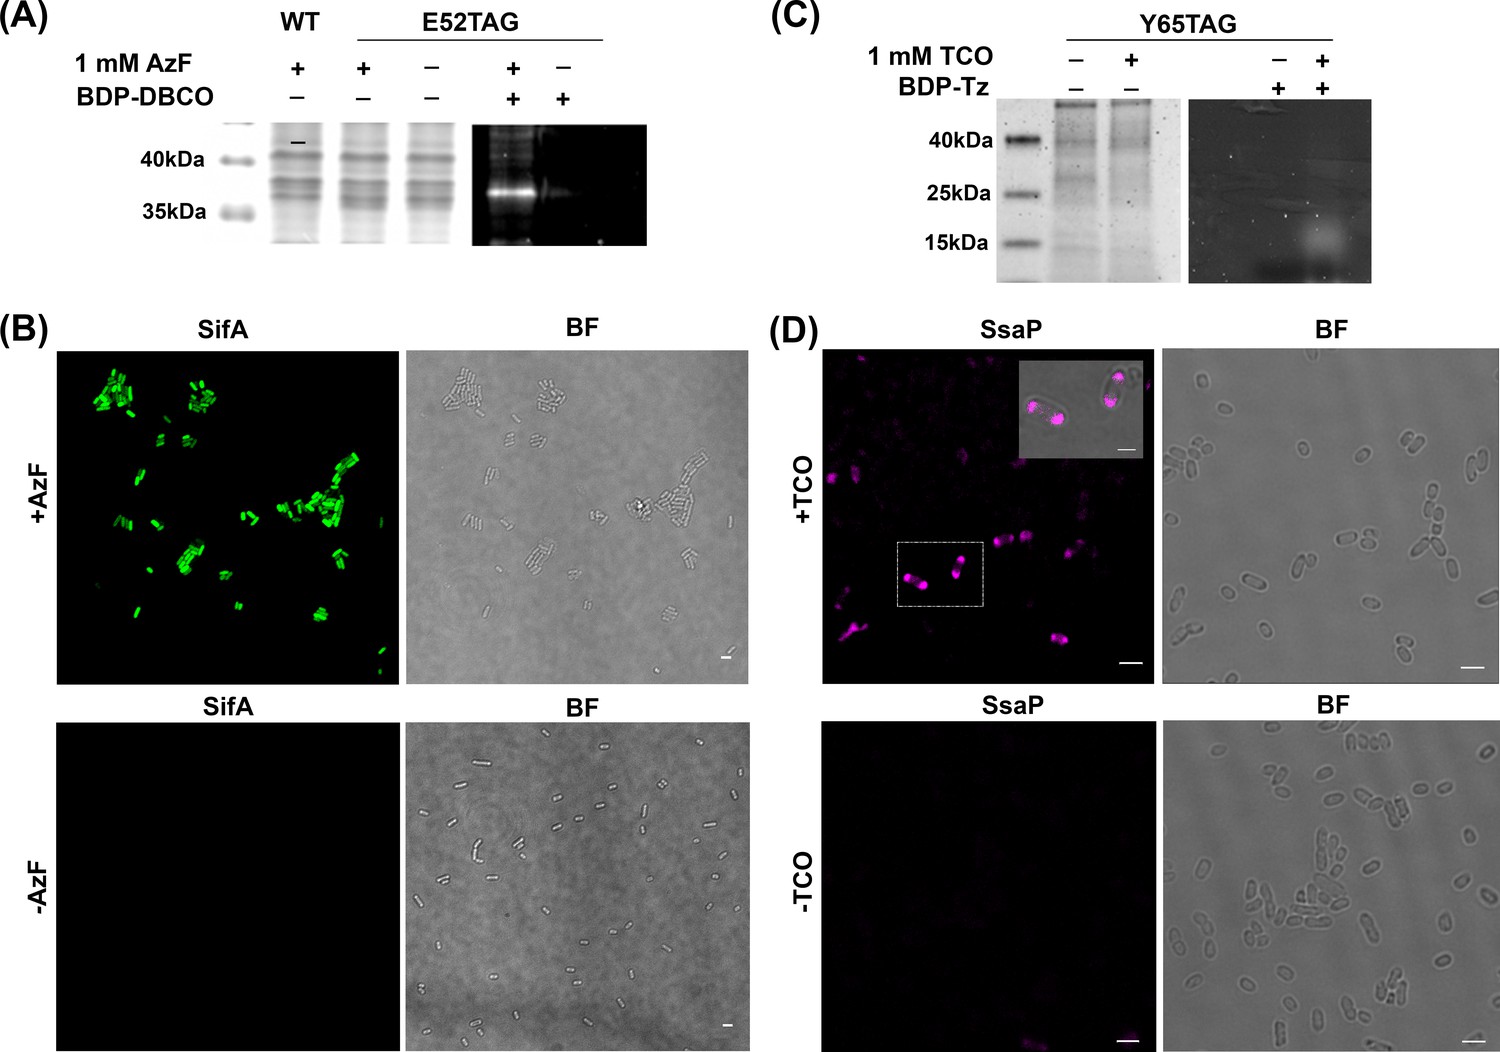
AzF is site-specifically incorporated into SifA-E52TAG in Salmonella.
(A) Left: Coomassie stained SDS-PAGE; right: SDS-PAGE fluorescence imaging confirms selective labeling of SifA-E52AzF with BDP-DBCO in the cell lysate. (B) Expression of SifA-E52AzF in Salmonella analyzed by fluorescence microscopy in the presence (top) or absence (bottom) of 1mM AzF. Salmonella cells expressing SifA-E52AzF in the presence or absence of AzF were incubated with BDP-DBCO, and imaged for BDP fluorescence (green). SifA fluorescence (green) is only observed in the presence of AzF. (C) Site-specific incorporation of TCO*Lys into SsaP-Y65TCO in Salmonella left: Coomassie stained SDS-PAGE; right: SDS-PAGE fluorescence imaging confirms selective labeling of SsaPY65TCO with BDP-Tz in the secreted fraction collected after TCA precipitation. (D) Expression of SsaP-Y65TCO in Salmonella analyzed by fluorescence microscopy in the presence (top) or absence (bottom) of 1mM TCO*Lys. Salmonella cells expressing SsaP-Y65TCO in the presence or absence of TCO*Lys were incubated with SiR-Tz, fixed at 8 hr post acid induction and imaged for SiR fluorescence (magenta). Polarly localized SsaP fluorescence (magenta) is only observed in the presence of TCO*Lys. A higher magnification merged imaged is shown in the inset. See Figure 2—figure supplement 5 for statistical analysis for the fraction of polarly localized SsaP. Images were acquired using confocal microscopy. The data are representative of at least three independent experiments. BF = bright field. Scale bar, 2 µm (B,D), 1 µm (inset).
Figure 2—figure supplement 1
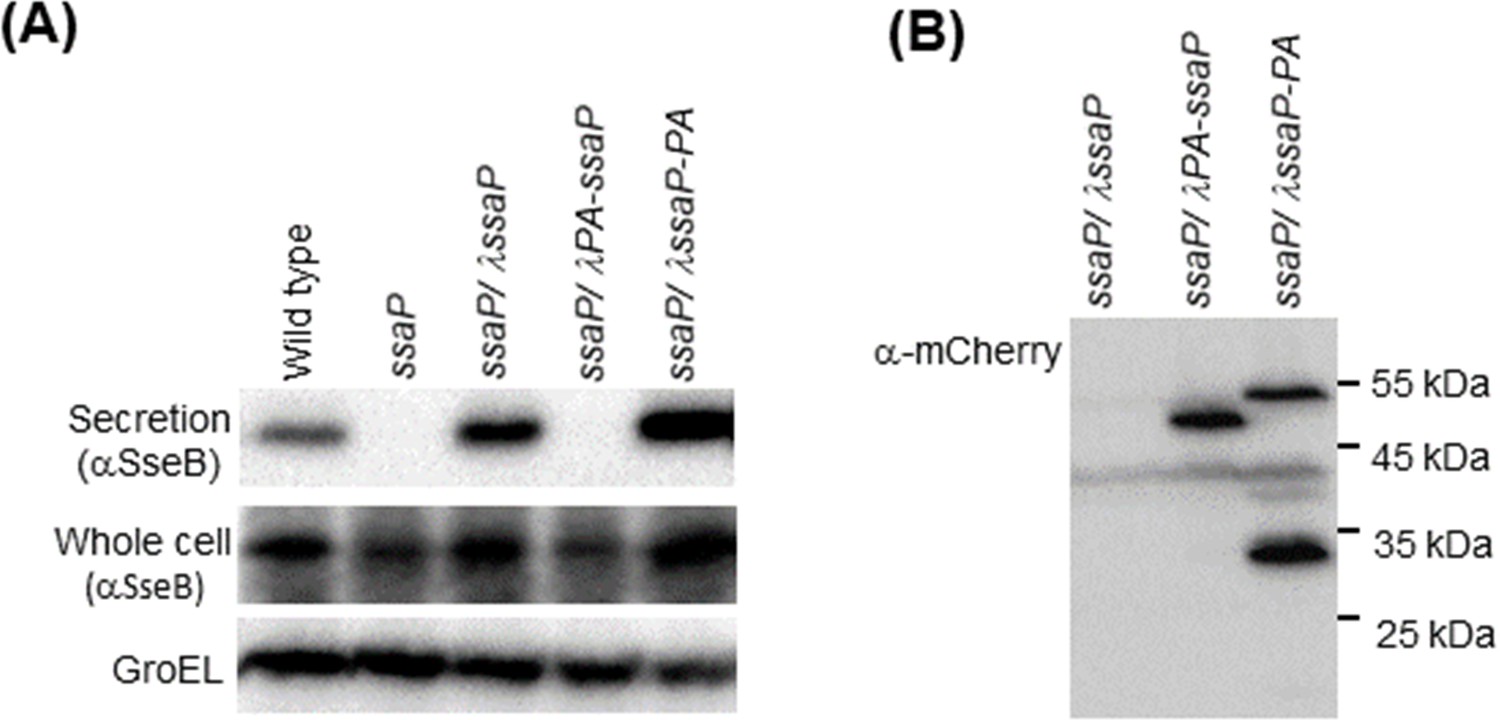
SsaP is required for SPI-2 secretion.
In the wild-type background, the secreted translocon protein SseB appears in both whole cell and secreted fractions (left panel, lane 1). In the ssaP null strain, SseB is produced, but not secreted. SseB secretion is restored by providing ssaP in trans at the ʎ attachment site. A fusion protein with PAmCherry at the N-terminus of SsaP does not support SseB secretion, but a C-terminal PAmCherry fusion restores secretion. GroEL was used as a loading control. The C-terminal SsaP-PAmCherry fusion appears to be cleaved as observed by western blot (right panel).
Figure 2—figure supplement 2
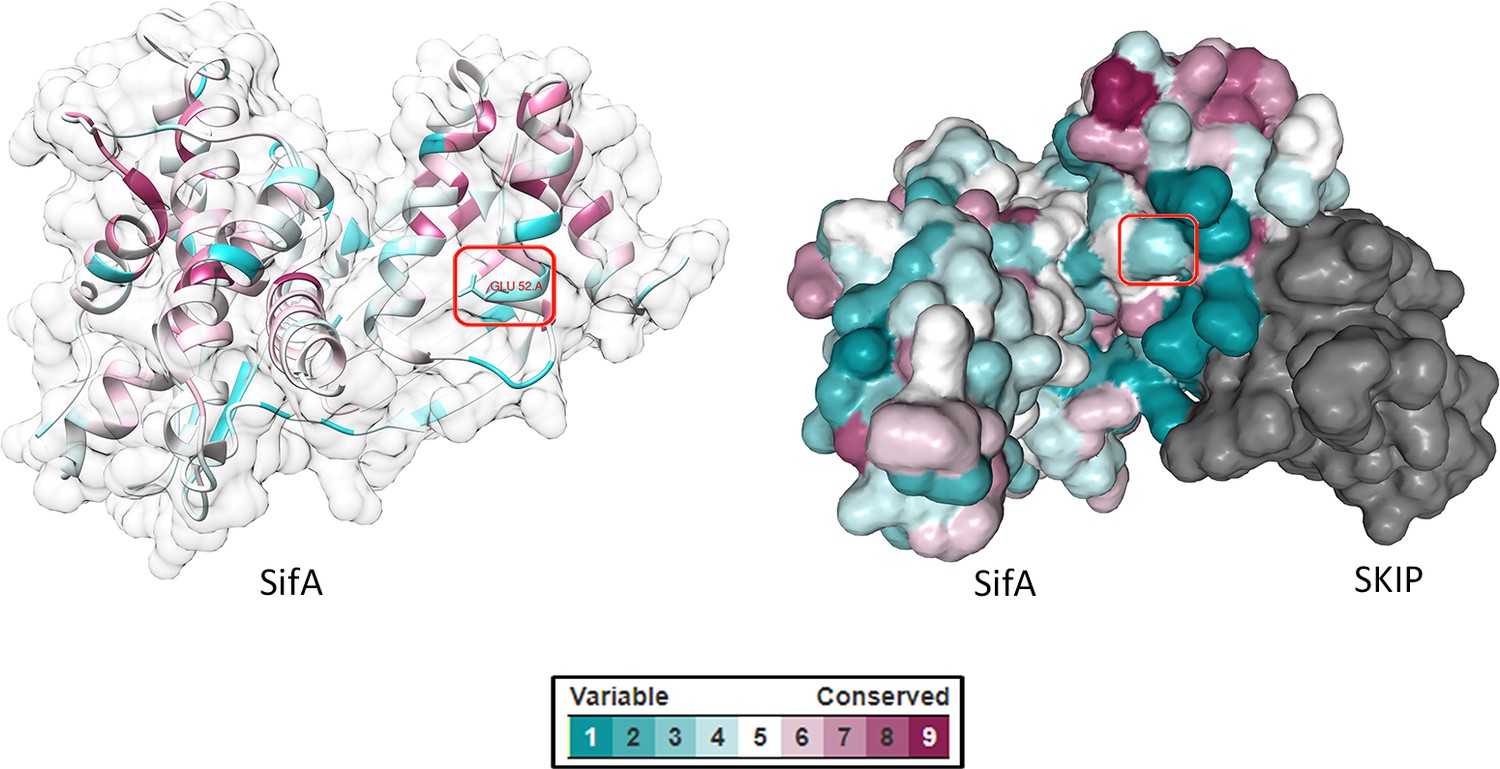
Selection of ncAA incorporation sites.
Residue conservation scores calculated from multiple sequence alignments were mapped onto the crystal structure of SifA (PDB ID: 3CXB) using the ConSurf web server (http://consurf.tau.ac.il/). The visual color key indicates the residue conservation score (cyan: low conservation, magenta: high conservation). The ncAA incorporation sites are highlighted in red rectangles. Protein structures were visualized in Chimera (left) and NGL 3D Viewer (right).
Figure 2—figure supplement 3
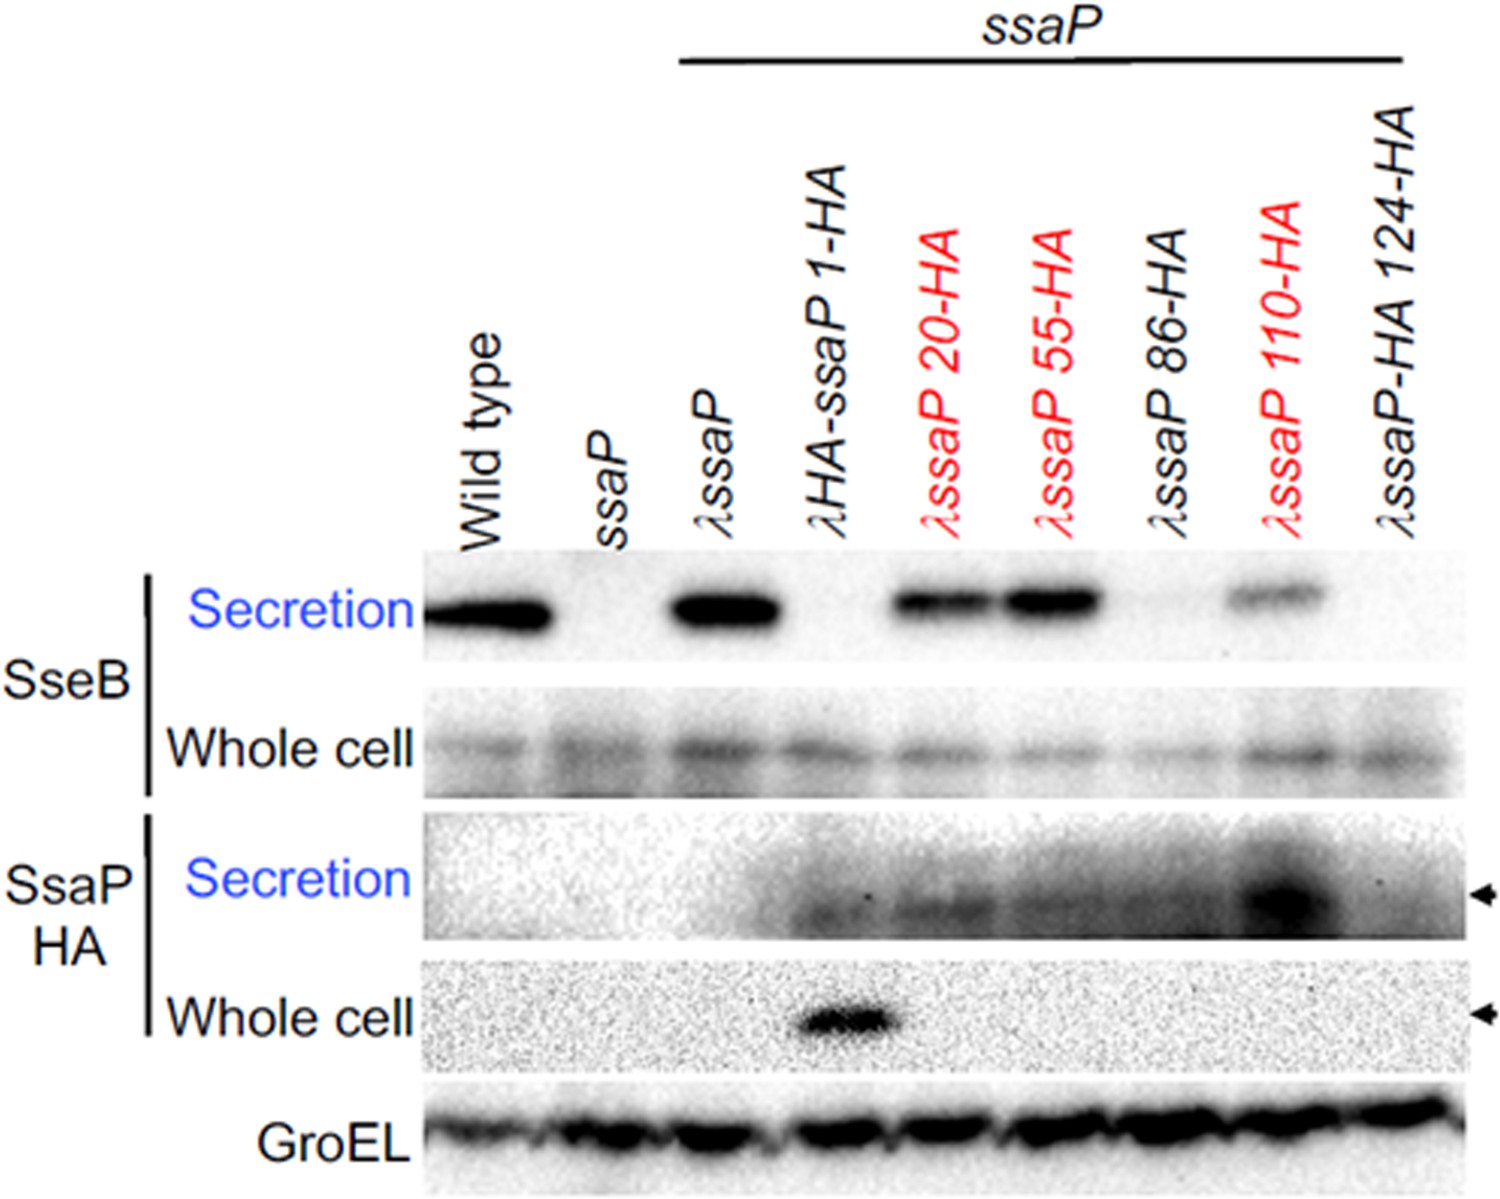
Western blot of SseB (translocon) and SsaP-HA secretion.
Whole cell and secreted fractions were harvested after growth in SPI-2-inducing conditions. The SseB translocon was secreted in the wild-type strain (far left), but not in the ssaP null strain. Complementation of ssaP restored SseB secretion. HA tags were inserted at various locations in SsaP, and the effect on secretion was monitored. HA tags at amino acid position 20, 50, and 110 (red) supported SseB secretion, whereas HA tags at position 86 and 124 did not. In the lower panels, the HA antibody identifies a diffuse band of SsaP protein in the secreted fraction, similar to the fluorescently labeled SsaP (Figure 2). Wild-type SsaP was not detected, because it lacked the HA tag. GroEL was used as a loading control.
Figure 2—figure supplement 4
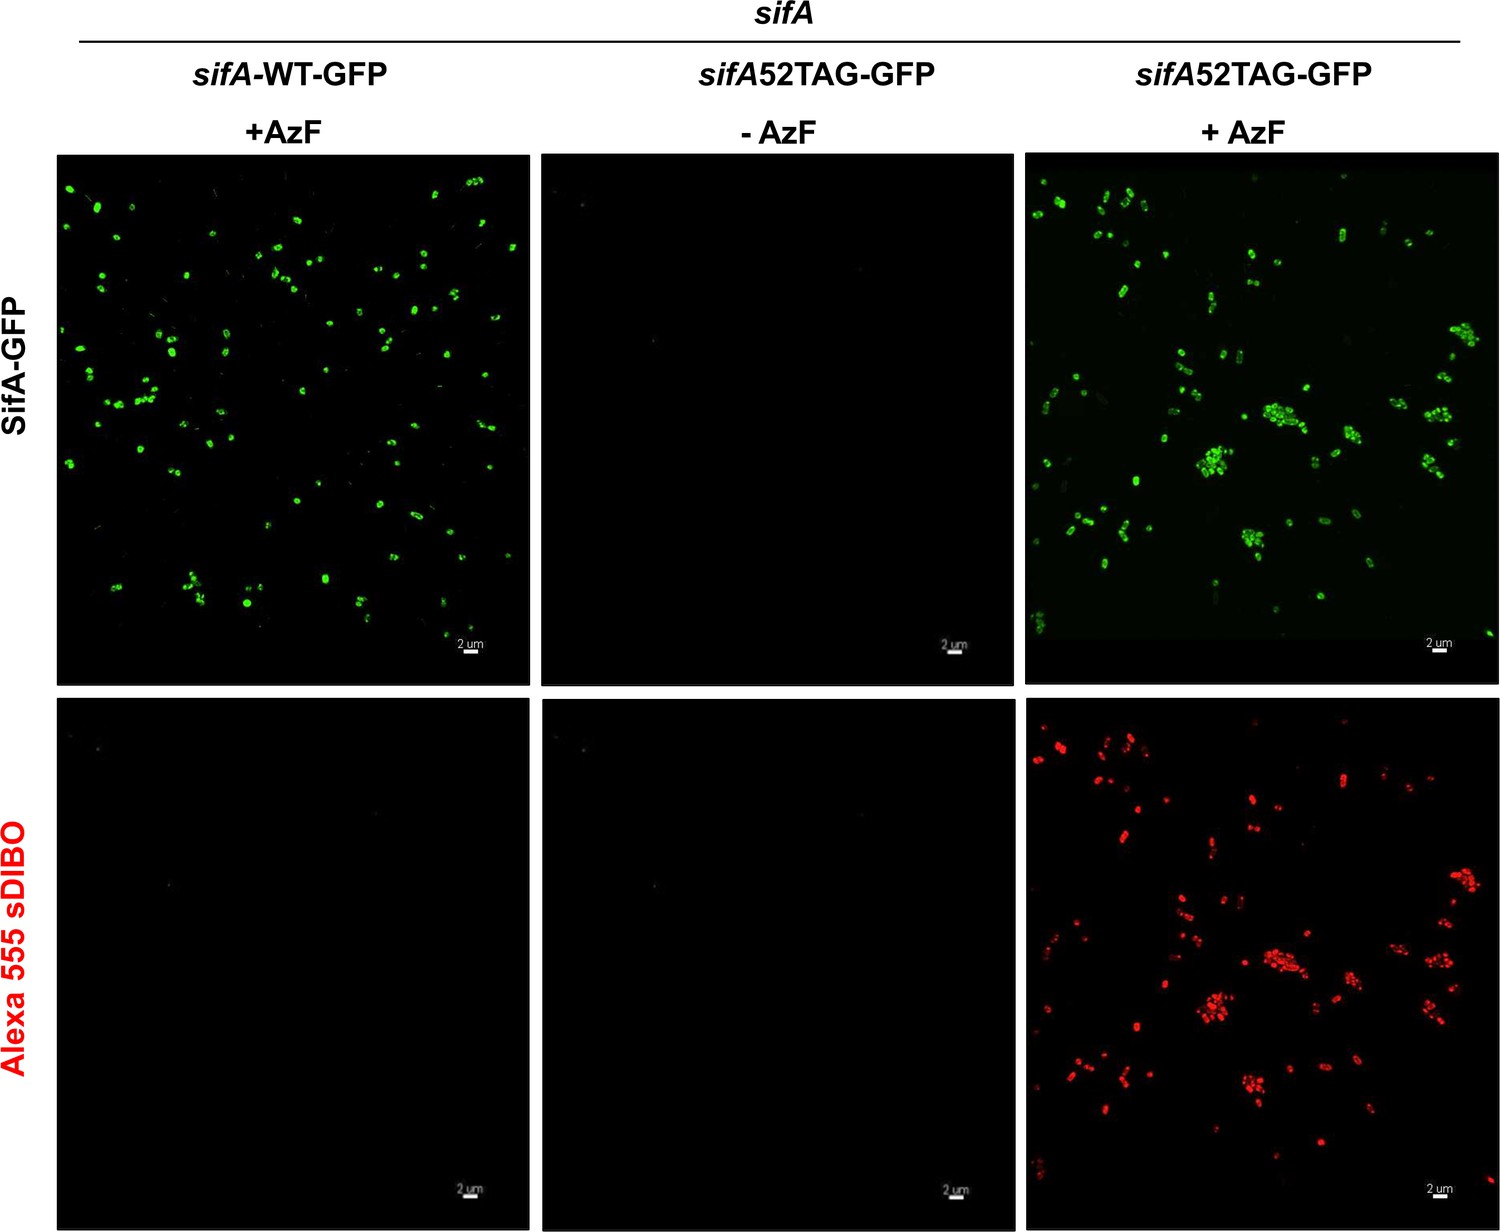
AzF and subsequent Alexa555 sDIBO Alkyne incorporation is highly specific.
Cells were transformed with pEVOL and psifA52TAG-GFP or psifA-WT-GFP were grown in the presence of 1 mM AzF and 0.2% L-arabinose in MgM pH 5.6, 37°C. Cells were harvested at OD600 = 0.4. After extensive washout of excess AzF, cells were incubated with 1 μM Alexa555-sDIBO at 37°C for 60 min. After another extensive washout of excess dye, cells were imaged on agarose pads at ambient temperature using a 488 nm (GFP signal) and 561 nm (Alexa555) excitation laser. First row, left panel shows the expression of wild-type SifA-GFP in the presence of AzF. It is not labeled by Alexa555-sDIBO (bottom panel). The middle panel shows the absence of SifA-E52AzF-GFP-containing bacteria in the absence of ncAA (top), whereas the same strain expressed SifA-E52AzF-GFP in the presence of 1 mM AzF (right). Fluorescent labeling of Salmonella expressing SifA-E52AzF-GFP with Alexa555-sDIBO revealed red fluorescence, which also corresponds to the GFP signal (compare top and bottom rows, right panel). The red fluorescence is absent in the absence of AzF (bottom row middle panel). No red fluorescence was observed in Salmonella cells expressing wild-type SifA-GFP in the presence of AzF (bottom row left panel), demonstrating the extent of SifA-specific labeling using GCE. Results presented in each panel were obtained in at least three independent experiments. Scale bar, 2 µm.
Figure 2—figure supplement 5
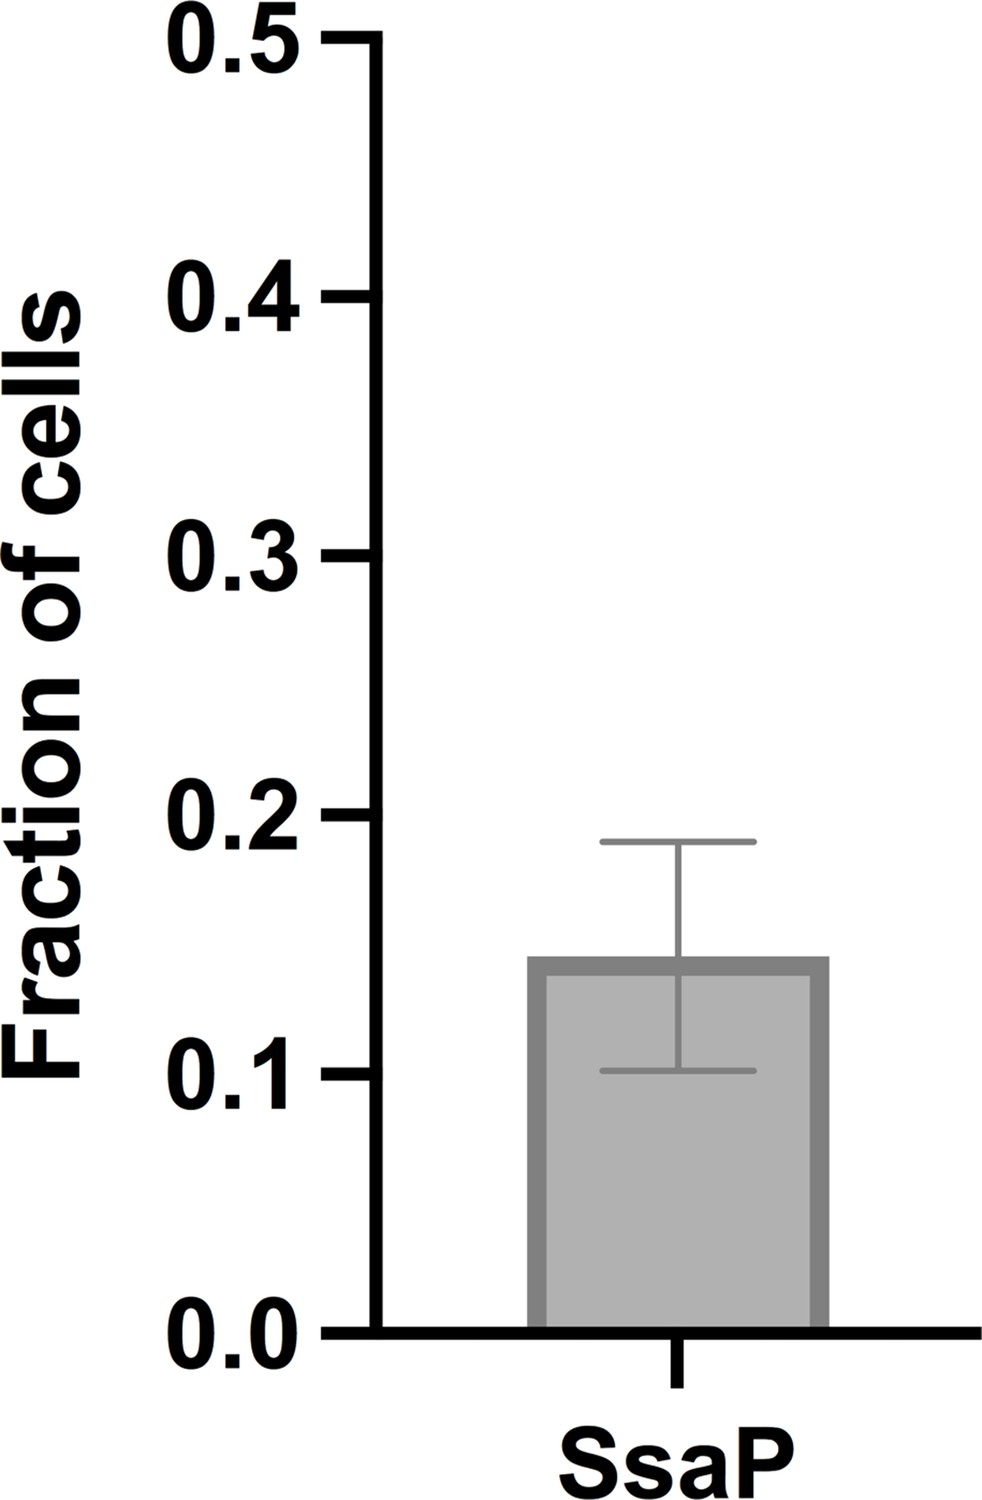
Average fraction of cells that display polarly localized SsaP (ntotal = 112 cells).
Error bars are standard deviation across 18 ROIs pooled from three independent experiments.
-
Figure 2—figure supplement 5—source data 1
Source data for Figure 2—figure supplement 5.
- https://cdn.elifesciences.org/articles/67789/elife-67789-fig2-figsupp5-data1-v3.xlsx
Figure 3 with 5 supplements
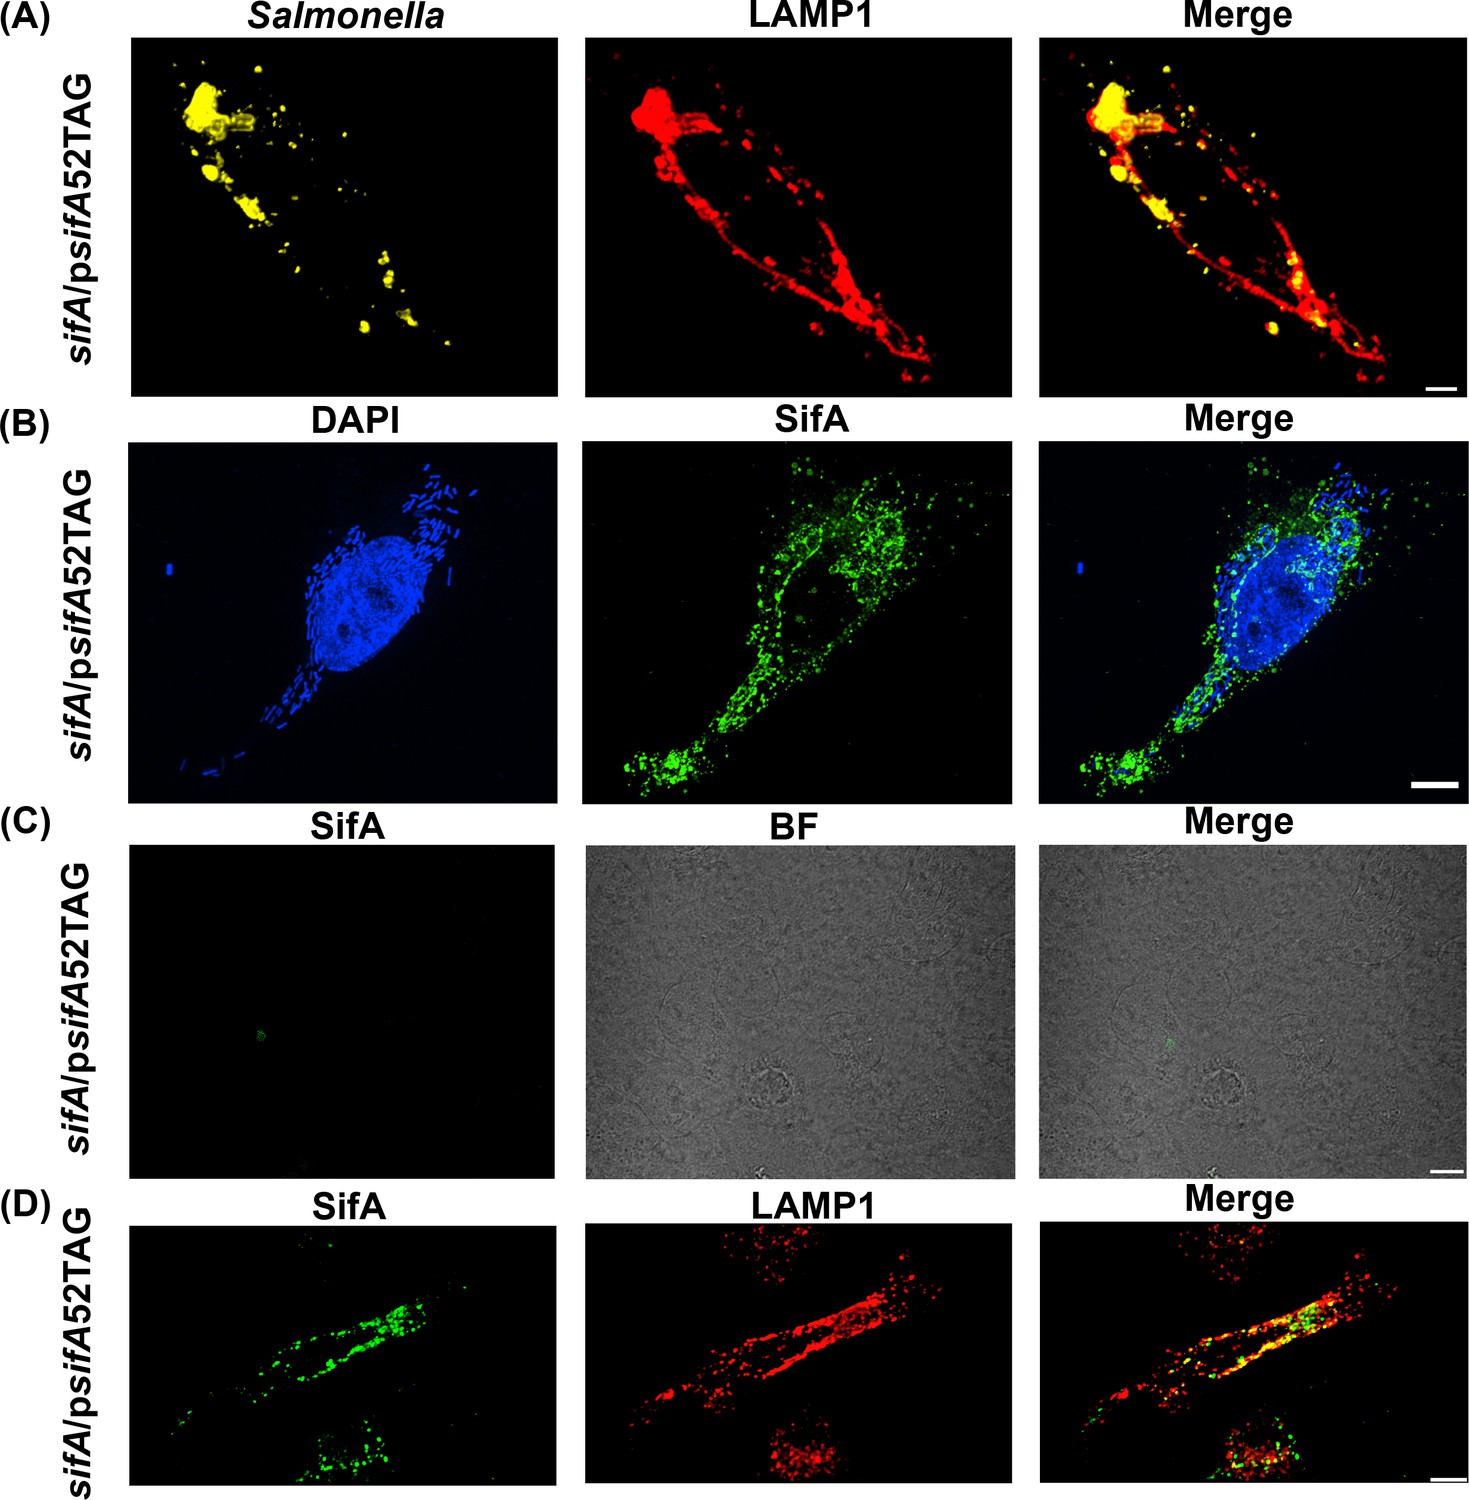
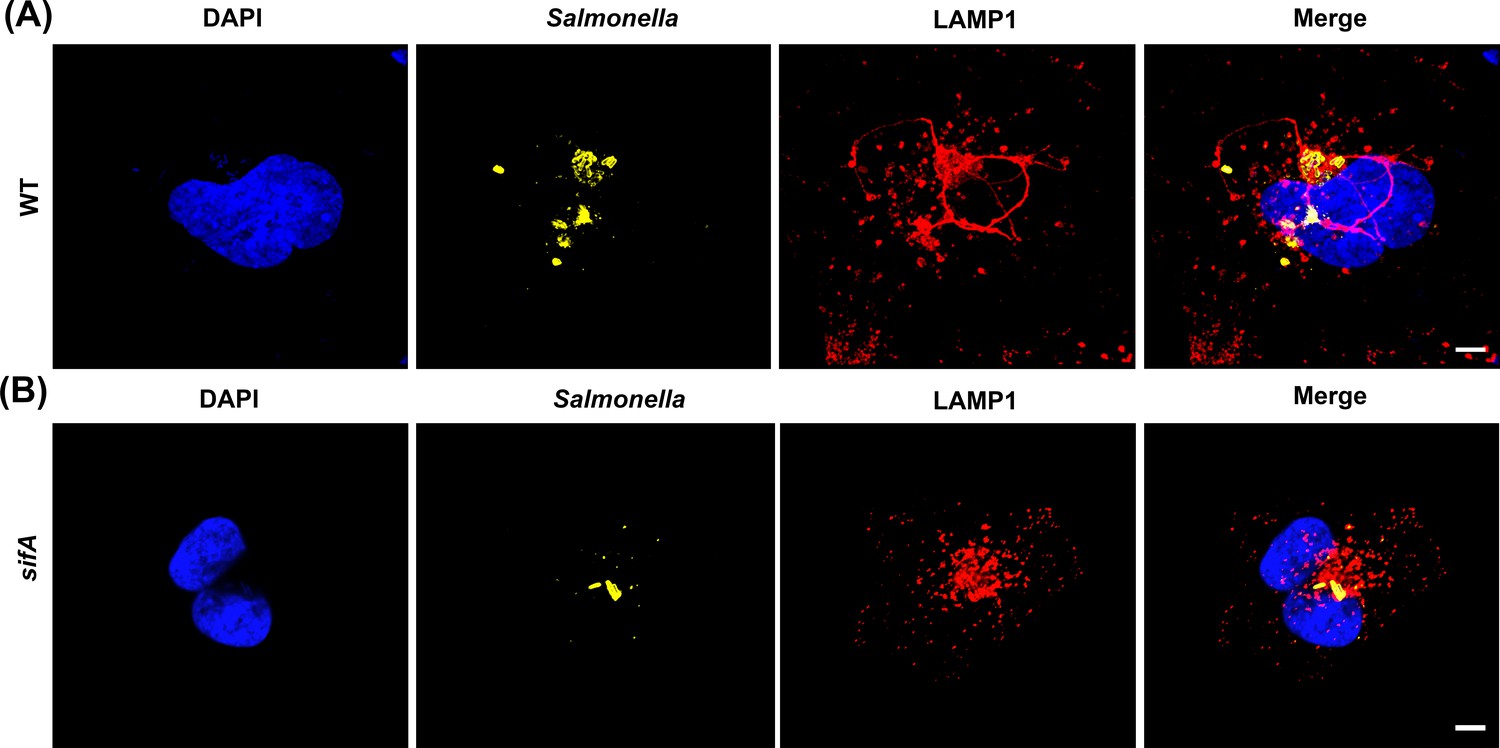
Functional complementation of SIF formation by SifA-E52AzF.
(A) HeLa cells were infected with a sifA null strain of Salmonella expressing SifA-E52AzF and incubated for 16 hr. Infected cells were fixed with 4% PFA and immuno-stained for Salmonella (yellow) and LAMP1 (red). Images were acquired by spinning-disk SIM. Cells infected with sifA harboring psifA52TAG bacteria were capable of forming SIFs that resembled those of wild-type infected cells. (B) SPAAC labeling of secreted SifA-E52AzF with BDP-DBCO. HeLa cells were infected with a sifA null strain expressing SifA-E52AzF in the presence of 1 mM AzF. AzF-tagged secreted SifA-E52AzF was labeled with BDP-DBCO (green). Host nuclei and Salmonella nucleoids were labeled with DAPI (blue) and images were acquired using spinning-disk SIM. (C) SifA-E52AzF labeling was absent in the absence of ncAA. HeLa cells were infected with the sifA null mutant of Salmonella expressing SifA-E52AzF in the absence of AzF for 12 hr. After 12 hr post infection, HeLa cells were incubated with 2.5 μM BDP-DBCO in DMEM with 10% FBS growth media for another 2 hr, followed by extenstive washing to remove excess dye as described in Methods. At 16 hr post-infection, cells were fixed. SifA was absent in the infected cells that lacked AzF. Images were acquired by confocal microscopy. See Figure 3—figure supplement 4 for statistical analysis for the average fraction of infected cells that contain LAMP1 positive SIFs and SIFs containing labeled SifA. (D) Colocalization of SifA with LAMP1. Salmonella secreted SifA-E52AzF in HeLa cells was labeled with BDP-DBCO (green). Cells were also immuno-stained for the endosomal membrane marker LAMP1 (red, middle panel). Images were acquired by confocal microscopy. From the merged image (right), it is evident that SifA is present within the SIFs. Statistical analysis is shown in Figure 3—figure supplement 5. The data are representative of at least three independent experiments. Scale bar, 10 µm (A–D).
Figure 3—figure supplement 1
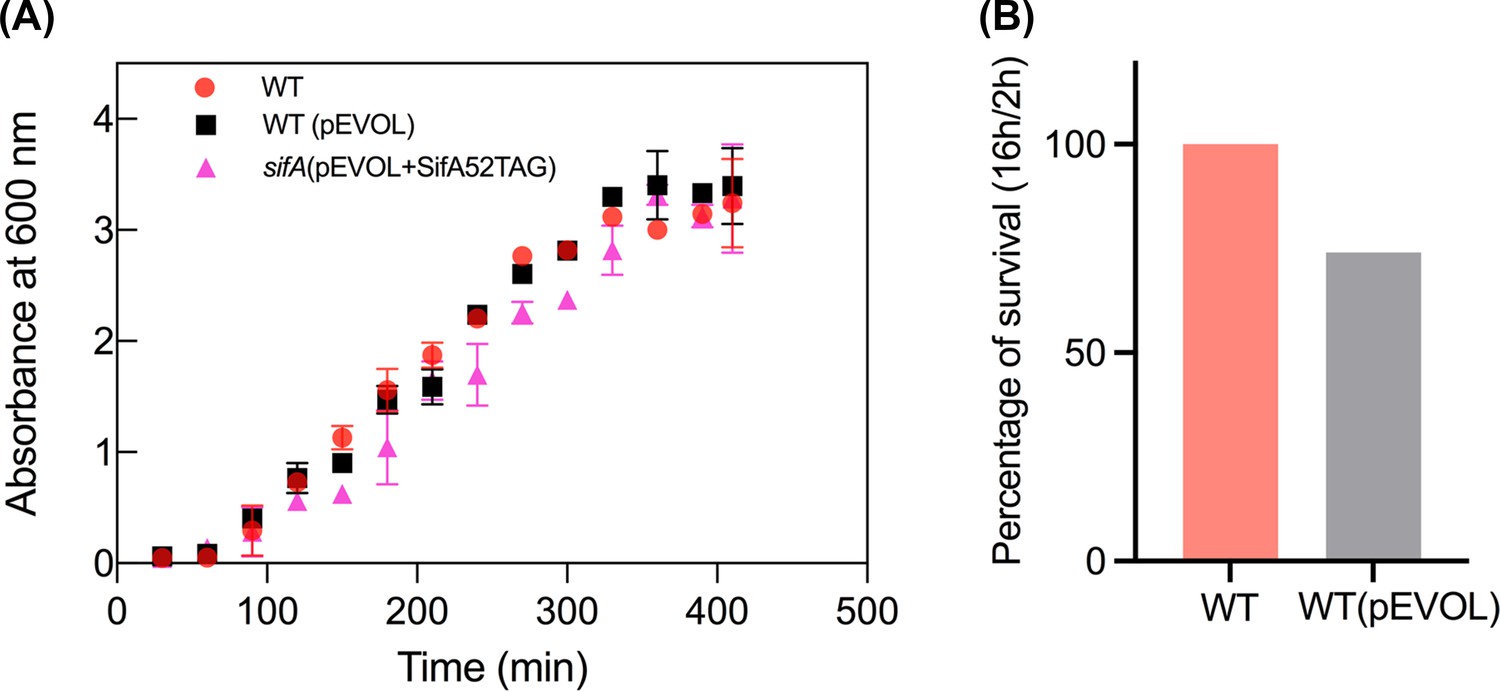
The amber suppression system (pEVOL) does not affect Salmonella pathogenesis.
(A) Growth curves of wild-type Salmonella and its isogenic sifA mutant in LB media in the presence of pEVOL. The error bars represent the mean ± standard deviation (n = 3). (B) Survival assay of wild-type Salmonella and wild-type Salmonella transformed with pEVOL in HeLa cells. Strains of Salmonella wild-type and the wild-type transformant with pEVOL were grown in LB to late exponential phase and added to HeLa cells at an MOI of 100:1 for 30 min. At 2 hr and 16 hr post infection, cells were lysed, and the intracellular bacteria were enumerated. The percentage of survival of the transformant was normalized to wildtype (100%).
-
Figure 3—figure supplement 1—source data 1
Source data for Figure 3—figure supplement 1A.
- https://cdn.elifesciences.org/articles/67789/elife-67789-fig3-figsupp1-data1-v3.xlsx
-
Figure 3—figure supplement 1—source data 2
Source data for Figure 3—figure supplement 1B.
- https://cdn.elifesciences.org/articles/67789/elife-67789-fig3-figsupp1-data2-v3.xlsx
Figure 3—figure supplement 2
A sifA null strain lacks SIFs.
HeLa cells were infected with Salmonella for 16 hr, fixed and immuno-stained for LAMP1 (red), LPS (yellow), and DAPI (blue). As expected, the formation of SIFs was observed in cells infected with WT Salmonella (A), but not in cells infected with the sifA null strain (B). Images were acquired on a spinning-disk SIM, as described in Materials and methods (n = >10 independent experiments). Scale bar, 10 µm.
Figure 3—figure supplement 3
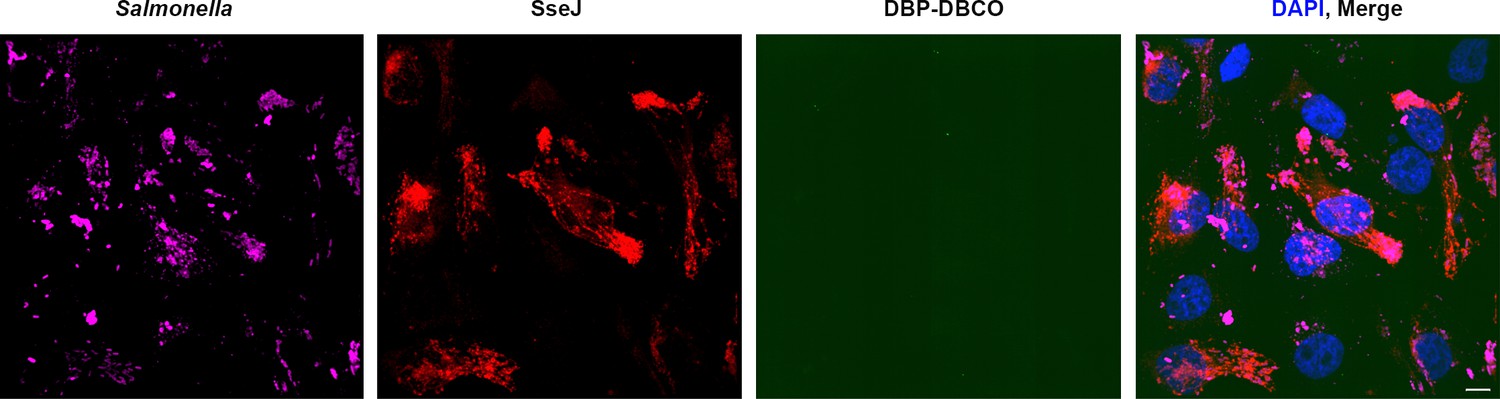
No off-target labeling of secreted effectors is observed within host cells.
HeLa cells were infected with WT-Salmonella harboring SseJ-HA and pEVOL in the presence of AzF. At 10 hr post infection, excess AzF was washed out and replaced with fresh growth media without AzF for 2 hr. At 14 hr post infection, HeLa cells were incubated with 2.5 μM BDP-DBCO in DMEM with 10% FBS growth media for another 2 hr, followed by extenstive removal of excess dye with fresh growth media as described in Materials and methods. At 16 hr post-infection, cells were fixed and washed with PBS, then immunostained for SseJ (red). The absence of any noticeable fluorescence signal in the green channel (BDP-DBCO) indicated that there was virtually no off-target labeling of secreted effectors within host cells. The results presented in each panel were obtained in at least three independent experiments. Scale bar, 10 µm.
Figure 3—figure supplement 4
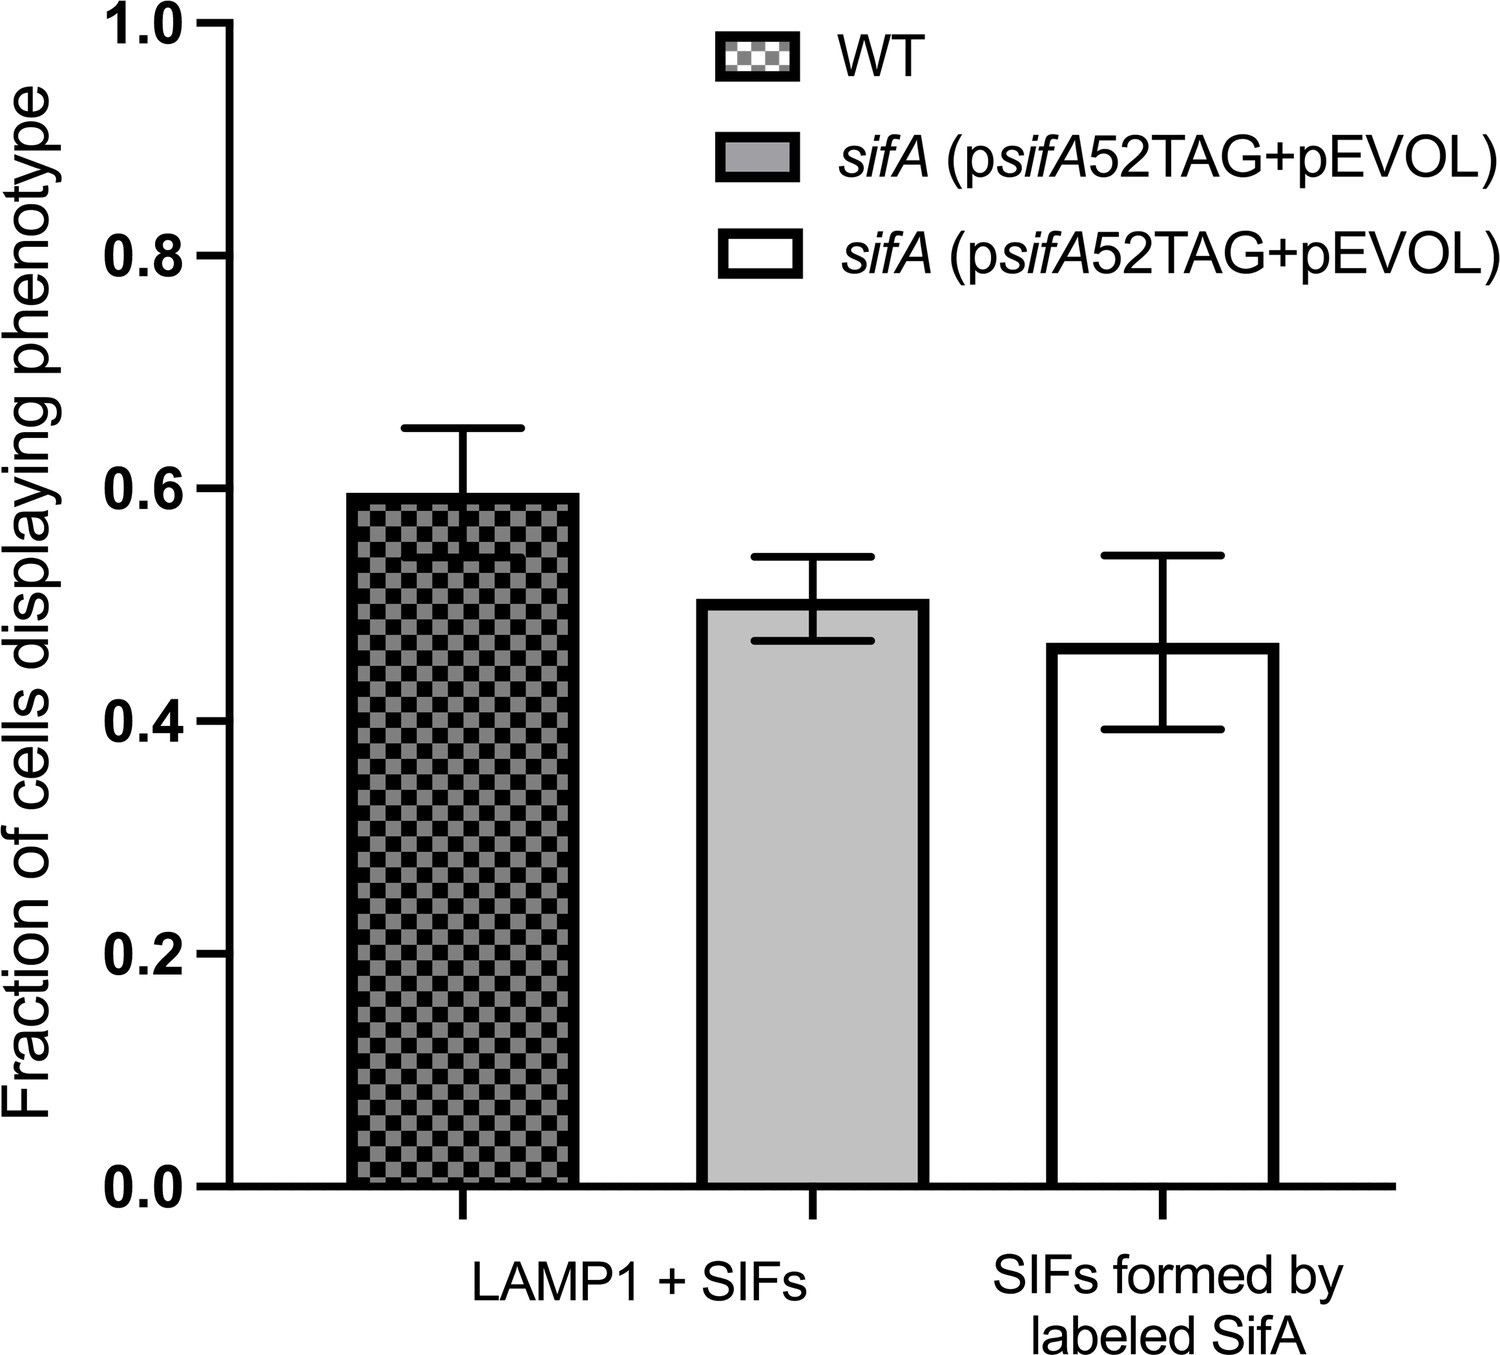
The average fraction of infected cells that contain LAMP1 positive SIFs and SIFs containing labeled SifA.
The total number of LAMP1 positive cells was 85 for WT, 91 for sifA (psifA52TAG + pEVOL), and 70 for sifA (psifA52TAG + pEVOL) labeled with the click reaction. The error bars indicate the standard deviation across three data sets pooled from ROIs from independent infections.
-
Figure 3—figure supplement 4—source data 1
Source data for Figure 3—figure supplement 4.
- https://cdn.elifesciences.org/articles/67789/elife-67789-fig3-figsupp4-data1-v3.xlsx
Figure 3—figure supplement 5
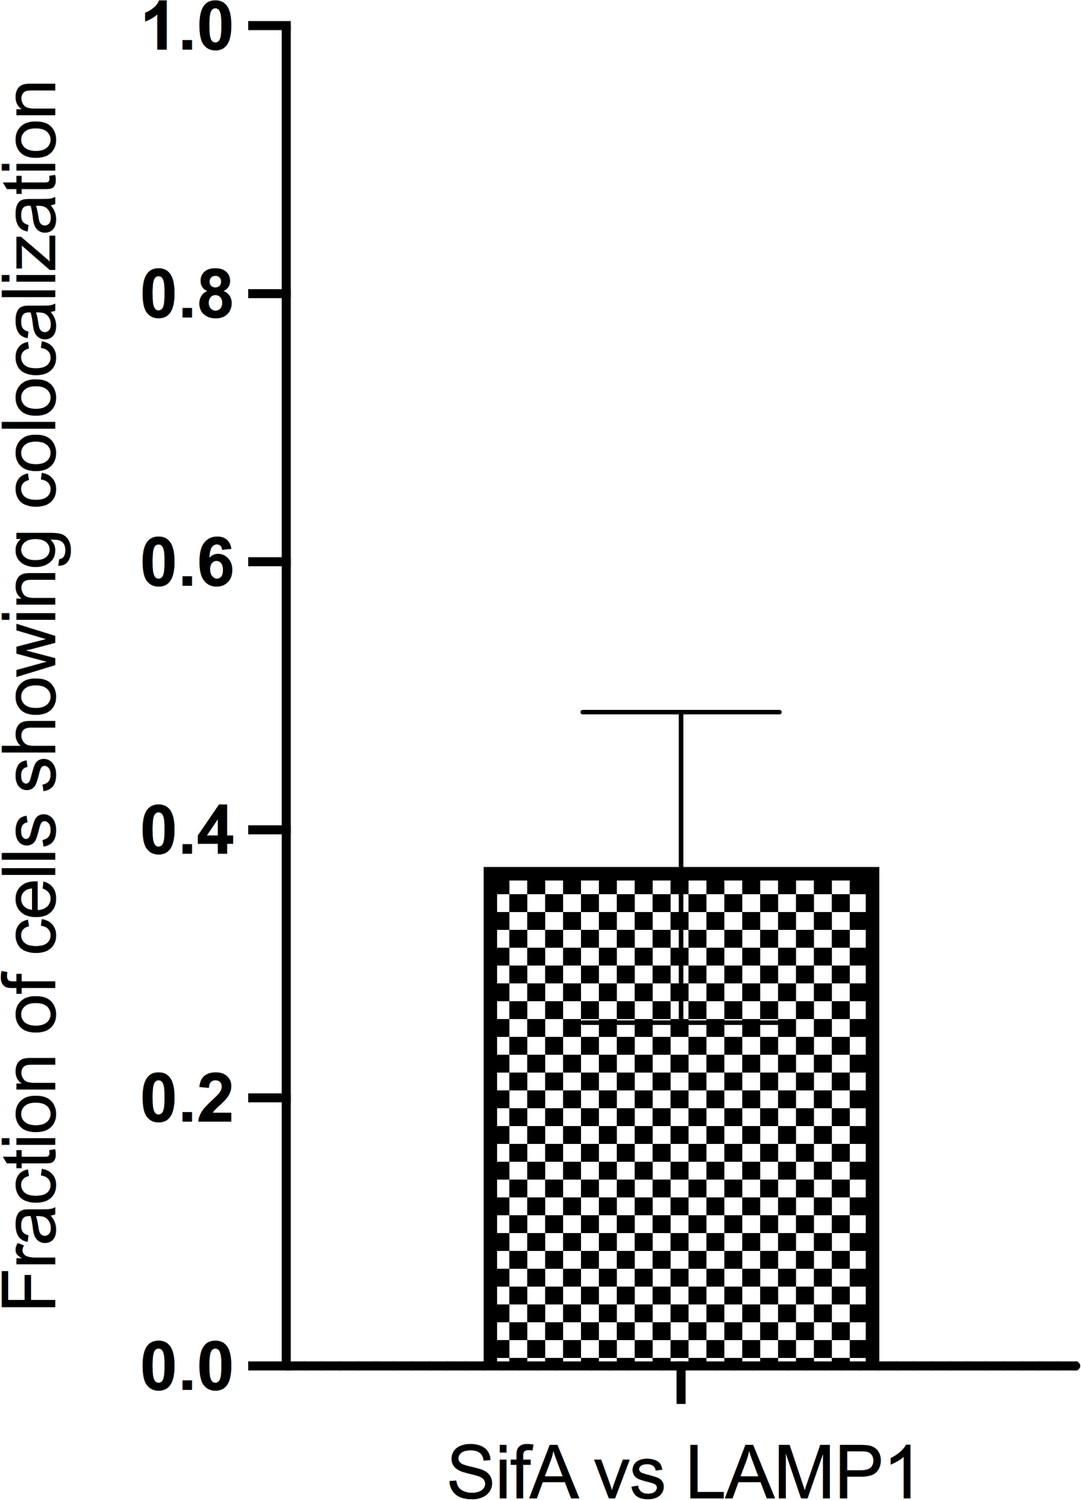
The proportion of tubules with labeled SifA and its colocalization with LAMP1 (n = 27); n is the total number of cells analyzed.
Error bars represent the standard deviation across three data sets pooled from separate infections.
-
Figure 3—figure supplement 5—source data 1
Source data for Figure 3—figure supplement 5.
- https://cdn.elifesciences.org/articles/67789/elife-67789-fig3-figsupp5-data1-v3.xlsx
Figure 4 with 3 supplements
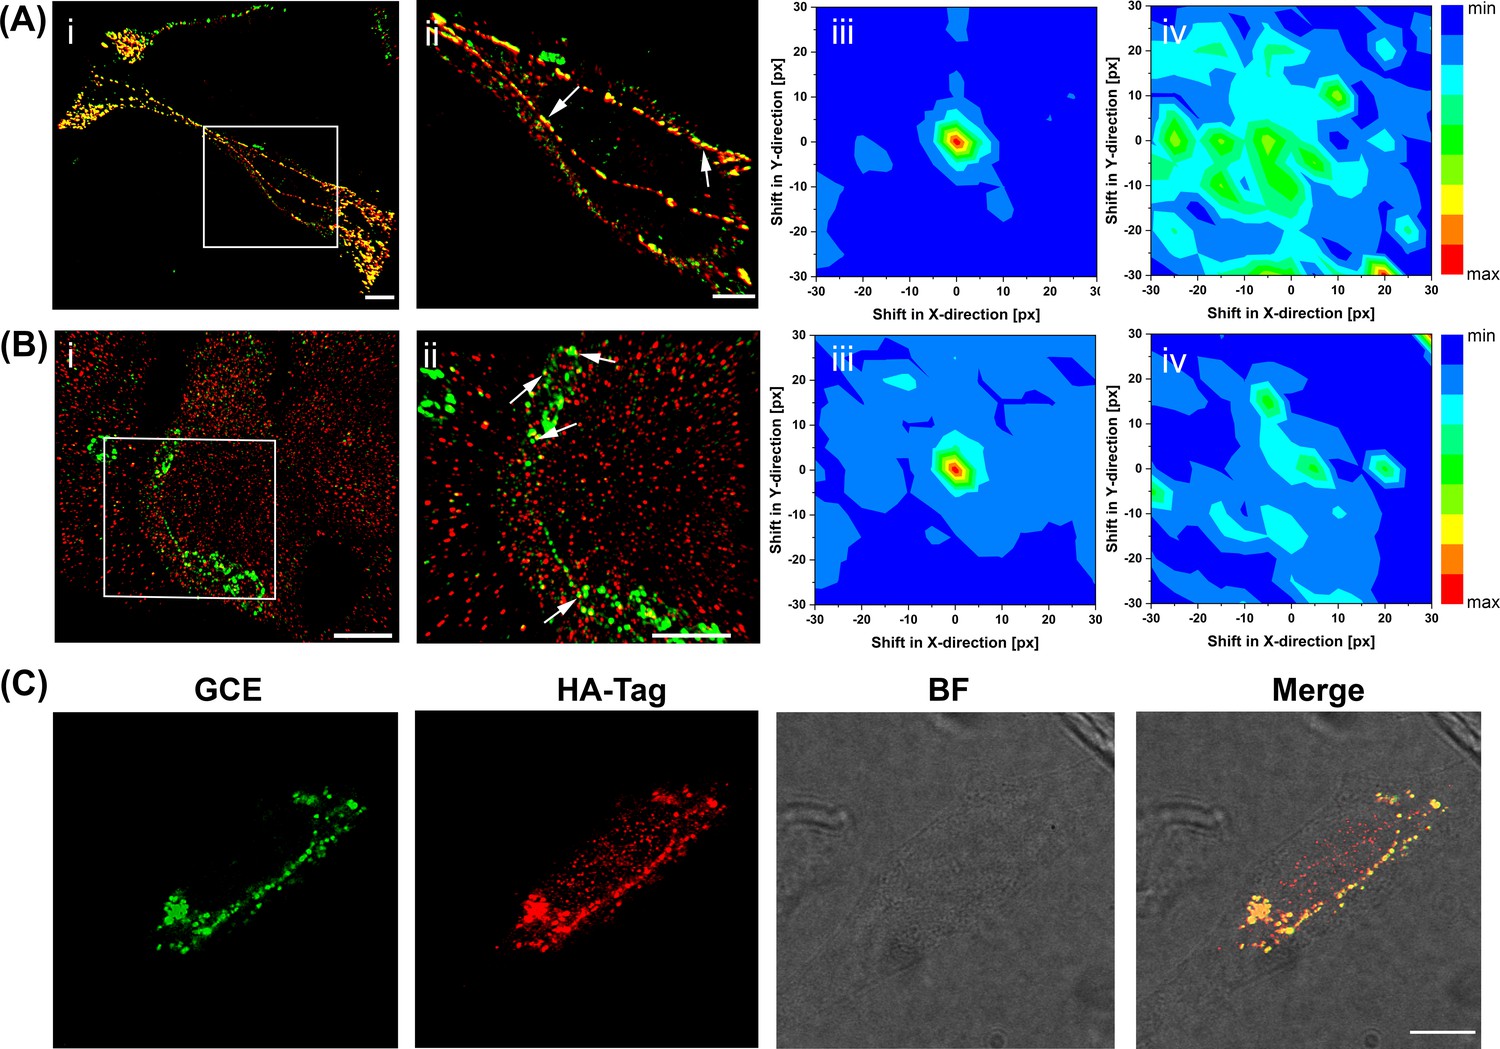
Super-resolution imaging of GCE-labeled SifA.
(Ai) SifA colocalizes with SseJ. Spinning-disk SIM image of an infected HeLa cell, 16 hr after invasion, fixed with PFA and stained for SifA (green) and SseJ-HA (red). (Aii) Magnified view of SifA and SseJ in the boxed region at the far left (arrows indicate colocalization). (iii) Colocalization was analyzed by calculating Mander’s M1 coefficient (SifA colocalizing with SseJ) for the original dual-color image (x = y = 0) and for control images generated by translating the spectral channels with respect to each other in x and y directions. This analysis generated a colocalization map, with a peak intensity at x = y = 0, indicating true colocalization (n = 3 cells). (iv) Colocalization analysis of mock-infected cells (n = 3 cells) stained for SifA-E52AzF and SseJ-HA showed no peak intensity at x = y = 0, indicating no colocalization of anti-HA antibodies and SifA. Bars, 10 µm (i), 5 µm (ii). (B) SifA colocalizes with kinesin. (i) Spinning-disk SIM image of an infected HeLa cell fixed with PFA at 16 hr post-infection and stained for kinesin (red) and SifA (green). (ii) Magnified view of SifA and kinesin in the boxed region (arrows indicate colocalization). (iii and iv) Colocalization analysis was performed as described in (A). The same color map scaling was used for comparison. px, pixels. See Figure 4—figure supplement 1 for statistical analysis. Scale bar, 5 µm (i), 2 µm (ii). (C) Bioorthogonal fluorescence imaging of SseJ-Y10TCO-HA with tetrazine fluorophores versus immunofluorescence staining. HeLa cells expressing SseJ-Y10TCO-HA in the presence of TCO*Lys were labeled with BDP-Tz under physiological conditions, briefly washed, and subjected to anti-HA immunofluorescence staining. Images were acquired by confocal microscopy. The data are representative of at least three independent experiments. Scale bar, 10 µm.
-
Figure 4—source data 1
Source data for Figure 4(iii-iv)..
- https://cdn.elifesciences.org/articles/67789/elife-67789-fig4-data1-v3.xls
-
Figure 4—source data 2
Source data for Figure 4(iii-iv).
- https://cdn.elifesciences.org/articles/67789/elife-67789-fig4-data2-v3.xls
Figure 4—figure supplement 1
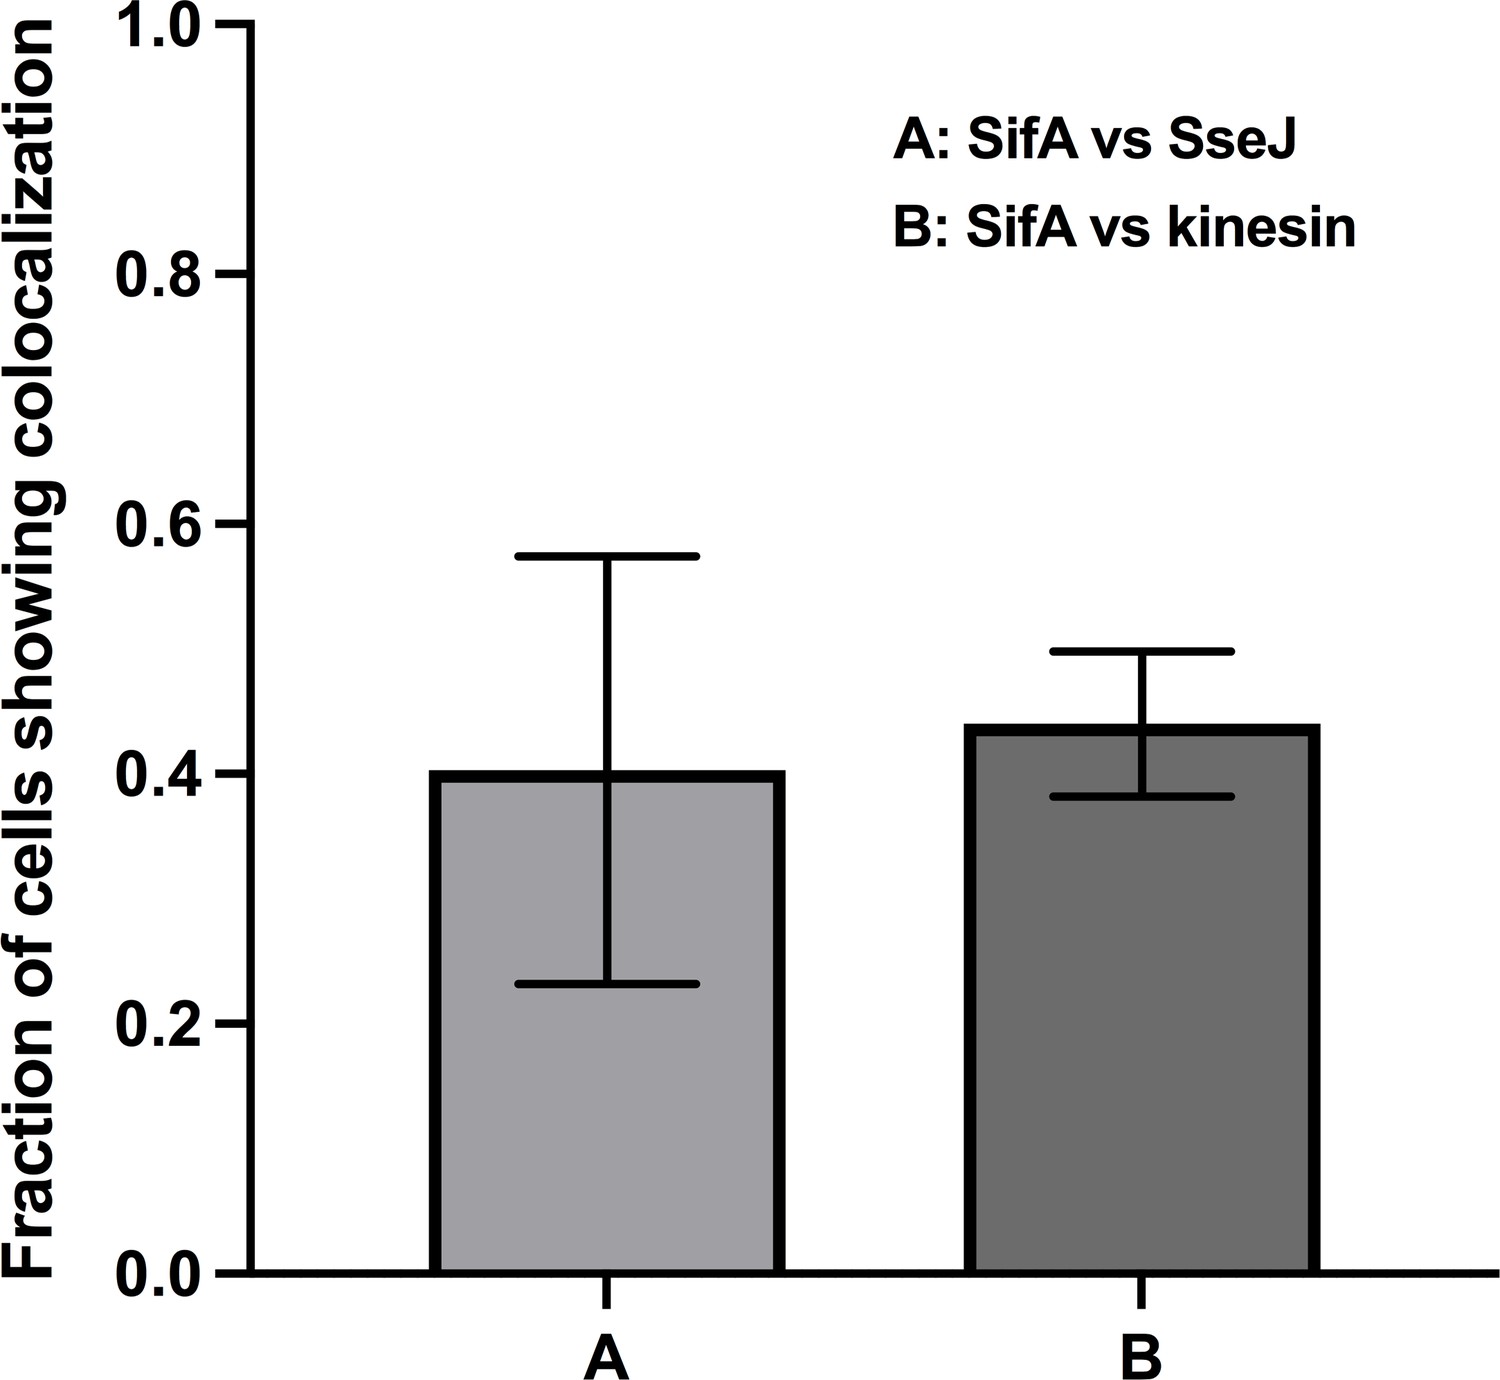
The proportion of tubules with labeled SifA and its colocalization with SseJ (n = 33) and kinesin (n = 35); n is the total number of cells analyzed.
Error bars represent the standard deviation across three data sets pooled from separate infections.
-
Figure 4—figure supplement 1—source data 1
Source data for Figure 4—figure supplement 1.
- https://cdn.elifesciences.org/articles/67789/elife-67789-fig4-figsupp1-data1-v3.xlsx
Figure 4—figure supplement 2
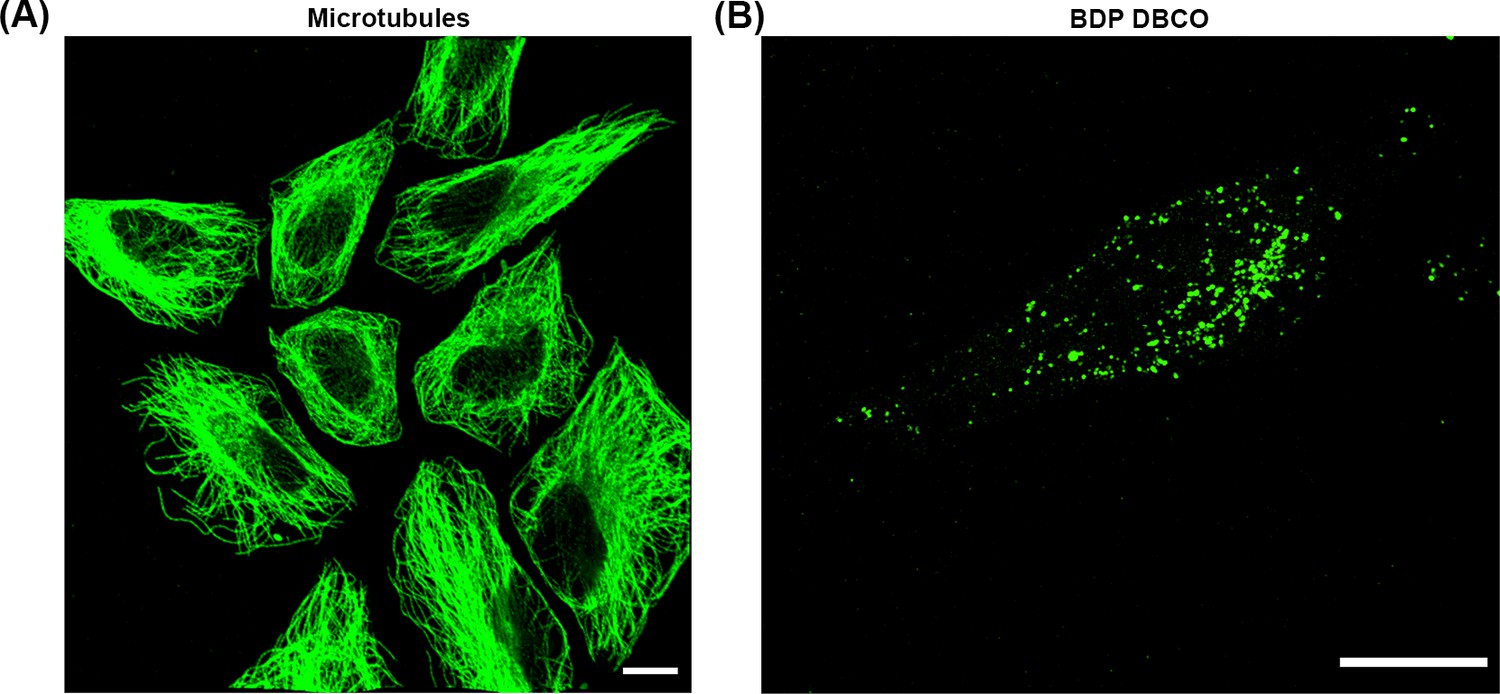
GA fixation preserves microtubules.
(A) HeLa cells were infected with sifA mutants harboring pSifA52TAG and pEVOL-AzF. At 10 hr post infection, excess AzF was washed out and replaced with fresh growth media without AzF for 2 hr. At 14 hr post infection, HeLa cells were incubated with 2.5 μM BDP-DBCO in DMEM with 10% FBS growth media for another 2 hr, followed by extenstive removal of excess dye with fresh growth media as described in Materials and methods. At 16 hr post-infection, cells were extracted for 1 min using a microtubule-stabilizing buffer (MTSB). The buffer was exchanged with MTSB containing 0.2% GA, and cells were fixed for 10 min at room temperature. Excess GA was quenched for 7 min using 0.2% sodium borohydride in PBS. After several washes with PBS, cells were immunostained for microtubules (green). Scale bar, 10 µm. (B) Prior to immunostaining, GA-fixed HeLa cells were imaged for SifA labeled with BDP-DBCO using Spinning-disk SIM. Note the punctate labeling of SifA, indicating that while SseJ forms continuous filaments, SifA does not. The results presented in each panel were obtained in at least three independent experiments. Scale bar, 5 µm.
Figure 4—figure supplement 3
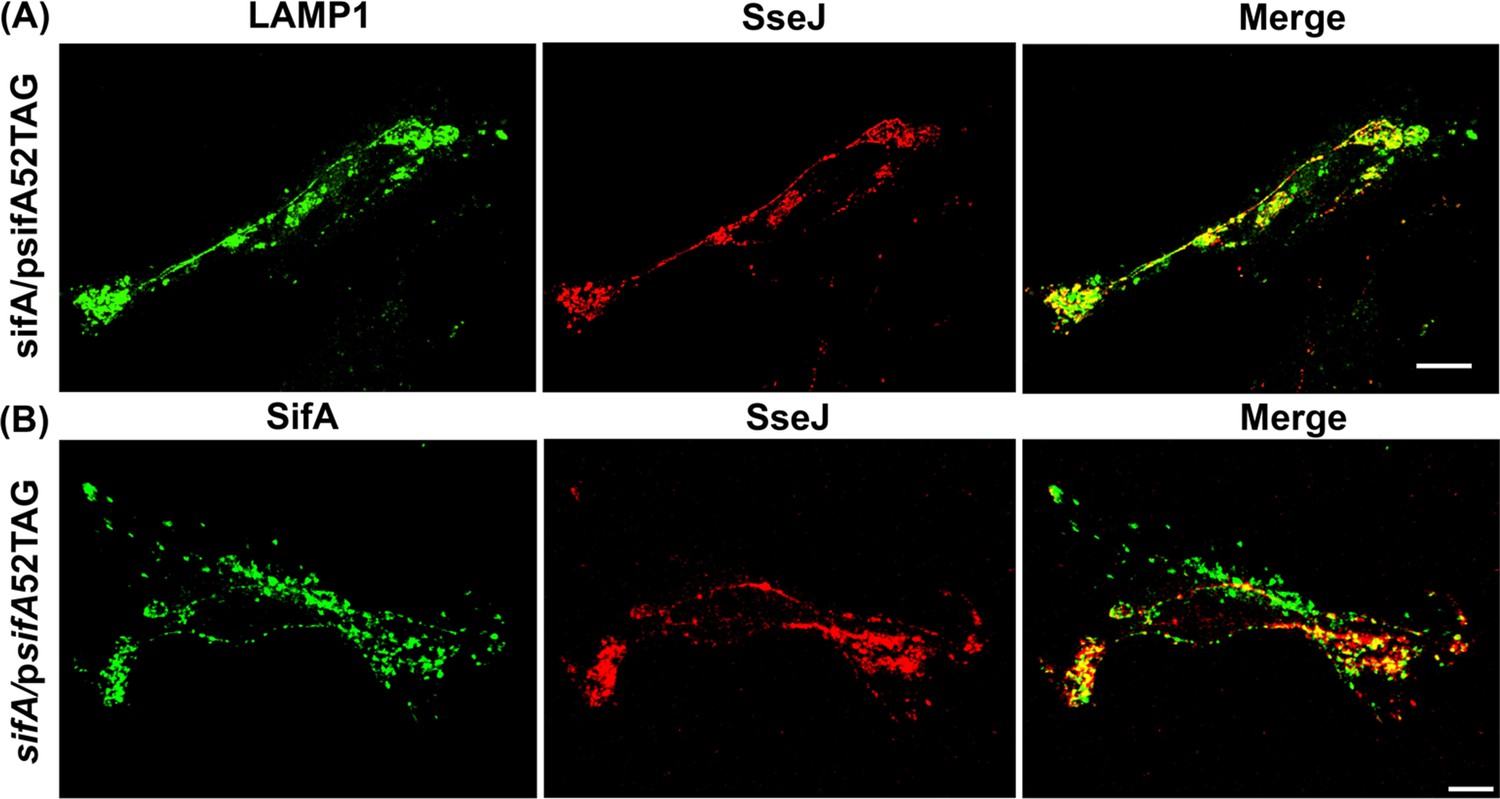
Functional complementation of SIFs by expression of fluorescent SifA-E52Hco.
(A) HeLa cells were infected with the sifA null strain of Salmonella expressing SifA-E52Hco and SseJ-HA for 16 hr, fixed and immuno-stained for LAMP1 (green), SseJ (red). The SifA-E52Hco strain was capable of forming SIFs and colocalized with SseJ. Images were acquired on a spinning-disk SIM as described in Materials and methods. (B) Direct visualization of secreted SifA. HeLa cells were infected with a sifA null strain of Salmonella expressing SifA-E52Hco in the presence of 1 mM Hco and fixed 16 hr post infection with 4% PFA. Hco-tagged secreted SifA-E52Hco was directly imaged by two photon microscopy. Immuno-stained SseJ-HA was also imaged in the same cell. The data are representative of at least three independent experiments. Scale bar, 10 µm (A), 20 µm (B).
Figure 5 with 5 supplements

SsaP is secreted during HeLa cell infection.
(A) SPIEDAC labeling of secreted SifA-Y65TCO with fluorogenic SiR-Tz. HeLa cells were infected with the ssaP null mutant of Salmonella expressing SsaP-Y65TCO in the presence of TCO*Lys for 12 hr. After 12 hr post infection, HeLa cells were incubated with 1.5 μM SiR-Tz in DMEM with 10% FBS growth media for another 2 hr, followed by extenstive wash out of excess dye with fresh growth media as described in Materials and methods. At 16 hr post-infection, cells were fixed. Cells were also immuno-stained for the endosomal membrane marker LAMP1 (green), LPS (Red) and DAPI (Blue) and imaged by spinning-disk SIM. From the merged image (right), it is evident that SsaP is present within the LAMP1-positive endosomes. A higher magnification spinning-disk SIM image of a SIF-positive HeLa cell from the boxed region (i) is shown on the right-most panel without the green channel displayed (i). It clearly shows secreted SsaP from Salmonella (boxed region). (B) SsaP was absent in infected cells that lacked ssaP. HeLa cells that were infected with an ssaP null mutant in the presence of TOC*Lys lack an SsaP signal. Note the absence of SIFs in the merged image (right) in the ssaP null strain. The data are representative of at least three independent experiments. Scale bar, 5 µm (A and i) and 10 µm (B).
Figure 5—figure supplement 1
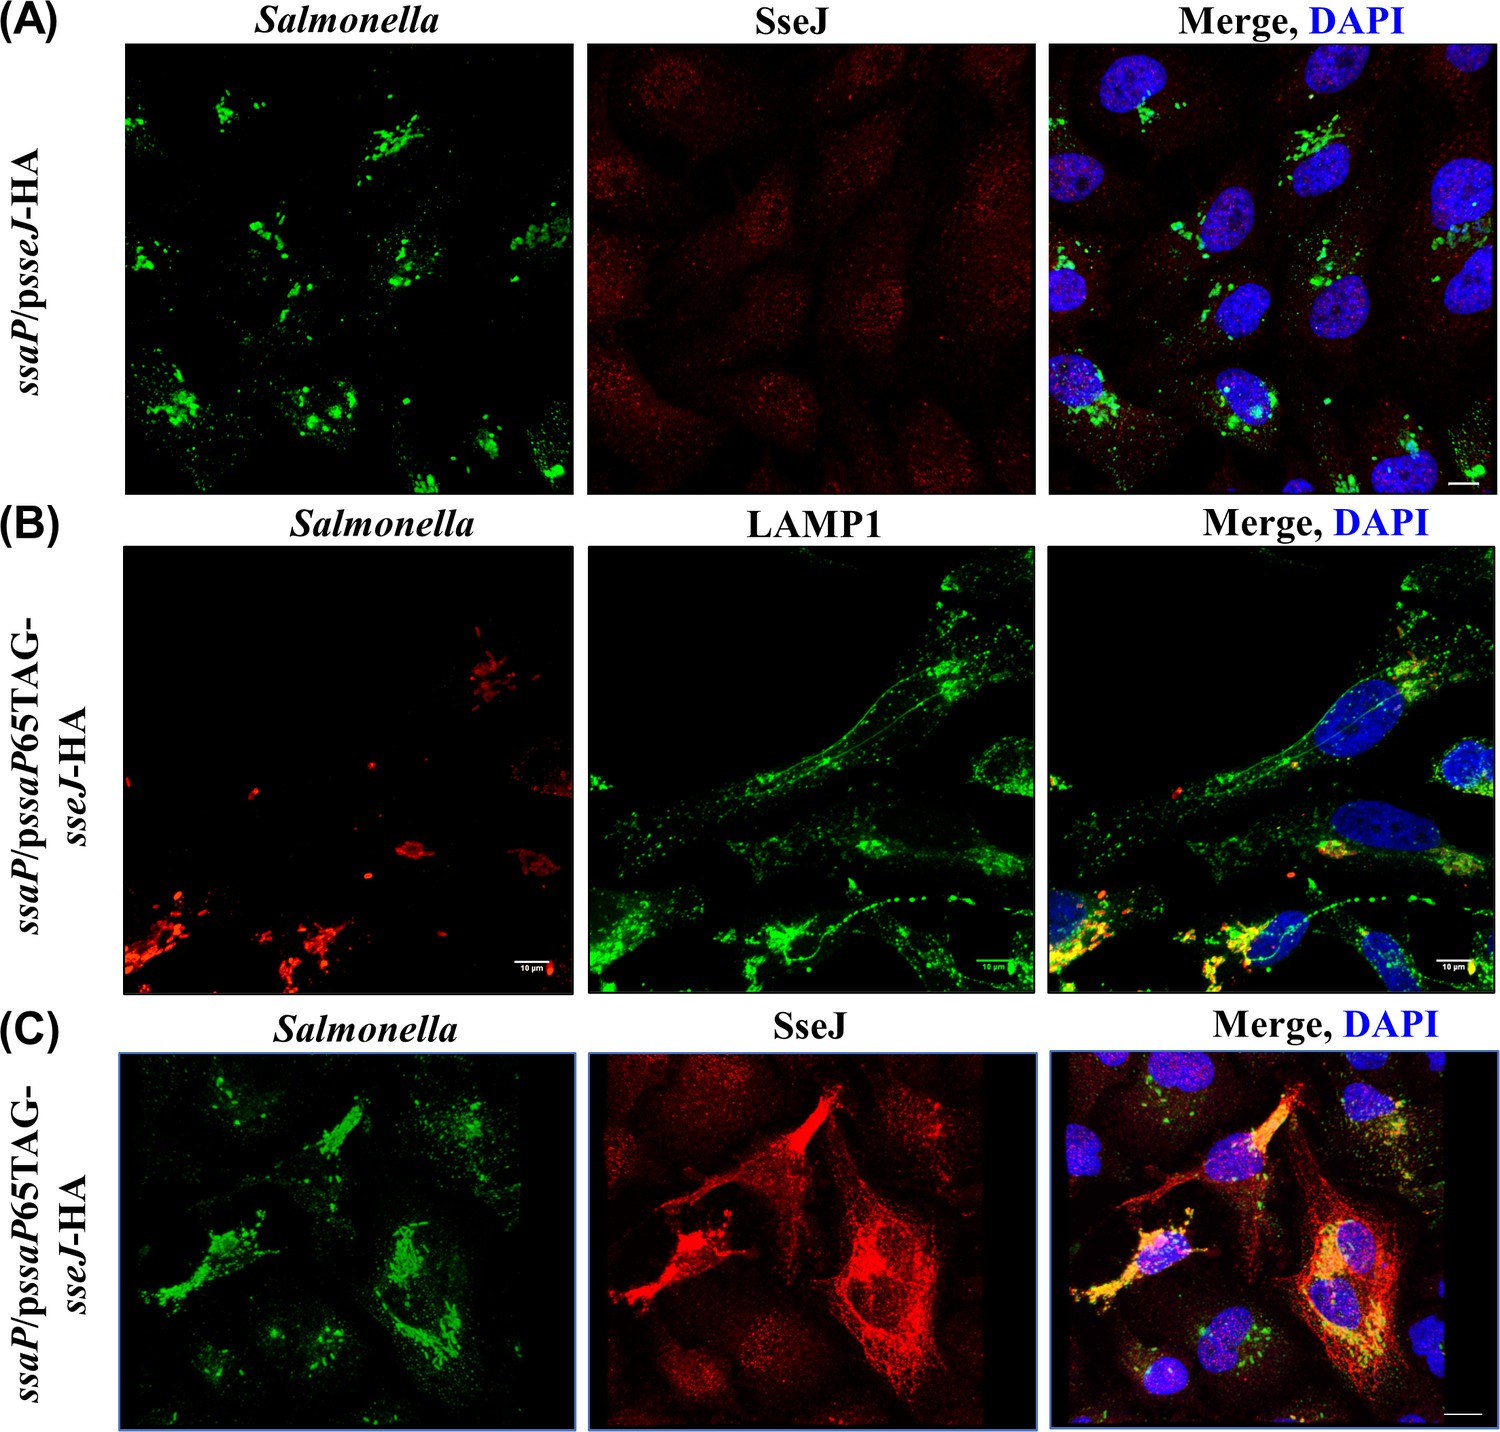
An ssaP null mutant is defective in SPI-2 secretion.
(A) HeLa cells were infected with the ssaP null mutant for 16 hr, fixed and immuno-stained for LPS (green), SseJ (red) and DAPI (blue). In the absence of ssaP, SseJ is not secreted. (B) TCO*Lys-incorporated SsaP was functional. HeLa cells were infected with Salmonella complemented with pssaP65TAG-sseJ-HA, fixed and immunostained for LPS (red), LAMP1 (green) and DAPI (blue). SIF formation was observed in cells infected with Salmonella complemented with pssaP65TAG-sseJ-HA. (C) Engineered SsaP rescued SPI-2 secretion. HeLa cells were infected with Salmonella complemented with pssaP65TAG-sseJ-HA, fixed and immunostained for LPS (Green), SseJ (red), and DAPI (blue). SseJ (red) was secreted in the complemented strain, but not in the ssaP null strain (n = >10, independent experiments). Scale bar, 10 µm.
Figure 5—figure supplement 2
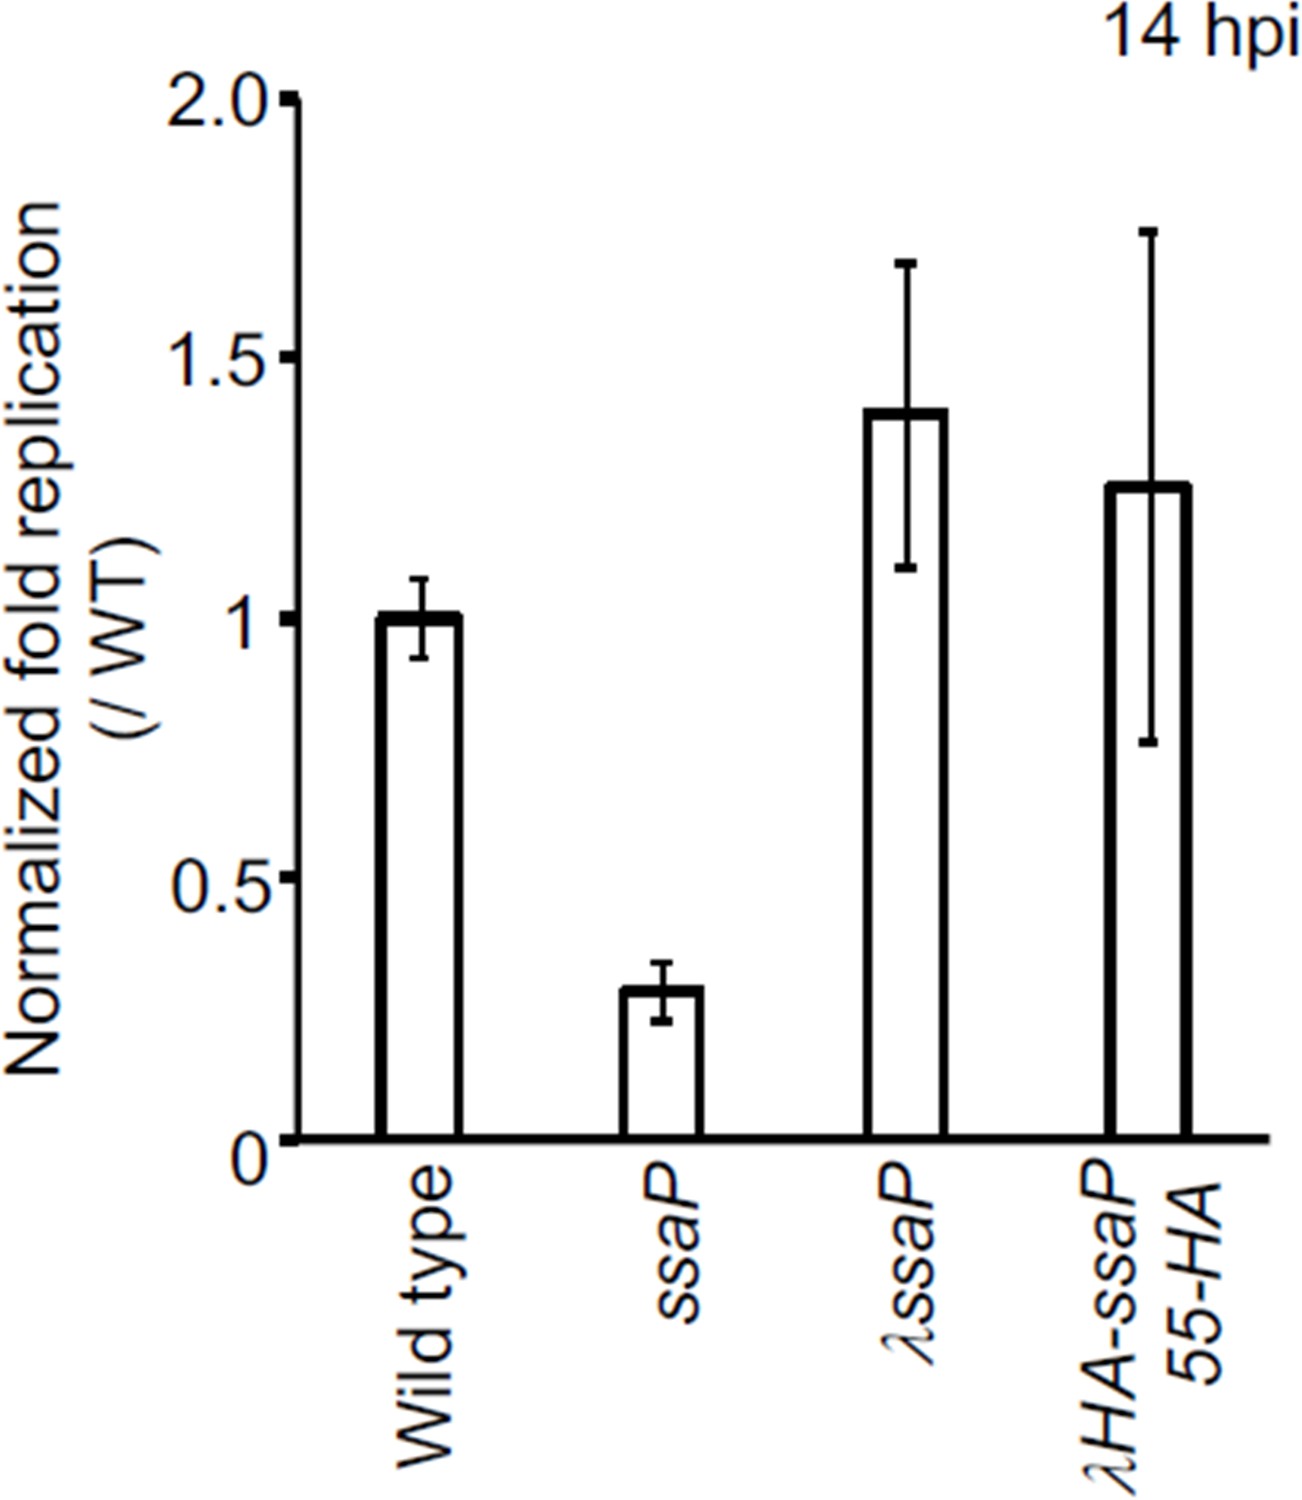
Survival of S. Typhimurium SsaP-55HA mutant in HeLa cells.
Strains of Salmonella wild-type, ssaP null, ssaP/λssaP (complemented with ssaP integrated a λatt), and ssaP/ λssaP-55HA (ssaP with an HA tag at amino acid 55) were grown in LB to late exponential phase and added to HeLa cells at an MOI of 100:1 for 30 min. At 2 hr and 14 hr, cells were lysed and the intracellular bacteria were enumerated. The normalized fold changes were relative to those of the wildtype (set to 1). The error bars represent the mean ± standard deviation (n = 3).
Figure 5—figure supplement 3
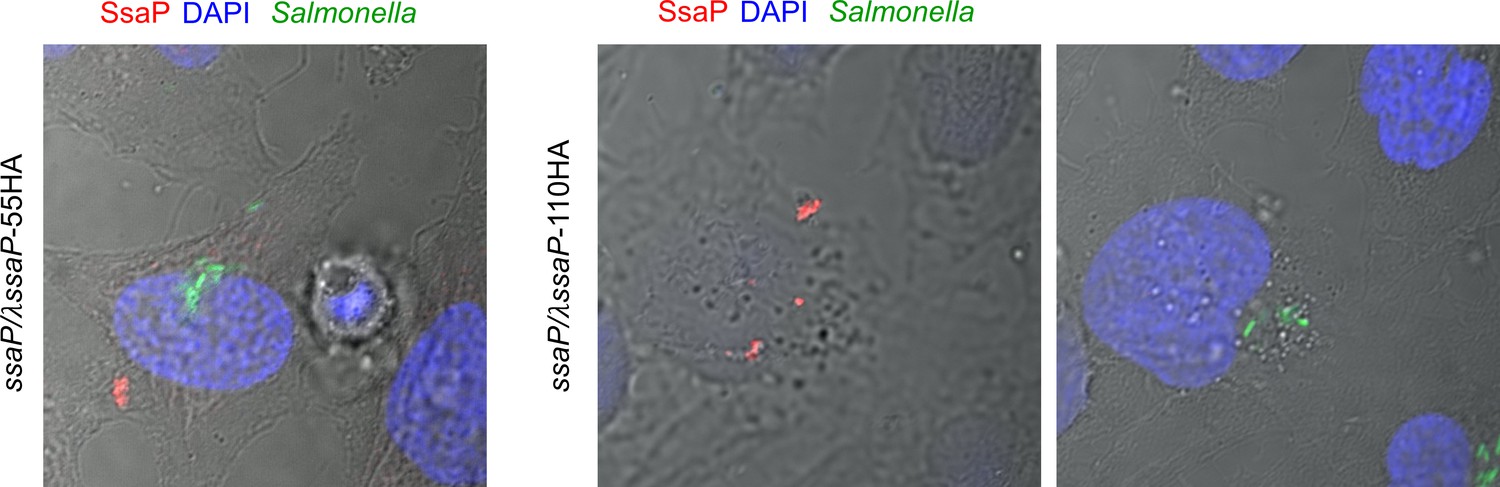
SsaP is secreted.
Strains of Salmonella containing ssaP/λssaP-55HA (left) ssaP/λssaP-110HA (middle and right) were grown in LB to late exponential phase and added to HeLa cells at an MOI of 100:1 for 30 min. The cells were fixed and immuno-stained for SsaP (red). A representative image at 14 hr post infection is shown. DAPI-stained DNA is in blue and GFP-expressing Salmonella are shown in green. The middle and right panels are of SsaP at different z positions.
Figure 5—figure supplement 4
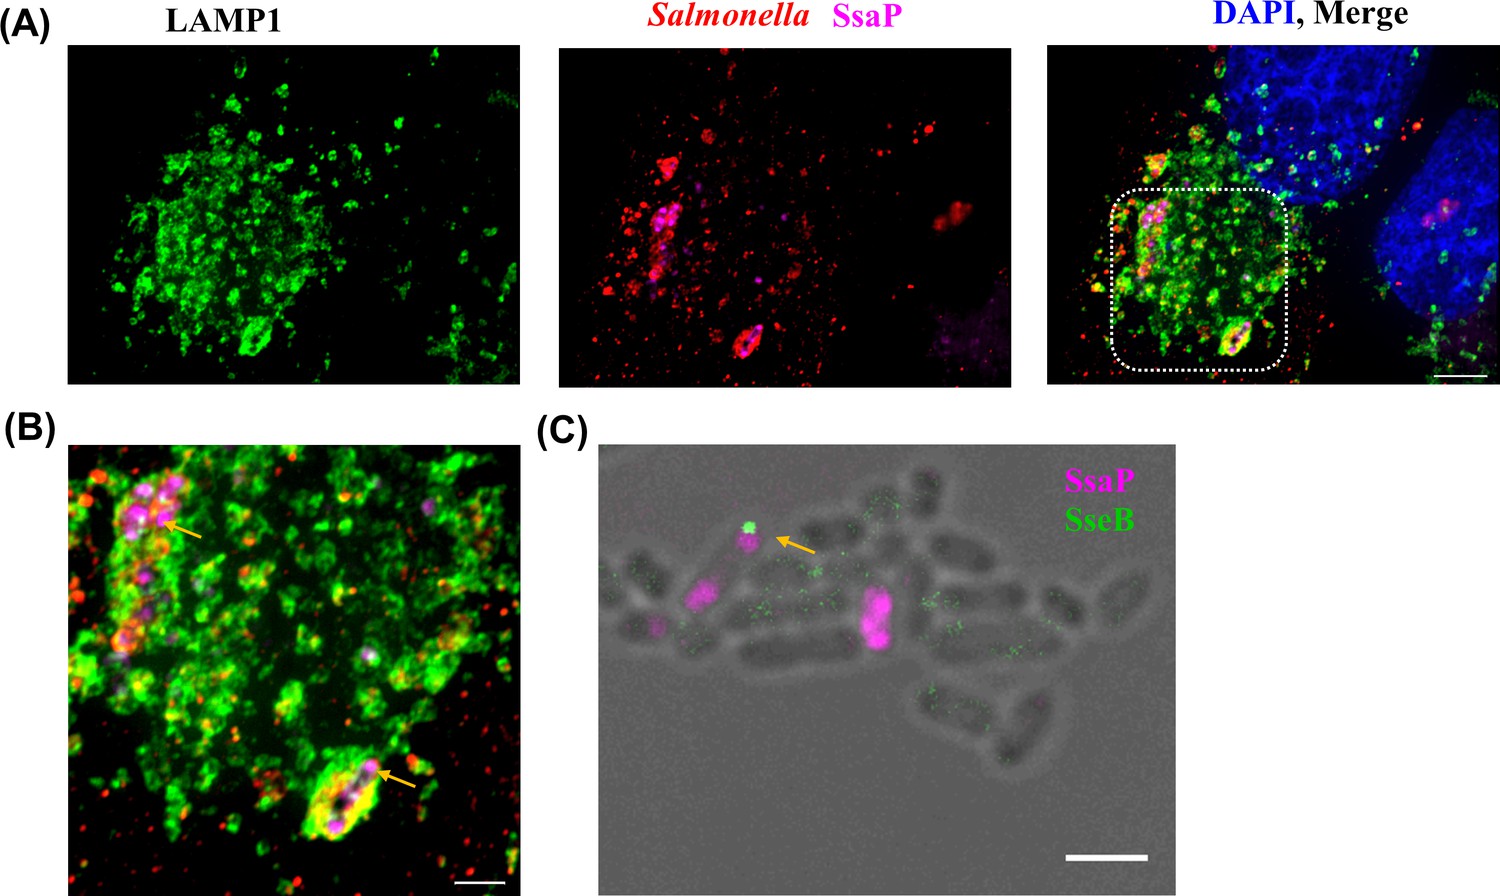
SsaP was associated with bacteria and mostly localized to the poles during early infection times.
(A) HeLa cells were infected with an ssaP null mutant of Salmonella expressing SsaP-YTCO*Lys in the presence of TCO*Lys. After 6 hr post infection, HeLa cells were incubated with 1.5 μM SiR-Tz in DMEM with 10% FBS for another 1 hr, followed by extenstive washing of excess dye with fresh growth media. At 8 hr post-infection, cells were fixed and immunostained for the endosomal membrane marker LAMP1 (green, left panel), LPS (red) and DAPI (blue). Scale bar, 5 µm. (B) Zoomed view of inset. Yellow arrow indicates polarly localized SsaP. Images were acquired on a spinning-disk SIM, as described in Materials and methods. Scale bar, 2 µm. (C) Not every pole where SsaP was located had an injectisome. Salmonella cells expressing SsaP-Y65TCO in the presence of TCO*Lys were labeled with SiR-Tz as described in Materials and methods. The same cells were immuno-stained for SseB using rabbit anti-SseB antibody (green) and imaged along with SiR fluorescence (magenta). The arrows indicate cells that have both SsaP and SseB. The data are representative of at least three independent experiments. Scale bar, 2 µm.
Figure 5—figure supplement 5
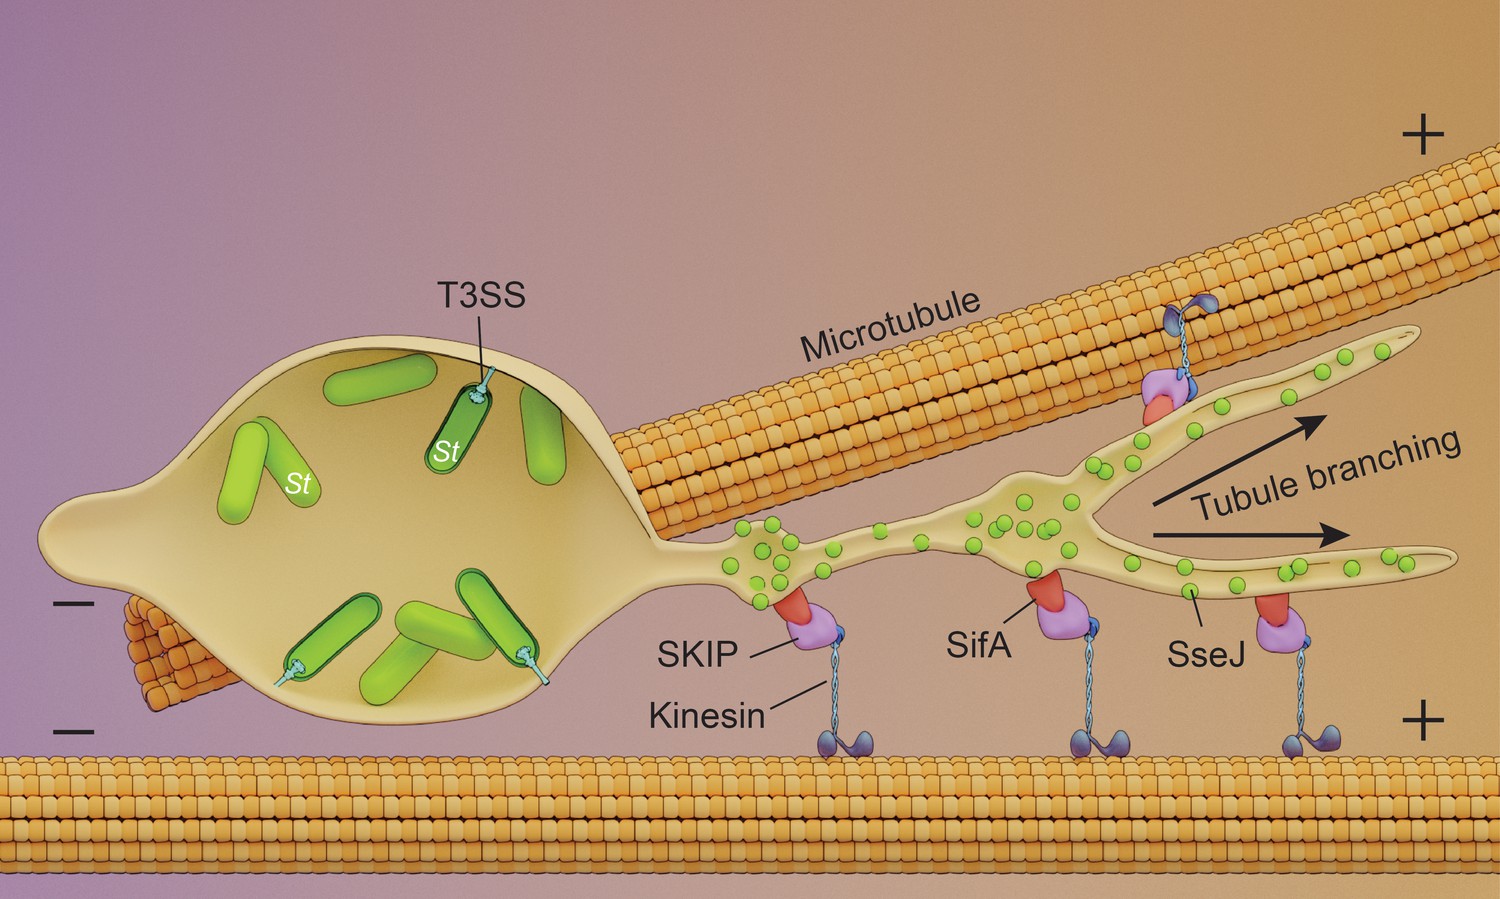
Schematic of endosomal tubule (SIF) formation.
Upon entry into the host, Salmonella resides within an acidic vacuole. The histidine kinase EnvZ senses the acid pH of the Salmonella cytoplasm (Park et al., 2017) and drives OmpR-dependent up-regulation of the SsrA/B two-component system upon acidification. SPI-2 T3SS secreted effectors SseJ and SifA are present on the outer surface of the tubules and are co-localized with the motor protein kinesin. SseJ is indirectly force-dependent, whereas SifA is not.
Additional files
-
Supplementary file 1
Supplemental file for Figure 4: Live cell imaging of secreted SifA labelled with BDP-DBCO dye during HeLa cell infection.
- https://cdn.elifesciences.org/articles/67789/elife-67789-supp1-v3.zip
-
Transparent reporting form
- https://cdn.elifesciences.org/articles/67789/elife-67789-transrepform-v3.docx
Download links
A two-part list of links to download the article, or parts of the article, in various formats.
Downloads (link to download the article as PDF)
Open citations (links to open the citations from this article in various online reference manager services)
Cite this article (links to download the citations from this article in formats compatible with various reference manager tools)
Genetic code expansion enables visualization of Salmonella type three secretion system components and secreted effectors
eLife 10:e67789.
https://doi.org/10.7554/eLife.67789


