Multiple introductions of multidrug-resistant typhoid associated with acute infection and asymptomatic carriage, Kenya
- Centre for Microbiology Research, Kenya Medical Research Institute, Kenya
- Wellcome Sanger Institute, Wellcome Genome Campus, United Kingdom
- Cambridge Institute of Therapeutic Immunology & Infectious Disease (CITIID), Department of Medicine, University of Cambridge, United Kingdom
- London School of Hygiene & Tropical Medicine, United Kingdom
- Department of Infectious Diseases, Central Clinical School, Monash University, Australia
- Department of Microbiology and Immunology, The University of Melbourne at The Peter Doherty Institute for Infection and Immunity, Australia
- Department of International Health, John’s Hopkins University, United States
- International Diarrheal Diseases Research Centre, Bangladesh
Figures
Figure 1
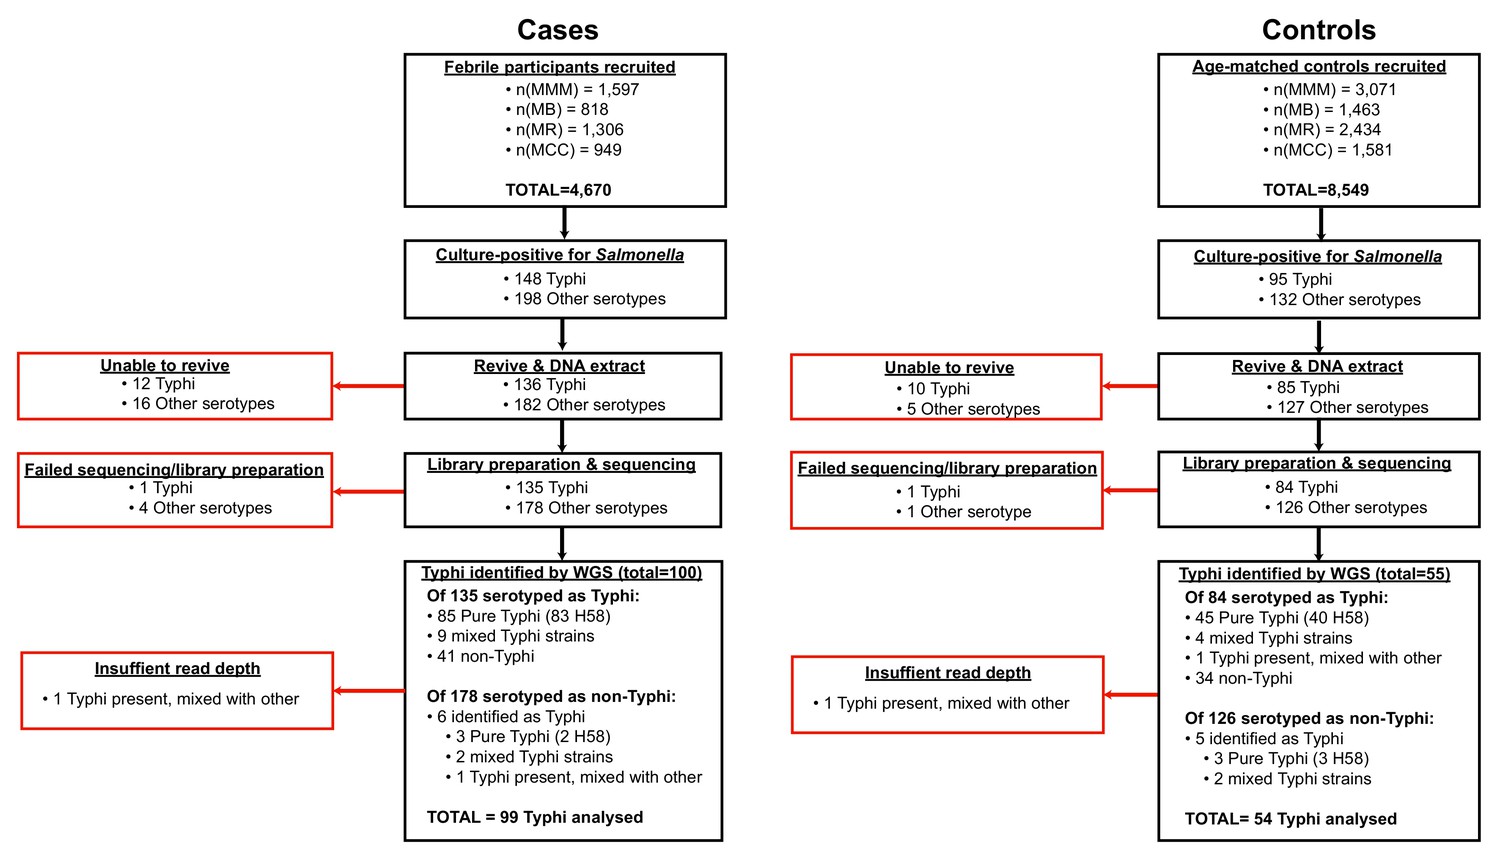
Flow chart of samples collected and analysed.
Red boxes indicate bacterial isolates that could not be included in downstream genetic analyses, grouped by reason for exclusion.
Figure 2 with 1 supplement

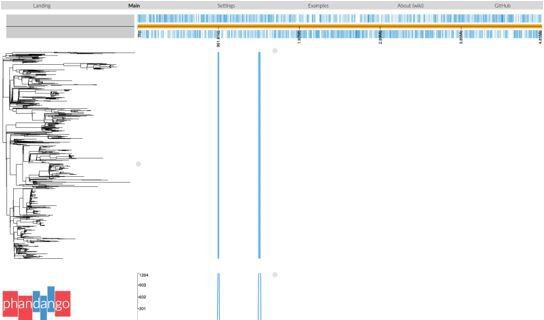
Global population structure of H58 (4.3.1) S.Typhi showing Kenyan isolates cluster into three East African clades.
Whole genome phylogeny of 1,204 H58 isolates, including all available Kenyan genomes (n = 128 from this study, n=111 from prior studies) and globally distributed genomes for context (n=965, see Methods). Branch lengths are in substitutions per core-genome site, branches are coloured to indicate geographical origin (see inset legend), shaded boxes highlight the three East African H58 clades defined in this study. Colour bars to the right indicate (as per inset legend): 1, Kenyan strains isolated and sequenced during this study; 2, geographical location; 3, mutation(s) in the quinolone resistance determining region (QRDR) of genes gyrA, gyrB, and parC; 4, presence of multidrug resistance (MDR) IncHI1 plasmid; 5, presence of MDR genes; 6, H58 lineage. Interactive version available at https://microreactorg/project/wViqmaRdZuFVEb6yk4i1jU.
Figure 2—figure supplement 1

S. Typhi IncHI1 PST6 plasmid minimum spanning tree.
Nodes indicate unique IncHI1 PST6 haplotypes observed among n=534 PST6 plasmid sequences. Nodes are pie charts sized by the number of sequences among which the different plasmid haplotypes were observed and are coloured by the genotype(s) of the host S. Typhi sequences carrying the plasmid haplotype.
Figure 3 with 1 supplement
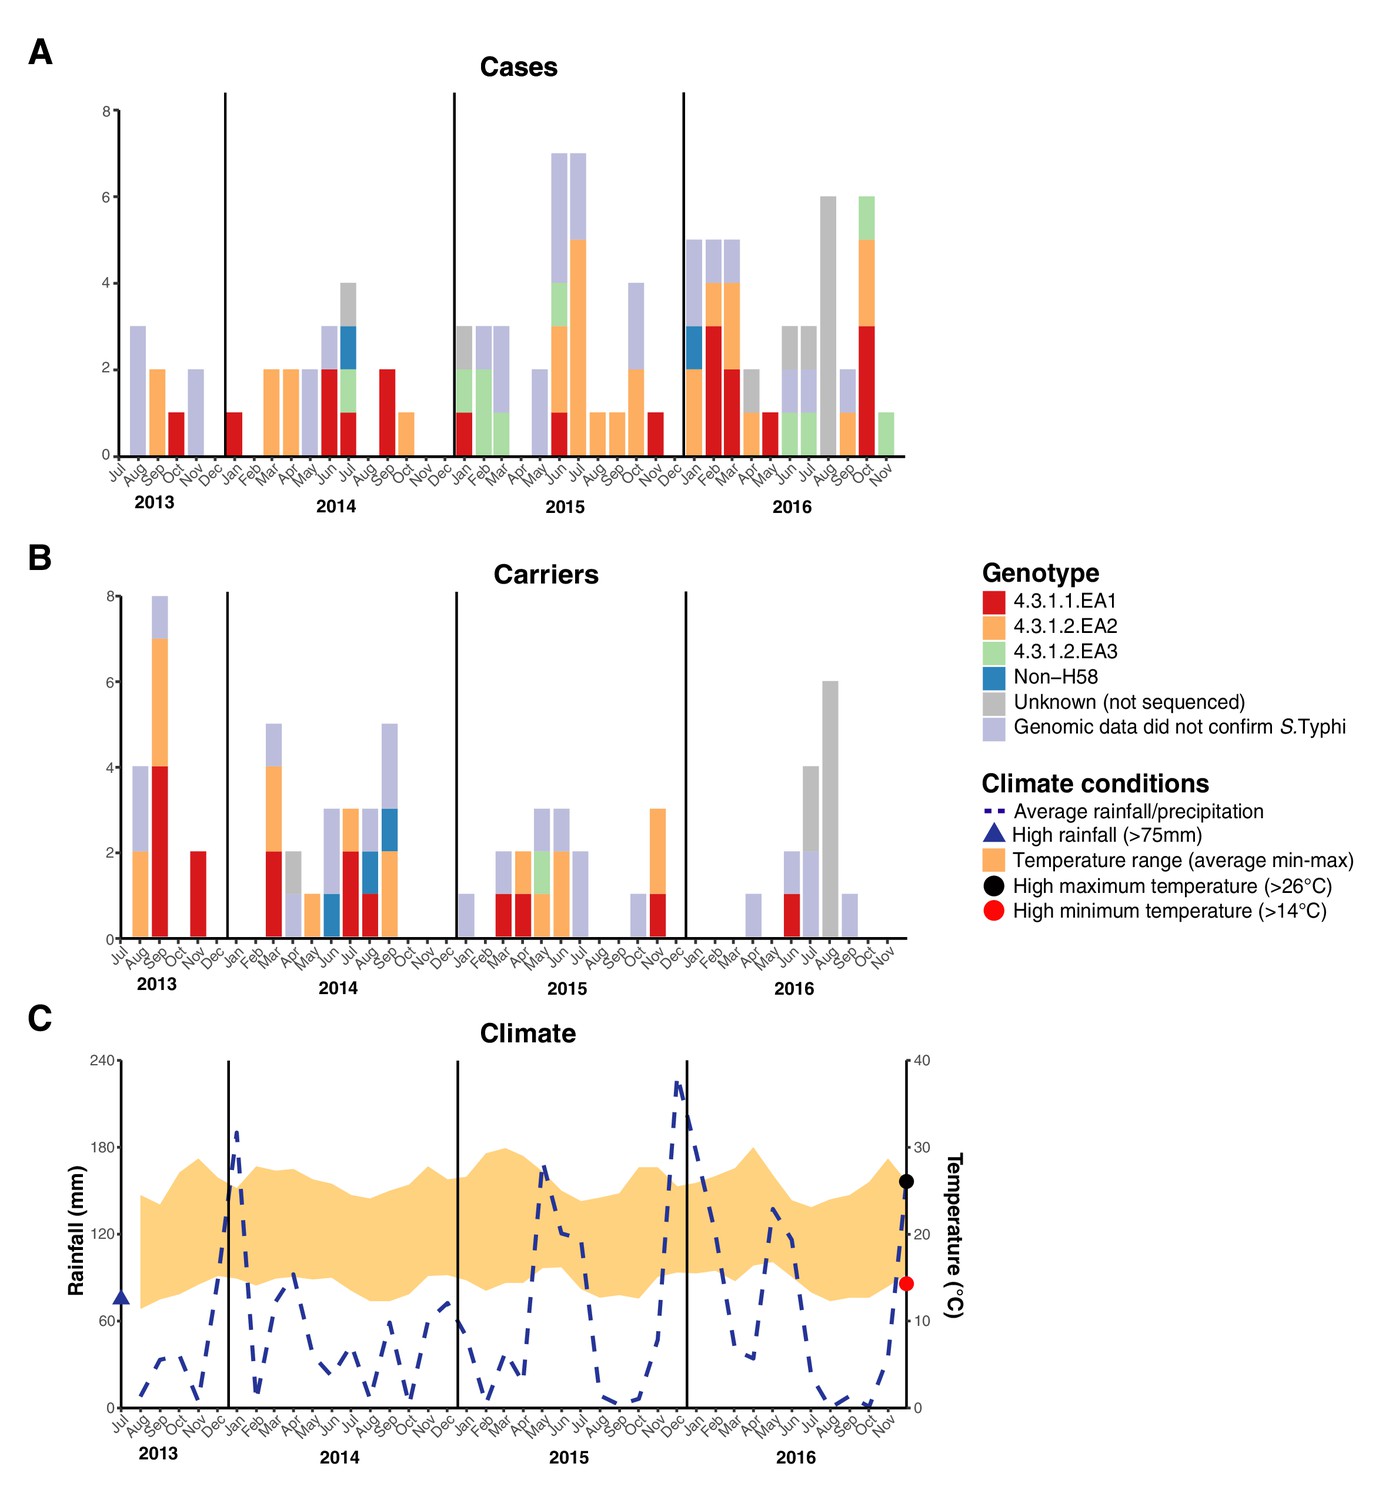
Epidemic curve of all S. Typhi cases and controls per month inside the DSS.
(A) Monthly distribution of S. Typhi genotypes from cases. (B) Monthly distribution of S. Typhi genotypes from carriers. Note that the counts include all participants who were culture-positive for S. Typhi and also those who were culture-positive for other Salmonella but identified later by WGS as S. Typhi. (C) Weather conditions throughout the study period. Blue dashed line indicates precipitation level per month (rainfall), shaded orange polygon indicates the temperature range, red circle indicates threshold for high minimum temperature for statistical testing, black circle indicates threshold for high maximum temperature for statistical testing, blue triangle indicates threshold for high rainfall for statistical testing.
Figure 3—figure supplement 1
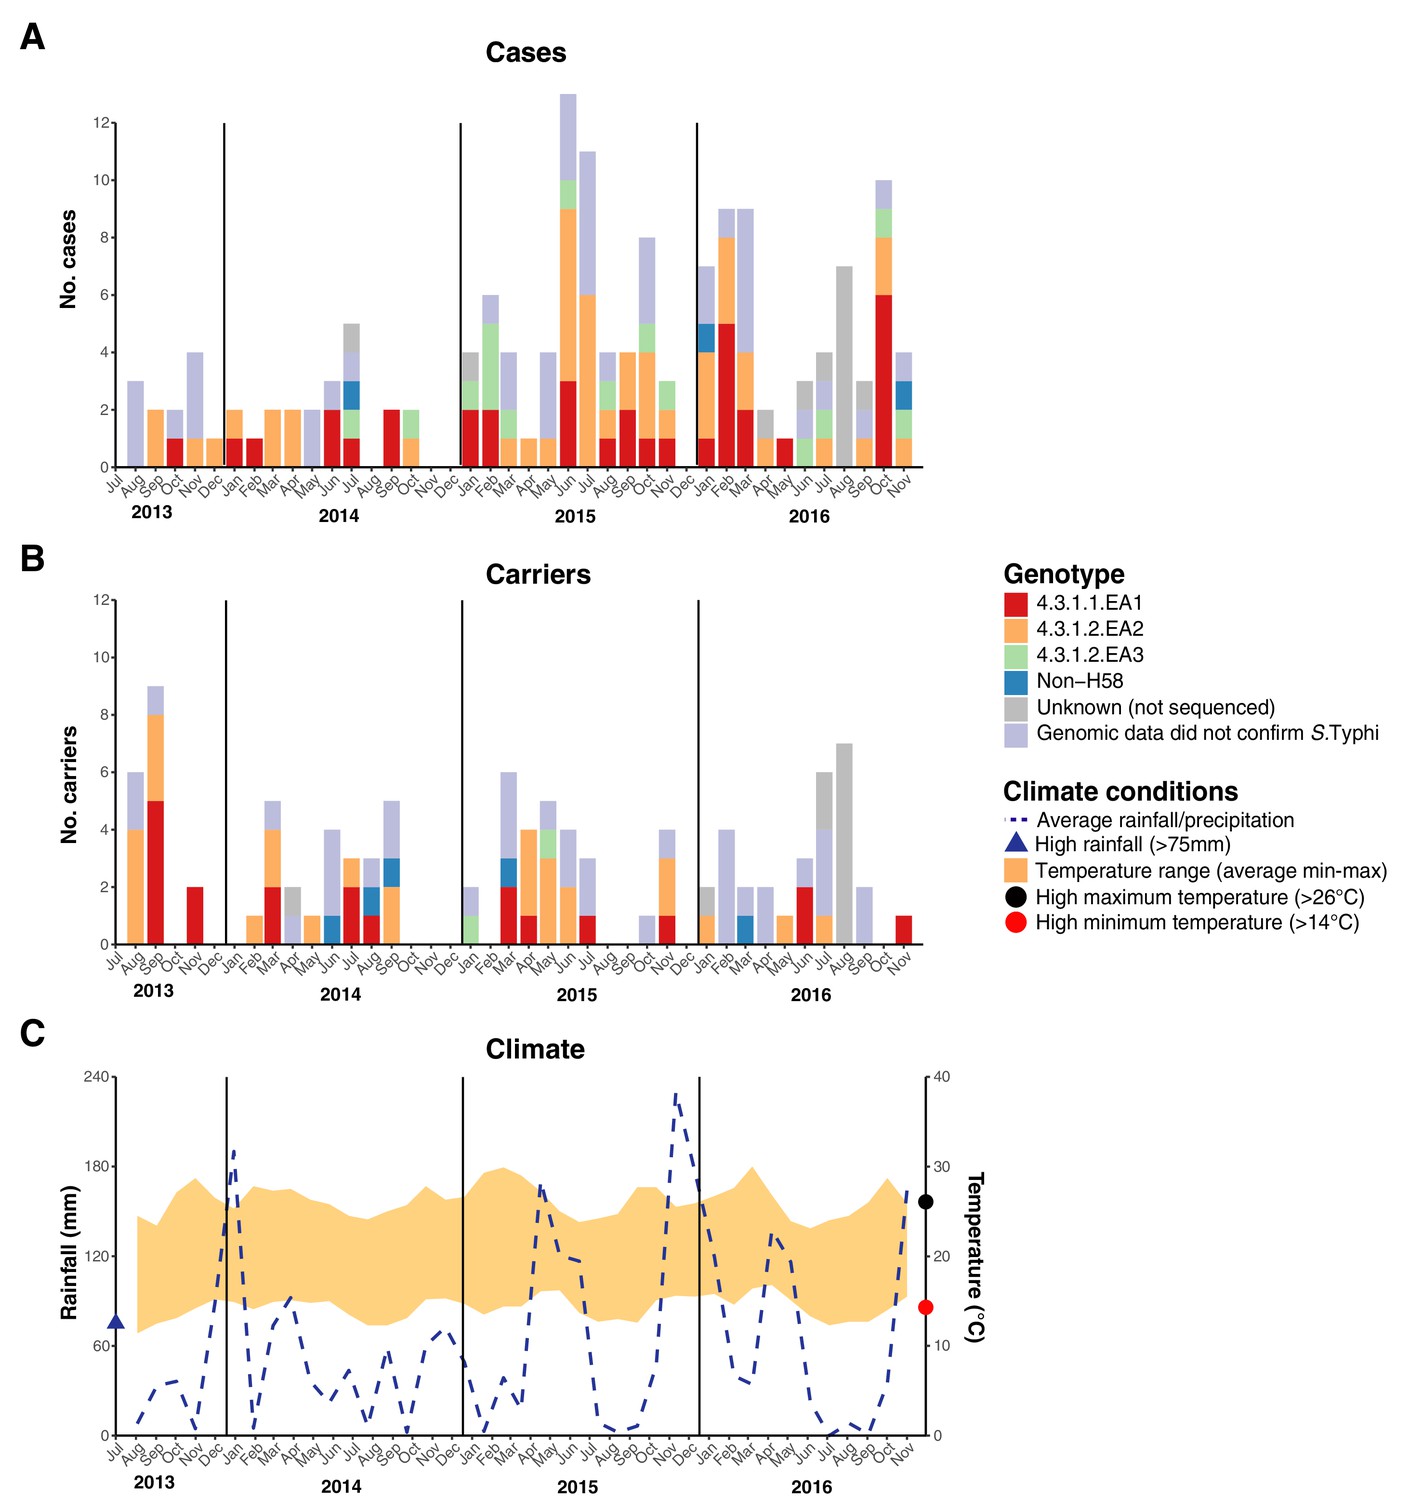
Epidemic curve of all S.Typhi cases and controls per month.
(A) Monthly distribution of S. Typhi genotypes from cases. (B) Monthly distribution of S. Typhi genotypes from carriers. Note that the counts include all participants who were culture-positive for S. Typhi and also those who were culture-positive for other Salmonella but identified later by WGS as S. Typhi. Genotypes are indicated by colour as per inset legend. (C) Weather conditions throughout the study period. Blue dashed line indicates precipitation level per month (rainfall), shaded orange polygon indicates the temperature range, red circle indicates threshold for high minimum temperature for statistical testing, black circle indicates threshold for high maximum temperature for statistical testing, blue triangle indicates threshold for high rainfall for statistical testing.
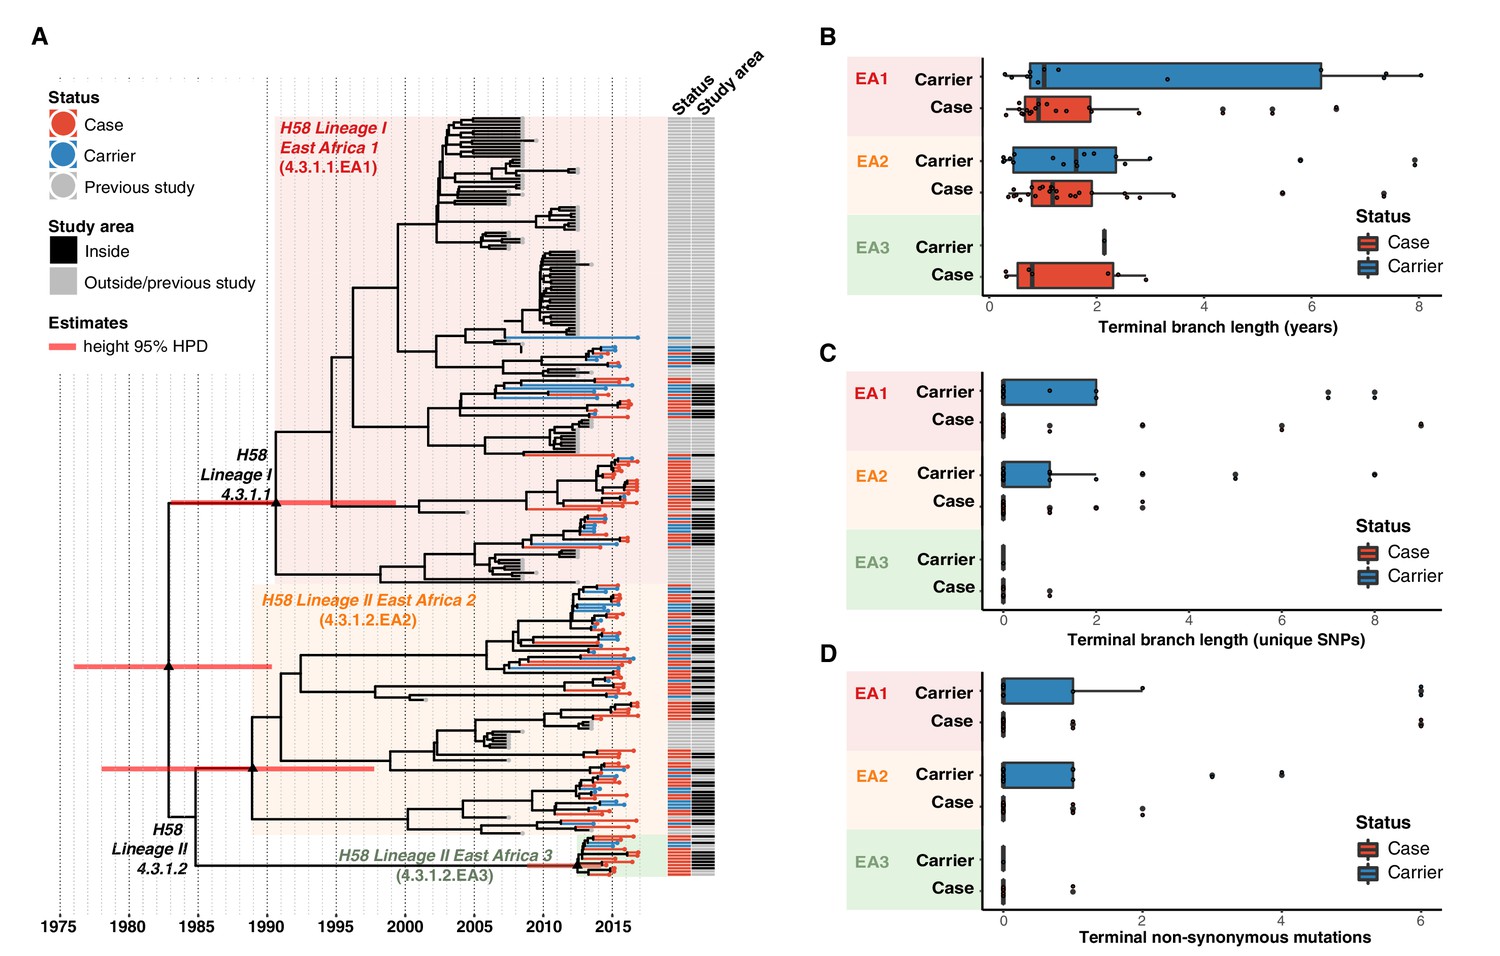
Figure 4 with 3 supplements
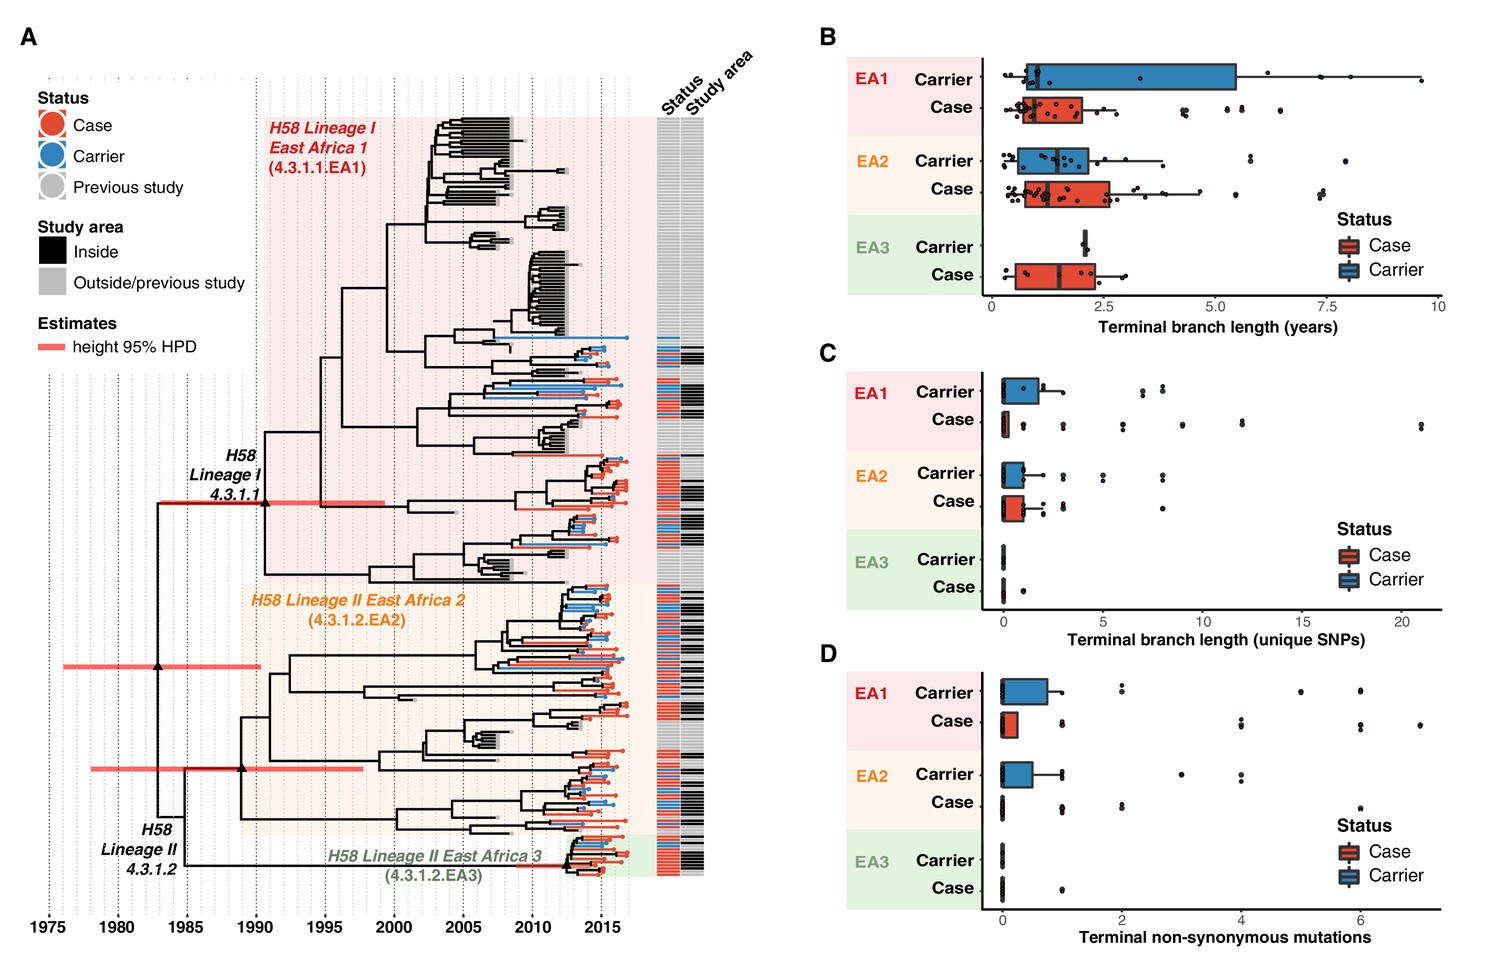
Temporal distribution of genotypes and among all cases and carriers.
(A) Dated maximum-clade credibility phylogenetic tree of Kenyan S. Typhi genotype 4.3.1 (H58), including 128 isolated from this study. Tip colours & first colour bar indicate symptom status, second colour bar indicates those isolates from children living in the defined survey area. Black triangles demarcate nodes of interest, and the accompanying bars indicate 95% HPD of node heights. Interactive phylogeny available at https://microreactorg/project/I2KUoasUB. (B) Distribution of terminal branch lengths for all sequences, extracted from the Bayesian tree shown in (A). (C) Distribution of isolate-specific SNPs detected in sequences from all cases and controls. (D) Distribution of terminal non-synonymous mutations detected in sequences from all cases and controls. In the boxplots in panels B, C, and D, black bars indicate median values, boxes indicate interquartile range. Cases and carrier samples indicated as per the inset legend.
Figure 4—figure supplement 1
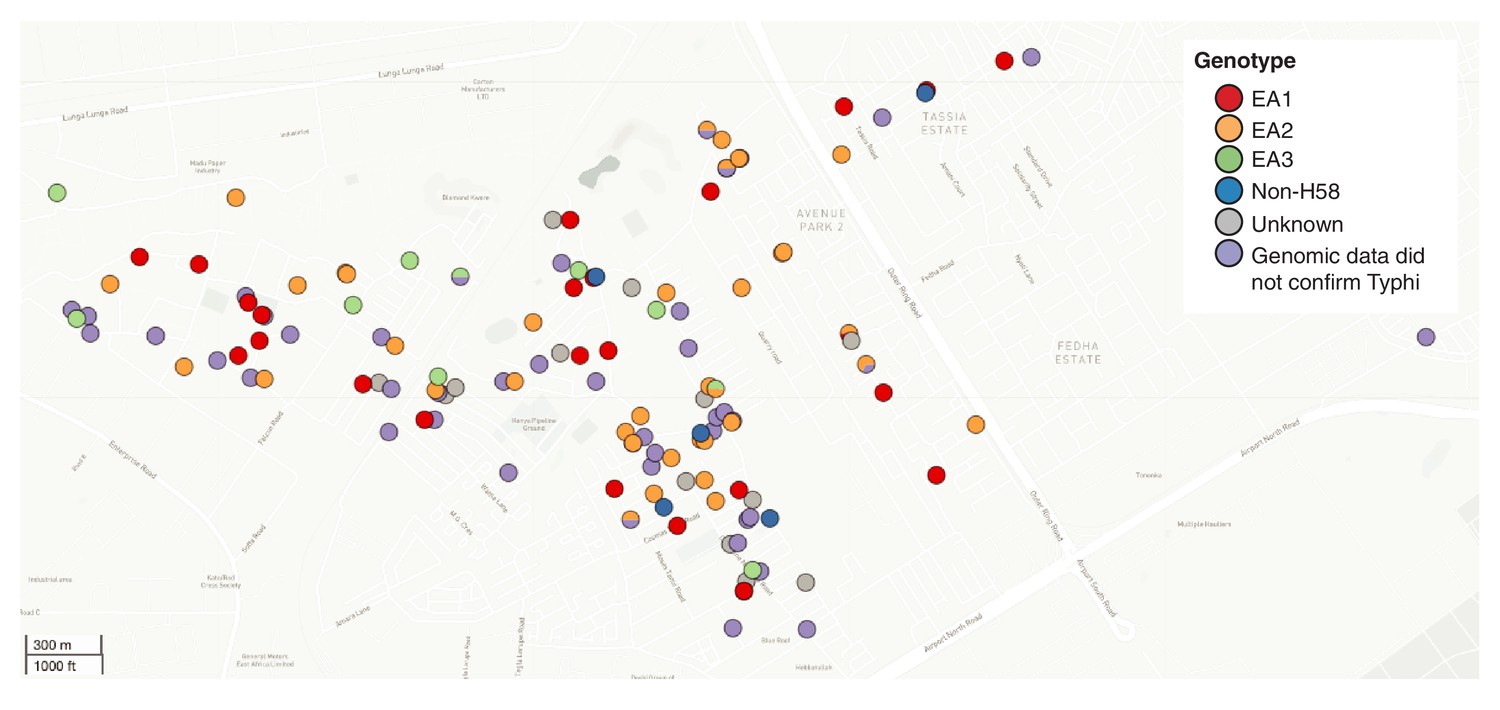
Spatial distribution of S. Typhi genotypes throughout the informal settlement.
Each individual point represents an individual S. Typhi isolate obtained from the informal settlement which are coloured by genotype as per the inset legend.
Figure 4—figure supplement 2
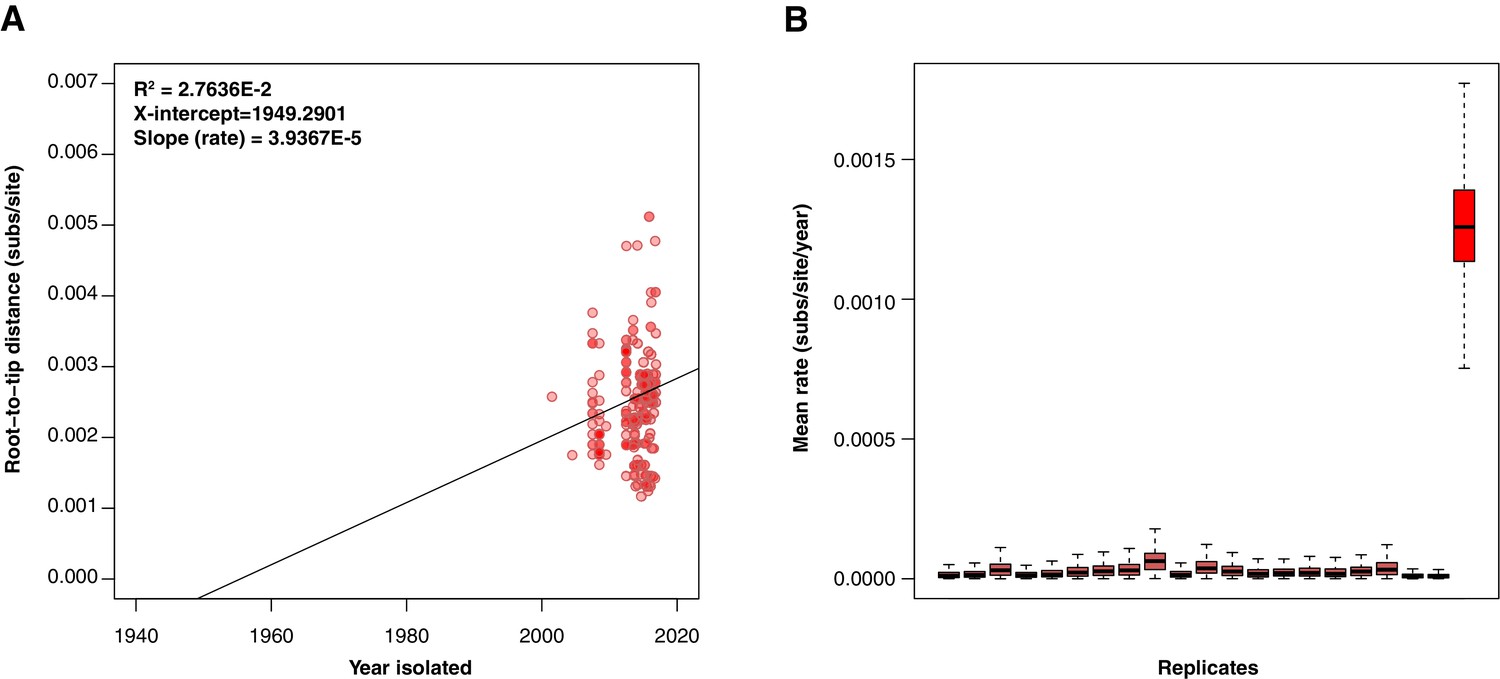
Tempest regressions & BEAST date randomisation testing.
(A) Kenyan H58 S. Typhi tempest regression of root-to-tip distance as a function of sampling time, with the root of the tree selected using heuristic residual mean squared (each point represents a tip of the maximum likelihood tree). The slope is a crude estimate of the substitution rate for the SNP alignment, the x-intercept corresponds to the age of the root node, and the R2 is a measure of clocklike behaviour (B) Kenyan H58 S. Typhi date randomisation test with the right most box plot showing the posterior substitution rate estimate from the SNP alignment of the data with the correct sampling times, and the remaining 20 boxplots showing the posterior distributions of the rate from replicate runs using randomised dates. The data are considered to have strong temporal signal if the estimate with the correct sampling times does not overlap with those from the randomisations.
Figure 4—figure supplement 3
Temporal and age distribution of genotypes among cases and controls inside the survey site.
(A) Dated maximum-clade credibility phylogenetic tree of Kenyan S. Typhi genotype 4.3.1 (H58), including 128 isolated from this study. Tip colours and first colour bar indicate symptom status, second colour bar indicates those isolates from children living in the defined survey area. Black triangles demarcate nodes of interest, and the accompanying bars indicate 95% HPD of node heights. Interactive phylogeny available at https://microreactorg/project/I2KUoasUB. (B) Distribution of terminal branch lengths for sequences isolated from cases and controls within the survey area, extracted from the Bayesian tree shown in (A). (C) Distribution of isolate-specific SNPs detected in sequences from cases and controls resident the survey area. (D) Distribution of terminal non-synonymous mutations detected in sequences from cases and controls within the survey area. In the boxplots in panels B, C, and D, black bars indicate median values, boxes indicate interquartile range.
Figure 5
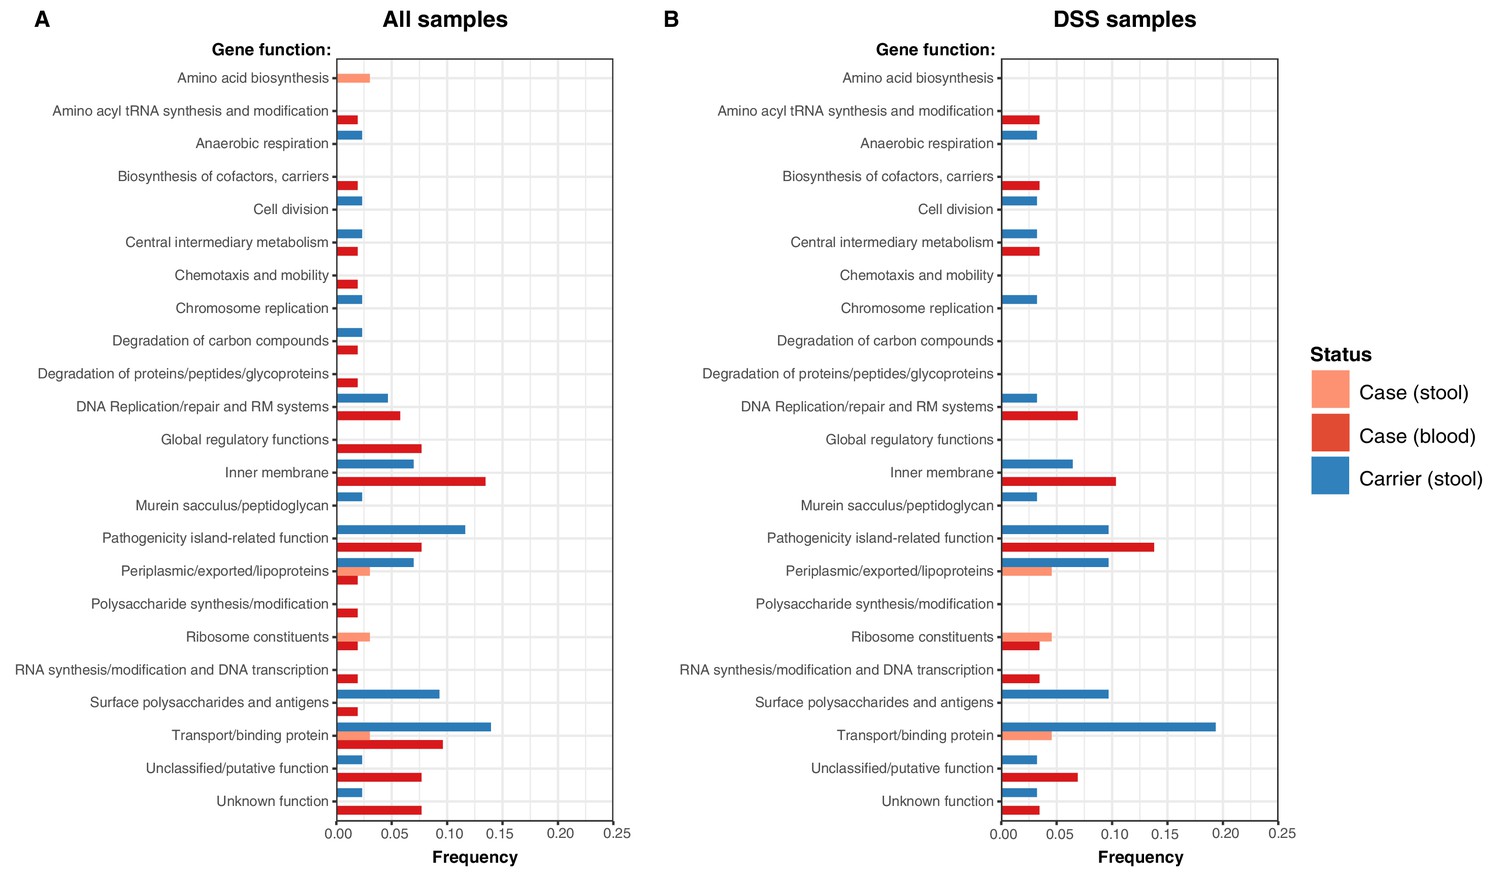
Frequency of terminal non-synonymous mutations in difference gene functional categories among cases and carriers.
(A) Frequency of terminal non-synonymous mutations in all sequences collected. (B) Frequency of terminal non-synonymous mutations in sequences from within the DSS area. Red bars indicate the frequency non-synonymous mutations found in acute case samples from blood, peach bars indicate non-synonymous mutations found in acute case samples from stool, and blue bars indicate the frequency of mutations found in carrier samples from stool.
Author response image 1
Tables
Key resources table
| Reagent type (species) or resource | Designation | Source or reference | Identifiers | Additional information |
|---|---|---|---|---|
| gene (Salmonella enterica serotype Typhi – S. Typhi) | Wild type | This study | PRJEB19289 | ENA sequence accession bank |
| Strain, strain background (S. Typhi)Wild type | Wild type | This study | Supplementary file 1 | |
| Strain, strain background (Escherichia coli) | ATCC | ATCC25922 | https://www.atcc.org/ › products › 25,922 | |
| Sequence-based reagent | Primer vi-F | This paper | PCR primers | GTTATTCAGC ATAAGGAG |
| Sequence-based reagent | Primer Vi-R | This paper | PCR Primers | CTTCCATACCA CTTTCCG |
| Sequence-based reagent | Primer prt-F | This paper | PCR Primers | CTTGCTATGGA AGACATAACGAACC |
| Sequence-based reagent | Primer prt-R | This paper | PCR Primers | CGTCTCCATCA AAAGCTCCATAGA |
| Commercial assay or kit | Bactec Media | Becton-Dickinson | BACTEC 9050 Blood Culture System | Blood culture media |
| Commercial assay or kit | Selenite F/MacConkey | Oxoid Ltd http://www.oxoid.com | CM0395/ CM0007 | Selective enrichment/ selective media |
| Commercial assay or kit | Salmonella-Shigella agar | Oxoid Ltd http://www.oxoid.com | CM0099 | Selective agar |
| Commercial assay or kit | Salmonella antisera | Murex Diagnostics, Dartford, UK https://www.dnb.com | Salmonella typing antisera | |
| Commercial assay or kit | Wizard Genomic DNA Extraction Kit | https://worldwide.promega.com | Whole Genome DNA extraction | Cat#A1120 |
| Chemical compound, drug | Antimicrobial susceptibility test discs in cartridges | Oxoid Ltd http://www.oxoid.com | Assorted antimicrobial discs for susceptibility testing | |
| Software, algorithm | Kraken | Genome Biol 2014; 15: R46–12. | ultrafast metagenomic sequence classification using exact alignment | |
| Software, algorithm | Multi-locus sequence typing (MLST) | Genome Med 2014; 6: 90. | Rapid genomic surveillance for public health and hospital microbiology labs. | |
| Software, algorithm | BIGSdb software | BMC Bioinformatics 2010; 11: 595. | Scalable analysis of bacterial genome variation at the population level. | Genomic analysis software |
| Software, algorithm | Pathogen-watch for AMR prediction. | Nat Commun 2021; 12: 2879–12. | AMR prediction software analysis | |
| Software, algorithm | Maximum Likelihood Analytical Tool | Bioinformatics 2014; 30: 1312–3. | RAxML (v8.2.9) version 8 | A tool for phylogenetic analysis and post- analysis of large phylogenies |
| Software, algorithm | MicroReact Tool | (https://microreact.org/project/wViqmaRdZuFVEb6yk4i1jU) | Interactive global H58 phylogeny | |
| Software, algorithm | Bandage assay | Bioinformatics 2015; 31: 3350–2. | Interactive visualisation of de novo genome assemblies. | |
| Software, algorithm | ISMapper | BMC Genomics 2015; 16: 667. | Genomics tool for phylogenetics |
Table 1
Culture-positive typhoid cases and asymptomatic carriers.
Note the values reported for logistic regressions are from multivariate models including all indicated covariates, fit separately for cases and controls.
| Participants tested, N | 4,670 | 8,549 |
|---|---|---|
| Male, N (%) | 2,497 (53.5%) | 4,260 (49.8%) |
| Female, N (%) | 2,173 (46.5%) | 4,289 (50.2%) |
| S. Typhi culture positive, N (%) | 148 (3.2%) | 95 (1.1%) |
| Male, N (%) | 99 (4.0%) | 49 (1.15%) |
| Female, N (%) | 49 (2.3%) | 46 (1.1%) |
| WGS confirmed S. Typhi, N (%) | 100 (2.1%) | 55 (0.64%) |
| Logistic regression for S. Typhi culture positive | ||
| Year of isolation, OR (p-value) | 1.19 (0.072) | 0.94 (0.586) |
| Male Sex, OR (p-value) | 1.81 (0.0008*) | 1.08 (0.699) |
| Age in years, OR (p-value) | 1.08 (0.0005*) | 1.02 (0.403) |
| Logistic regression for S. Typhi culture positive, males only | ||
| Year of isolation, OR (p-value) | 1.19 (0.147) | 1.09 (0.576) |
| Age in years, OR (p-value) | 1.11 (0.0001*) | 1.06 (0.082) |
| Logistic regression for S. Typhi culture positive, females only | ||
| Year of isolation, OR (p-value) | 1.19 (0.296) | 0.81 (0.158) |
| Age in years, OR (p-value) | 1.03 (0.551) | 0.98 (0.534) |
| Logistic regression for S. Typhi WGS positive | ||
| Year of isolation, OR (p-value) | 1.15 (0.209) | 0.59 (0.0003*) |
| Male Sex, OR (p-value) | 1.59 (0.028*) | 0.93 (0.780) |
| Age in years, OR (p-value) | 1.11 (0.0001*) | 1.03 (0.326) |
| Logistic regression for S. Typhi WGS positive, males only | ||
| Year of isolation, OR (p-value) | 1.18 (0.261) | 0.74 (0.133) |
| Age in years, OR (p-value) | 1.15 (0.00002*) | 1.07 (0.131) |
| Logistic regression for S. Typhi WGS positive, females only | ||
| Year of isolation, OR (p-value) | 1.12 (0.558) | 0.48 (0.0003*) |
| Age in years, OR (p-value) | 1.03 (0.518) | 1.0 (0.92) |
Table 2
Genotypes and AMR profiles for 153 sequenced S. Typhi isolates.
Percentages indicate genotype frequencies amongst cases or controls (first two columns); or frequency of antimicrobial resistance determinants amongst isolates of a given genotype (remaining columns). MDR, multi-drug resistant; L1, lineage I; L2, lineage II.
| Genotype | Cases | Controls | MDR | GyrA mutation | GyrB mutation | |||
|---|---|---|---|---|---|---|---|---|
| Plasmid | Chromosome | S83F | S83Y | D87G | S464F | |||
| All | 99 | 54 | 83 | 33 | 3 | 17 | 2 | 75 |
| 2.2.2 | 0 | 1 (1.9%) | 0 | 0 | 0 | 0 | 0 | 0 |
| 2.5.0 | 1 (1.0%) | 2 (3.7%) | 0 | 0 | 0 | 0 | 0 | 0 |
| 3.0.0 | 2 (2.0%) | 1 (1.9%) | 0 | 0 | 0 | 0 | 0 | 0 |
| 4.1.1 | 0 | 1 (1.9%) | 0 | 0 | 0 | 0 | 0 | 0 |
| 4.3.1 (H58) | 96 (97%) | 49 (91%) | 83 (57%) | 33 (23%) | 4(2.8%) | 19(13%) | 2(1.4%) | 75(51.7%) |
| H58 subgroups | ||||||||
| EA1 (L1) | 35 (35%) | 20 (37%) | 29 (53%) | 17 (31%) | 4(7.3%) | 2(3.6%) | 2(3.6%) | 2(3.6%) |
| EA2 (L2) | 46 (46%) | 27 (50%) | 54 (74%) | 0 | 0 | 0 | 0 | 73(100%) |
| EA3 (L2) | 15 (15%) | 2 (3.7%) | 0 | 16 (94%) | 0 | 17(100%) | 0 | 0 |
Table 3
Typhi genotypes associated with n = 153 cases and controls among different age groups.
| Age group | |||
|---|---|---|---|
| ≤ 1 year | 1–7 years | > 7 years | |
| WGS-confirmed cases | 7 | 66 | 26 |
| EA1 | 5 (71%) | 24 (36%) | 6 (23%) |
| EA2 | 1 (14%) | 34 (52%) | 11 (42%) |
| EA3 | 0 | 8 (12%) | 7 (27%) |
| non-H58 | 1 (14%) | 0 | 2 (78%) |
| Shannon diversity | 0.80 | 0.97 | 1.25 |
| WGS-confirmed carriers | 4 | 30 | 20 |
| EA1 | 1 (25%) | 10 (33%) | 9 (45%) |
| EA2 | 3 (75%) | 16 (53%) | 8 (40%) |
| EA3 | 0 | 1 (3%) | 1 (5%) |
| non-H58 | 0 | 3 (10%) | 2 (10%) |
| Shannon diversity | 0.56 | 1.05 | 1.11 |
Table 4
Climatic predictors of elevated case and control counts inside the DSS.
Values in cells are odds ratios and p-values for Fisher’s exact test between high case or control count ( > 2 per month) and high rainfall/temperature. * highlights p-values < 0.05.
| Typhoid cases | ||||||
|---|---|---|---|---|---|---|
| Month | Same month | Previous month | 2 months prior | |||
| OR (95% CI) | p-value | OR (95% CI) | p-value | OR (95% CI) | p-value | |
| Rainfall (precipitation)> 75 mm | 0.21 (0.019–1.2) | 0.079 | 1.4 (0.26–6.9) | 0.73 | 3.7 (0.73–22.3) | 0.08 |
| Minimum temperature> 14°C | 0.21 (0.041–0.95) | 0.025* | 0.61 (0.14–2.6) | 0.52 | 2.2 (0.49–10.5) | 0.33 |
| Maximum temperature> 26°C | 0.85 (0.20–3.6) | 1 | 0.37 (0.080–1.6) | 0.20 | 0.67 (0.15–2.80) | 0.75 |
| Asymptomatic controls | ||||||
| Month | Same month | Previous month | 2 months prior | |||
| OR (95% CI) | p-value | OR (95% CI) | p-value | OR (95% CI) | p-value | |
| Rainfall (precipitation)> 75 mm | 1.2 (0.21–6.5) | 1 | 0.43 (0.038–2.7) | 0.45 | 0.43 (0.038–2.7) | 0.45 |
| Minimum temperature> 14°C | 0.12 (0.016–0.64) | 0.005* | 0.41 (0.078–1.9) | 0.30 | 0.65 (0.13–3.2) | 0.73 |
| Maximum temperature> 26°C | 0.10 (0.0090–0.61) | 0.005* | 0.19 (0.027–1.0) | 0.04* | 0.63 (0.12–3.0) | 0.73 |
Additional files
-
Supplementary file 1
S. Typhi sequences used in this study (excel file).
- https://cdn.elifesciences.org/articles/67852/elife-67852-supp1-v4.xlsx
-
Supplementary file 2
Outgroup and global context H58 S. Typhi sequences used in this study (excel file).
- https://cdn.elifesciences.org/articles/67852/elife-67852-supp2-v4.xlsx
-
Supplementary file 3
Kenyan sequences used in temporal analyses (excel file).
- https://cdn.elifesciences.org/articles/67852/elife-67852-supp3-v4.xlsx
-
Supplementary file 4
Sequences used in IncHI1 plasmid analyses (excel file).
- https://cdn.elifesciences.org/articles/67852/elife-67852-supp4-v4.xlsx
-
Supplementary file 5
Repetitive regions excluded from plasmid pAKU1 SNP analysis (excel file).
- https://cdn.elifesciences.org/articles/67852/elife-67852-supp5-v4.xlsx
-
Supplementary file 6
Culture positive typhoid cases and asymptomatic carriers.
- https://cdn.elifesciences.org/articles/67852/elife-67852-supp6-v4.docx
-
Supplementary file 7
Comparison of phenotypic and genotypic AMR profiles of 136 (n=128 H58, n=8 Non-H58) high quality S. Typhi genome sequences.
- https://cdn.elifesciences.org/articles/67852/elife-67852-supp7-v4.docx
-
Supplementary file 8
Distribution of n=153 S. Typhi genotypes among each sex for cases and controls.
- https://cdn.elifesciences.org/articles/67852/elife-67852-supp8-v4.docx
-
Supplementary file 9
Climatic predictors of elevated case and carrier counts for all samples.
- https://cdn.elifesciences.org/articles/67852/elife-67852-supp9-v4.docx
-
Supplementary file 10
Climatic predictors of WGS confirmed elevated case and carrier counts inside the DSS.
- https://cdn.elifesciences.org/articles/67852/elife-67852-supp10-v4.docx
-
Supplementary file 11
Climatic predictors of WGS confirmed elevated case and carrier counts for all samples collected.
- https://cdn.elifesciences.org/articles/67852/elife-67852-supp11-v4.docx
-
Supplementary file 12
Climatic predictors of elevated cases presenting at study clinics.
- https://cdn.elifesciences.org/articles/67852/elife-67852-supp12-v4.docx
-
Supplementary file 13
Non-synonymous (NS) Mutations among S. Typhi isolates (excel file).
- https://cdn.elifesciences.org/articles/67852/elife-67852-supp13-v4.xlsx
-
Transparent reporting form
- https://cdn.elifesciences.org/articles/67852/elife-67852-transrepform1-v4.docx
Download links
A two-part list of links to download the article, or parts of the article, in various formats.
Downloads (link to download the article as PDF)
Open citations (links to open the citations from this article in various online reference manager services)
Cite this article (links to download the citations from this article in formats compatible with various reference manager tools)
Multiple introductions of multidrug-resistant typhoid associated with acute infection and asymptomatic carriage, Kenya
eLife 10:e67852.
https://doi.org/10.7554/eLife.67852


