Nuclear hormone receptor NHR-49 acts in parallel with HIF-1 to promote hypoxia adaptation in Caenorhabditis elegans
- Graduate Program in Medical Genetics, University of British Columbia, Canada
- British Columbia Children's Hospital Research Institute, Canada
- Centre for Molecular Medicine and Therapeutics, The University of British Columbia, Canada
- Department of Medical Genetics, University of British Columbia, Canada
- Department of Biochemistry, University of Washington School of Medicine, United States
- Department of Pediatrics, University of Pittsburgh School of Medicine, United States
- Departments of Developmental Biology and Cell Biology and Physiology, University of Pittsburgh School of Medicine, United States
Figures
Figure 1
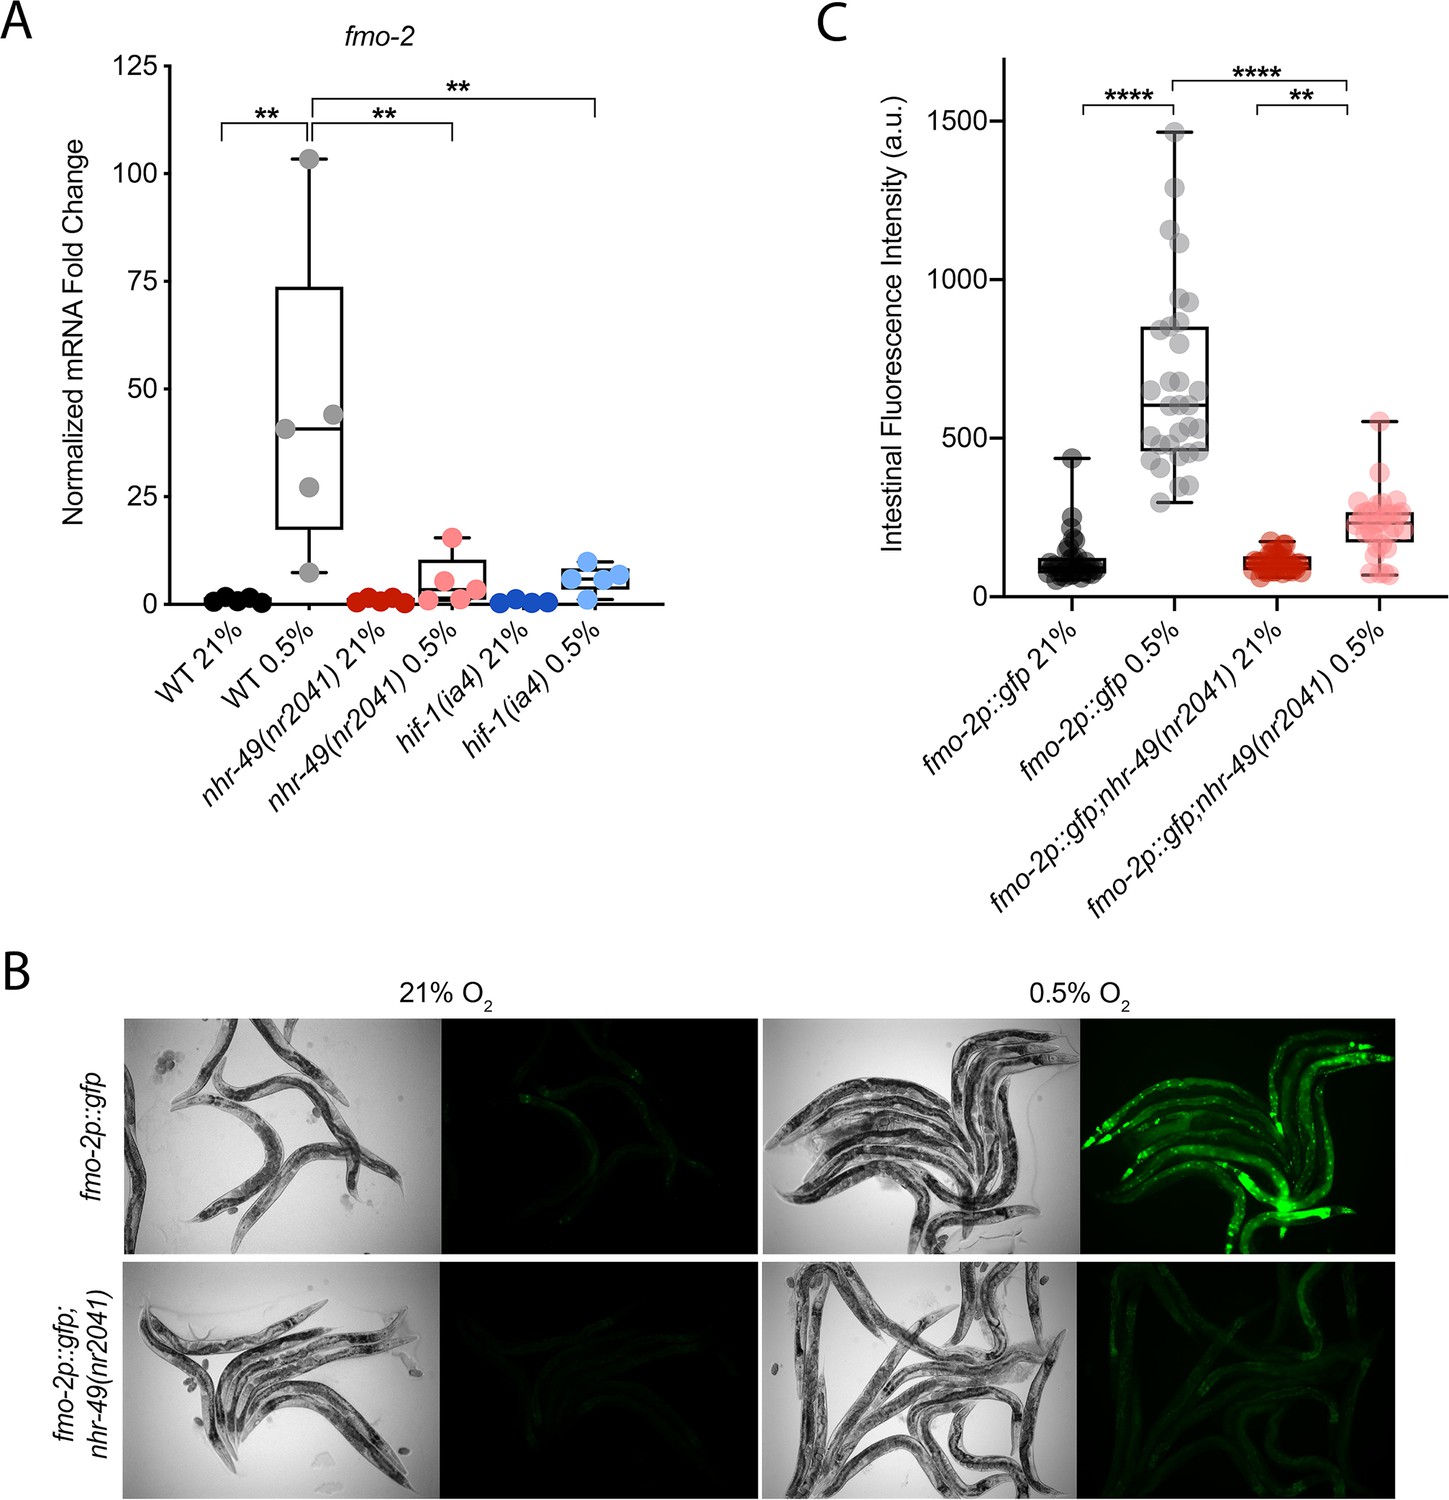
nhr-49 regulates fmo-2 induction following exposure to hypoxia.
(A) The graph indicates fold changes of mRNA levels (relative to unexposed wild-type) in L4 wild-type, nhr-49(nr2041), and hif-1(ia4) animals exposed to room air (21% O2) or 0.5% O2 for 3 hr (n = 5). **p<0.01 (two-way ANOVA corrected for multiple comparisons using the Tukey method). (B) Representative micrographs show fmo-2p::gfp and fmo-2p::gfp;nhr-49(nr2041) adult animals in room air or following 4 hr exposure to 0.5% O2 and 1 hr recovery in 21% O2. (C) The graph shows the quantification of intestinal GFP levels in fmo-2p::gfp and fmo-2p::gfp;nhr-49(nr2041) animals following 4 hr exposure to 0.5% O2 and 1 hr recovery in 21% O2 (three repeats totalling >30 individual animals per genotype). **p<0.01, ****p<0.0001 (two-way ANOVA corrected for multiple comparisons using the Tukey method). WT: wild-type. See Source data 1 for (A) and (C).
Figure 2 with 1 supplement
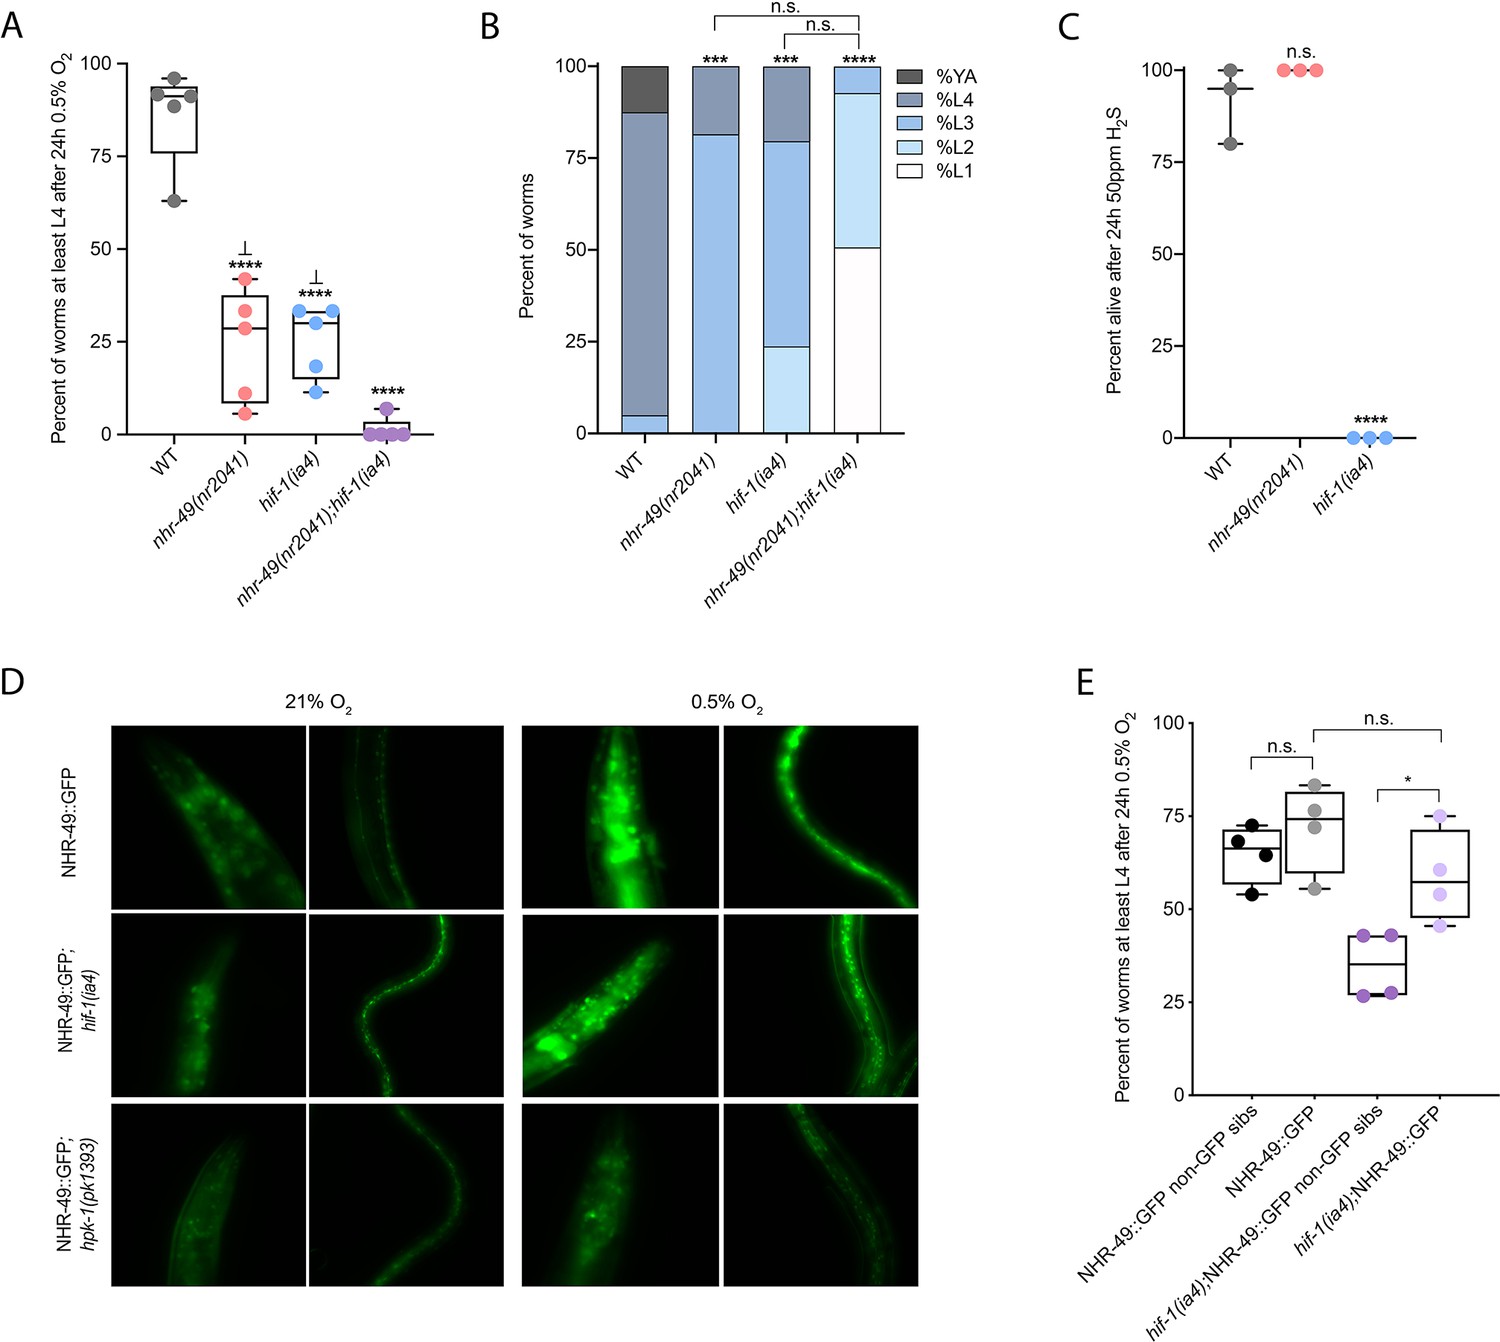
nhr-49 and hif-1 act in parallel hypoxia response pathways at two stages of the worm life cycle.
(A) The graph shows the average population survival of wild-type, nhr-49(nr2041), hif-1(ia4), and nhr-49(nr2041);hif-1(ia4) worm embryos exposed for 24 hr to 0.5% O2 and then allowed to recover at 21% O2 for 65 hr, counted as the ability to reach at least the L4 stage (five repeats totalling >100 individual animals per genotype). ****p<0.0001 vs. wild-type animals, ⊥p<0.05 vs. nhr-49(nr2041);hif-1(ia4) (ordinary one-way ANOVA corrected for multiple comparisons using the Tukey method). (B) The graph shows the average developmental success of wild-type, nhr-49(nr2041), hif-1(ia4), and nhr-49(nr2041);hif-1(ia4) larval worms following 48 hr exposure to 0.5% O2 from L1 stage (four repeats totalling >60 individual animals per genotype). ***p<0.001, ****p<0.0001 percent L4 or older vs. wild-type animals (ordinary one-way ANOVA corrected for multiple comparisons using the Tukey method). (C) The graph shows the average population survival of wild-type, nhr-49(nr2041), and hif-1(ia4) L4 animals following 24 hr exposure to 50 ppm hydrogen sulfide (three repeats totalling 60 individual animals per strain). ****p<0.0001 vs. wild-type animals (ordinary one-way ANOVA corrected for multiple comparisons using the Tukey method). (D) High-magnification images show nhr-49p::nhr-49::gfp adult worms in wild-type, hif-1(ia4), and hpk-1(pk1393) backgrounds exposed to room air or following 4 hr exposure to 0.5% O2 and 1 hr recovery in 21% O2. Expression is seen in the head, intestine, and hypodermal seam cells (additional repeats in Figure 2—figure supplement 1E and F) (E) The graph shows the average population survival of nhr-49p::nhr49::gfp and nhr-49p::nhr49::gfp;hif-1(ia4) animals and their respective non-GFP sibling embryos exposed for 24 hr to 0.5% O2 and then allowed to recover at 21% O2 for 65 hr, counted as the ability to reach at least the L4 stage (four repeats totalling >100 individual animals per genotype). *p<0.05 (ordinary one-way ANOVA corrected for multiple comparisons using the Tukey method). YA : young adult; n.s.: not significant; WT: wild-type. See Source data 1 for (A–C, E).
Figure 2—figure supplement 1
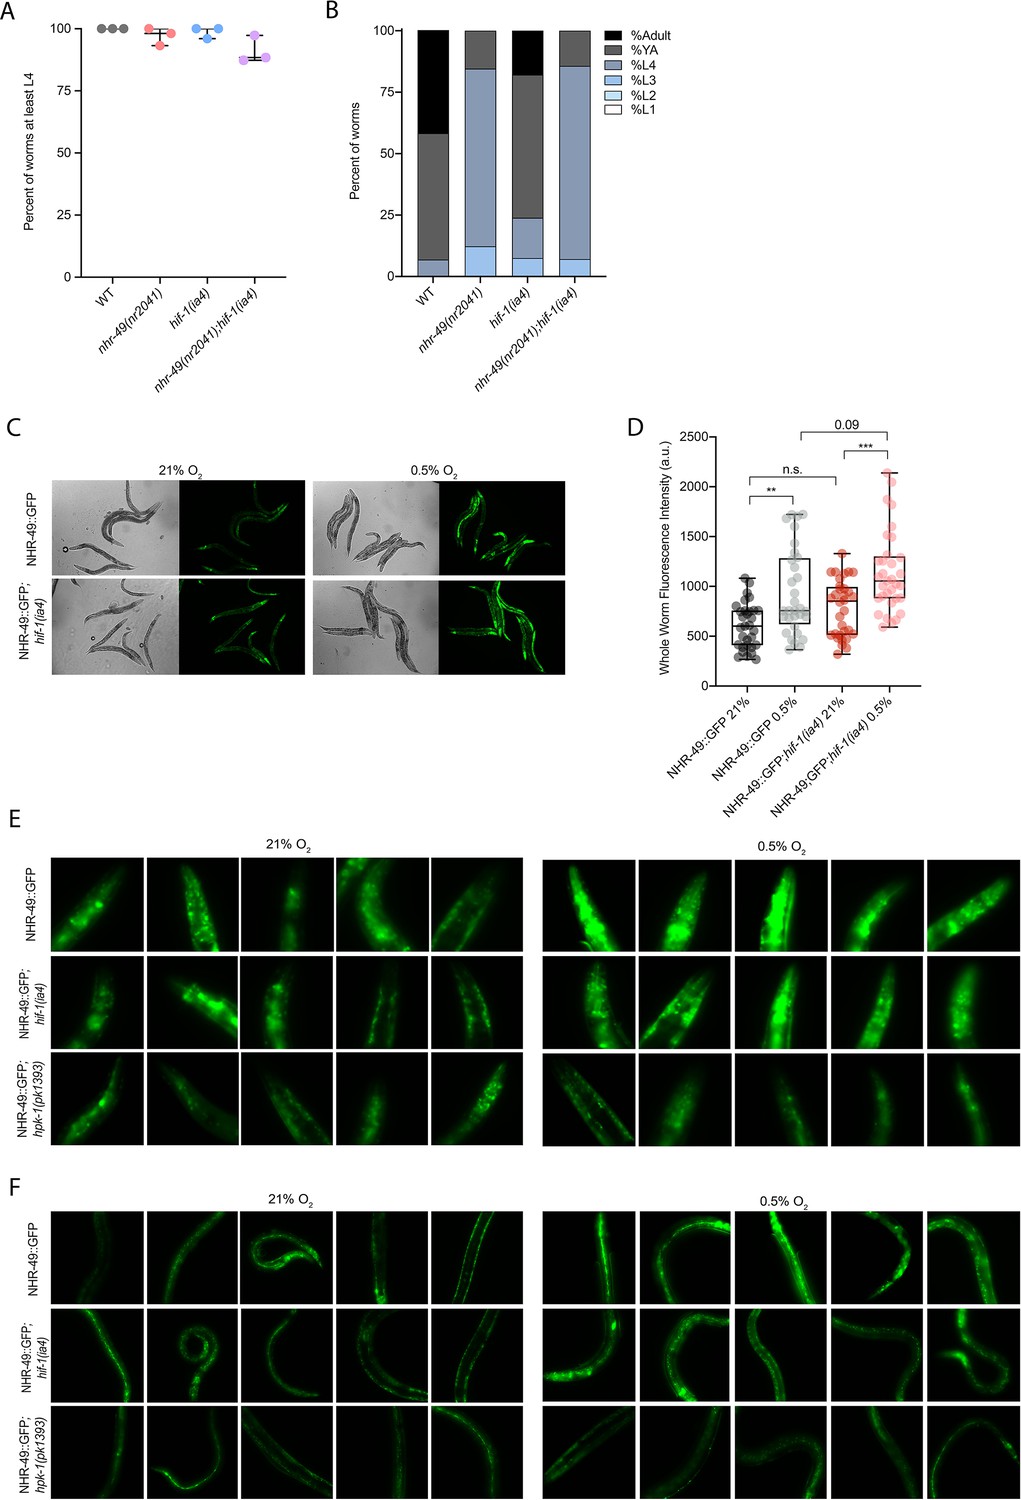
nhr-49 and hif-1 mutants do not display major developmental defects in normoxia, and NHR-49::GFP is induced by hypoxia.
(A) The graph shows the average developmental success of wild-type, nhr-49(nr2041), hif-1(ia4), and nhr-49(nr2041);hif-1(ia4) embryos kept in 21% O2 for 65 hr, and counted as the ability to reach at least L4 stage (three repeats totalling >100 individual animals per strain). All comparisons not significant (ordinary one-way ANOVA corrected for multiple comparisons using the Tukey method). (B) The graph shows the average developmental success of wild-type, nhr-49(nr2041), hif-1(ia4), and nhr-49(nr2041);hif-1(ia4) larval worms kept in 21% O2 for 48 hr from L1 stage (four repeats totalling >60 individual animals per strain). All comparisons not significant (ordinary one-way ANOVA corrected for multiple comparisons using the Tukey method). (C) Representative micrographs show nhr-49p::nhr-49::gfp and nhr-49p::nhr-49::gfp;hif-1(ia4) adult animals following 4 hr exposure to 0.5% O2 and 1 hr recovery in 21% O2. (D) The graph shows the quantification of whole-worm GFP levels in nhr-49p::nhr-49::gfp and nhr-49p::nhr-49::gfp;hif-1(ia4) animals following 4 hr exposure to 0.5% O2 and 1 hr recovery in 21% O2 (three repeats totalling >30 individual animals per strain). ** p<0.01, ***p<0.001 (two-way ANOVA corrected for multiple comparisons using the Tukey method). (E, F) High-magnification images show nhr-49p::nhr-49::gfp adult worms in wild-type, hif-1(ia4), and hpk-1(pk1393) background in the (E) head, and (F) intestine and hypodermal seam cells exposed to room air or following 4 hr exposure to 0.5% O2 and 1 hr recovery in 21% O2. YA: young adult; n.s.: not significant; WT: = wild-type. See Source data 1 for (A, B, D).
Figure 3 with 2 supplements
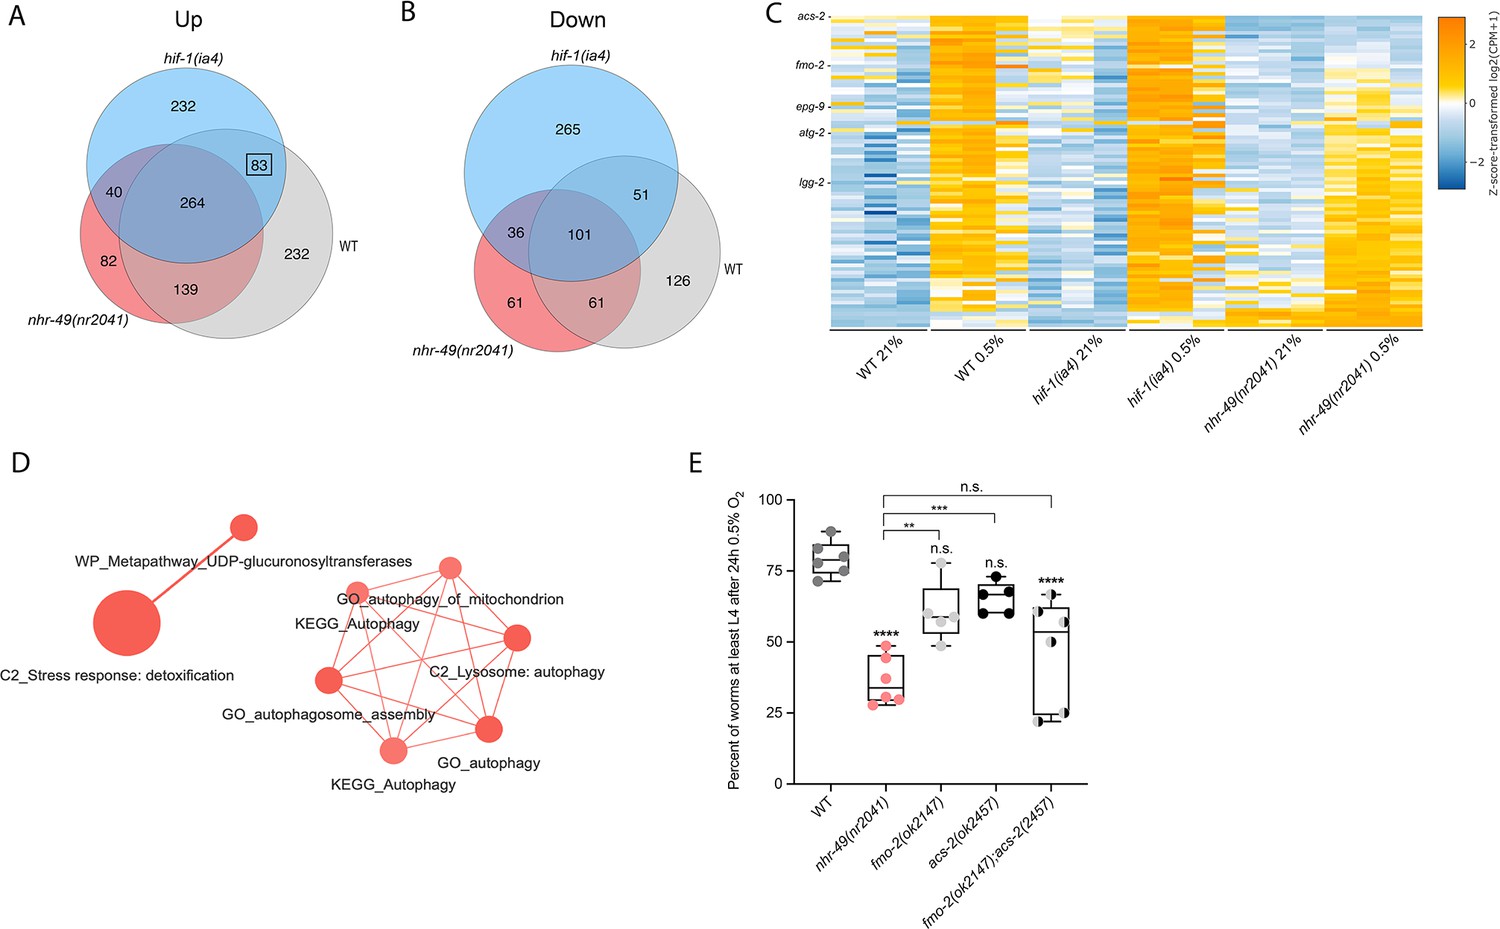
RNA-seq reveals an nhr-49-dependent transcriptional program in hypoxia.
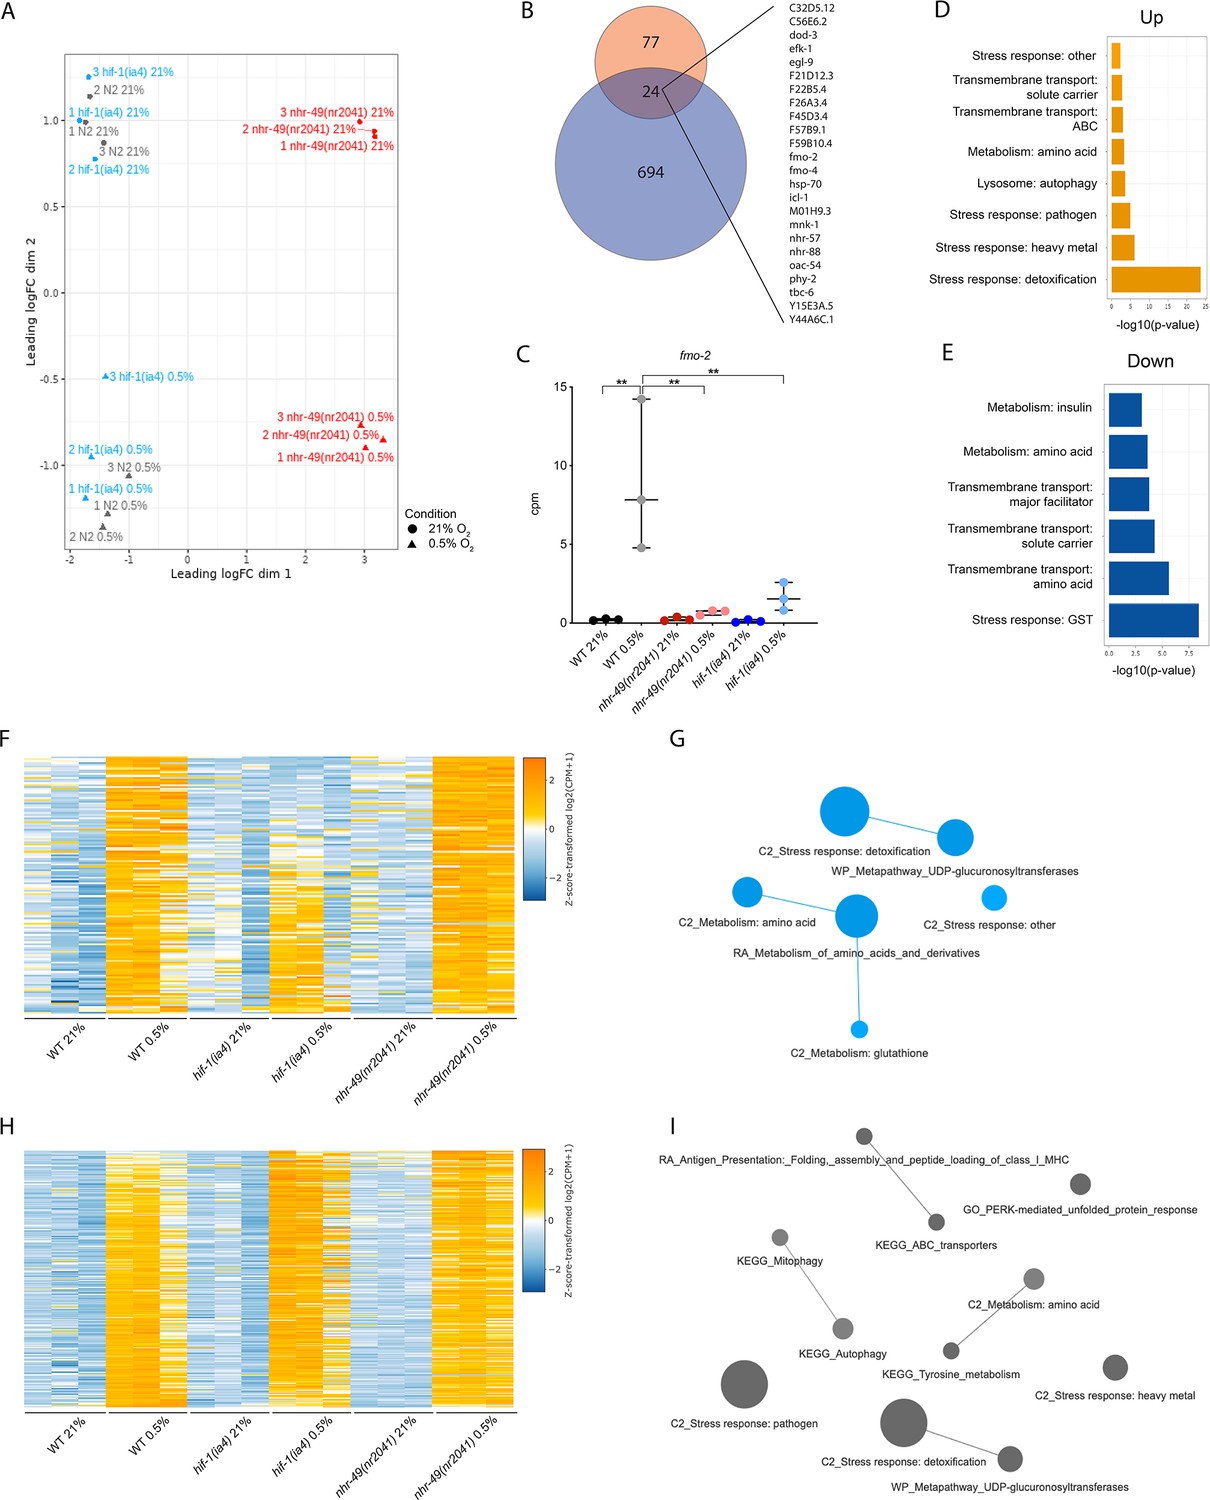
(A, B) Venn diagrams show the overlap of genes regulated by hypoxia (3 hr 0.5% O2; vs. normoxia 21% O2) in wild-type, nhr-49(nr2041), and hif-1(ia4) animals. Numbers indicate the number of differentially (FDR < 0.05, |logFC| ≥ 1) expressed genes in wild-type (grey), nhr-49 (red), and/or hif-1 (blue) animals in hypoxia, with hypoxia-upregulated genes in (A) and hypoxia-downregulated genes in (B). Genes upregulated by hypoxia in wild-type include 83 + 264 + 139 + 232 = 718 total genes. Of these 718 genes, 315 genes are not induced in nhr-49 animals, i.e., they require nhr-49 for induction; these are composed of 83 genes induced in both wild-type and hif-1 animals, but not in nhr-49 animals (grey-blue overlap; these depend only on nhr-49 but not on hif-1; highlighted by black box), and 232 genes induced only in wild-type animals but not in hif-1 or nhr-49 animals (grey; i.e., these are co-dependent on nhr-49 and hif-1). Genes downregulated by hypoxia include 177 genes that require nhr-49 for repression, composed of 51 genes downregulated in wild-type and hif-1 animals, but not in nhr-49 animals (grey-blue overlap; these depend on nhr-49 only); and 126 genes downregulated only in wild-type animals but not in hif-1 or nhr-49 animals (grey; i.e., these are co-dependent on nhr-49 and hif-1). (C) Heatmap of the expression levels of the 83 genes, which are significantly induced over twofold in 21% O2 vs. 0.5% O2 in wild-type and hif-1(ia4) animals, but not in nhr-49(nr2041), i.e., nhr-49-dependent hypoxia response genes. Genes along the y-axis are coloured in each repeat based on their z-scores of the log2-transformed counts per million (CPM) plus 1. Notable genes are highlighted. (D) Network view of the enriched functional categories among the 83 genes, which are significantly induced over twofold in 21% O2 vs. 0.5% O2 in wild-type and hif-1(ia4) animals, but not in nhr-49(nr2041). Edges represent significant gene overlap as defined by a Jaccard coefficient larger than or equal to 25%. The dot size reflects the number of genes in each functional category; colour intensity reflects statistical significance (−log10 p-value). (E) The graph shows the average population survival of wild-type, nhr-49(nr2041), fmo-2(ok2147), acs-2(ok2457), and fmo-2(ok2147);acs-2(ok2457) embryos following 24 hr exposure to 0.5% O2, then allowed to recover at 21% O2 for 65 hr, and counted as the ability to reach at least L4 stage (five or more repeats totalling >100 individual animals per strain). **p<0.01, ****p<0.0001 vs. wild-type animals. Comparison of single mutants to fmo-2(ok2147);acs-2(ok2457) not significant (ordinary one-way ANOVA corrected for multiple comparisons using the Tukey method). n.s.: not significant; WT: wild-type; FDR: false discovery rate; |logFC|: log2-transformed fold change. See Source data 1 for (E).
Figure 3—figure supplement 1
RNA-seq reveals several discrete hypoxia-responsive transcriptional programs.
(A) The figure shows a multidimensional scaling (MDS) plot of the distances between gene expression profiles. Distances on the MDS plot correspond to the root-mean-square average of the largest 200 log2-fold-changes between each pair of samples. (B) The Venn diagram shows the overlap between genes upregulated in hypoxia in wild-type animals at least twofold from our RNA-seq dataset (718 genes, blue) and from a published microarray dataset (Shen et al., 2005, 101 genes, red). The 24 genes found in both datasets are listed on the right (p = 5.227e-11, Fisher’s exact test with a genomic background of 14,900 expressed genes). (C) The graph shows the average transcript levels in counts per million (CPM) of fmo-2 mRNA in L4 wild-type, nhr-49(nr2041), and hif-1(ia4) animals exposed to 0.5% O2 for 3 hr or kept at 21% O2 (n = 3). **p<0.01 (two-way ANOVA corrected for multiple comparisons using the Tukey method). (D, E) Enriched WormCat (Category 2) categories among genes that are significantly upregulated over twofold (D) or downregulated over twofold (E) in wild-type animals in 21% O2 vs. 0.5% O2 are plotted by -log10 p-value. (F, H) Heatmaps of the expression levels of the (F) 139 genes from three repeats which are significantly induced over twofold in 21% O2 vs. 0.5% O2 in wild-type and nhr-49(nr2041) animals, but not in hif-1(ia4), and (H) the 264 genes from three repeats which are significantly induced over twofold in 21% O2 vs. 0.5% O2 in wild-type, hif-1(ia4), and nhr-49(nr2041) animals. Genes along the y-axis are coloured in each repeat based on their z-scores of the log2-transformedCPM plus 1. (G, I) Network views of the enriched functional categories among the 139 genes which are significantly induced over twofold in 21% O2 vs. 0.5% O2 in wild-type and nhr-49(nr2041) animals, but not in hif-1(ia4) (G), and the 264 genes which are significantly induced over twofold in 21% O2 vs. 0.5% O2 in wild-type, hif-1(ia4), and nhr-49(nr2041) animals (I). Edge represents significant gene overlap as defined by a Jaccard coefficient larger than or equal to 25%. Dot size reflects the number of genes in each functional category; colour intensity reflects statistical significance (−log10 p-value). WT: wild-type. See Source data 1 for (C).
Figure 3—figure supplement 2
nhr-49 regulates acs-2 induction following exposure to hypoxia.
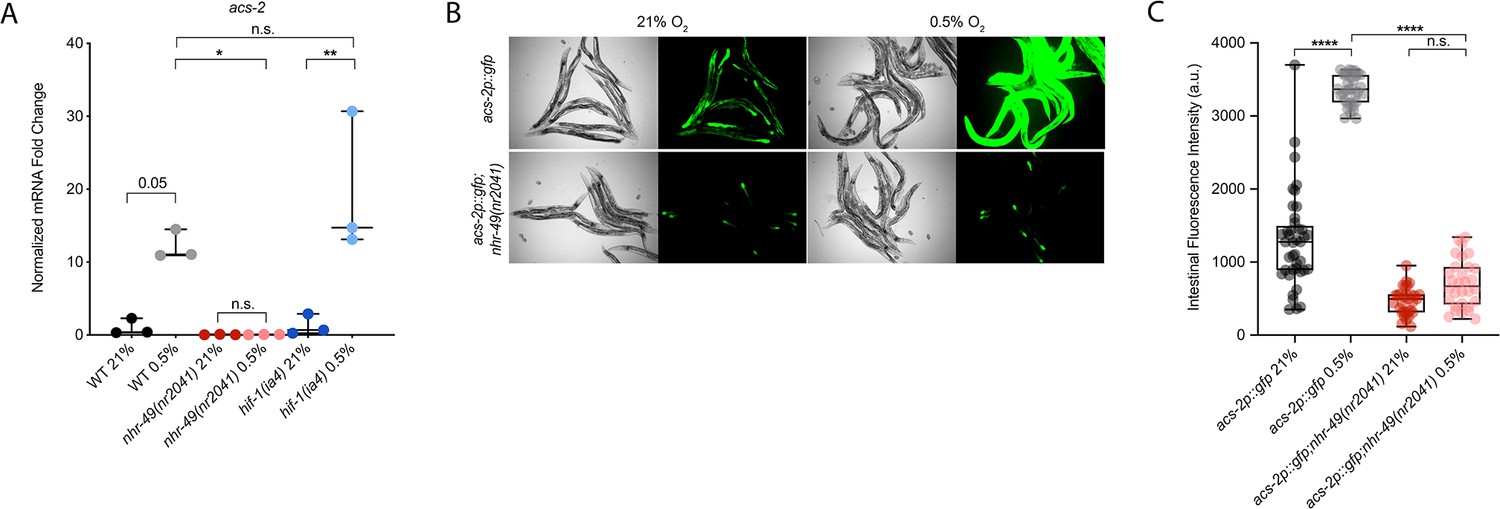
(A) The graph shows the average fold changes of mRNA levels (relative to unexposed wild-type) in L4 wild-type, nhr-49(nr2041), and hif-1(ia4) animals exposed to 0.5% O2 for 3 hr (n = 3). *p<0.05, **p<0.01 (two-way ANOVA corrected for multiple comparisons using the Tukey method). (B) Representative micrographs show acs-2p::gfp and acs-2p::gfp;nhr-49(nr2041) adult animals following 4 hr exposure to 0.5% O2 and 1 hr recovery in 21% O2. (C) The graph shows the quantification of intestinal GFP levels in acs-2p::gfp and acs-2p::gfp;nhr-49(nr2041) animals following 4 hr exposure to 0.5% O2 and 1 hr recovery in 21% O2 (three repeats totalling >30 individual animals per strain). ****p<0.0001 (two-way ANOVA corrected for multiple comparisons using the Tukey method). n.s.: not significant; WT: wild-type. See Source data 1 for (A, C).
Figure 4 with 1 supplement

nhr-49 is required to induce autophagy in response to hypoxia.
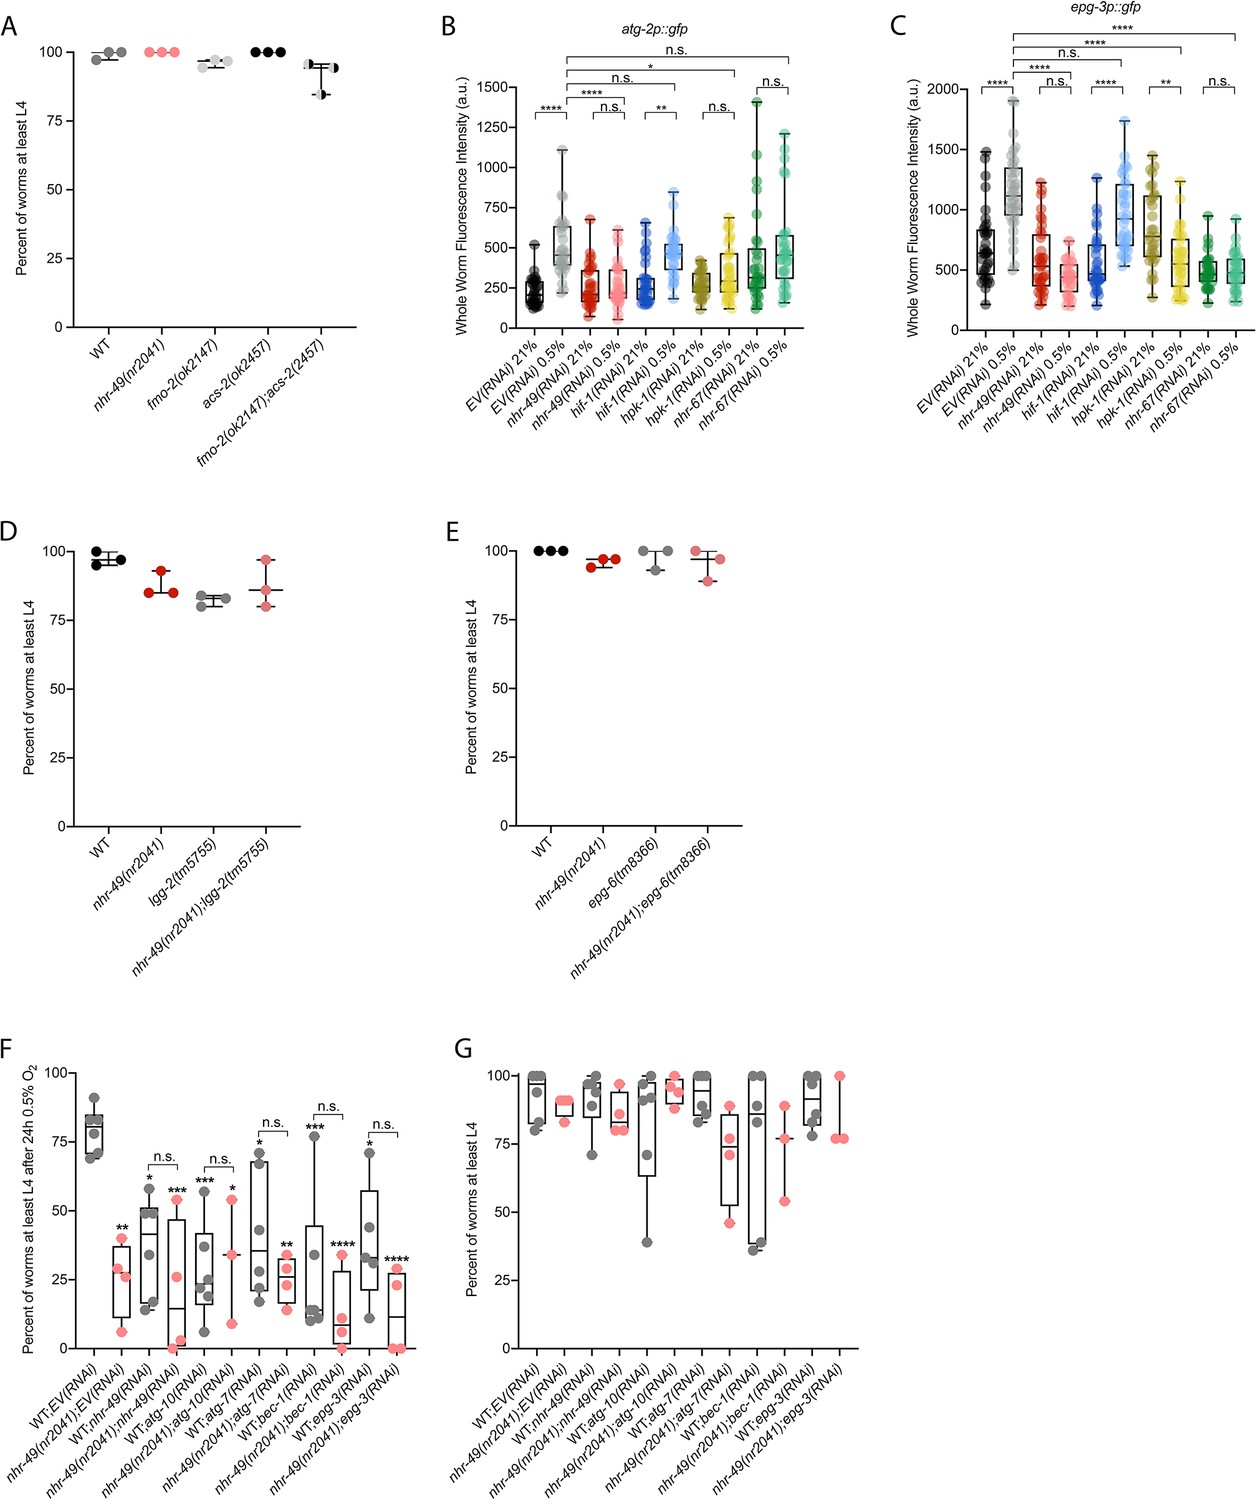
(A, B) The figure shows representative micrographs (A) and whole-worm GFP quantification (B) of lgg-1p::gfp adult animals fed EV, nhr-49, hif-1, hpk-1, or nhr-67 RNAi in room air or following 4 hr exposure to 0.5% O2 and 1 hr recovery in 21% O2 (three repeats totalling >30 individual animals per genotype). *p<0.05, ****p<0.0001 (two-way ANOVA corrected for multiple comparisons using the Tukey method). (C, D) The figure shows representative micrographs (C) and quantification (D) of LGG-1::GFP foci in individual hypodermal seam cells in L3 animals in the wild-type, nhr-49(nr2041), and hif-1(ia4) backgrounds, kept in room air or exposed to 5 hr 0.5% O2 (three repeats totalling >110 individual seam cells in at least 15 individual animals per genotype). Micrograph brightness and contrast are matched within genotype, and unmatched between genotypes. ****p<0.0001 (two-way ANOVA corrected for multiple comparisons using the Tukey method). (E, F) The graphs show average population survival of wild-type, nhr-49(nr2041), (E) lgg-2(tm5755) and nhr-49(nr2041);lgg-2(tm5755), and (F) epg-6(tm8366) and nhr-49(nr2041);epg-6(tm8366) animal embryos exposed for 24 hr to 0.5% O2 and then allowed to recover at 21% O2 for 65 hr, counted as the ability to reach at least the L4 stage (three repeats totalling >100 individual animals per genotype). **p<0.01, ***p<0.001, **** p<0.0001 vs. wild-type animals (ordinary one-way ANOVA corrected for multiple comparisons using the Tukey method). (G) Quantification of LGG-1::GFP foci in individual hypodermal seam cells in L3 animals in second-generation wild-type animals fed EV, hpk-1, or nhr-67 RNAi, kept in room air or exposed to 5 hr 0.5% O2 (three repeats totalling >110 individual seam cells in at least 15 individual animals per genotype). ****p<0.0001 (two-way ANOVA corrected for multiple comparisons using the Tukey method). n.s.: not significant; WT: wild-type. See Source data 1 for (B, D, E– G).
Figure 4—figure supplement 1
Mutants of downstream transcriptional targets of nhr-49 in hypoxia do not display functional defects in normoxia, and autophagy genes are regulated by and act in the nhr-49 hypoxia response pathway.
(A) The graph shows the average population survival of wild-type, nhr-49(nr2041), fmo-2(ok2147), acs-2(ok2457), and fmo-2(ok2147);acs-2(ok2457) embryos kept in 21% O2 for 65 hr, and counted as the ability to reach at least L4 stage (three repeats totalling >100 individual animals per strain). All comparisons not significant (ordinary one-way ANOVA corrected for multiple comparisons using the Tukey method). (B, C) Whole-worm GFP quantification of atg-2p::gfp (B) and epg-3p::gfp (C) adult animals fed EV, nhr-49, hif-1, hpk-1, or nhr-67 RNAi in room air or following 4 hr exposure to 0.5% O2 and 1 hr recovery in 21% O2 (three repeats totalling >30 individual animals per genotype). *p<0.05, ,**p<0.01, ****p<0.0001 (two-way ANOVA corrected for multiple comparisons using the Tukey method). (D, E) The graphs show average population survival of wild-type, nhr-49(nr2041), (D) lgg-2(tm5755) and nhr-49(nr2041);lgg-2(tm5755), and (E) epg-6(tm8366) and nhr-49(nr2041);epg-6(tm8366) embryos kept in 21% O2 for 65 hr, and counted as the ability to reach at least L4 stage (three repeats totalling >100 individual animals per strain). All comparisons not significant (ordinary one-way ANOVA corrected for multiple comparisons using the Tukey method). (F) The graph shows the average population survival of second-generation wild-type and nhr-49(nr2041) worm embryos fed EV, nhr-49, atg-10, atg-7, bec-1, or epg-3 RNAi, followed by 24 hr exposure to 0.5% O2 and recovery at 21% O2 for 65 hr, and counted as the ability to reach at least L4 stage (three or more repeats totalling >100 individual animals per strain). *p<0.05, **p<0.01, ***p<0.001, ****p<0.0001 vs. animals fed EV(RNAi) (ordinary one-way ANOVA corrected for multiple comparisons using the Tukey method). (G) The graph shows the average population survival of second-generation wild-type and nhr-49(nr2041) embryos fed EV, nhr-49, atg-10, atg-7, bec-1, or epg-3 RNAi kept in 21% O2 for 65 hr, and counted as the ability to reach at least L4 stage (three repeats totalling >100 individual animals per strain). All comparisons not significant (ordinary one-way ANOVA corrected for multiple comparisons using the Tukey method). n.s.: not significant; WT: wild type. See Source data 1 for (A–G).
Figure 5
nhr-49 is sufficient to promote survival in hypoxia and induce some hypoxia response genes.
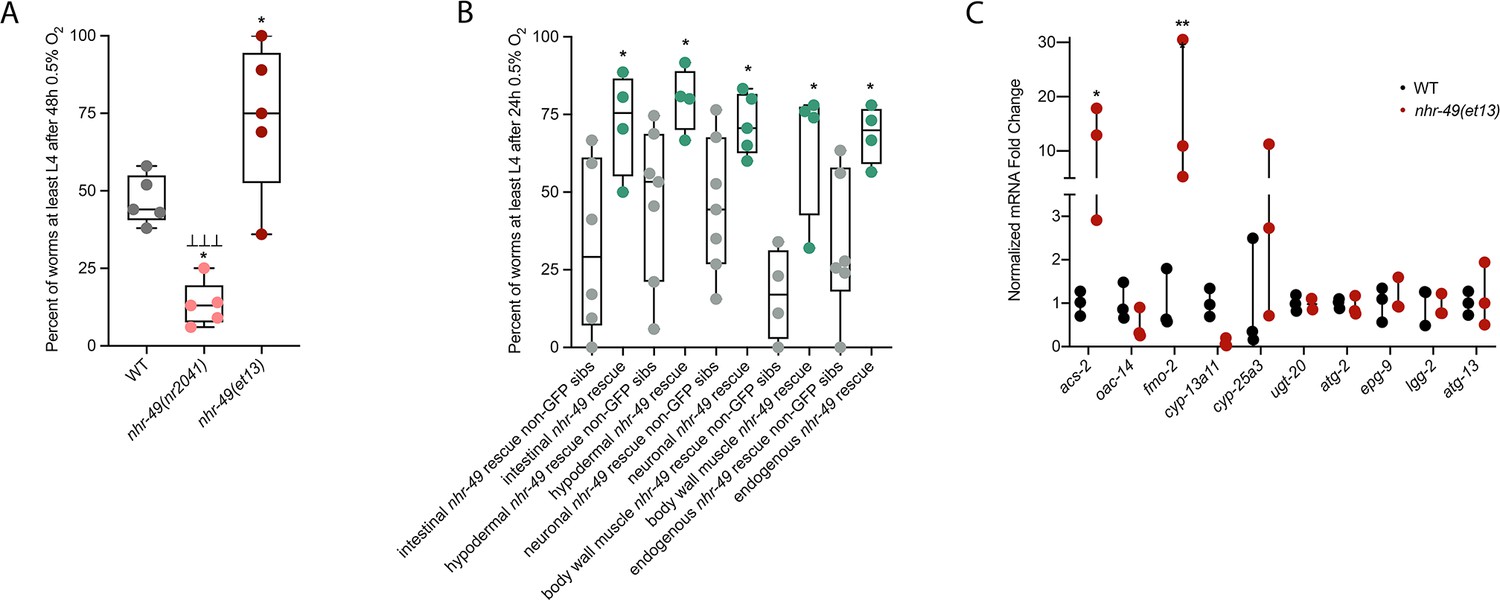
(A) The graph shows the average population survival of wild-type, nhr-49(nr2041), and nhr-49(et13) worm embryos following 48 hr exposure to 0.5% O2, then allowed to recover at 21% O2 for 42 hr, and counted as the ability to reach at least L4 stage (five repeats totalling >100 individual animals per strain). *p<0.05 vs. wild-type animals, ⊥⊥⊥p<0.001 vs. nhr-49(et13) animals (ordinary one-way ANOVA corrected for multiple comparisons using the Tukey method). (B) The graph shows the average population survival of nhr-49 tissue-specific rescue worm embryos following 24 hr exposure to 0.5% O2, then allowed to recover at 21% O2 for 65 hr, and counted as the ability to reach at least L4 stage. glp-19p::nhr-49::gfp for intestine, col-12p::nhr-49::gfp for hypodermis, rgef-1p::nhr-49::gfp for neurons, myo-3p::nhr-49::gfp for body wall muscle, and nhr-49p::nhr-49::gfp for endogenous (four or more repeats totalling >50 individual animals per strain). *p<0.05 vs. matching non-GFP siblings. (C) The graph shows fold changes of mRNA levels (relative to wild type) in L4 wild-type and nhr-49(et13) animals (n = 3). *p<0.05, ***p<0.001 vs. wild-type animals (ordinary one-way ANOVA corrected for multiple comparisons using the Tukey method). WT: wild-type. See Source data 1 for (A–C).
Figure 6 with 1 supplement
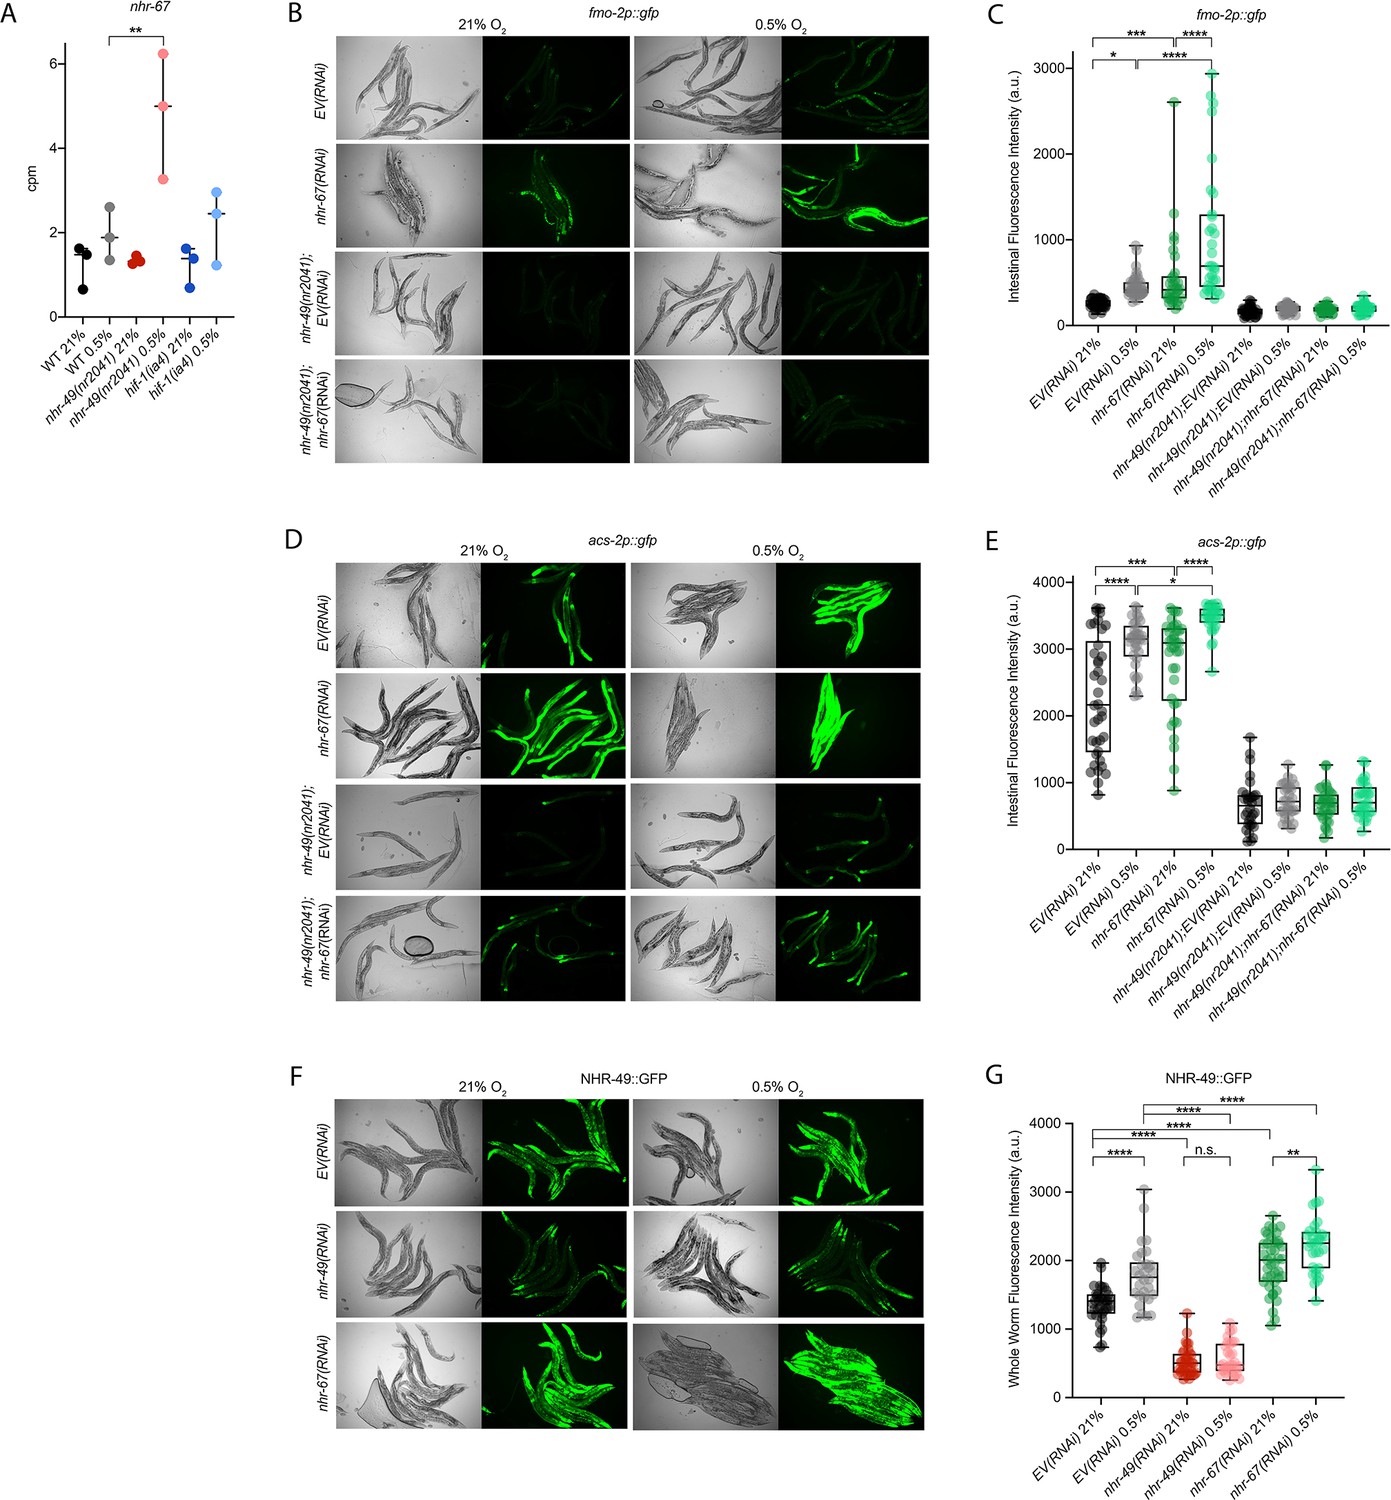
nhr-67 is a negative regulator of the nhr-49-dependent hypoxia response pathway.
(A) The graph shows the average transcript levels in counts per million (CPM) of nhr-67 mRNA in L4 wild-type, nhr-49(nr2041), and hif-1(ia4) animals exposed to 0.5% O2 for 3 hr or kept at 21% O2 (n = 3). **p <0.01 (two-way ANOVA corrected for multiple comparisons using the Tukey method). (B–E) Representative micrographs and quantification of intestinal GFP levels in fmo-2p::gfp and fmo-2p::gfp;nhr-49(nr2041) (B, C) and acs-2p::gfp and acs-2p::gfp;nhr-49(nr2041) (D, E) adult animals fed EV RNAi or nhr-67 RNAi following 4 hr exposure to 0.5% O2 and 1 hr recovery in 21% O2 (three repeats totalling >30 individual animals per strain). *p<0.05, ***p<0.001, ****p<0.0001 (two-way ANOVA corrected for multiple comparisons using the Tukey method). (F) Representative micrographs show nhr-49p::nhr-49::gfp adult animals fed EV, nhr-49, or nhr-67 RNAi following 4 hr exposure to 0.5% O2 and 1 hr recovery in 21% O2. (G) The graph shows quantification of whole-worm GFP levels in nhr-49p::nhr-49::gfp animals fed EV, nhr-49, or nhr-67 RNAi following 4 hr exposure to 0.5% O2 and 1 hr recovery in 21% O2 (three or more repeats totalling >30 individual animals per strain). ****p<0.0001 (two-way ANOVA corrected for multiple comparisons using the Tukey method). n.s.: not significant; WT: wild type. See Source data 1 for (A, C, E, G).
Figure 6—figure supplement 1
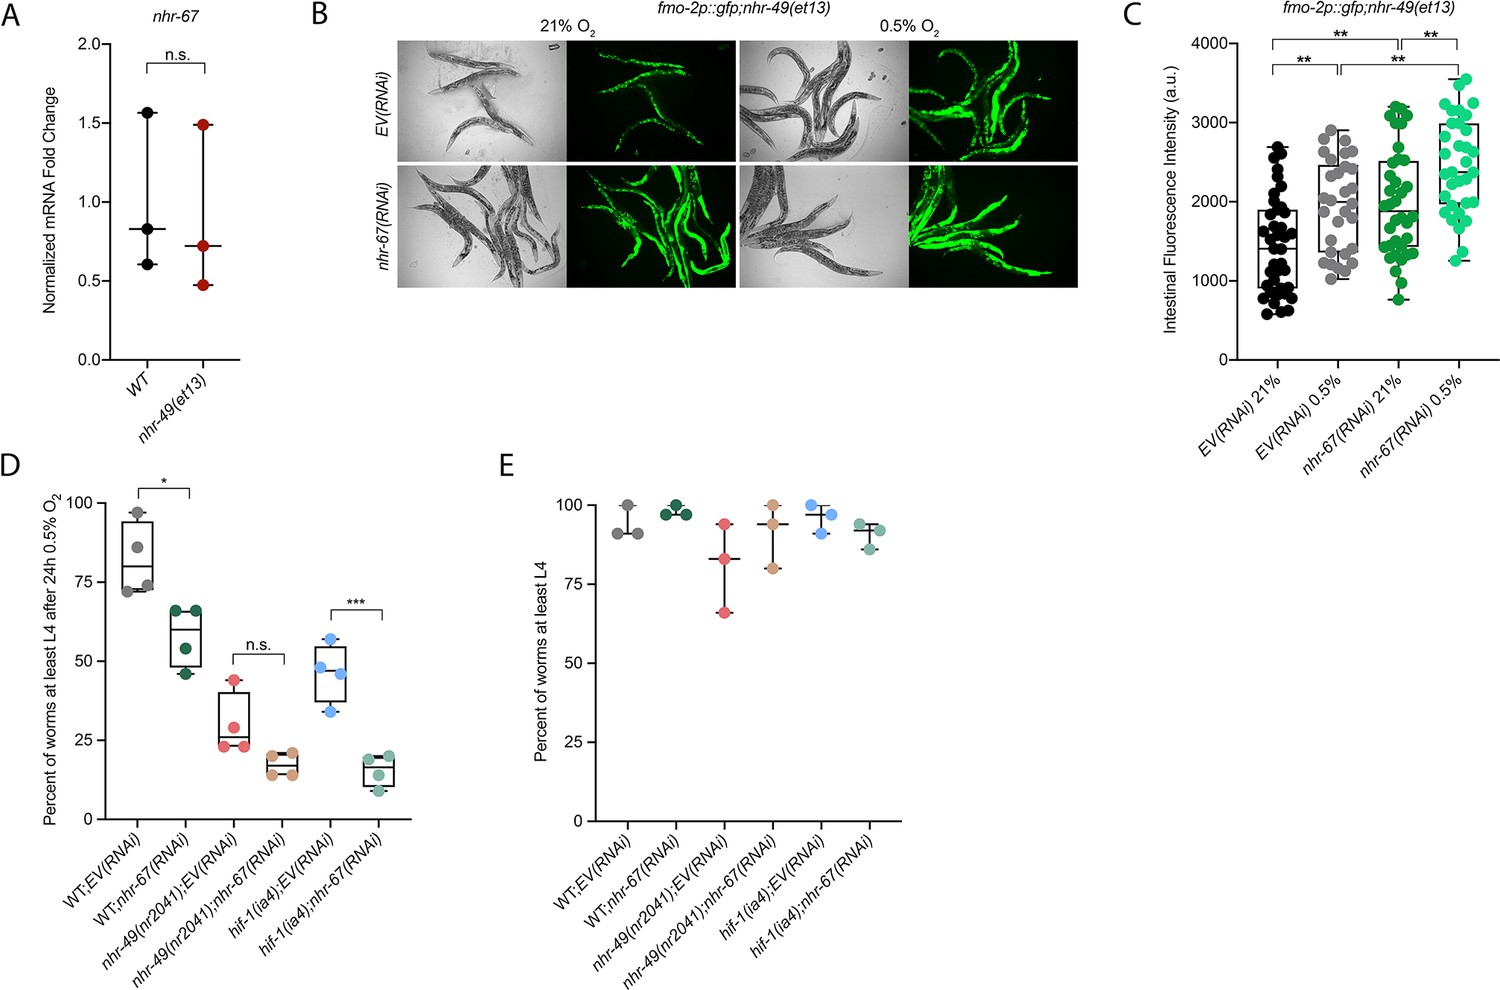
nhr-67 is functionally required for survival in hypoxia and acts in the nhr-49 pathway.
(A) The graph shows the average fold changes of mRNA levels (relative to wild type) in L4 wild-type and nhr-49(et13) animals (n = 3; ordinary one-way ANOVA corrected for multiple comparisons using the Tukey method). (B, C) Representative micrographs (B) and quantification (C) of intestinal GFP levels in fmo-2p::gfp;nhr-49(et13) adult animals fed EV or nhr-67 RNAi kept in 21% O2 or following 4 hr exposure to 0.5% O2 and 1 hr recovery in 21% O2 (three repeats totalling >30 individual animals per strain). **p<0.01 (two-way ANOVA corrected for multiple comparisons using the Tukey method). (D) The graph shows the average population survival of second-generation wild-type, nhr-49(nr2041), and hif-1(ia4) embryos fed EV or nhr-67 RNAi following 24 hr exposure to 0.5% O2, then allowed to recover at 21% O2 for 65 hr, and counted as the ability to reach at least L4 stage (four repeats totalling >100 individual animals per strain). *p<0.05, ***p<0.001 vs. EV(RNAi) animals (ordinary one-way ANOVA corrected for multiple comparisons using the Tukey method). (E) The graph shows the average population survival of second-generation wild-type, nhr-49(nr2041), and hif-1(ia4) embryos fed EV or nhr-67 RNAi kept in 21% O2 for 65 hr, and counted as the ability to reach at least L4 stage (four repeats totalling >100 individual animals per strain). All comparisons not significant (ordinary one-way ANOVA corrected for multiple comparisons using the Tukey method). n.s.: not significant; WT: wild-type. See Source data 1 for (A, C, D, E).
Figure 7 with 1 supplement

hpk-1 is a positive regulator within the nhr-49-dependent hypoxia response pathway.
(A–D) Representative micrographs and quantification of intestinal GFP levels in fmo-2p::gfp (A, B) and acs-2p::gfp (C, D) adult animals fed EV, nhr-49, hif-1, or hpk-1 RNAi following 4 hr exposure to 0.5% O2 and 1 hr recovery in 21% O2 (three or more repeats totalling >30 individual animals per strain). *p<0.05, **p<0.01, ****p<0.0001 vs. EV(RNAi) (ordinary one-way ANOVA corrected for multiple comparisons using the Tukey method). (E) The graph shows fold changes of mRNA levels in L4 wild-type, nhr-49(nr2041), and hpk-1(pk1393) animals exposed to 0.5% O2 for 3 hr (n = 4). **p<0.01, ***p<0.001 (two-way ANOVA corrected for multiple comparisons using the Tukey method). (F) The graph shows the average population survival of wild-type, nhr-49(nr2041), hpk-1(pk1393), and nhr-49(nr2041);hpk-1(pk1393) embryos following 24 hr exposure to 0.5% O2, then allowed to recover at 21% O2 for 65 hr, and counted as the ability to reach at least L4 stage (four repeats totalling >100 individual animals per strain). ***p<0.001, ****p<0.0001 vs. wild-type animals. Comparison of single mutants to nhr-49(nr2041);hpk-1(pk1393) not significant (ordinary one-way ANOVA corrected for multiple comparisons using the Tukey method). (G) The graph shows the average population survival of wild-type, hif-1(ia4), hpk-1(pk1393), and hif-1(ia4);hpk-1(pk1393) embryos following 24 hr exposure to 0.5% O2, then allowed to recover at 21% O2 for 65 hr, and counted as the ability to reach at least L4 stage (four repeats totalling >100 individual animals per strain). ****p<0.0001 vs. wild-type animals, ⊥⊥⊥p<0.001 vs. hif-1(ia4);hpk-1(pk1393) (ordinary one-way ANOVA corrected for multiple comparisons using the Tukey method). n.s.: not significant; WT: wild-type. See Source data 1 for (B, D, E–G).
Figure 7—figure supplement 1
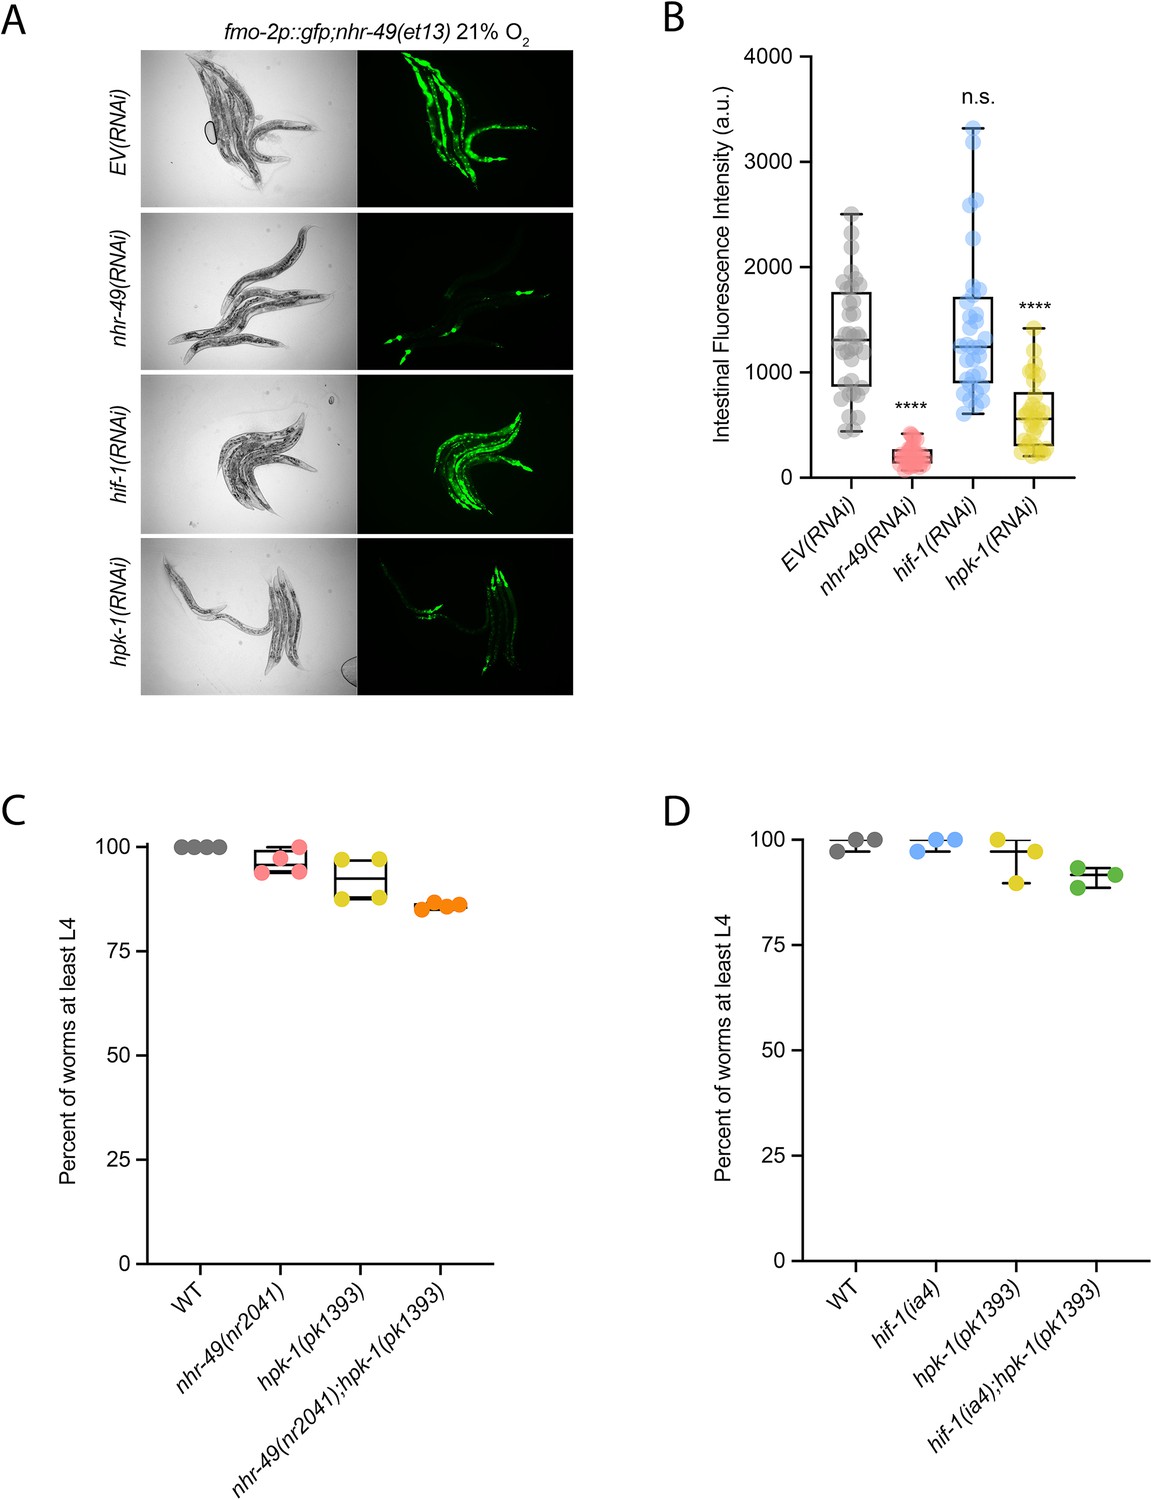
hpk-1 is required for fmo-2 induction, and hpk-1 mutants do not display functional defects in normoxia.
(A, B) Representative micrographs (A) and quantification (B) of intestinal GFP levels in fmo-2p::gfp;nhr-49(et13) adult animals fed EV, nhr-49, hif-1, or hpk-1 RNAi kept in 21% O2 (three or more repeats totalling >30 individual animals per strain). ****p<0.0001 vs. EV(RNAi) (ordinary one-way ANOVA corrected for multiple comparisons using the Tukey method). (C) The graph shows the average population survival of wild-type, nhr-49(nr2041), hpk-1(pk1393), and nhr-49(nr2041);hpk-1(pk1393) embryos kept in 21% O2 for 65 hr, and counted as the ability to reach at least L4 stage (four repeats totalling >100 individual animals per strain). All comparisons not significant (ordinary one-way ANOVA corrected for multiple comparisons using the Tukey method). (D) The graph shows the average population survival of wild-type, hif-1(ia4), hpk-1(pk1393), and hif-1(ia4);hpk-1(pk1393) embryos kept in 21% O2 for 65 hr, and counted as the ability to reach at least L4 stage (four repeats totalling >100 individual animals per strain). All comparisons not significant (ordinary one-way ANOVA corrected for multiple comparisons using the Tukey method). n.s.: not significant; WT: wild-type. See Source data 1 for (B–D).
Figure 8 with 1 supplement
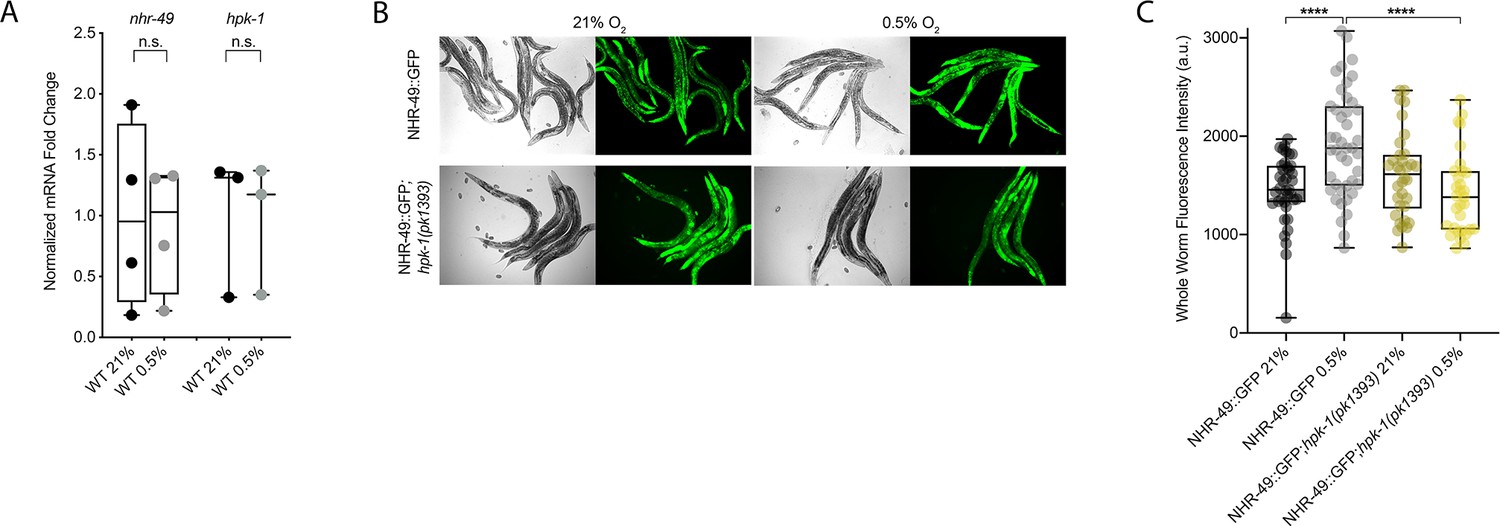
NHR-49 is induced in hypoxia in an hpk-1-dependent fashion.
(A) The graph shows the average fold changes of mRNA levels (relative to unexposed wild type) in L4 wild-type animals exposed to 0.5% O2 for 3 hr (n = 3 or 4; ordinary one-way ANOVA corrected for multiple comparisons using the Tukey method). (B) Representative micrographs show nhr-49p::nhr-49::gfp and nhr-49p::nhr-49::gfp;hpk-1(pk1393) adult animals following 4 hr exposure to 0.5% O2 and 1 hr recovery in 21% O2. (C) The graph shows the quantification of whole-worm GFP levels in nhr-49p::nhr-49::gfp and nhr-49p::nhr-49::gfp;hpk-1(pk1393) animals following 4 hr exposure to 0.5% O2 and 1 hr recovery in 21% O2 (three repeats totalling >30 individual animals per strain). ****p<0.0001 (two-way ANOVA corrected for multiple comparisons using the Tukey method). n.s.: not significant; WT: wild-type. See Source data 1 for (A, C).
Figure 8—figure supplement 1
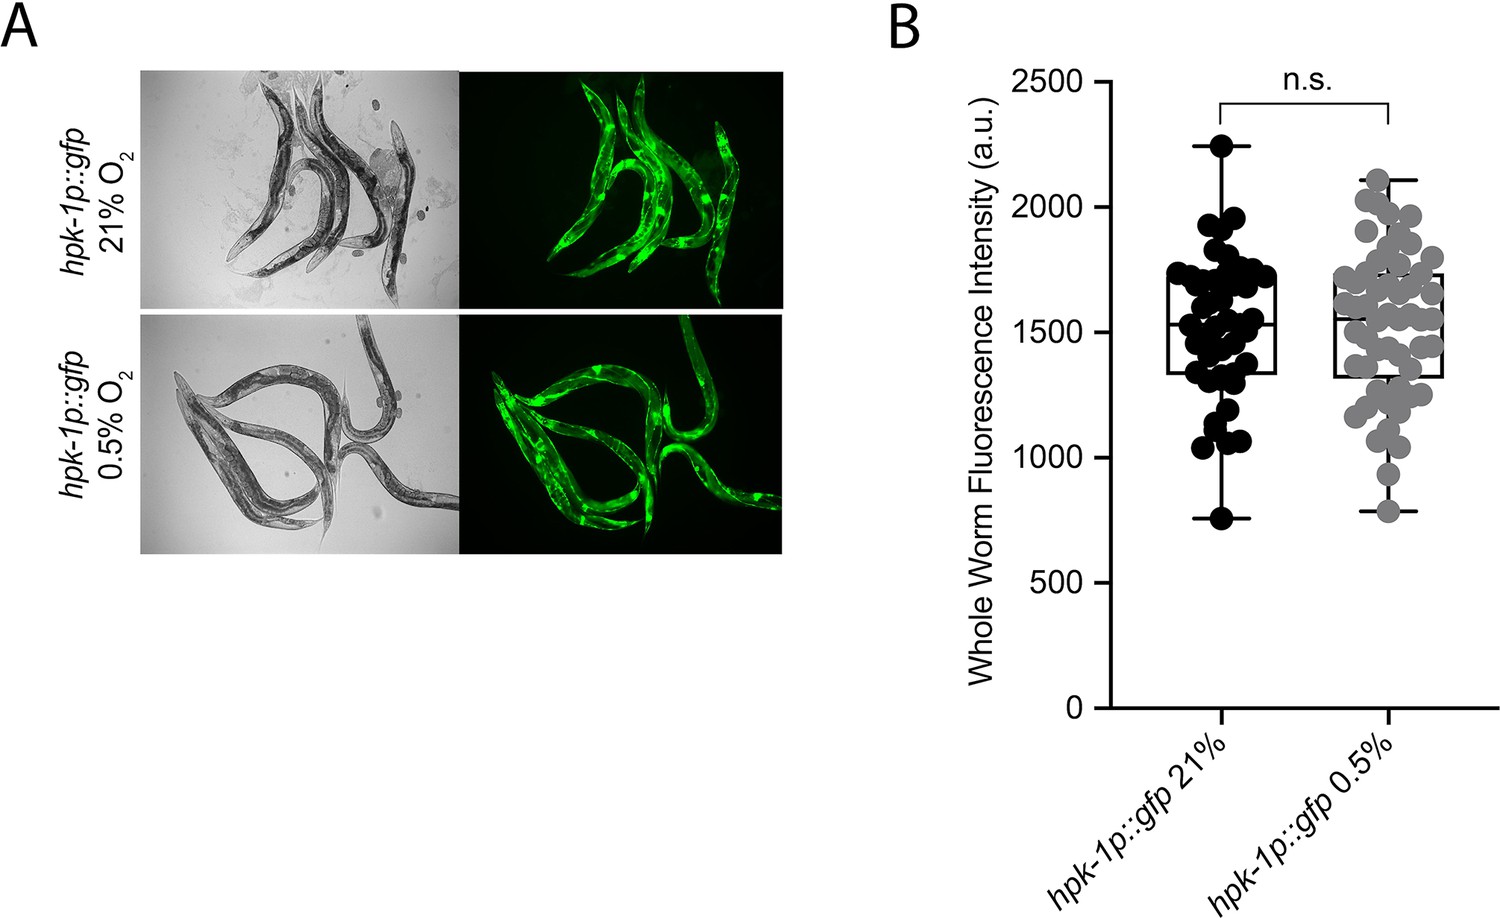
hpk-1 is not transcriptionally regulated in hypoxia.
(A) Representative micrographs show hpk-1p::gfp adult worms in 21% O2 or following 4 hr exposure to 0.5% O2 and 1 hr recovery in 21% O2. (B) Quantification of whole-worm GFP levels in hpk-1p::gfp animals following 4 hr exposure to 0.5% O2 and 1 hr recovery in 21% O2 or kept at 21% O2 (four repeats totalling >30 individual animals per strain; two-way ANOVA corrected for multiple comparisons using the Tukey method). n.s.: not significant. See Source data 1 for (B).
Figure 9

Model of the new NHR-49 hypoxia response pathway and its interaction with HIF-1 signalling.
The proposed model of how NHR-49 regulates a new hypoxia response parallel to HIF-1. During normoxia, the transcription factor NHR-67 negatively regulates NHR-49. However, during hypoxia, NHR-49 represses nhr-67, and the kinase HPK-1 positively regulates NHR-49, possibly directly or indirectly. This allows NHR-49 to activate its downstream hypoxia response target genes, including fmo-2, acs-2, and autophagy genes, whose induction is required for worm survival to hypoxia. (Figure created with https://biorender.com/, Toronto, ON, Canada).
Author response image 1
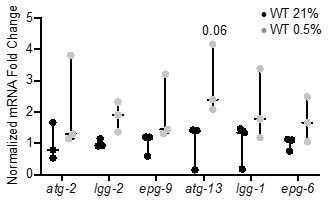
qRT-PCR reveals that increase of autophagy gene expression is not significant.
The graph indicates fold changes of mRNA levels in L4 stage wild-type animals exposed to room air (21% O2) or 0.5% O2 for 3 hr (n = 3). Statistics: two-way ANOVA corrected for multiple comparisons using the Tukey method.
Author response image 2
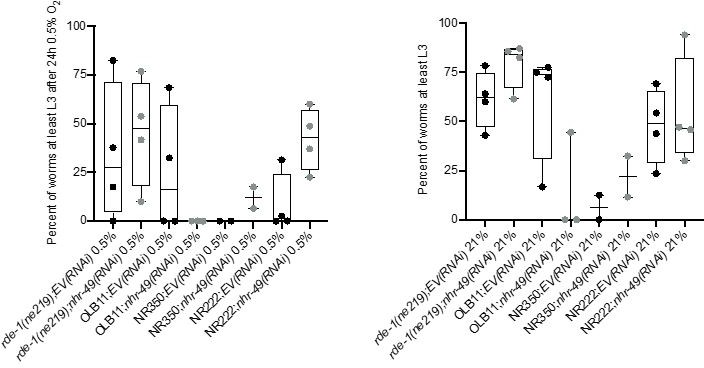
Tissue specific RNAi experiments resulted in highly variable hypoxia resistance.
The graph shows average population survival of rde-1(ne219) (control, RNAi deficient), OLB11 (rde-1(ne219);(pOLB11(elt-2p::rde-1) + pRF4(rol-6(su1006))); intestine-specific RNAi; McGhee et al., 2009), NR350 (rde-1(ne219) V; kzIs20 [hlh-1p::rde-1 + sur-5p::NLS::GFP]; muscle-specific RNAi; Qadota et al., 2007), and NR222 (rde-1(ne219) V; kzIs9 [(pKK1260) lin-26p::NLS::GFP + (pKK1253) lin-26p::rde-1 + rol-6(su1006)]; hypodermis-specific RNAi; Qadota et al., 2007) strains grown on control empty vector RNAi (EV(RNAi)) or nhr-49(RNAi). Worm embryos were exposed for 24 hr to 0.5% O2 and then allowed to recover at 21% O2 for 65 hr, and then scored for ability to reach at least the L3 stage (four repeats totalling >100 individual animals per genotype) (left). As control, we determined developmental success of the same strains on the same RNAi conditions grown in normoxia (right). Statistics: ordinary one-way ANOVA corrected for multiple comparisons using the Tukey method.
Author response image 3
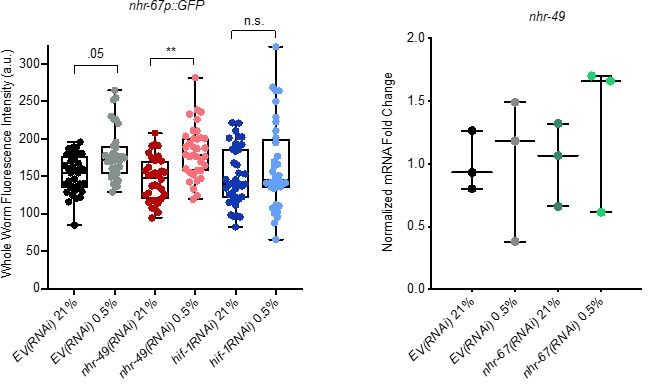
Analysis of nhr-67 and nhr-49 expression.
(Left) The graph shows the quantification of GFP levels in nhr67p::gfp animals in normoxia or following 4 hr exposure to 0.5% O2 and 1 hr recovery in 21% O2, on control empty vector RNAi (EV(RNAi)), nhr-49(RNAi), or hif-1(RNAi) (three repeats totalling >30 individual animals per genotype). ** p <0.01 (two-way ANOVA corrected for multiple comparisons using the Tukey method). (Right) The graph indicates relative levels of nhr-49 mRNA in L4 control empty vector RNAi (EV(RNAi)) and nhr-49(RNAi) animals exposed to room air (21% O2) or 0.5% O2 for 3 hr (n = 3). Statistics: two-way ANOVA corrected for multiple comparisons using the Tukey method.
Tables
Key resources table
| Reagent type (species) or resource | Designation | Source or reference | Identifiers | Additional information |
|---|---|---|---|---|
| Strain, strain background (Escherichia coli) | OP50 | Caenorhabditis Genetics Center (CGC) | ||
| Strain, strain background (E. coli) | HT115 | Caenorhabditis Genetics Center (CGC) | ||
| Genetic reagent (Caenorhabditis elegans) | N2 | Caenorhabditis Genetics Center (CGC) (Brenner, 1974) | ||
| Genetic reagent (C. elegans) | nhr-49(nr2041) I | PMID:15719061 (Van Gilst et al., 2005a) | STE68; RRID:WB-STRAIN:WBStrain00034504 | |
| Genetic reagent (C. elegans) | eavEx20[fmo-2p::gfp+rol-6(su1006)] | PMID:29508513 (Goh et al., 2018) | VE40 | |
| Genetic reagent (C. elegans) | nhr-49(nr2041) I; eavEx20[fmo-2p::gfp+rol-6(su1006)] | This study | STE129 | |
| Genetic reagent (C. elegans) | hif-1(ia4) V | PMID:11427734 (Jiang et al., 2001) | ZG31; RRID:WB-STRAIN:WBStrain00040824 | |
| Genetic reagent (C. elegans) | nhr-49(nr2041) I; hif-1(ia4) V | This study | STE130 | |
| Genetic reagent (C. elegans) | fmo-2(ok2147) IV | PMID:26586189 (Leiser et al., 2015) | VC1668; RRID:WB-STRAIN:WBStrain00036780 | |
| Genetic reagent (C. elegans) | acs-2(ok2457) V | PMID:21704635 (Zhang et al., 2011) | RB1899 | |
| Genetic reagent (C. elegans) | fmo-2(ok2147) IV; acs-2(ok2457) V | This study | STE131 | |
| Genetic reagent (C. elegans) | nhr-49(et13) I | PMID:27618178 (Lee et al., 2016) | STE110 | |
| Genetic reagent (C. elegans) | nhr-49(nr2041) I;glmEx5 [nhr-49p::nhr-49::gfp+myo-2p::mCherry] | PMID:34156142 (Naim et al., 2021) | AGP33a | |
| Genetic reagent (C. elegans) | nhr-49(nr2041) I; glmEx9 [gly-19p::nhr-49::gfp+myo-2p::mCherry] | PMID:34156142 (Naim et al., 2021) | AGP65 | |
| Genetic reagent (C. elegans) | nhr-49(nr2041)I; glmEx11 [col-12p::nhr-49::gfp+myo-2p::mCherry] | PMID:34156142 (Naim et al., 2021) | AGP53 | |
| Genetic reagent (C. elegans) | nhr-49(nr2041)I; glmEx13 [rgef-1p::nhr-49::gfp+myo-2p::mCherry] | PMID:34156142 (Naim et al., 2021) | AGP51 | |
| Genetic reagent (C. elegans) | nhr-49(nr2041)I; glmEx8 [myo-3p::nhr-49::gfp+myo-2p::mCherry] | PMID:34156142 (Naim et al., 2021) | AGP63 | |
| Genetic reagent (C. elegans) | wbmEx57 [acs-2p::gfp+rol-6(su1006)] | PMID:25723162 (Burkewitz et al., 2015) | WBM170 | |
| Genetic reagent (C. elegans) | nhr-49(nr2041) I; wbmEx57 [acs-2p::gfp+rol-6(su1006)] | PMID:25723162 (Burkewitz et al., 2015) | WBM169 | |
| Genetic reagent (C. elegans) | glmEx5 (nhr-49p::nhr-49::gfp+myo-2p::mCherry) | PMID:25474470 (Ratnappan et al., 2014) | AGP25f | |
| Genetic reagent (C. elegans) | hif-1(ia4) V; glmEx5 (nhr-49p::nhr-49::gfp+myo-2p::mCherry) | This study | STE140 | |
| Genetic reagent (C. elegans) | hpk-1(pk1393) X; glmEx5 (nhr-49p::nhr-49::gfp+myo-2p::mCherry) | This study | STE142 | |
| Genetic reagent (C. elegans) | hpk-1(pk1393) X | PMID:12618396 (Raich et al., 2003) | EK273; RRID:WB-STRAIN:WBStrain00007138 | |
| Genetic reagent (C. elegans) | nhr-49(nr2041) I; hpk-1(pk1393) X | This study | STE132 | |
| Genetic reagent (C. elegans) | hif-1(ia4) V; hpk-1(pk1393) X | This study | STE133 | |
| Genetic reagent (C. elegans) | nhr-49(et13) I; eavEx20[fmo-2p::gfp+rol-6(su1006)] | PMID:29508513 (Goh et al., 2018) | STE117 | |
| Genetic reagent (C. elegans) | artEx12 [hpk-1p::gfp+rol-6(su1006)] | PMID:29036198 (Das et al., 2017) | AVS394 | |
| Genetic reagent (C. elegans) | dpy-5(e907) I; sEx14068 [rCes atg-2::GFP+pCeh361] | PMID:15338614 (McKay et al., 2003) | BC14068 | |
| Genetic reagent (C. elegans) | dpy-5(e907) I; sEx13567 [rCes lgg-1::GFP+pCeh361] | PMID:15338614 (McKay et al., 2003) | BC13567 | |
| Genetic reagent (C. elegans) | dpy-5(e907) I; sEx10273 [rCes epg-3::GFP+pCeh361] | PMID:15338614 (McKay et al., 2003) | BC10273 | |
| Genetic reagent (C. elegans) | adIs2122 [lgg-1p::GFP::lgg-1 + rol-6(su1006)] | PMID:17785524 (Kang et al., 2007) | DA2123 | |
| Genetic reagent (C. elegans) | nhr-49(nr2041) I; adIs2122 [lgg-1p::GFP::lgg-1 + rol-6(su1006)] | This study | STE143 | |
| Genetic reagent (C. elegans) | hif-1(ia4) V; adIs2122 [lgg-1p::GFP::lgg-1 + rol-6(su1006)] | This study | STE144 | |
| Genetic reagent (C. elegans) | lgg-2(tm5755) IV | PMID:24374177 (Manil-Ségalen et al., 2014) | RD220 | |
| Genetic reagent (C. elegans) | nhr-49(nr2041) I; lgg-2(tm5755) IV | This study | STE145 | |
| Genetic reagent (C. elegans) | epg-6(tm8366) III | This study, non-outcrossed mutant obtained from NBRP; PMID:19934255 | STE147 | |
| Genetic reagent (C. elegans) | nhr-49(nr2041) I; epg-6(tm8366) III | This study | STE146 | |
| Sequence-based reagent | Source BioScience | PMID:11099033 | RNAi clones | |
| Sequence-based reagent | fmo-2_F | This paper | qPCR primer | GGAACAAGCGTGTTGCTGT |
| Sequence-based reagent | fmo-2_R | This paper | qPCR primer | GCCATAGAGAAGACCATGTCG |
| Sequence-based reagent | acs-2_F | This paper | qPCR primer | AGTGAGACTTGACAGTTCCG |
| Sequence-based reagent | acs-2_R | This paper | qPCR primer | CTTGTAAGAGAGGAATGGCTC |
| Sequence-based reagent | nhr-49_F | This paper | qPCR primer | TCCGAGTTCATTCTCGACG |
| Sequence-based reagent | nhr-49_R | This paper | qPCR primer | GGATGAATTGCCAATGGAGC |
| Sequence-based reagent | hpk-1_F | This paper | qPCR primer | TGTCAAAGTGAAGCCGCTGG |
| Sequence-based reagent | hpk-1_R | This paper | qPCR primer | CGGCGCCAGTTCGTGTAGTA |
| Sequence-based reagent | nhr-67_F | This paper | qPCR primer | GAGGATGATGCGACGAGTAG |
| Sequence-based reagent | nhr-67_R | This paper | qPCR primer | TGGTCTTGAAGAGGAAGGGGA |
| Sequence-based reagent | act-1_F | This paper | qPCR primer | GCTGGACGTGATCTTACTGATTACC |
| Sequence-based reagent | act-1_R | This paper | qPCR primer | GTAGCAGAGCTTCTCCTTGATGTC |
| Sequence-based reagent | tba-1_F | This paper | qPCR primer | GTACACTCCACTGATCTCTGCTGACAAG |
| Sequence-based reagent | tba-1_R | This paper | qPCR primer | CTCTGTACAAGAGGCAAACAGCCATG |
| Sequence-based reagent | ubc-2_F | This paper | qPCR primer | AGGGAGGTGTCTTCTTCCTCAC |
| Sequence-based reagent | ubc-2_R | This paper | qPCR primer | CGGATTTGGATCACAGAGCAGC |
| Sequence-based reagent | oac-14_F | This paper | qPCR primer | TTCCAGCGACTTTTCTTTCG |
| Sequence-based reagent | oac-14_R | This paper | qPCR primer | CCCAGGATTGCTTCAATCAG |
| Sequence-based reagent | cyp-13A11_F | This paper | qPCR primer | ACACGTGGACACTTCACTATG |
| Sequence-based reagent | cyp-13A11_R | This paper | qPCR primer | TTCCGATACACTGTCGAGGTC |
| Sequence-based reagent | cyp-25A3_F | This paper | qPCR primer | agaatcgttgctccaaaacac |
| Sequence-based reagent | cyp-25A3_R | This paper | qPCR primer | ttcaaaatctccaggaacagg |
| Sequence-based reagent | ugt-20_F | This paper | qPCR primer | CCGACAAATCCCAGAGAGACA |
| Sequence-based reagent | ugt-20_R | This paper | qPCR primer | TGTCCAAAAAGAAGTACTCAACG |
| Sequence-based reagent | atg-2_F | This paper | qPCR primer | AGATGTCCGCCATAGTCTGC |
| Sequence-based reagent | atg-2_R | This paper | qPCR primer | TCTTCCTGAGCAGCGAGTTC |
| Sequence-based reagent | epg-9_F | This paper | qPCR primer | CGACGAAAACCGAGATTCCC |
| Sequence-based reagent | epg-9_R | This paper | qPCR primer | TGAGCCAGCGATTGTTTGTG |
| Sequence-based reagent | lgg-2_F | This paper | qPCR primer | GCAGTTTACCACTTATGGATCGC |
| Sequence-based reagent | lgg-2_R | This paper | qPCR primer | CGTTCATTGACGAGCAGGAAG |
| Sequence-based reagent | atg-13_F | This paper | qPCR primer | AAGCAGCTGAAAACTGCTCC |
| Sequence-based reagent | atg-13_R | This paper | qPCR primer | CGGAGAACGAATTGACGTGTT |
| Sequence-based reagent | Random primers | Invitrogen | 48190-011 | |
| Sequence-based reagent | dNTPs | Fermentas | R0186 | |
| Chemical compound, drug | Carbenicillin | BioBasic | CDJ469 | |
| Chemical compound, drug | IPTG | Santa Cruz | sc-202185B | CAS 367-93-1 |
| Chemical compound, drug | Tetracycline | BioBasic | TB0504 | |
| Chemical compound, drug | RNAseOUT | Invitrogen | 10777-019 | |
| Chemical compound, drug | Fast SYBR Master Mix | Life Technologies | 4385612 | |
| Chemical compound, drug | Levamisole | Sigma | L9756 | |
| Chemical compound, drug | H2S | AirGas, Seattle, WA | X02NI99CP581327 | |
| Chemical compound, drug | 5000 ppm O2 balanced with N2 | Praxair Canada | NI OX5000C−T | |
| Software, algorithm | ImageJ | PMID:22930834 | https://imagej.nih.gov/ij/index.html | |
| Software, algorithm | Trimmomatic version 0.36 | PMID:24695404 | RRID:SCR_011848 | |
| Software, algorithm | Salmon version 0.9.1 | PMID:28263959 | RRID:SCR_017036 | https://combine-lab.github.io/salmon/ |
| Software, algorithm | tximport | PMID:26925227 | RRID:SCR_016752 | https://github.com/mikelove/tximport |
| Software, algorithm | edgeR | PMID:19910308 | RRID:SCR_012802 | http://bioconductor.org/packages/edgeR/ |
| Software, algorithm | eVITTA | PMID:34019643 | https://tau.cmmt.ubc.ca/eVITTA/ |
Additional files
-
Supplementary file 1
Summary of statistics of embryo hypoxia survival experiments.
Statistical comparison of each genotype’s ability to reach at least L4 following 24 hr exposure to 0.5% O2 as embryo and then allowed to recover at 21% O2 for 65 hr compared to worm embryos kept in 21% O2 for 65 hr (two-way ANOVA corrected for multiple comparisons using the Tukey method).
- https://cdn.elifesciences.org/articles/67911/elife-67911-supp1-v3.docx
-
Supplementary file 2
Summary of statistics of larval hypoxia survival experiments.
Statistical comparison of each genotype’s ability to reach at least L4 stage from L1 stage following 48 hr exposure to 0.5% O2 as embryos compared to animals kept in 21% O2 for 48 hr.
- https://cdn.elifesciences.org/articles/67911/elife-67911-supp2-v3.docx
-
Supplementary file 3
Lists of genes regulated by hypoxia in various genotypes.
(a) List of the 83 genes significantly upregulated more than twofold in 21% O2 vs. 0.5% O2 in wild-type and hif-1(ia4) animals, but not in nhr-49(nr2041) animals, i.e., nhr-49-dependent, hif-1-independent genes. (b) List of 139 genes significantly upregulated more than twofold in 21% O2 vs. 0.5% O2 in wild-type and nhr-49(nr2041) animals, but not in hif-1(ia4) animals, i.e., hif-1-dependent, nhr-49-independent genes. (c) List of 264 genes significantly upregulated more than twofold in 21% O2 vs. 0.5% O2 via RNA-seq in wild-type, nhr-49(nr2041), and hif-1(ia4).
- https://cdn.elifesciences.org/articles/67911/elife-67911-supp3-v3.xlsx
-
Transparent reporting form
- https://cdn.elifesciences.org/articles/67911/elife-67911-transrepform1-v3.docx
-
Source data 1
Source data for all indicated figures.
- https://cdn.elifesciences.org/articles/67911/elife-67911-data1-v3.xlsx
Download links
A two-part list of links to download the article, or parts of the article, in various formats.
Downloads (link to download the article as PDF)
Open citations (links to open the citations from this article in various online reference manager services)
Cite this article (links to download the citations from this article in formats compatible with various reference manager tools)
Nuclear hormone receptor NHR-49 acts in parallel with HIF-1 to promote hypoxia adaptation in Caenorhabditis elegans
eLife 11:e67911.
https://doi.org/10.7554/eLife.67911


