Collagen polarization promotes epithelial elongation by stimulating locoregional cell proliferation
- Division of Cell and Developmental Biology, Institute for Molecular Bioscience, The University of Queensland, Australia
- QIMR Berghofer Medical Research Institute, Australia
Figures
Figure 1 with 3 supplements
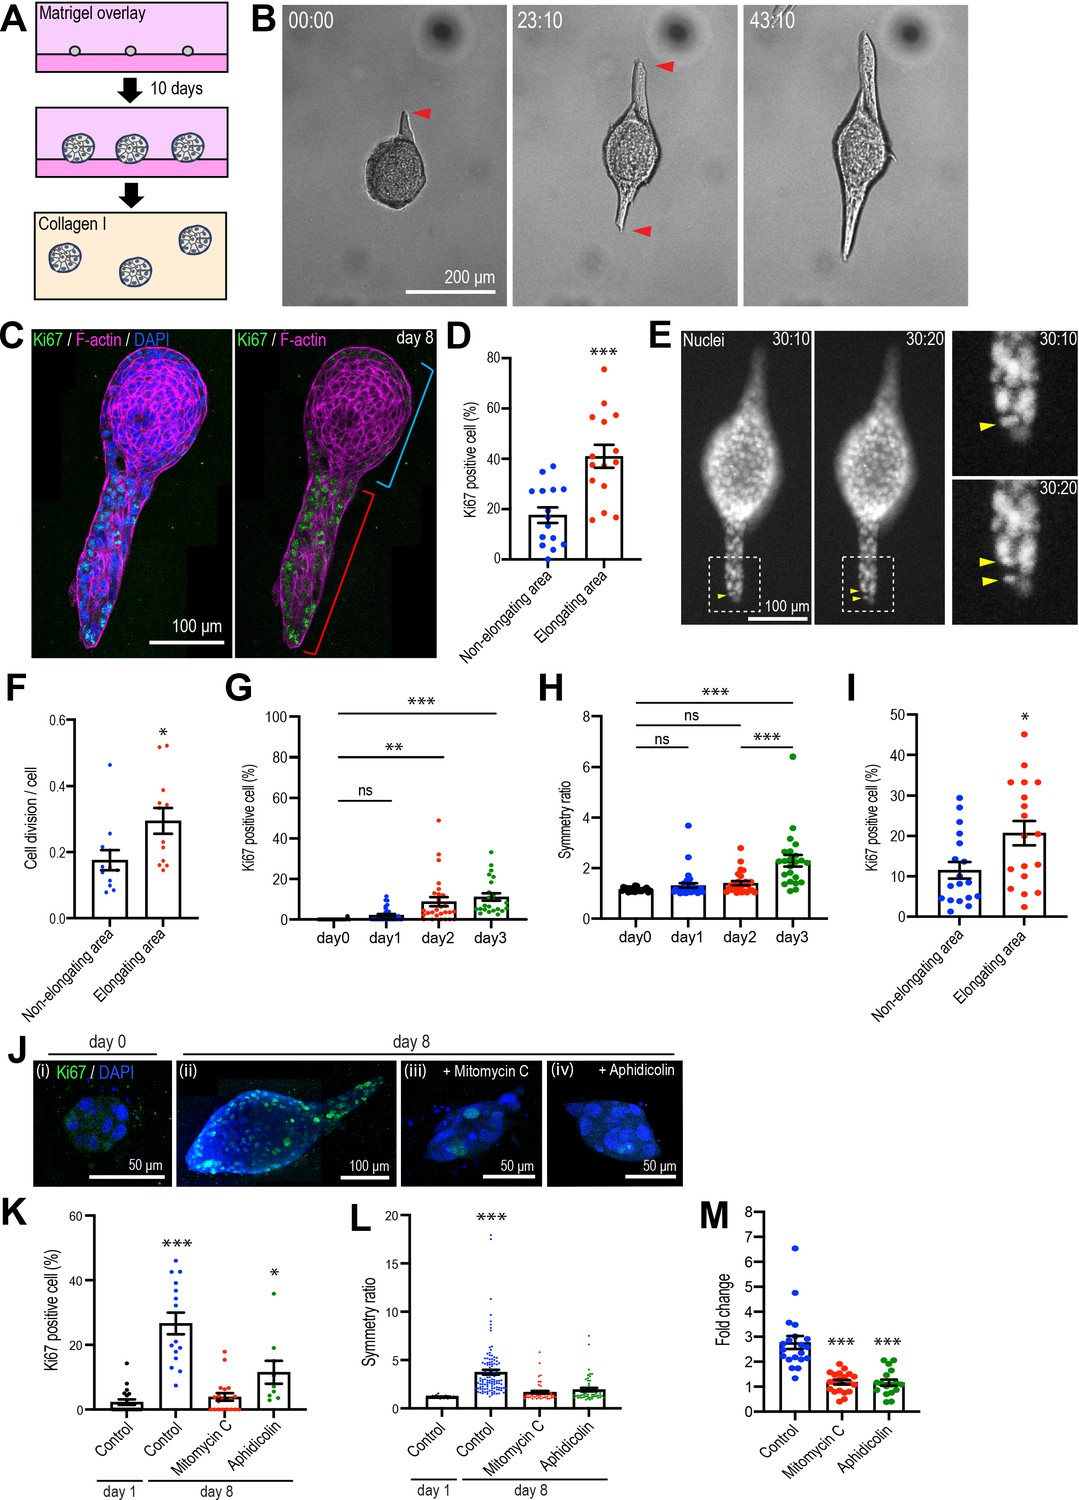
Type 1 collagen induces elongation of MCF10A anlage via cell proliferation.
(A) Cartoon: transplantation of MCF10A cell aggregates from Matrigel into collagen gel. Single isolated cells are cultured on Matrigel and overlayed with Matrigel-containing medium. Matrigel is washed out after 10 days and the aggregates re-embedded into type 1 collagen gel. (B) Time-lapse images of MCF10A aggregates after transfer into a collagen gel. Red arrowheads: elongation from aggregates. (C) Fluorescence image of an elongated aggregate cultured for 8 days after transfer into collagen gel and stained with anti-Ki67 antibody (green), phalloidin (magenta), and DAPI (blue). Blue parenthesis: non-elongating area; red parenthesis: elongating area. (D) Percentage of Ki67-positive cells in elongating and non-elongating areas of the elongated aggregates (n = 15 aggregates). (E) Time-lapse images of elongating aggregates expressing NLS-mCherry. Yellow arrowheads: dividing nucleus. (F) Frequency of cell division in elongating and non-elongating regions of aggregates (n = 12 aggregates). (G) Percentage of Ki67-positive cells in aggregates cultured for 0–3 days (n = 102 aggregates). (H) Symmetry ratio of aggregates cultured for 0–3 days (n = 102 aggregates). (I) Percentage of Ki67-positive cells in elongating area and non-elongating areas of aggregates that broke symmetry (defined as symmetry ratio >1.5) in the first three days of culture (n = 18 aggregates). (J) MCF10A aggregates co-stained with anti-Ki67 antibody (green) and DAPI (blue). Aggregates were cultured for 0 day (i) or 8 days (ii–iv) after treatment with vehicle (ii), mitomycin C (iii), or aphidicolin (iv). (K) Percentage of Ki67-positive cells in aggregates cultured for 1 day or 8 days with or without mitomycin C or aphidicolin (n = 63 aggregates). (L) Symmetry ratio of aggregates cultured for 1 day or 8 days with or without mitomycin C or aphidicolin (n = 237 aggregates). (M) Effect of delayed inhibition of proliferation on aggregate elongation. Aggregates were cultured for 3 days before treatment with mitomycin C or aphidicolin. Data are fold change of elongation in control and drug-treated cultures (n = 57 aggregates). All data are means ± SEM, *p<0.05, **p<0.01, ***p<0.001. Data in (D, F, I) were analyzed by unpaired Student’s t-test. Data in (G, H, K–M) were analyzed by one-way ANOVA Tukey’s multiple comparisons test.
-
Figure 1—source data 1
Original data for quantitative analysis in Figure 1.
- https://cdn.elifesciences.org/articles/67915/elife-67915-fig1-data1-v2.xlsx
Figure 1—figure supplement 1
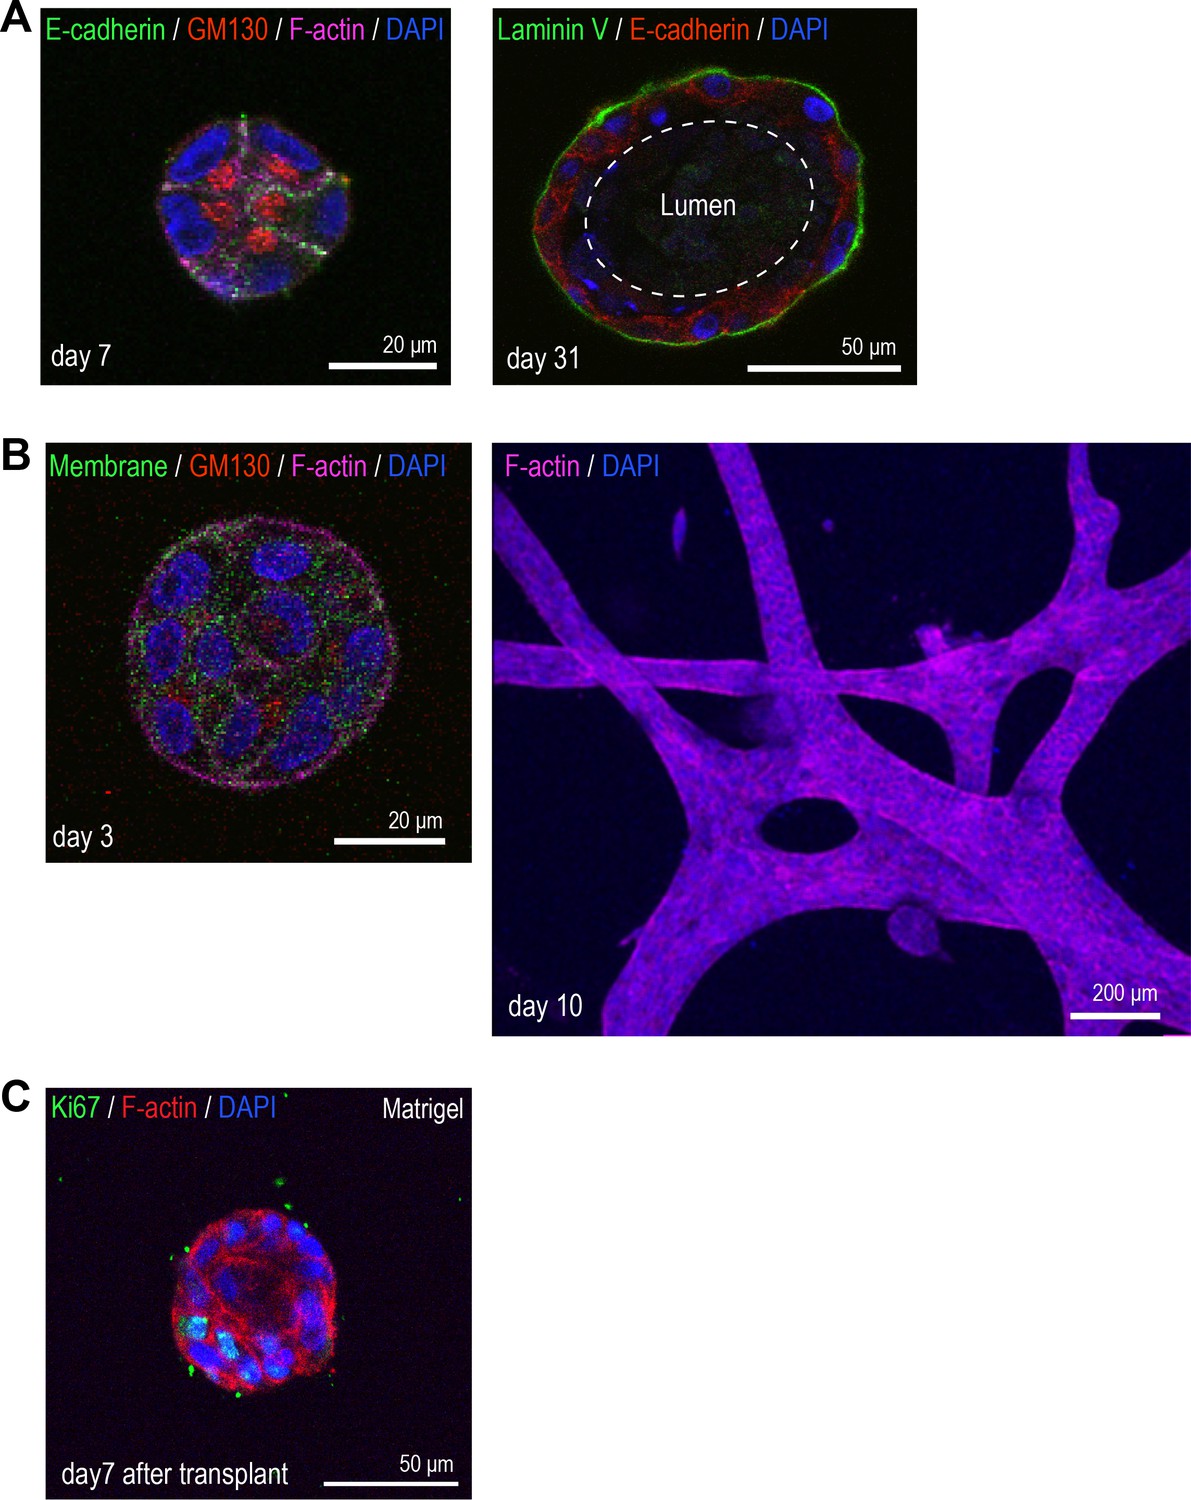
3D morphology of MCF10A cells.
(A) MCF10A cells cultured in Matrigel for 7 days (left) and 31 days (right). Day 7 aggregate is co-stained with anti-E-cadherin antibody (green), anti-GM130 antibody (red), phalloidin (magenta), and DAPI (blue). Day 31 acinus was co-stained with anti-laminin V antibody (green), anti-E-cadherin antibody (red), and DAPI (blue). (B) MCF10A cells cultured in type 1 collagen gel for 3 days (left) and 10 days (right). Day 3 MFC10A cells expressing GFP-HRasC20 were co-stained with anti-GM130 antibody (red), phalloidin (magenta), and DAPI (blue). Day 10 MCF10A cells were co-stained with phalloidin (magenta) and DAPI (blue). (C) MCF10A aggregate cultured for 7 days after transplantation from Matrigel back into Matrigel. Aggregate was co-stained with anti-Ki67 antibody (green), phalloidin (red), and DAPI (blue).
Figure 1—figure supplement 2
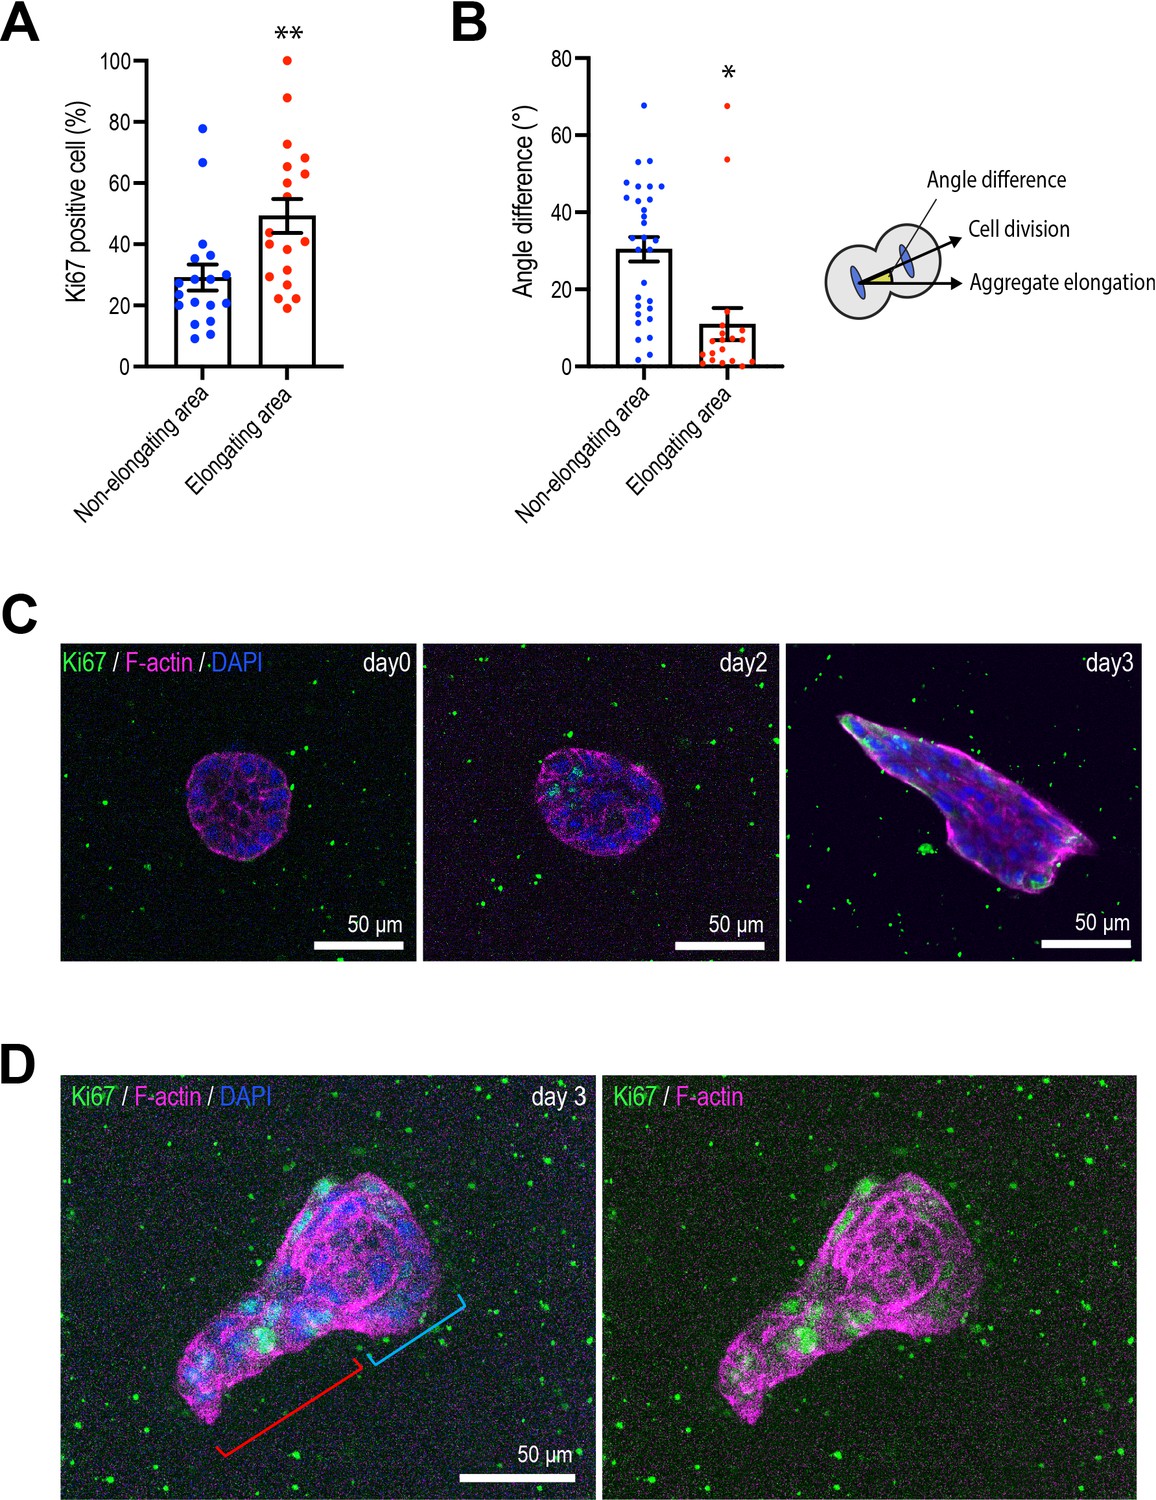
Cell proliferation and division during aggregate elongation.
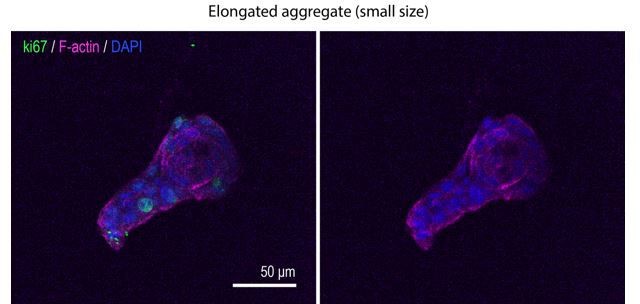
(A) Percentage of Ki67-positive cells at the surface interface with collagen in elongating and non-elongating areas of aggregates (n = 18 aggregates). (B) Average angle of cell division. Principal axis of aggregate is 0° (n = 12 aggregates). (C) Representative fluorescent images of aggregates early in the culture process (0–2 days). Aggregates were co-stained with anti-Ki67 antibody (green), phalloidin (magenta), and DAPI (blue). (D) Small aggregates elongate early in the culture process. A representative aggregate co-stained with anti-Ki67 antibody (green), phalloidin (magenta), and DAPI (blue). Blue parenthesis: non-elongating area; red parenthesis: elongating area. Data in (A, B) represent means ± SEM; ns, not significant, *p<0.05, **p<0.01. Data in (A, B) were analyzed by unpaired Student’s t-test.
Figure 1—figure supplement 3

Cell motility during aggregate elongation.
(A) Nuclear tracking during aggregate elongation. Tails show tracking path for each cell in the last 120 min of the movie. (B) Speed of cell motility based on nuclear tracking in rounded and elongated aggregates treated with mitomycin C or aphidicolin (n = 137 movies). (C) Cell speed, (D) track straightness, and (E) track displacement angle in elongating aggregates (n = 18 movies). (F) Track straightness and (G) track displacement angle of cells in aggregates treated with mitomycin C or aphidicolin (n = 60 movies). Data in (B–G) represent means ± SEM; ns, not significant, *p<0.05, ***p<0.001. Data in (C–E) were analyzed by unpaired Student’s t-test. Data in (B, F, G) were analyzed by one-way ANOVA Tukey’s multiple comparisons test.
Figure 2 with 2 supplements
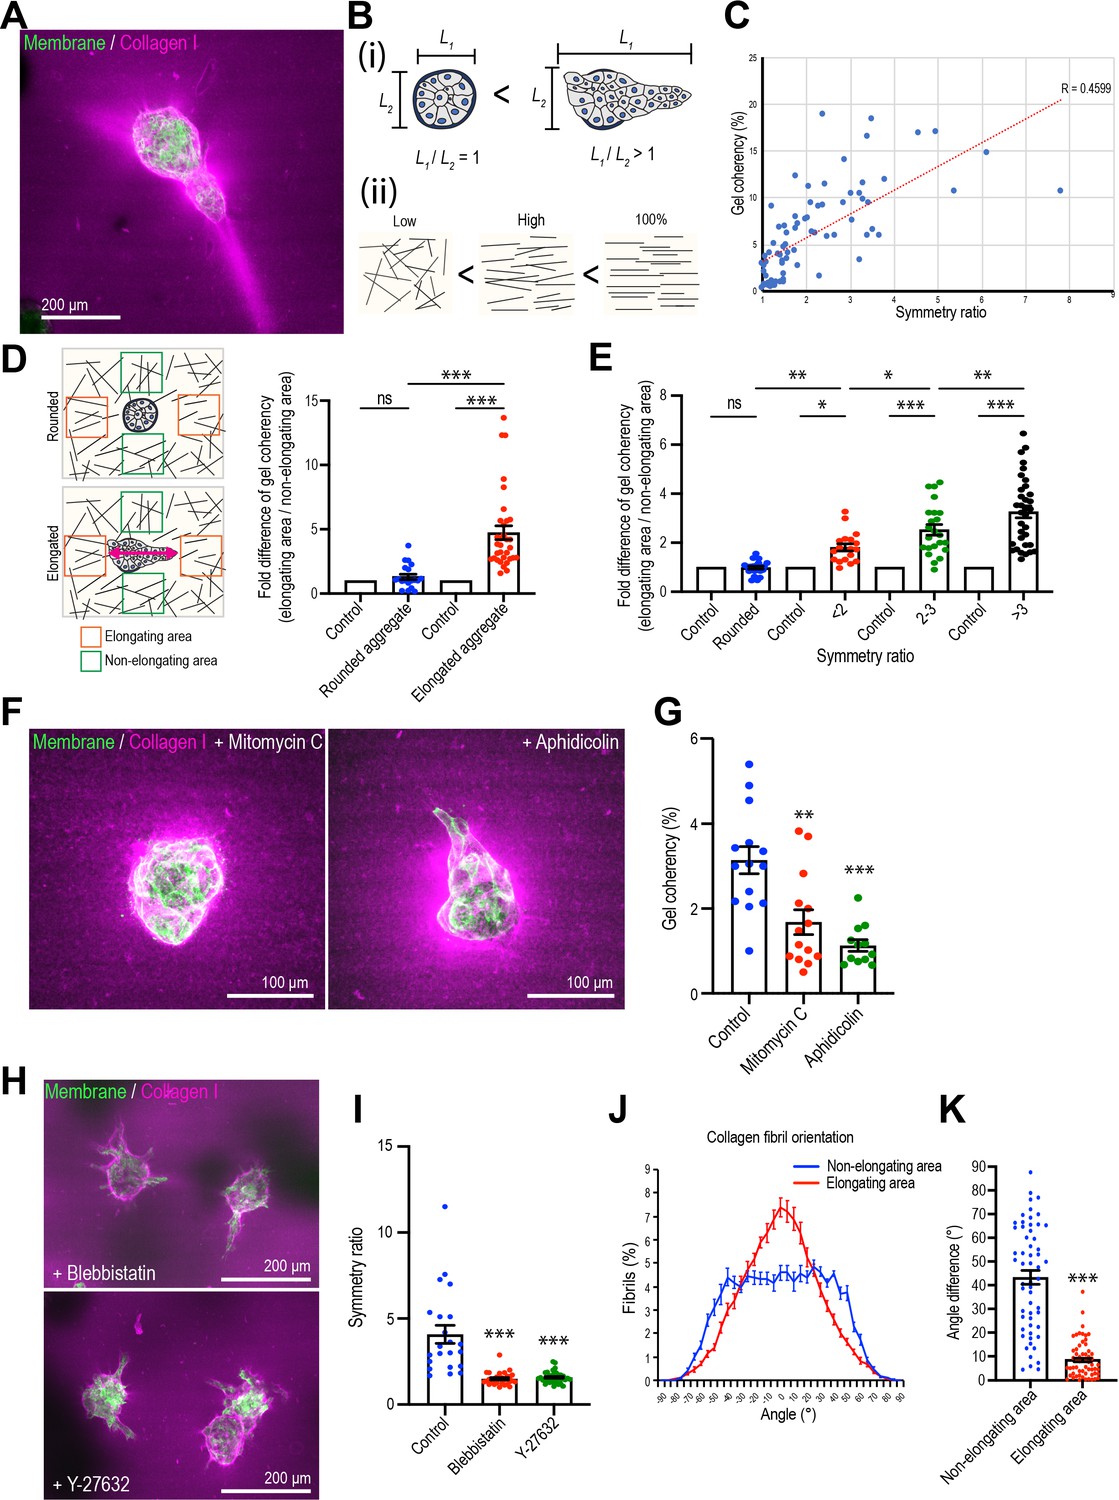
Mammary cell aggregates polarize the extracellular matrix (ECM) as they elongate.
(A) Fluorescent image of collagen fiber alignment and elongated aggregates expressing the cell membrane marker GFP-HRasC20. Collagen fibers are labeled with mCherry-CNA35 peptide (magenta). (B) Cartoon of symmetry ratio of aggregates (i) and gel coherency (ii). (C) Scatter plot of aggregate symmetry ratio and collagen fiber coherency (n = 75 aggregates). (D) Regional analysis of collagen coherency around aggregates. Cartoon illustrates the approach: for elongating aggregates, coherency was measured in regions of interest (ROIs) placed both at the tips of elongations and proximate to their non-rounded areas. For rounded aggregates, ROIs were placed orthogonally. Regional differences in coherency were measured as the fold difference, measured around rounded aggregates (n = 19 aggregates) and elongated aggregates (n = 57 aggregates). Elongated aggregates were defined as symmetry ratio >1.5. Double-headed arrow: elongating axis. (E) Fold difference of collagen fiber coherency around aggregates measured at early stages of elongation (first three days of culture) subdivided based on symmetry ratio (n = 98 aggregates). (F) Fluorescent images of collagen fibers labeled with mCherry-CNA35 (magenta) and aggregates expressing GFP-HRasC20 cultured for 8 days with mitomycin C or aphidicolin. (G) Coherency of collagen fibers surrounding the aggregates treated with mitomycin C and aphidicolin (n = 40 aggregates). (H) Fluorescent images of collagen fiber alignment with aggregates expressing GFP-HRasC20 treated with blebbistatin or Y-27632 for 8 days. Collagen fibrils were labeled with CNA35-mCherry (magenta). (I) Symmetry ratio of aggregates cultured for 8 days with or without blebbistatin or Y-27632 (n = 88 aggregates). (J) Distribution of collagen fiber orientation surrounding elongated aggregates (n = 22 aggregates) or non-elongated aggregates (n = 13 aggregates). (K) Difference between elongation axis of aggregates and average angle of collagen fibers in non-elongating area or elongating area (n = 57 aggregates). All data are means ± SEM, ns, not significant, *p<0.05, **p<0.01, ***p<0.001. Data in (D, E, G, I) were analyzed by one-way ANOVA Tukey’s multiple comparisons test. Data in (K) were analyzed by unpaired Student’s t-test.
-
Figure 2—source data 1
Original data for quantitative analysis in Figure 2.
- https://cdn.elifesciences.org/articles/67915/elife-67915-fig2-data1-v2.xlsx
Figure 2—figure supplement 1
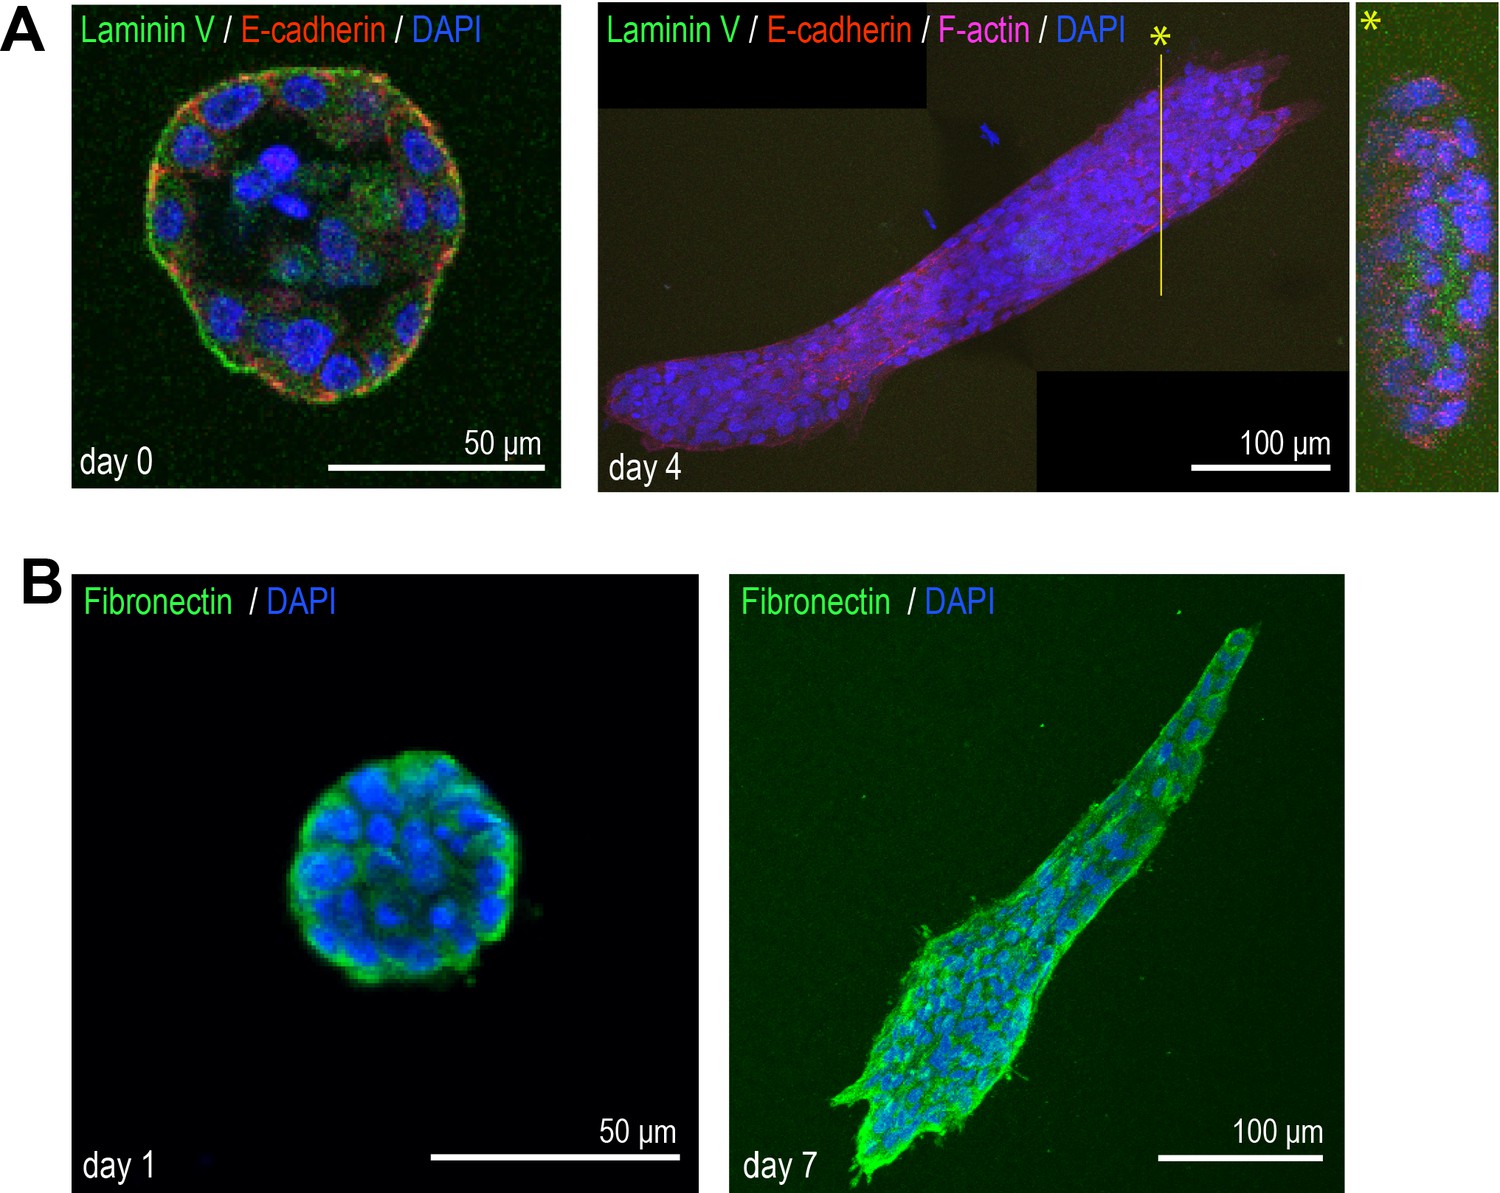
Immunofluorescent staining of extracellular matrix (ECM) proteins in the aggregates.
(A) MCF10A aggregates transferred from Matrigel into collagen gel at days 0 (left) and 4 (right). Day 0 aggregate was co-stained with anti-laminin V antibody (green), anti-E-cadherin antibody (red), and DAPI (blue). Day 4 aggregate was co-stained with anti-laminin V antibody (green), anti-E-cadherin antibody (red), phalloidin (magenta), and DAPI (blue). *Y-Z slice image of yellow line. (B) MCF10A aggregates transferred from Matrigel into collagen gel at days 1 (left) and 7 (right). Aggregates were co-stained with anti-fibronectin antibody (green) and DAPI (blue).
Figure 2—figure supplement 2
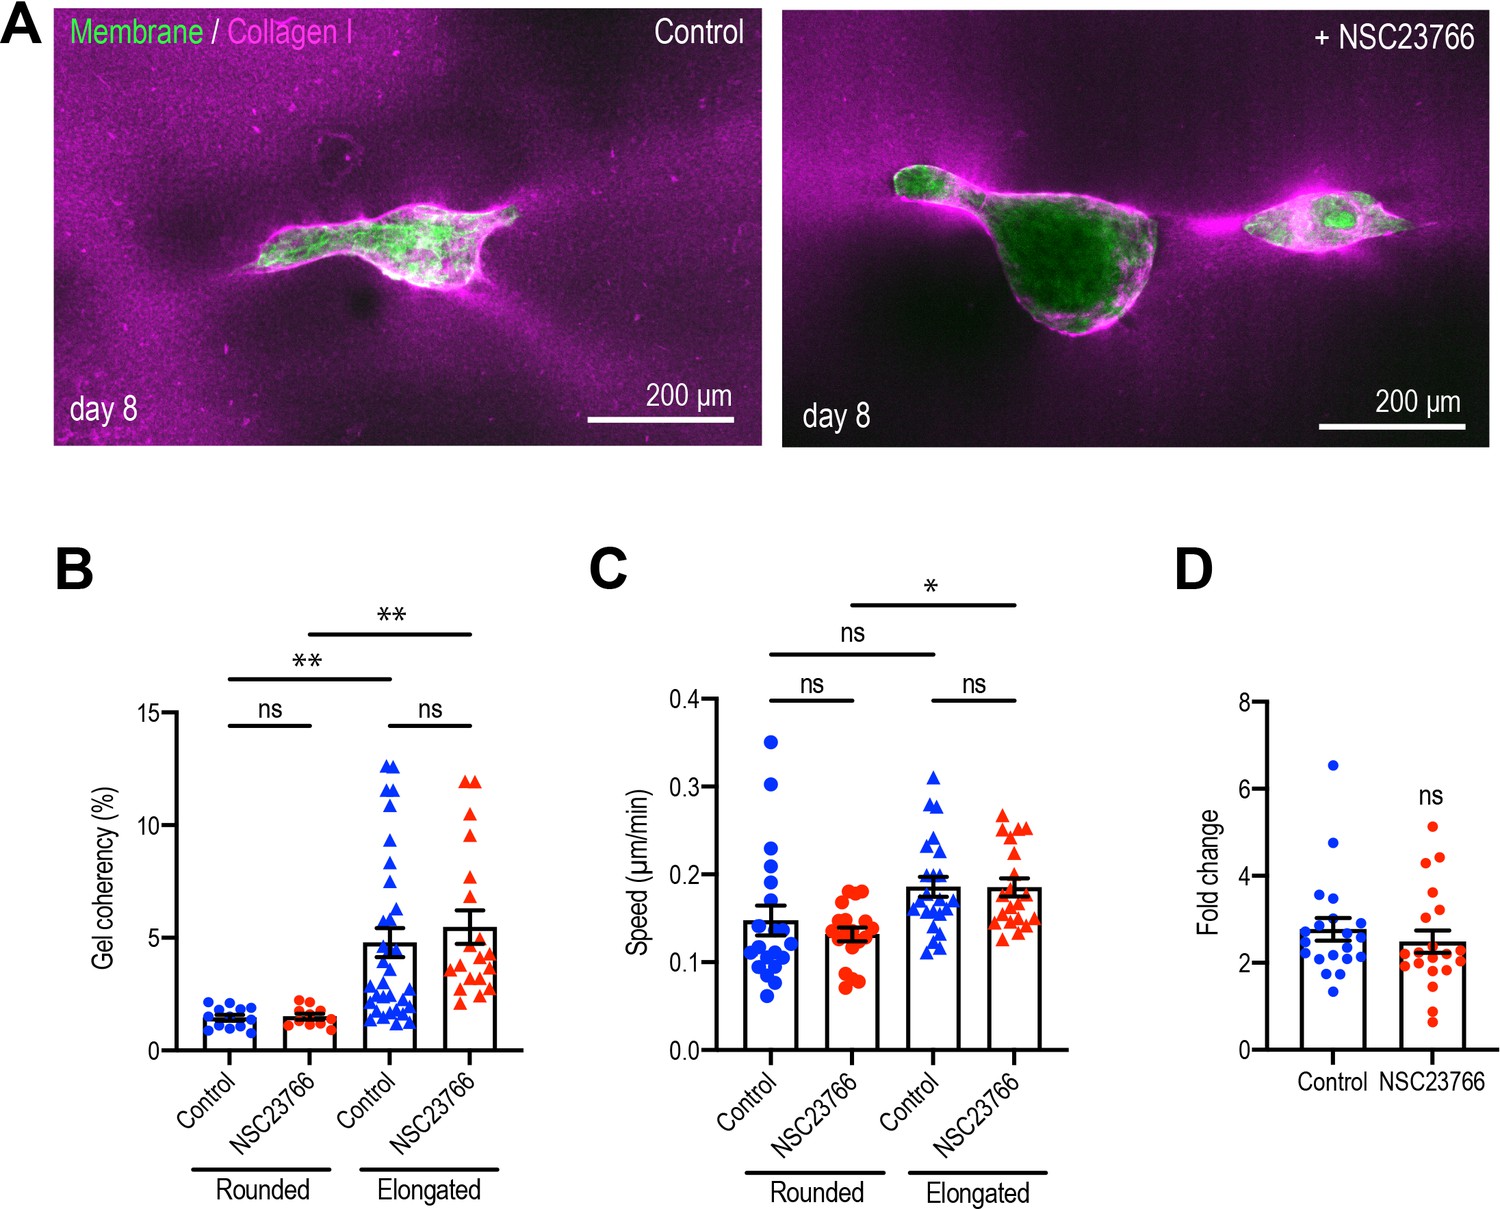
Rac1 GEF inhibitor does not affect MCF10A aggregate elongation.
(A) Fluorescent images of collagen fiber alignment with aggregates expressing GFP-HRasC20 treated with NSC23766 for 8 days. Collagen fibers were labeled with mCherry-CNA35 (magenta). (B) Speed of cell movement based on nuclear tracking in rounded and elongated aggregates treated with NSC23766 (n = 82 movies). (C) Effect of delayed inhibition of proliferation on aggregate elongation. Aggregates were cultured for 3 days before treatment with NSC23766. Data are fold change of elongation in control and drug-treated cultures (n = 40 aggregates). Data in (B–D) represent means ± SEM; ns, not significant, *p<0.05, **p<0.01. Data in (B, C) were analyzed by one-way ANOVA Tukey’s multiple comparisons test. Data in (D) were analyzed by unpaired Student’s t-test.
Figure 3 with 2 supplements
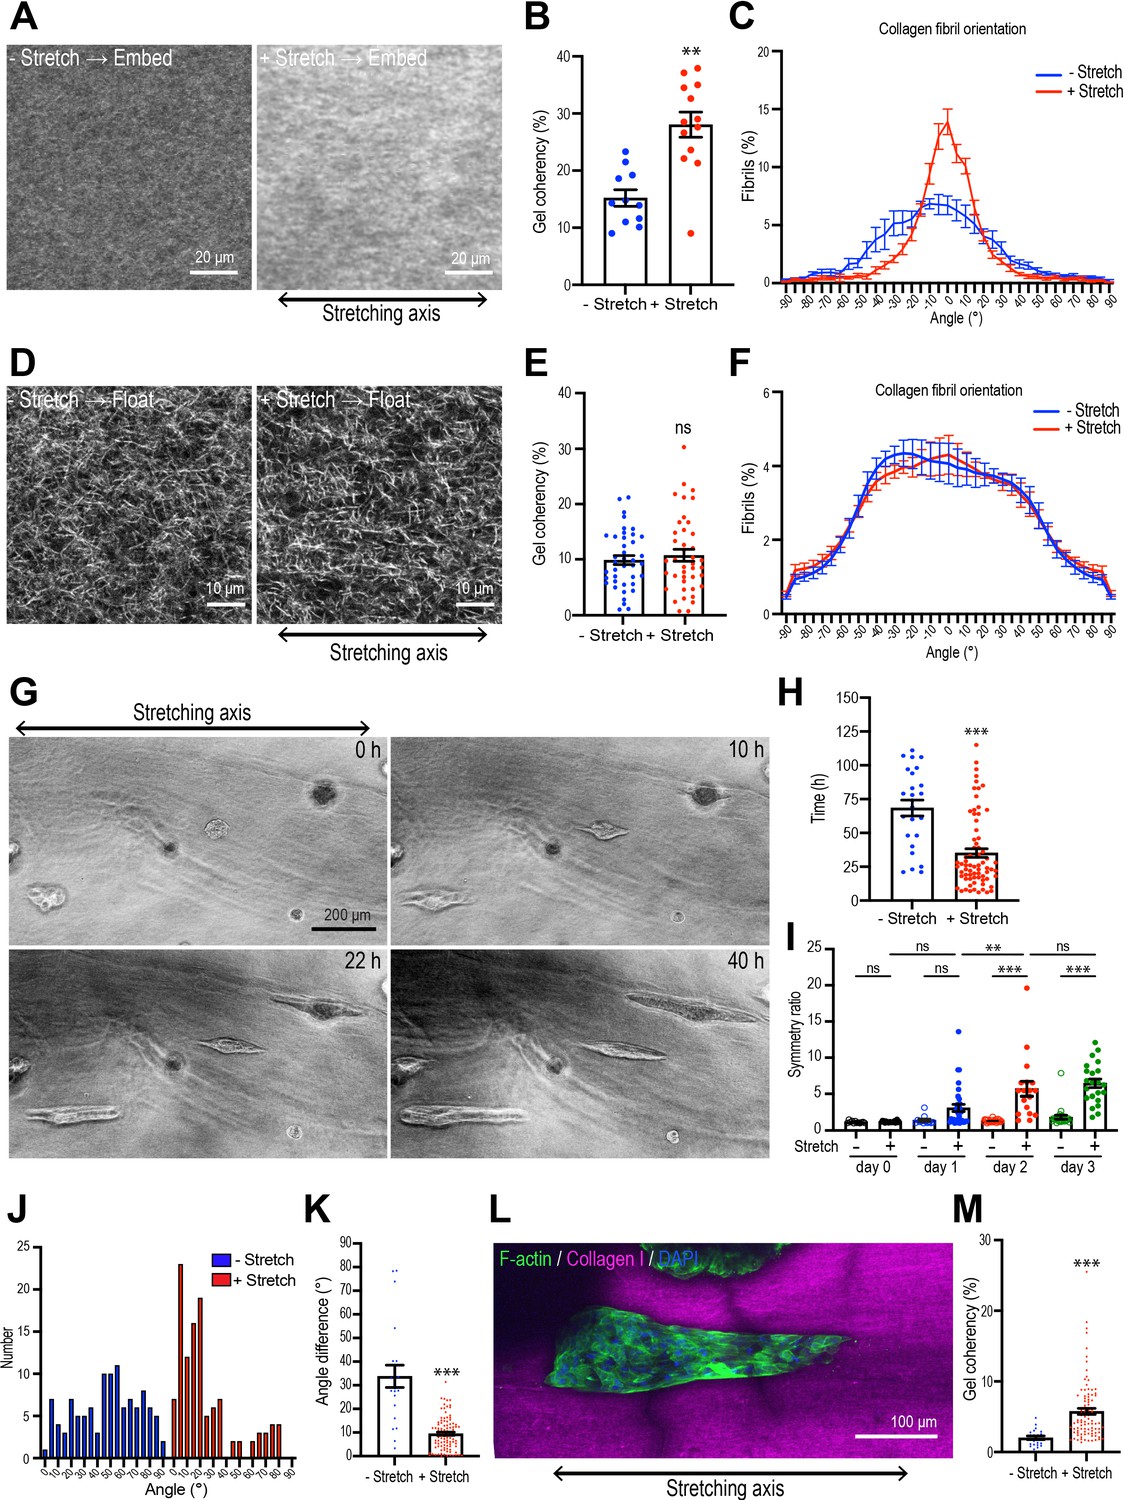
Collagen polarization induces mammary aggregate elongation.
(A) Second harmonic generation (SHG) images of collagen fibers in the gel with or without stretching and incubated for 7 days after re-embedding in gel. Double-headed arrow: stretching axis. (B) Coherency of collagen fiber in the gel with or without stretching (n = 24 positions in multiple gels). (C) Distribution of collagen fiber orientation in the gel with or without stretching. 0o is defined as the axis of stretch (N = 3 independent experiments). (D) SHG images of collagen fiber floated for 7 days with or without after stretching. Double-headed arrow: stretching axis. (E) Coherency of collagen fiber in 7 days floated gel with or without stretching (n = 46 positions in multiple gels). (F) Distribution of collagen fiber orientation in gels that had been allowed to float (7 days) with or without prior stretching (N = 3 independent experiments). (G) Time-lapse images of aggregates embedded in stretched gel. Double-headed arrow: stretching axis. (H) Initiation time of aggregate elongation in the gel with or without stretching (– stretch: n = 25 aggregates, +stretch: n = 71 aggregates). (I) Symmetry ratio of aggregates in the early phase of culture (0–3 days) with or without stretching (–stretch, day 0: n = 12; day 1: n = 12; day 2: n = 24; day 3: n = 24; +stretch, day 0: n = 21; day 1: n = 32; day 2: n = 17; day 3: n = 22). (J) Distribution of elongation axes of aggregates in the gel with or without stretching (–stretch: n = 112 aggregates, +stretch: n = 115 aggregates). (K) Difference between elongating axis of aggregates and average angle of collagen fibers in the gel with or without stretching (–stretch: n = 21 aggregates, +stretch: n = 102 aggregates). (L) Fluorescence image of aggregates cultured for 5 days after gel stretching and co-stained with phalloidin (green) and DAPI (blue) in stretched gel. Collagen fibrils were labeled with CNA35-mCherry (magenta). (M) Coherency of collagen fibers surrounding elongated aggregates in the gel with or without stretching (–stretch: n = 21 aggregates, +stretch: n = 102 aggregates). All data are means ± SEM; ns, not significant, **p<0.01, ***p<0.001. Data in (B, E, H, K, M) were analyzed by unpaired Student’s t-test. Data in (I) were analyzed by one-way ANOVA Tukey’s multiple comparisons test.
-
Figure 3—source data 1
Original data for quantitative analysis in Figure 3.
- https://cdn.elifesciences.org/articles/67915/elife-67915-fig3-data1-v2.xlsx
Figure 3—figure supplement 1
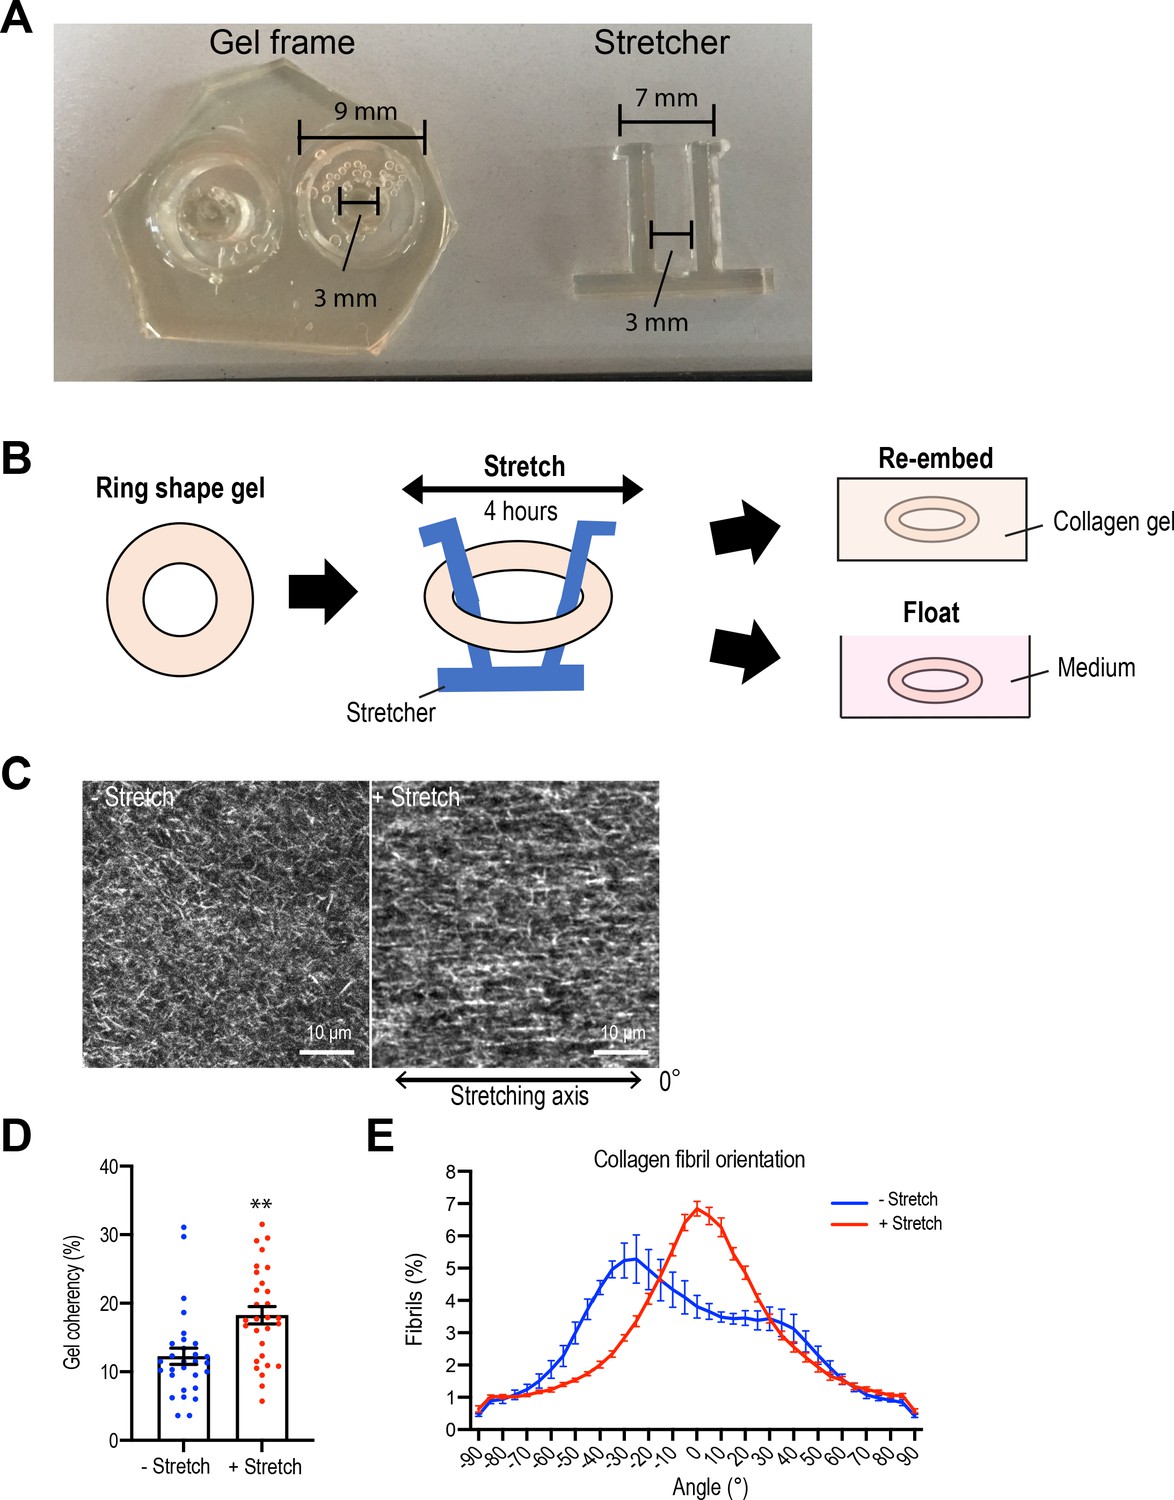
External gel stretching aligns collagen fiber.
(A) Polydimethylsiloxane (PDMS) gel frame and stretching device. (B) Schematic image of stretching experiment. Gel was stretched for 4 hr and then re-embedded in gel or floated in culture medium for 7 days. (C) Second harmonic generation microscopy images of collagen gel with or without stretch. Double-headed arrow: stretching axis. (D) Coherency of collagen fibers in gel and (E) distribution of fiber orientation (N = 4 independent experiments). Data in (D, E) represent means ± SEM; **p<0.01, ***p<0.001. Data were analyzed by unpaired Student’s t-test.
Figure 3—figure supplement 2
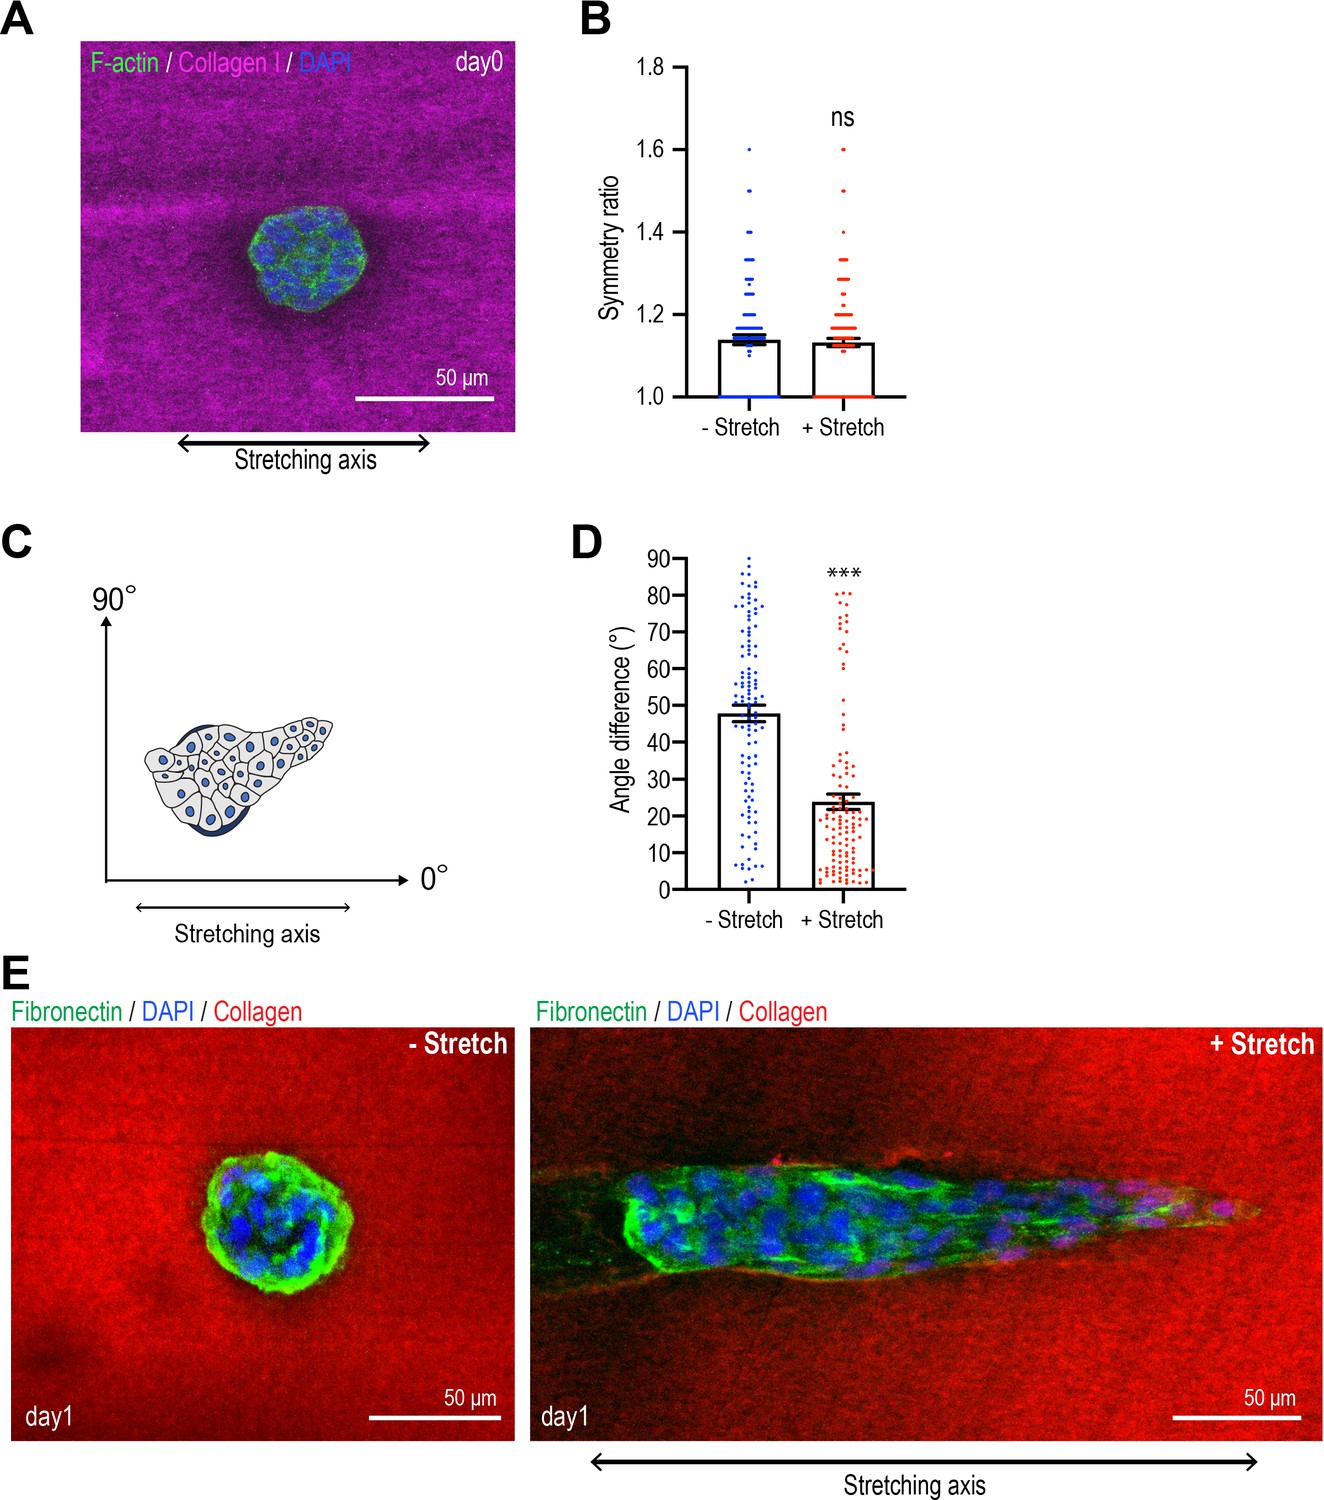
MCF10A aggregates elongate along the gel stretching axis.
(A) MCF10A aggregates in the gel after 4 hr stretching. Aggregate was co-stained with phalloidin (green) and DAPI (blue). Collagen fibers were labeled with mCherry-CNA35 (magenta). (B) Symmetry ratio of aggregates with or without gel stretching for 4 hrours (n = 274 aggregates). (C) Schematic image of measurement of elongation angle. (D) The average angle of elongated aggregates in non-stretched gel and stretched gel (n = 227 aggregates). (E) MCF10A aggregates cultured for 1 day in non-stretched and stretched gels. Aggregates were co-stained with anti-fibronectin antibody (green), phalloidin (magenta), and DAPI (blue). Collagen fibrils were labeled with CNA35-mCherry (red). Data in (B, D) represent means ± SEM; ns, not significant, ***p<0.001. Data were analyzed by unpaired Student’s t-test.
Figure 4
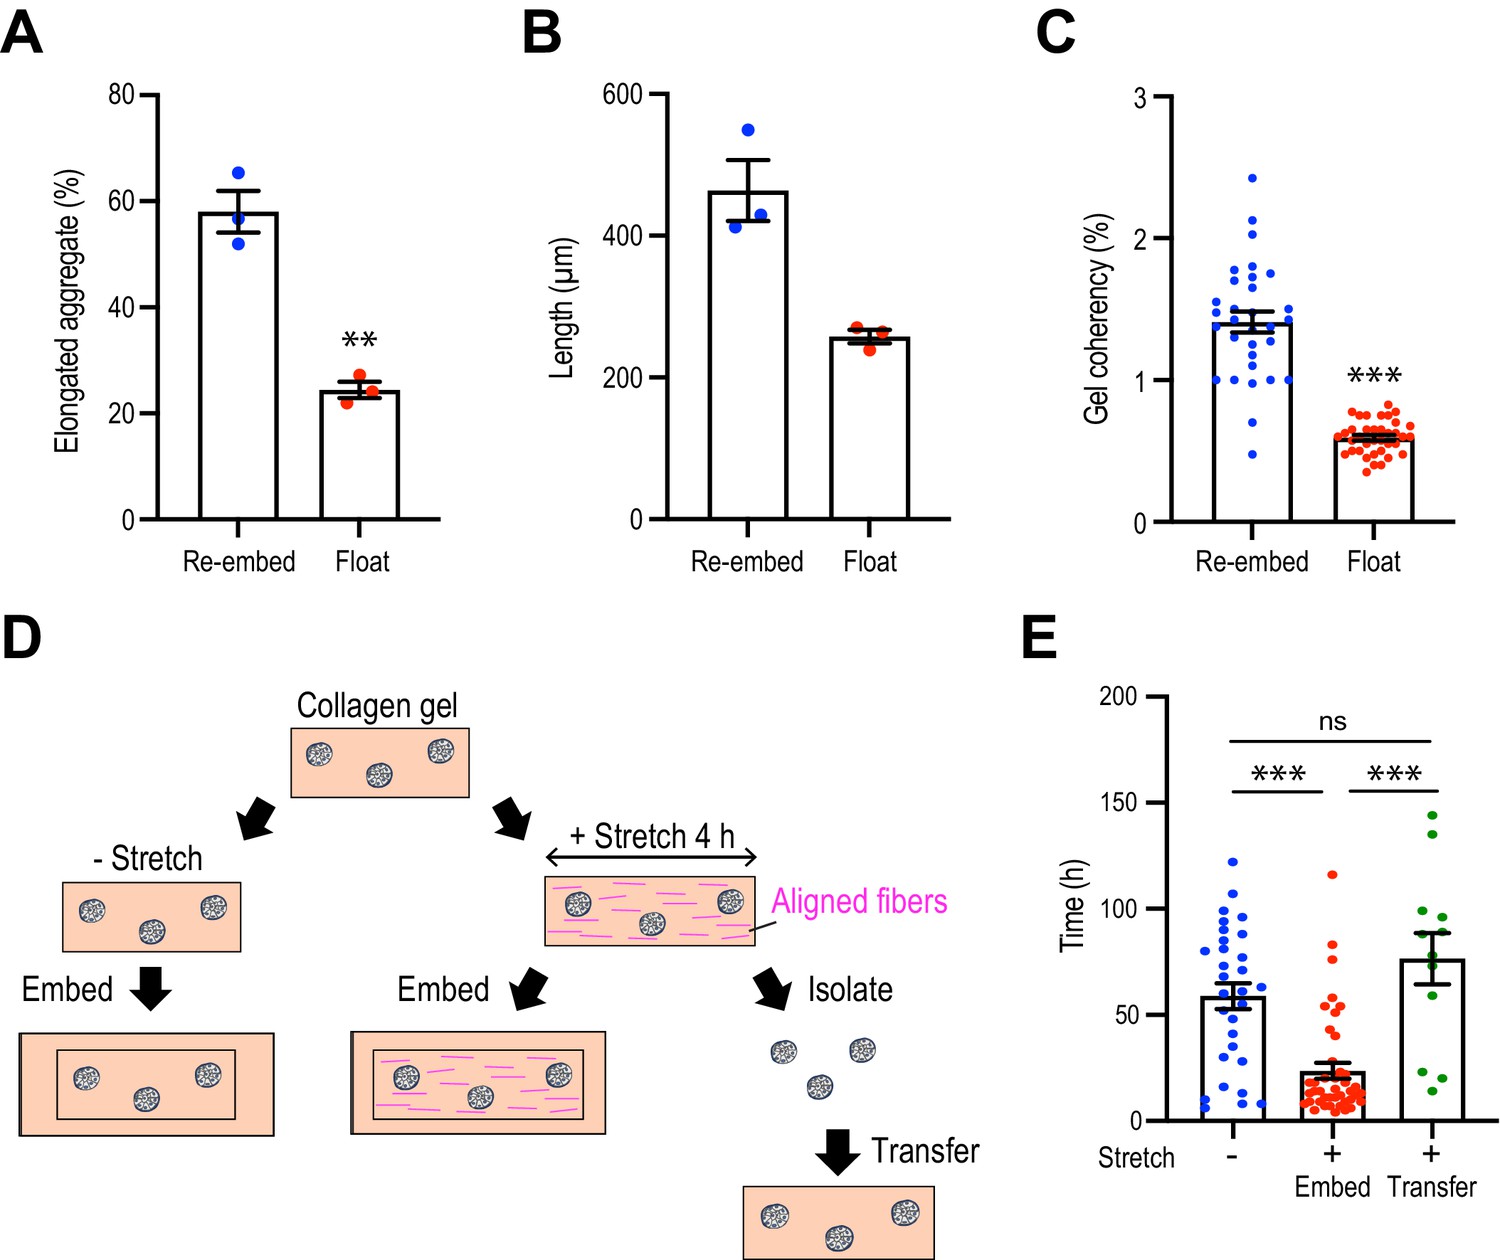
Collagen polarization must be sustained to stimulate mammary aggregate elongation.
(A) Population of elongated aggregates in the re-embedded or floated gel (N = 3 independent experiments). (B) The length of elongated aggregates in the re-embedded or floated gel (N = 3 independent experiments). (C) Coherency of collagen fibers surrounding the aggregates in gels that were re-embedded after stretch or floated for 7 days after stretching (n = 68 aggregates). (D) Cartoon of aggregate from stretched gel into normal collagen gel. Aggregates were isolated from stretched gel by collagenase and re-embedded in naïve gel. (E) Initiation time for aggregate elongation in non-stretched control gels, stretched gels that had been re-embedded to preserve collagen polarization (embed) and after cells were extracted and transferred into non-stretched gels (transfer) (n = 83 aggregates). All data are means ± SEM; ns, not significant, **p<0.01, ***p<0.001. Data in (A–C) were analyzed by unpaired Student’s t-test. Data in (E) were analyzed by one-way ANOVA Tukey’s multiple comparisons test.
-
Figure 4—source data 1
Original data for quantitative analysis in Figure 4.
- https://cdn.elifesciences.org/articles/67915/elife-67915-fig4-data1-v2.xlsx
Figure 5 with 1 supplement
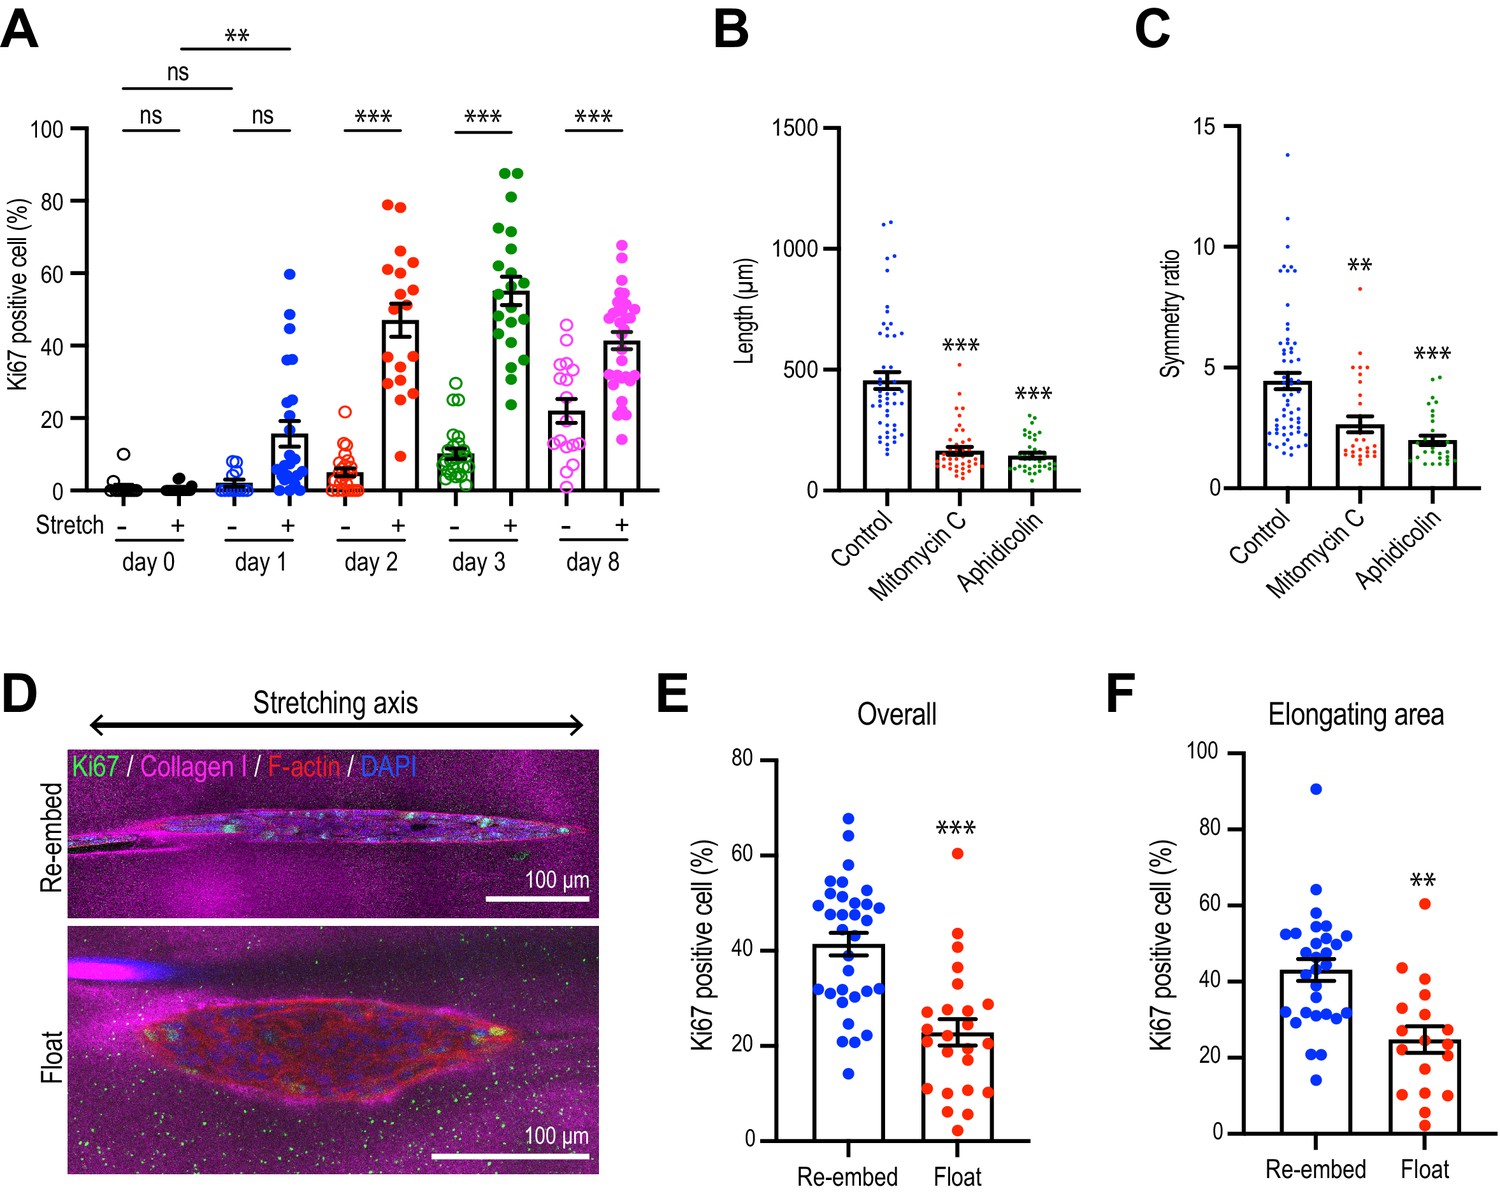
Collagen polarization induces cell proliferation for aggregate elongation.
(A) Time course of cell proliferation within aggregates in control gels (–stretch) or after stretching (+stretch). Data were percentage of cells that were Ki67-positive (n = 206 aggregates). (B, C) Length (B) and (C) symmetry ratio of aggregates in stretched gel incubated with mitomycin C or aphidicolin for 8 days (n = 214 aggregates). (D) Fluorescence images of elongated aggregates cultured for 7 days in the re-embedded or floated gel after stretching. Aggregates were co-stained with anti-Ki67 antibody (green), phalloidin (red), and DAPI (blue). Collagen fibers were labeled with mCherry-CNA35 (magenta). (E) Percentage of Ki67 positive cells in the aggregates cultured for 7 days in the re-embedded or floated gel after stretching. (n = 56 aggregates). (F) Percentage of Ki67-positive cells in the elongating area of aggregates in the re-embedded or floated gel (n = 47 aggregates). All data are means ± SEM; ns, not significant, **p<0.01, ***p<0.001. Data in (E, F) were analyzed by unpaired Student’s t-test. Data in (A–C) were analyzed by one-way ANOVA Tukey’s multiple comparisons test.
-
Figure 5—source data 1
Original data for quantitative analysis in Figure 5.
- https://cdn.elifesciences.org/articles/67915/elife-67915-fig5-data1-v2.xlsx
Figure 5—figure supplement 1
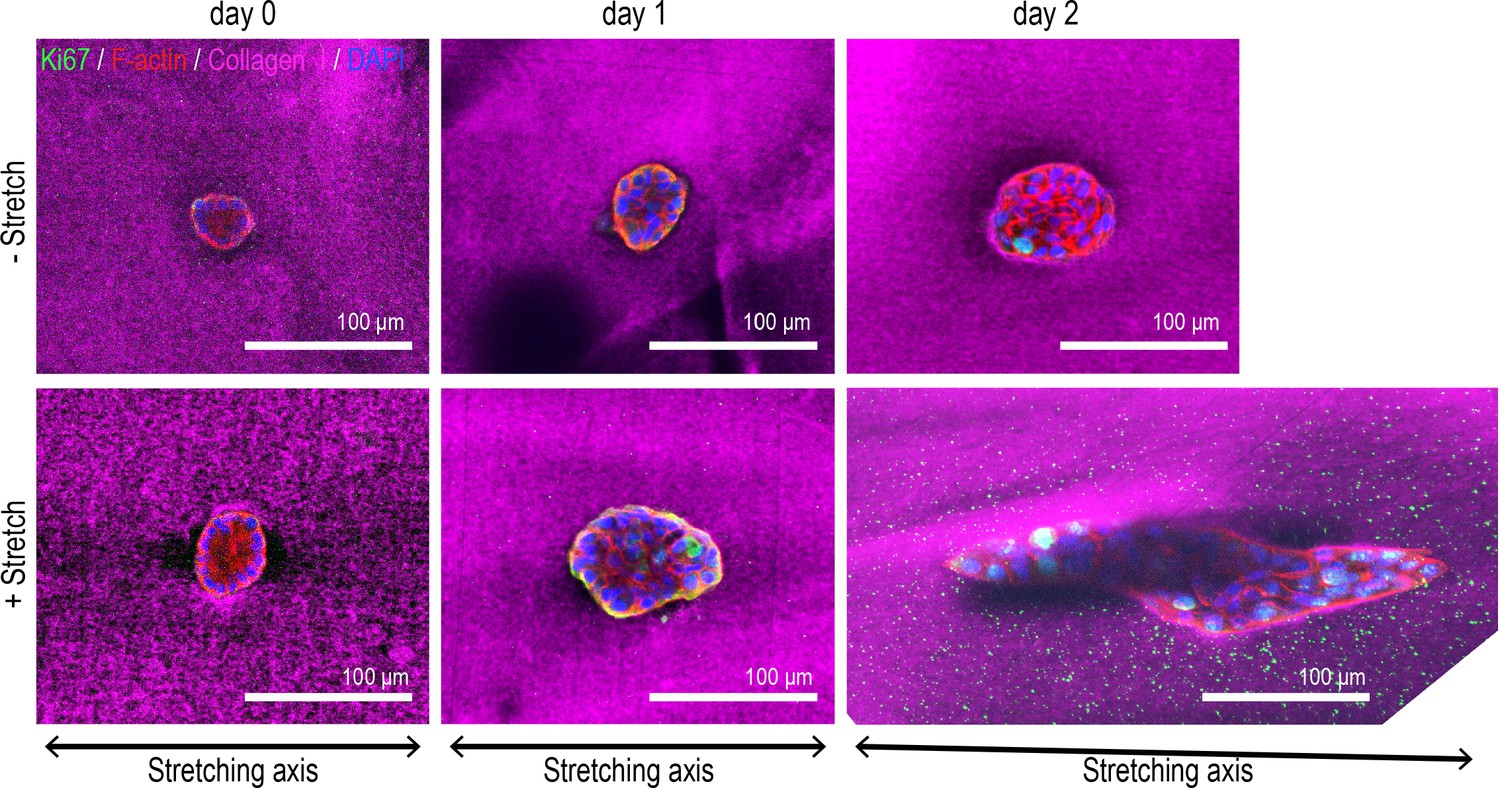
Representative images for Figure 5A.
Fluorescent images of aggregates cultured for 0–2 days in control gel (non-stretched gel) or stretched gel. Aggregates were co-stained with anti-Ki67 antibody (green), phalloidin (red), and DAPI (blue). Collagen fibers were labeled with mCherry-CNA35 (magenta).
Figure 6 with 1 supplement
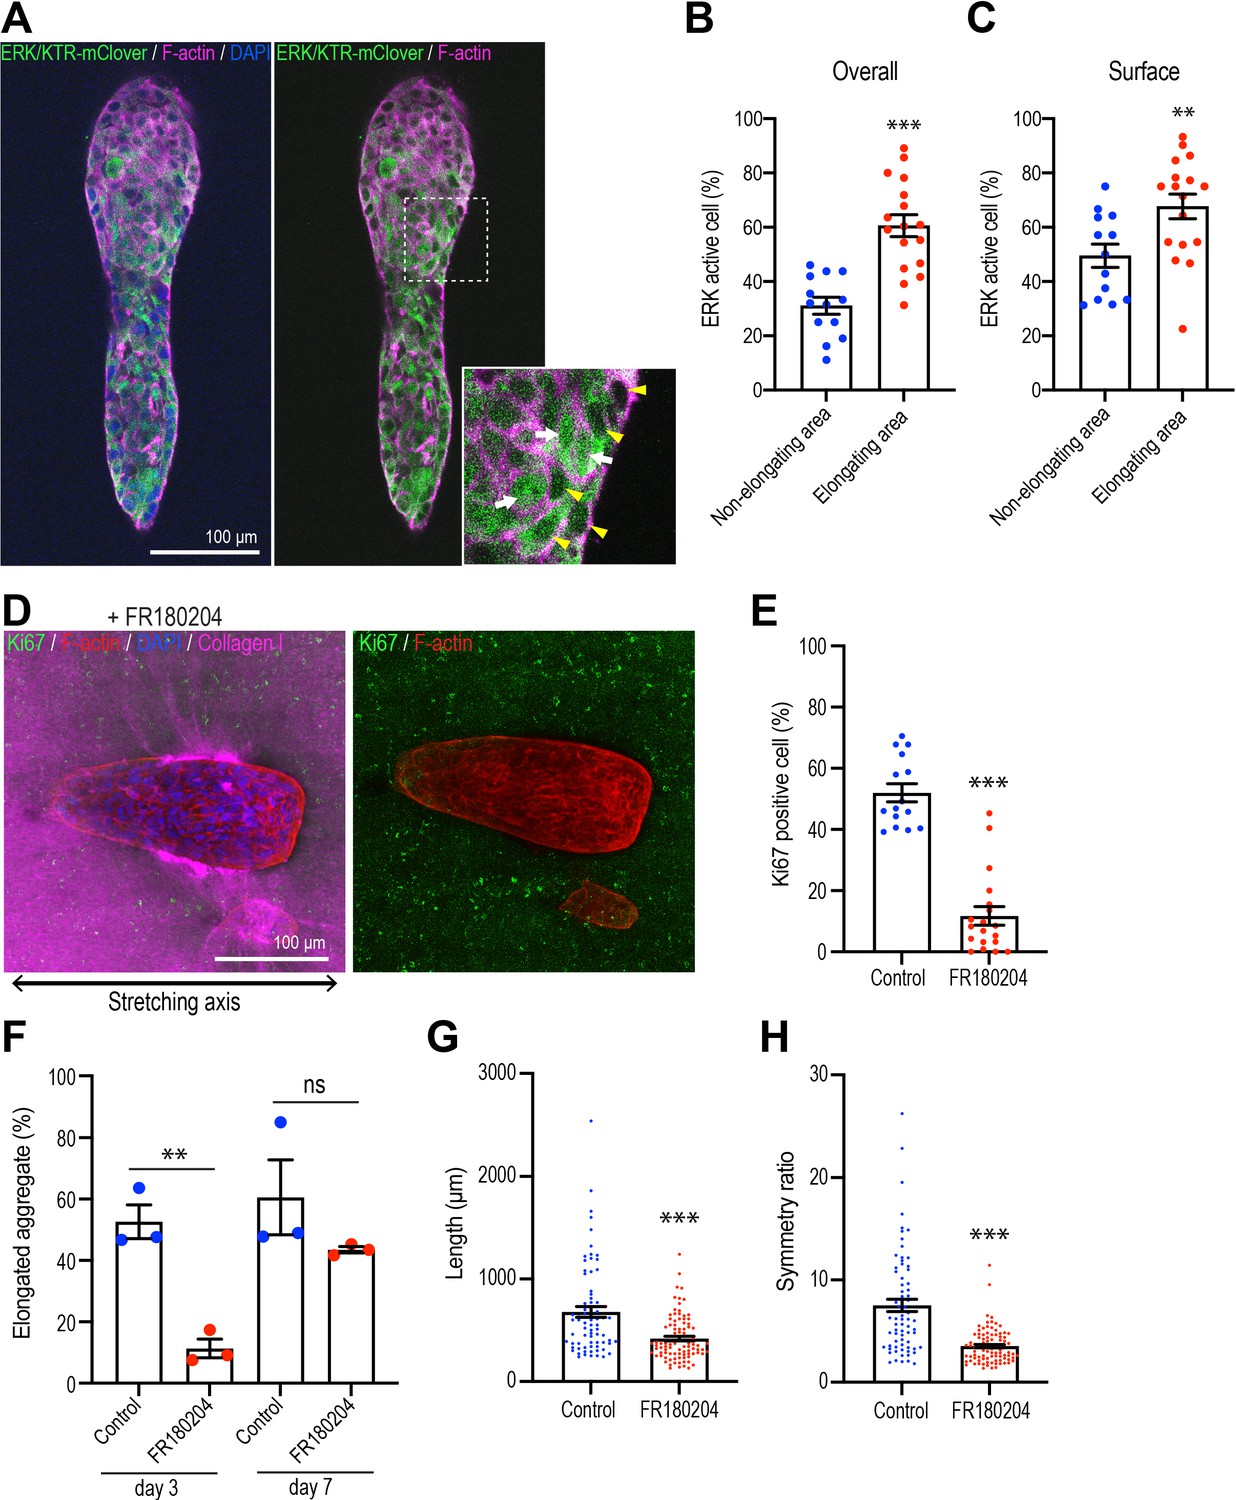
Polarized collagen promotes cell proliferation via the ERK pathway.
(A) Fluorescent images of aggregates expressing ERK/KTR-mClover biosensor cultured for 7 days and stained with phalloidin (magenta) and DAPI (blue). Cells that showed nuclear exclusion of the biosensor (yellow arrowheads) were scored as ERK-activated, while cells that showed both nuclear and cytoplasmic localization of the sensor (white arrows) were scored as inactive. (B) Percentage of ERK active cells in elongating areas and non-elongating areas of the aggregates (n = 30 aggregates). (C) Percentage of ERK active cells at the surface in elongating and non-elongating areas of aggregates (n = 30 aggregates). (D) Fluorescent images of aggregates cultured for 7 days treated with FR180207 after gel stretching. Aggregates were co-stained with anti-Ki67 antibody (green), phalloidin (red), and DAPI (blue). Collagen fibers were labeled with mCherry-CNA35 (magenta). (E) Percentage of Ki67-positive cells in aggregates incubated with FR180207 for 7 days after stretching (n = 24 aggregates). (F) Effect of inhibiting ERK on stretch-induced aggregate elongation. Proportion of elongated aggregates in stretched gel incubated with FR180207 for 3 days and 7 days (N = 3 independent experiments). (G) Length and (H) symmetry ratio of elongated aggregates incubated with FR180207 for 7 days (n = 166 aggregates). All data are means ± SEM; ns, not significant, **p<0.01, ***p<0.001. Data in (B, C, E, H) were analyzed by unpaired Student’s t-test.
-
Figure 6—source data 1
Original data for quantitative analysis in Figure 6.
- https://cdn.elifesciences.org/articles/67915/elife-67915-fig6-data1-v2.xlsx
Figure 6—figure supplement 1
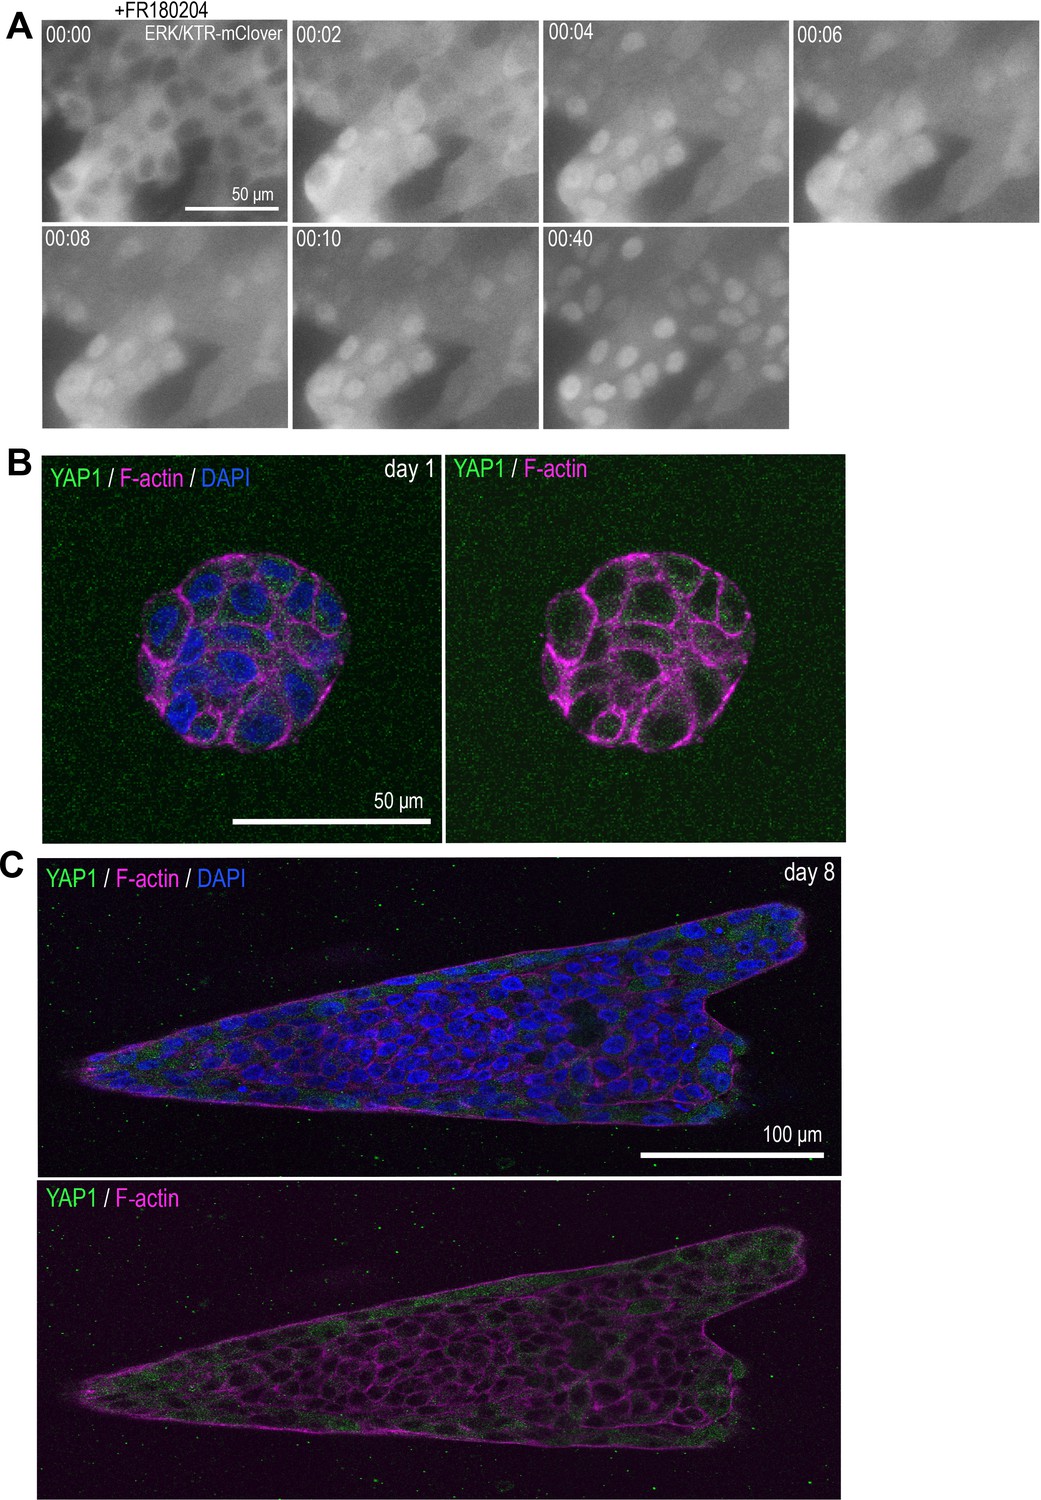
ERK biosensor and YAP1 localization in MCF10A cells.
(A) Time-lapse images of MCF10A monolayer cells that express ERK/KTR-mClover biosensor treated with ERK inhibitor (FR180204). (B) YAP1 localization in rounded MCF10A aggregate cultured for 1 day after transfer into collagen gel. (C) YAP1 localization in elongated MCF10A aggregate cultured for 8 days after transfer into collagen gel. Aggregates in (B, C) were co-stained with anti-YAP1 antibody (green), phalloidin (magenta), and DAPI (blue).
Figure 7
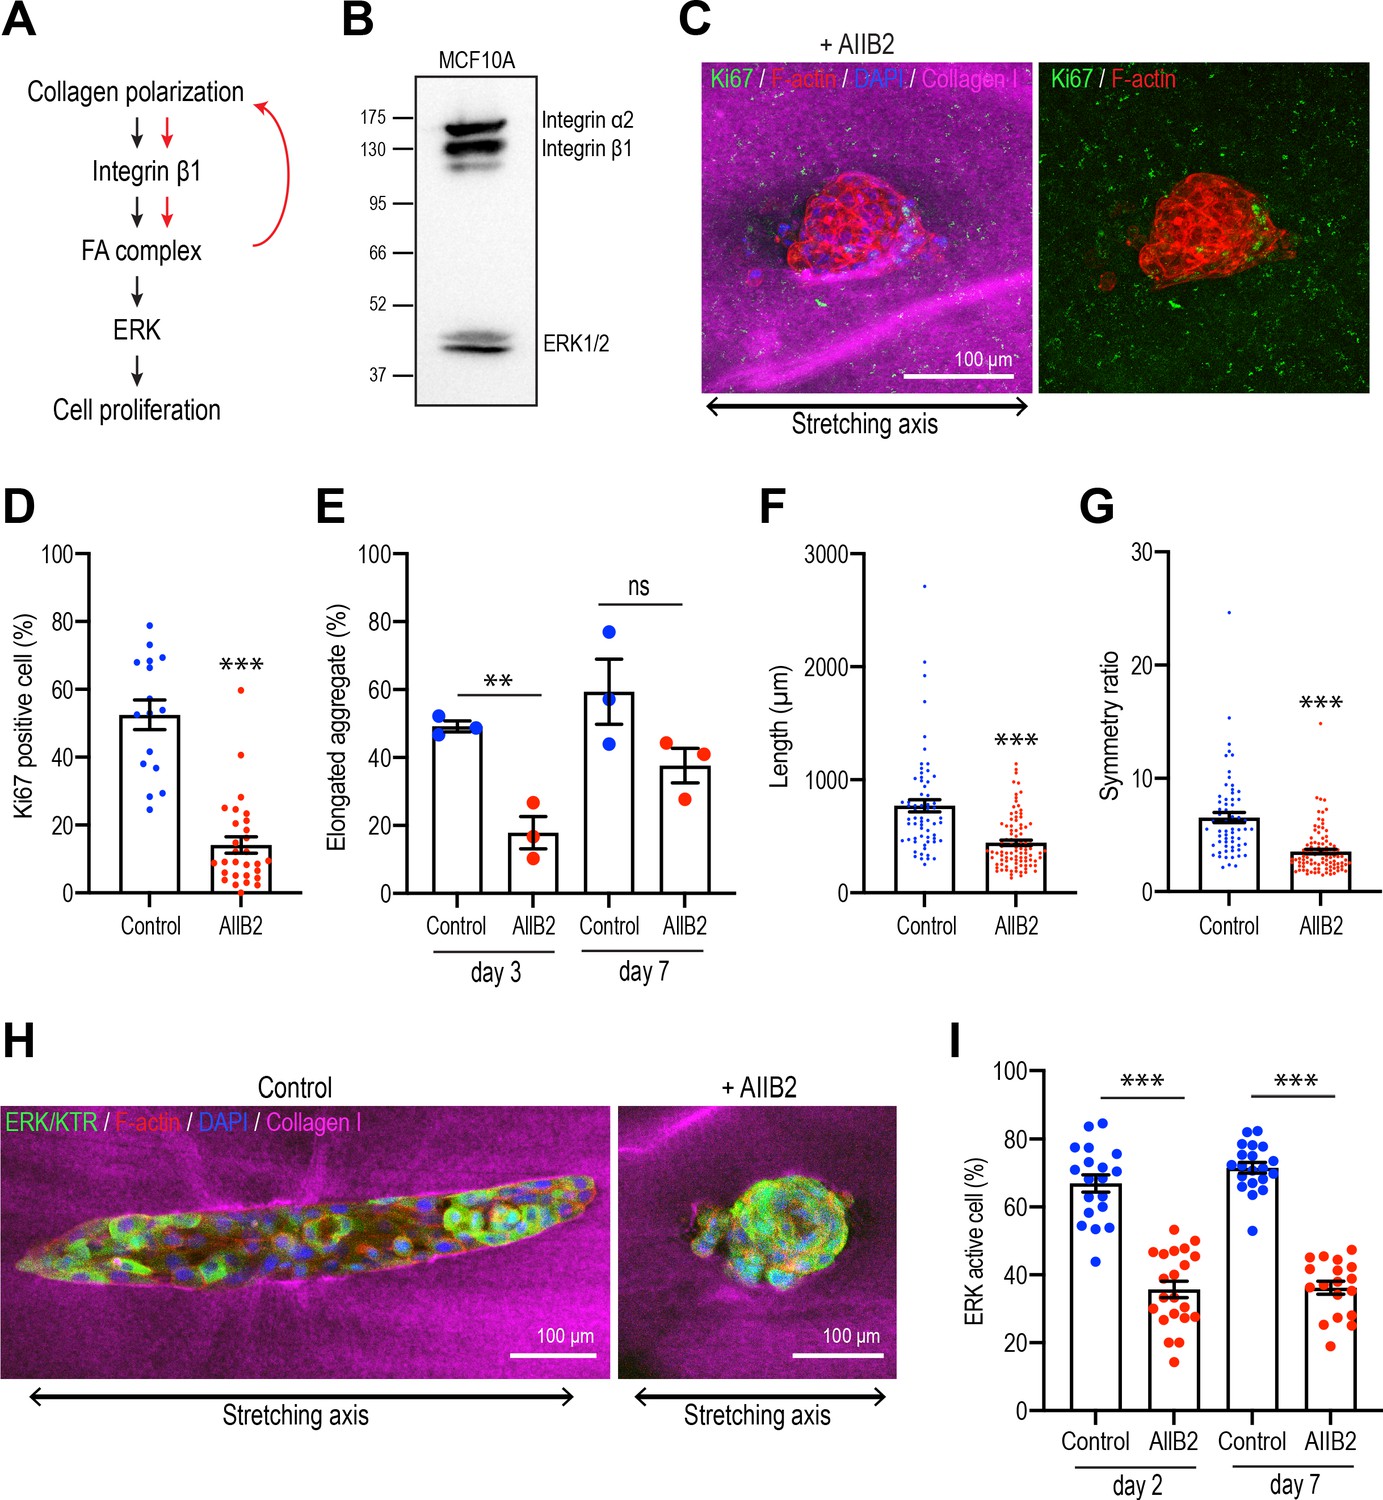
Integrins are necessary for polarized collagen to stimulate elongation.
(A) Schematic of potential integrin-ERK pathway that mediates the effect of collagen polarization on cell proliferation. (B) Immunoblot of integrin α2, β1, and ERK1/2 protein levels in MCF10A cell lysate. (C) Fluorescent images of aggregates cultured for 7 days treated with AIIB2 antibody after gel stretching. Aggregates were co-stained with anti-Ki67 antibody (green), phalloidin (red), and DAPI (blue). Collagen fibers were labeled with mCherry-CNA35 (magenta). (D) Percentage of Ki67-positive cells in the aggregates incubated with AIIB2 antibody for 7 days after stretching the gels (n = 35 aggregates). (E) Proportion of elongated aggregates in stretched gel incubated with AIIB2 antibody for 3 days and 7 days (N = 3 independent experiments). (F) Length and (G) symmetry ratio of elongated aggregates incubated with AIIB2 antibody for 7 days (n = 134 aggregates). (H) Fluorescent images of aggregates expressed with ERK/KTR-mClover and incubated with IgG (control) or AIIB2 antibody for 2 days after gel stretching. Aggregates were co-stained with phalloidin (red) and DAPI (blue). Collagen fibers were labeled with mCherry-CNA35 (magenta). (I) Percentage of ERK active cells in aggregates incubated with AIIB2 antibody for 2 days or 7 days in stretched gel (n = 78 aggregates). All data are means ± SEM; ns, not significant, **p<0.01, ***p<0.001. Data in (D–G, I) were analyzed by unpaired Student’s t-test.
-
Figure 7—source data 1
Original data for quantitative analysis in Figure 7.
- https://cdn.elifesciences.org/articles/67915/elife-67915-fig7-data1-v2.xlsx
-
Figure 7—source data 2
Original image of western blot in Figure 7B.
- https://cdn.elifesciences.org/articles/67915/elife-67915-fig7-data2-v2.zip
Figure 8
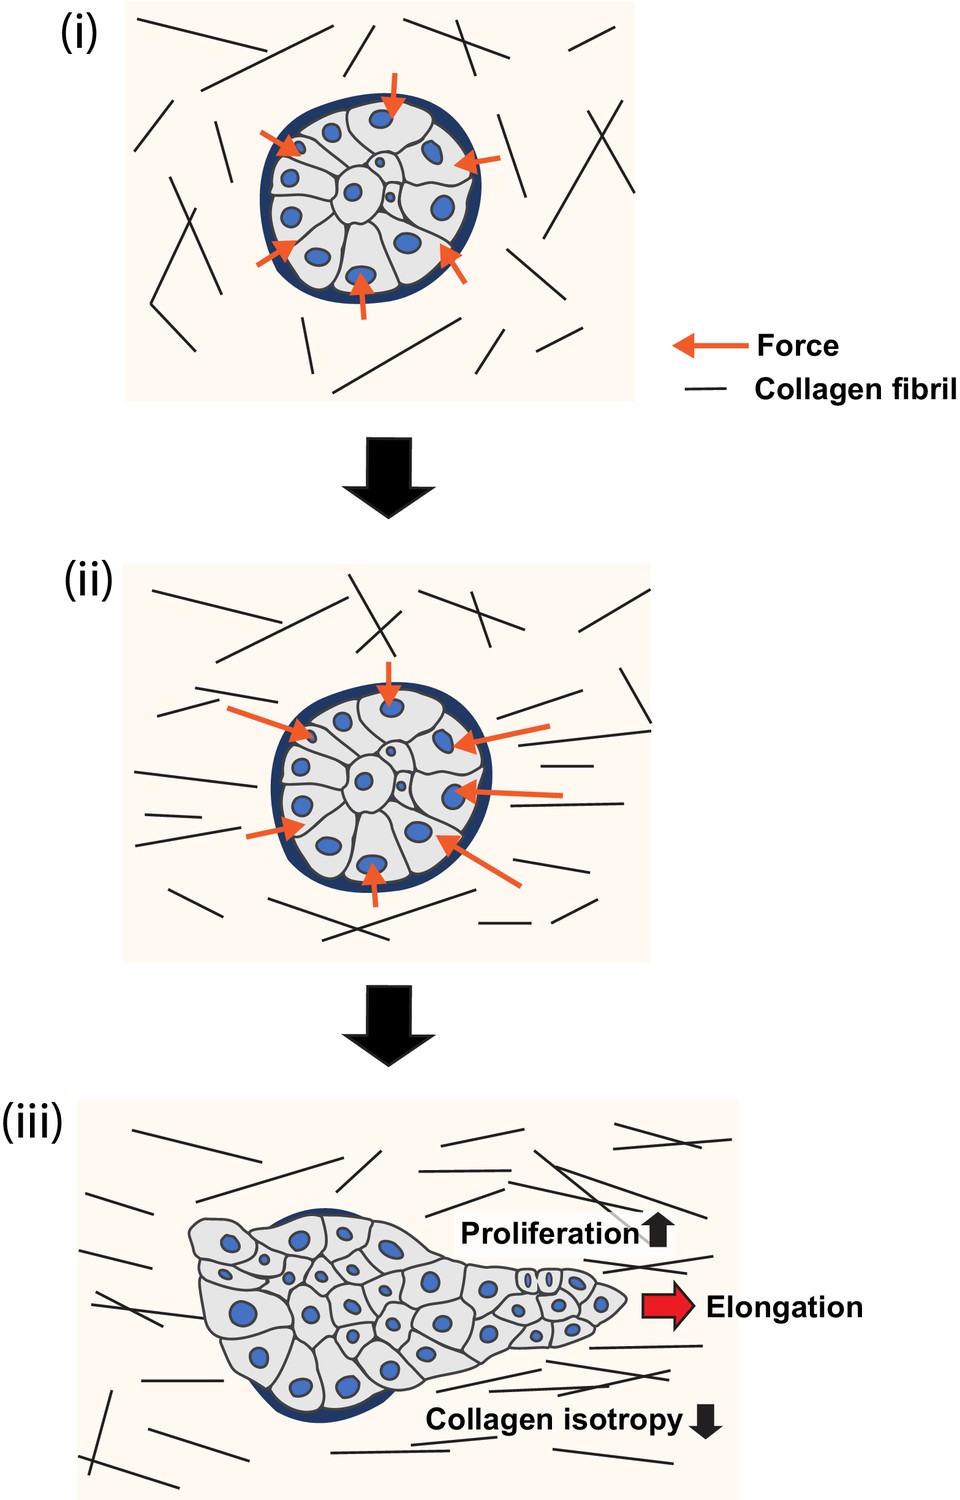
Model of collagen polarization as a structural memory for epithelial anlage elongation.
(i) Initially isotropic epithelia anlage exert isotropic patterns of force on a non-polarized collagen 1 gel. (ii) Initial anisotropies in force associated with symmetry breaking of the aggregate exert strain on collagen fibrils leading to bundling and polarization. (iii) The polarized collagen matrix provides a structural memory that promotes regional cell proliferation to direct further elongation of the anlage.
Author response image 1
Videos
Video 1
Time-lapse images of MCF10A aggregates after transferred into collagen gel.
Images were taken every 10 min.
Video 2
Time-lapse images of aggregates embedded in stretched gel.
Images were taken every 1 hr.
Additional files
Download links
A two-part list of links to download the article, or parts of the article, in various formats.
Downloads (link to download the article as PDF)
Open citations (links to open the citations from this article in various online reference manager services)
Cite this article (links to download the citations from this article in formats compatible with various reference manager tools)
Collagen polarization promotes epithelial elongation by stimulating locoregional cell proliferation
eLife 10:e67915.
https://doi.org/10.7554/eLife.67915


