Quantitative mapping of dense microtubule arrays in mammalian neurons
- Cell Biology, Neurobiology and Biophysics, Department of Biology, Faculty of Science, Utrecht University, Netherlands
Figures
Figure 1 with 4 supplements
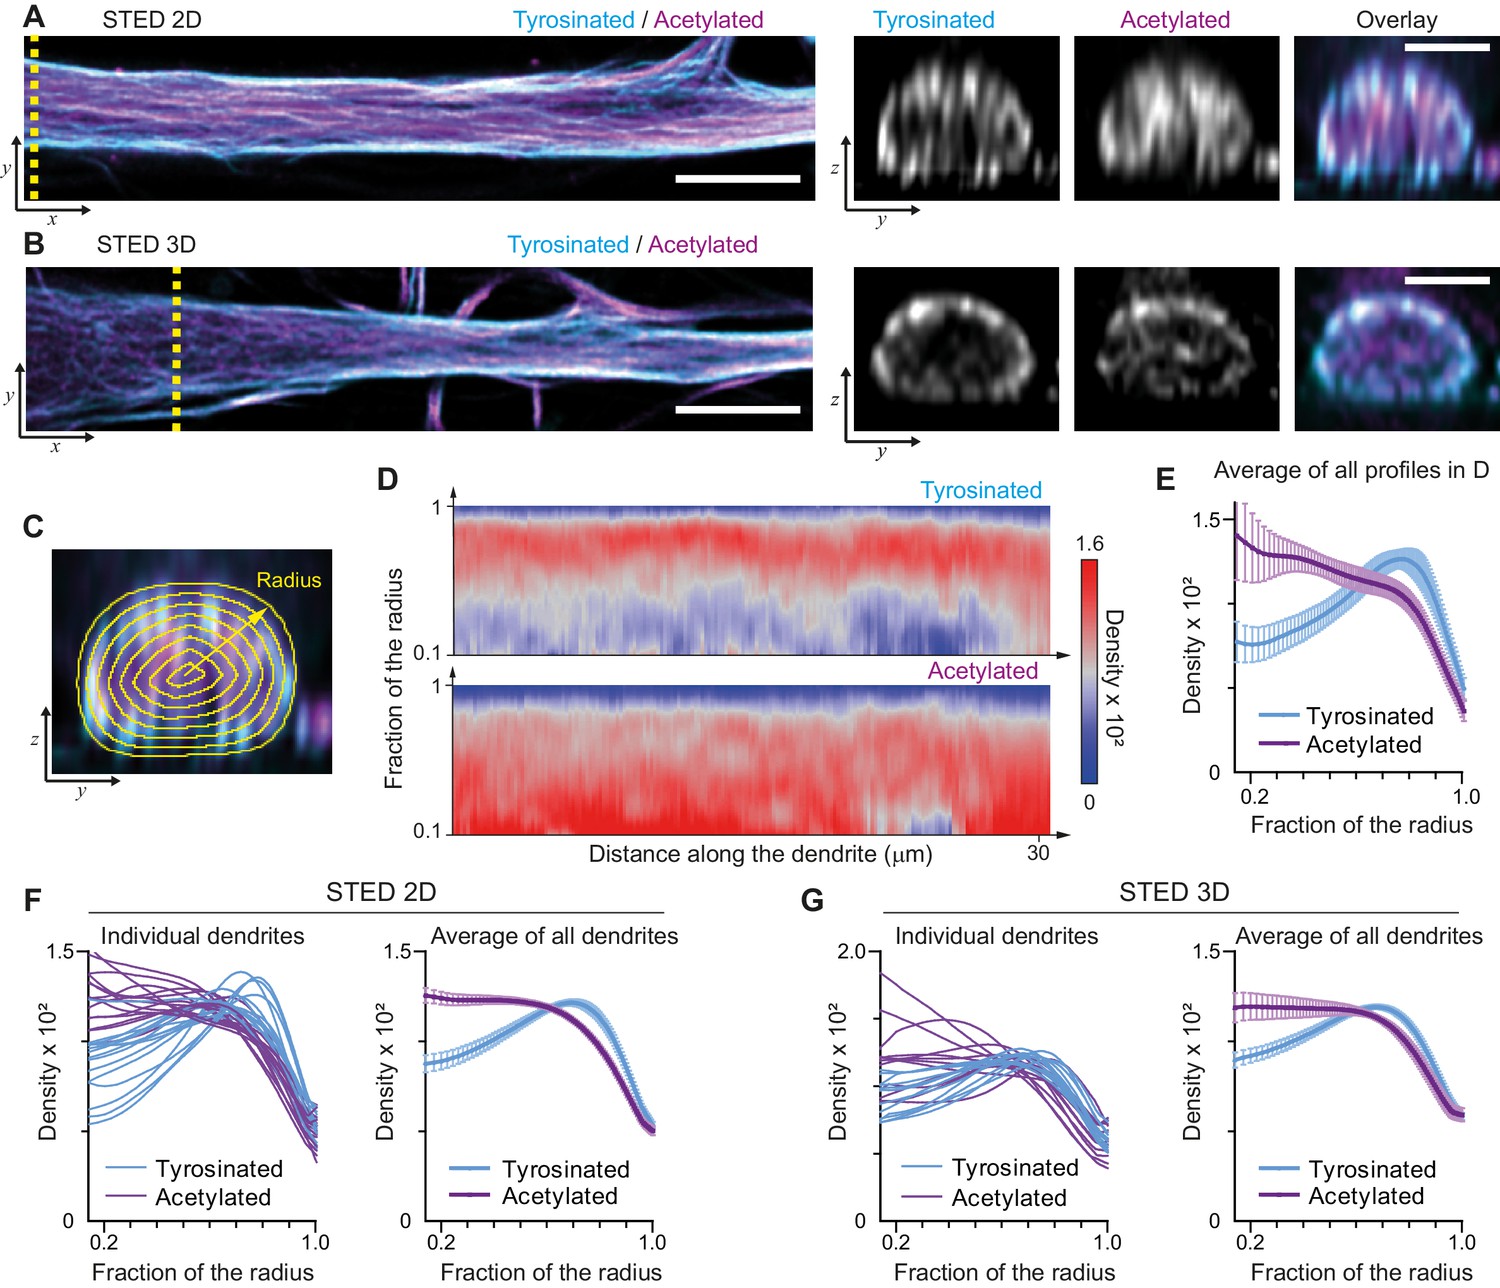
Radial distribution of microtubule subtypes in dendrites imaged using STED microscopy.
(A-B) Representative single planes in XY (left) and YZ cross-sections along the yellow dashed line (right) of a dendrite imaged with 2D (A) and 3D (B) STED. Scale bar 5 µm (XY) and 2 µm (YZ). (C) Quantification of the radial intensity distribution in YZ cross-sections. The outer yellow contour marks the outline of a dendrite and concentric smaller circles represent contours of smaller radius used for quantification. (D) Heatmaps of normalized radial intensity distributions for tyrosinated (top) and acetylated (bottom) microtubules along the length of the dendrite shown in (A). (E) Radial distribution of tyrosinated (cyan) and acetylated (magenta) microtubule posttranslational modifications averaged over the length of the dendrite shown in (A) (n=176 profiles). Error bars represent SD. (F-G) Radial distribution of modifications averaged per dendrite (left) and over all dendrites (right) imaged using 2D STED (panel (F), n=4971 profiles, 15 cells, N=two independent experiments) or 3D STED (panel (G), n=5891 profiles, 12 cells, N=two independent experiments). Error bars represent S.E.M.
Figure 1—figure supplement 1
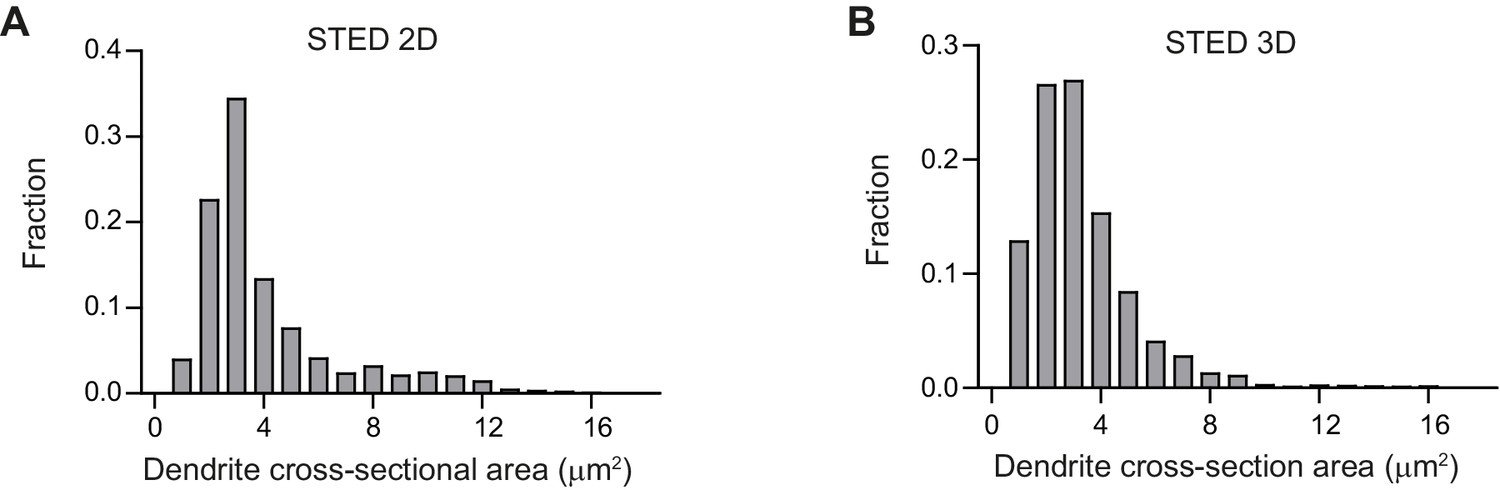
Thickness of dendrites imaged using STED.
(A-B) Distribution of dendrite’s cross-section area for the data shown in Figure 1(F)–(G).
Figure 1—figure supplement 2
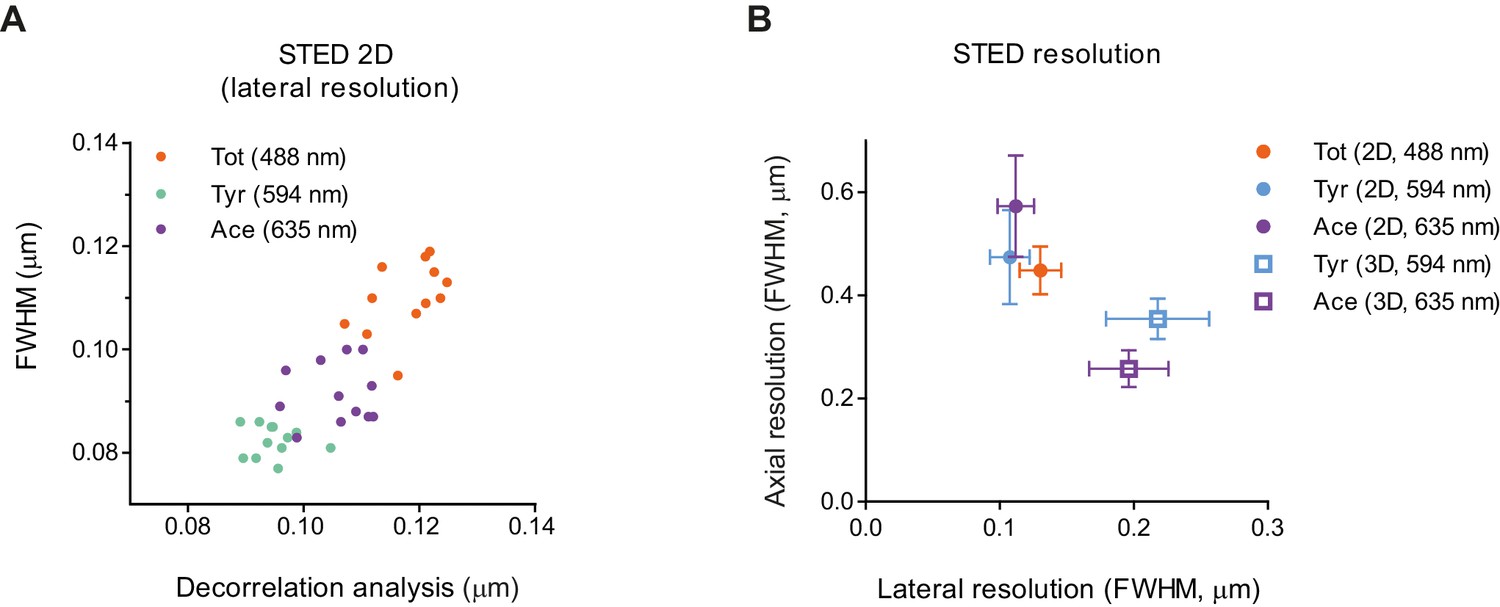
Resolution of STED.
(A) Measurements of STED 2D lateral resolution for different microtubule subsets in cell body images (Figure 2B) using decorrelation analysis (x-axis) or Gaussian fitting of microtubule profiles (y-axis) (n=20 cells/stacks). (B) Measurements of lateral and axial resolution of STED 2D and 3D using Gaussian profile fitting to YZ cross-sections of stack shown in Figure 1A,B and Figure 2B. Each point is an average of 30 measurements in three cells. Error bars represent S.E.M.
Figure 1—figure supplement 3
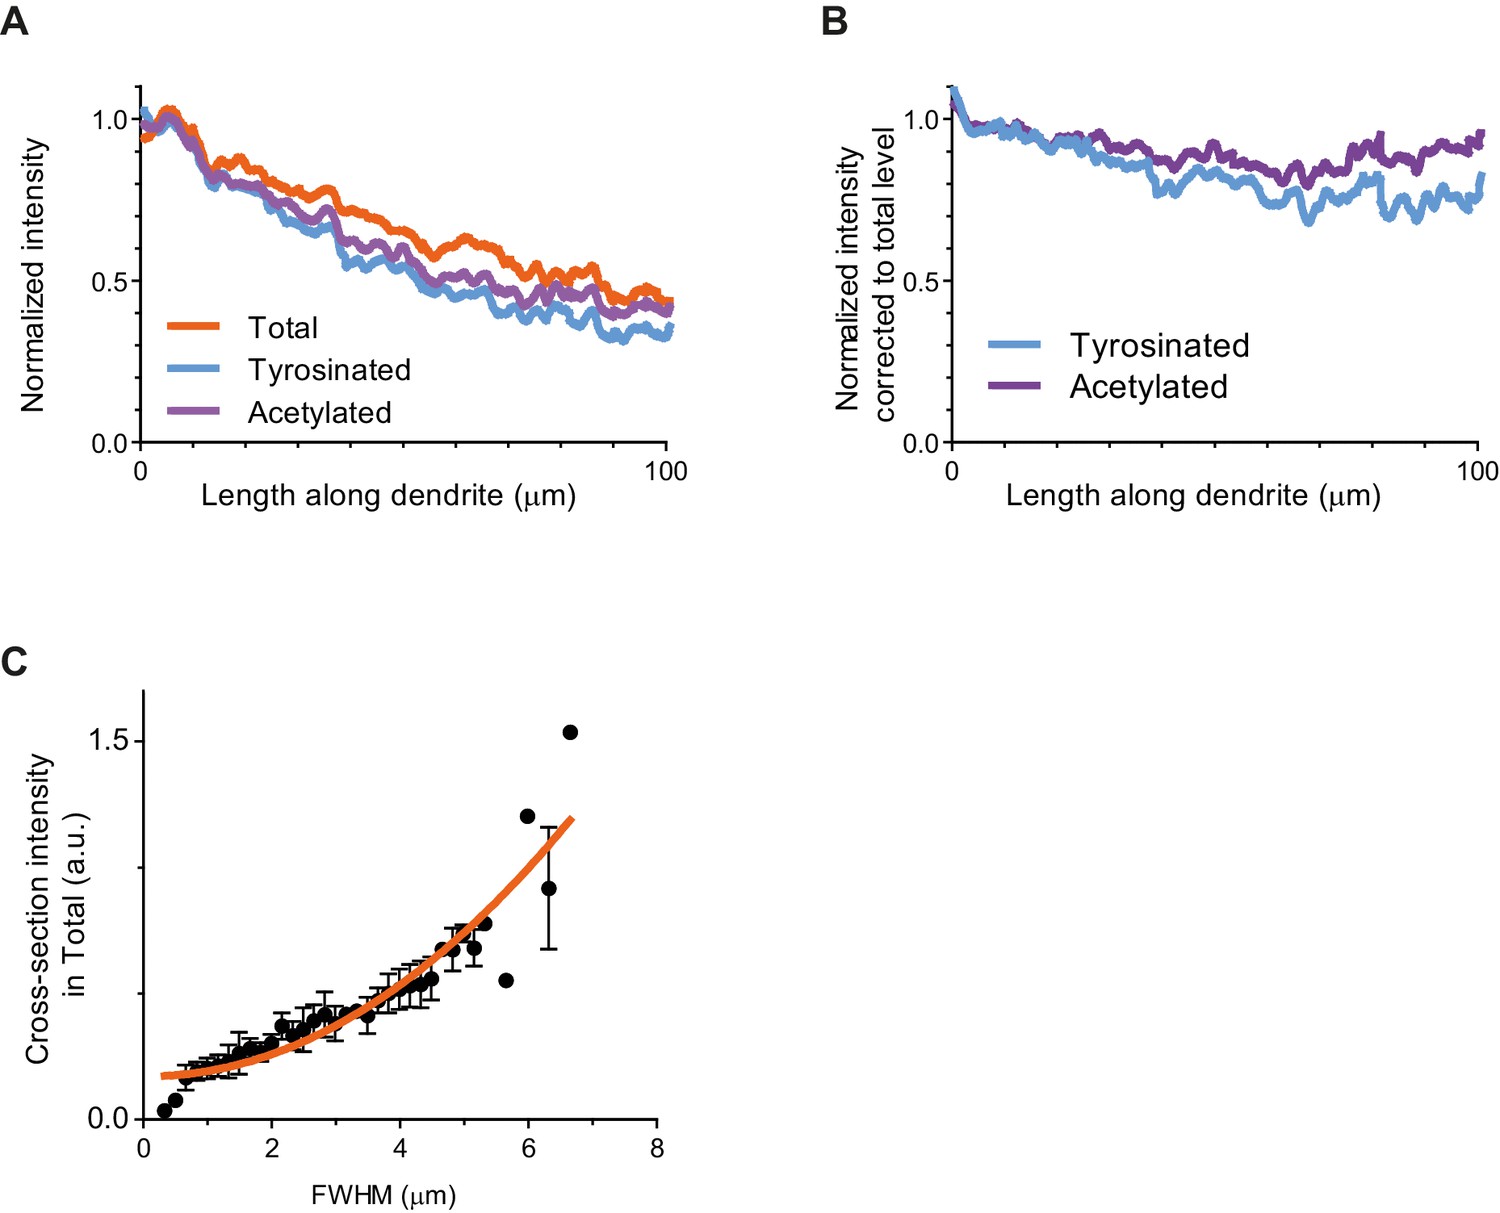
Intensity analysis along the whole length of individual dendrites.
(A) Fluorescent intensity of different microtubule subsets along the length of a dendrite, normalized by an average value in the first proximal 5 µm of dendrite’s length in each channel. Plot lines represent an average value among 26 dendrites (17 cells, N=2 independent experiments). (B) Same as (A), but intensity of tyrosinated and acetylated subsets at each point along a dendrite was accounted for diminishing total tubulin intensity. (C) Cross-section fluorescence intensity of a dendrite in total tubulin channel as a function of dendrite’s thickness (taken for the same coverslip, n=19 dendrite traces). Dashed orange line represents a fit with quadratic polynomial. Error bars represent S.E.M.
Figure 1—figure supplement 4
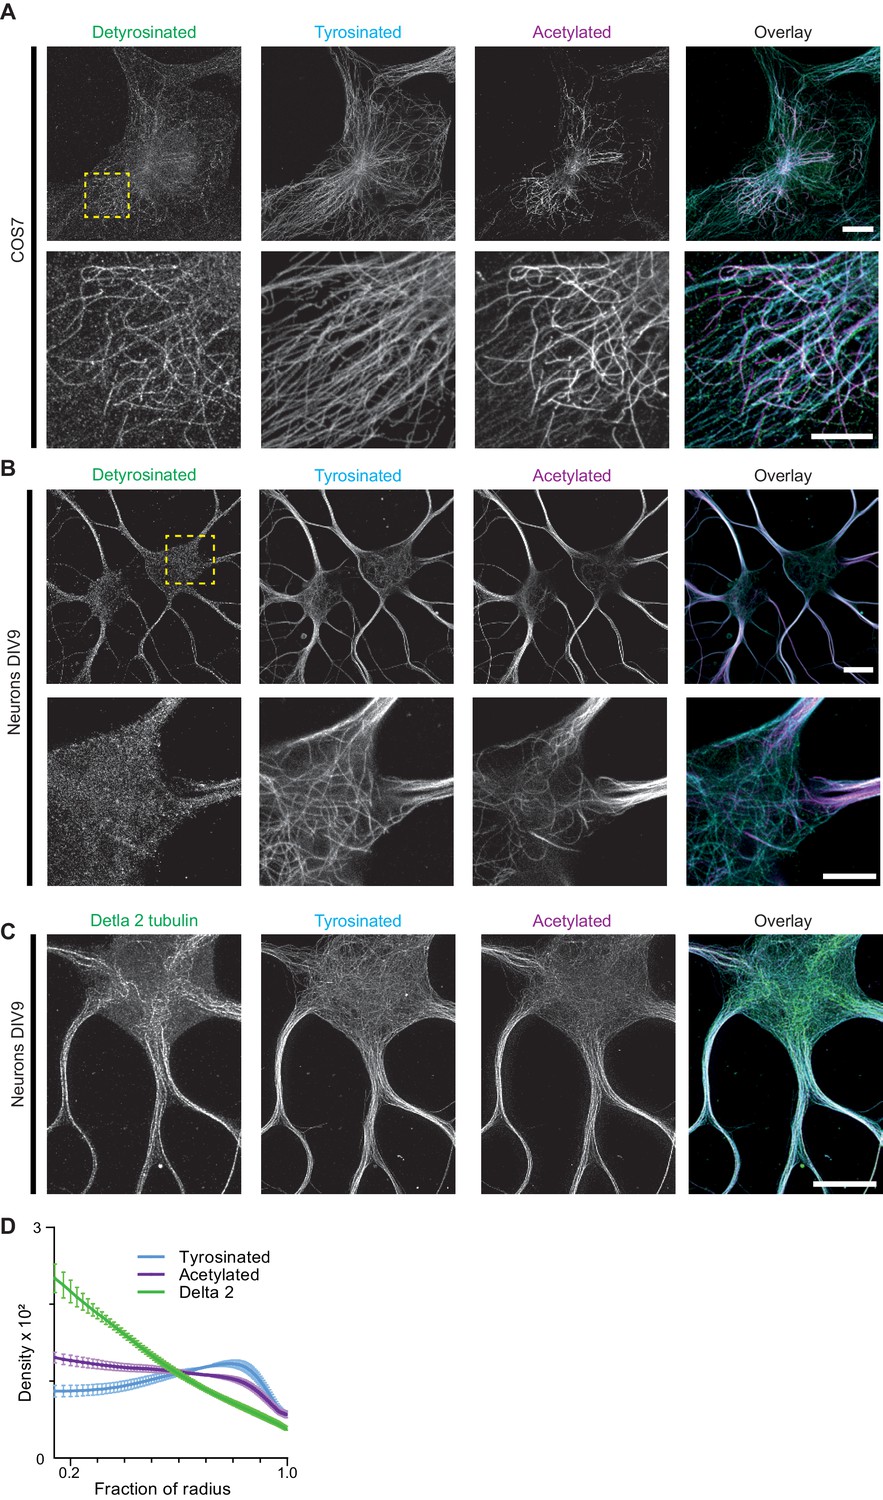
Detyrosinated and delta-2 microtubules subsets.
(A) Representative images of COS-7 cells stained for detyrosinated, acetylated, and tyrosinated tubulin. Yellow square box indicates the region displayed in the zoom in the lower row. Scale bar 10 µm for top panel and 5 µm for the zoom. (B) Representative maximum intensity projection of DIV9 neurons cells stained for detyrosinated, acetylated, and tyrosinated tubulin. Yellow square box indicates the region displayed in the zoom in the lower row. Scale bar 10 µm for top panel and 5 µm for the zoom. (C) Representative maximum intensity projections of DIV9 neurons cells stained for delta 2, acetylated and tyrosinated tubulin. Scale bar 5 µm. (D) Radial distribution of delta 2 (green), tyrosinated (cyan), and acetylated (magenta) tubulin posttranslational modifications intensities imaged using 2D STED (n=1260 profiles, 9 cells, N=2 independent experiment) and averaged over all dendrites. Error bars represent S.E.M.
Figure 2 with 2 supplements
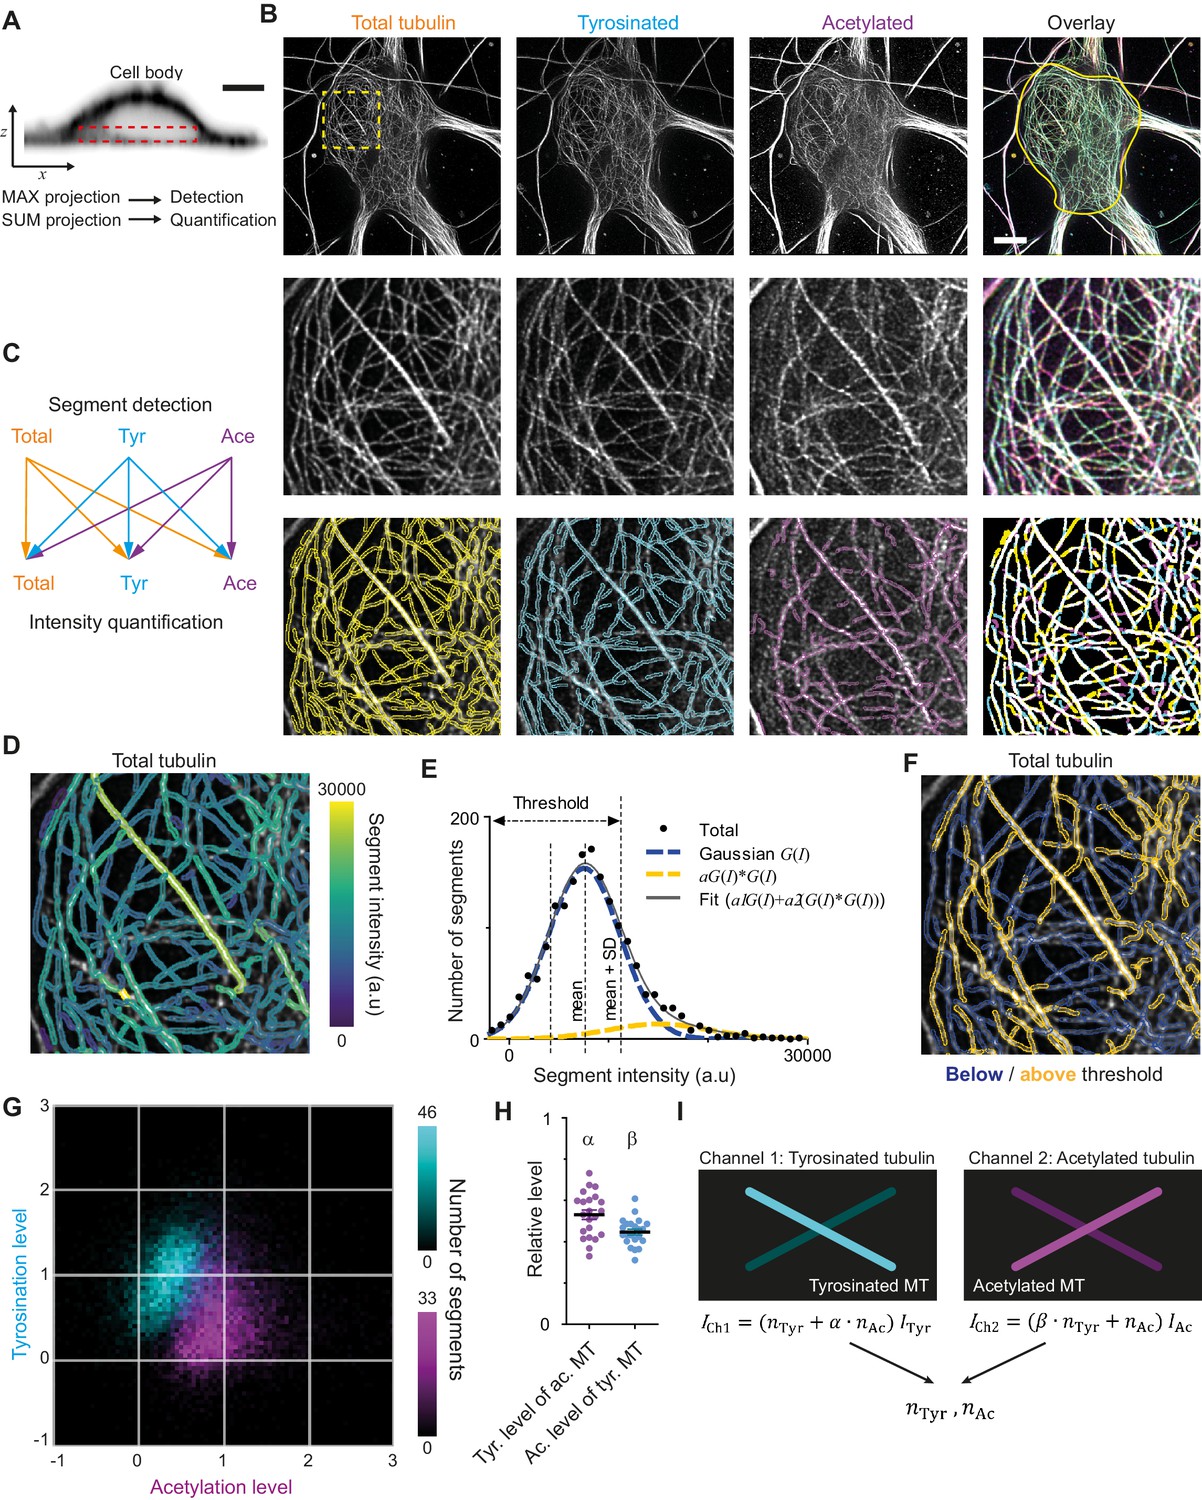
Analysis pipeline for detection and intensity quantification of individual (post-translationally modified) microtubules.
(A) Vertical cross-section along a neuronal cell body (soma). Dashed rectangle marks the volume (sub-z-stack) under the nucleus used for microtubule filament detection (maximum intensity projection) and quantification (sum of all slices). Scale bar 5 µm. (B) Top row: Maximum intensity projection of 2D STED z-stacks of DIV9 neurons stained for alpha-tubulin (total) and for tyrosinated tubulin and acetylated tubulin. Solid yellow contour in the overlay marks the area used for detection of individual filaments. Scale bar 5 µm. Middle row: Zoom-ins corresponding to the dashed yellow square in the top row. Bottom row: Example of individual filament detection in each channel (first three panels) and binarized overlay of the detections (right panel). (C) Schematics of individual filament analysis: detection was performed in each channel separately using maximum intensity projection. For each detected segment, the intensity was quantified in all three channels. (D) Outlines of microtubule filaments detected and quantified in the total tubulin channel (for the cell depicted in (A)), color-coded according to their background corrected integrated intensity. (E) Histogram of the background-corrected integrated intensity of individual filaments detected in all three channels and quantified in total tubulin channel for the cell shown in (A) (black dots, n=1736). The solid black line shows the fit of the sum of two Gaussian functions: the first corresponds to a single filament intensity distribution (dashed blue line) and the second Gaussian corresponds to the double filament intensity distribution, that is the first Gaussian convoluted with itself (dashed orange line). Dashed lines mark the mean and mean plus standard deviation of the first Gaussian. The latter was used as a threshold for single microtubule filtering. (F) Illustration of single filament intensity filtering: outlines of the filaments with intensity below the threshold are colored in blue (assigned as a single microtubule) and filaments above it in orange (assigned as two or more microtubule bundles). (G) Two-color heatmap overlay of normalized intensity distributions of single microtubule segments detected in tyrosinated (cyan, n=10281 segments) and acetylated (magenta, n=9369 segments) channels and quantified in both (22 cells, N=2 independent experiments). (H) Average normalized level of tyrosination per cell for single microtubule segments detected in the acetylated channel (α, magenta) and average normalized level of acetylation for segments detected in tyrosinated channel (β, cyan). Horizontal black lines mark mean ± S.E.M. (22 cells, N=2 independent experiments). (I) Illustration of the analysis pipeline for the quantification of tyrosinated and acetylated microtubules number in dendrites.
Figure 2—figure supplement 1
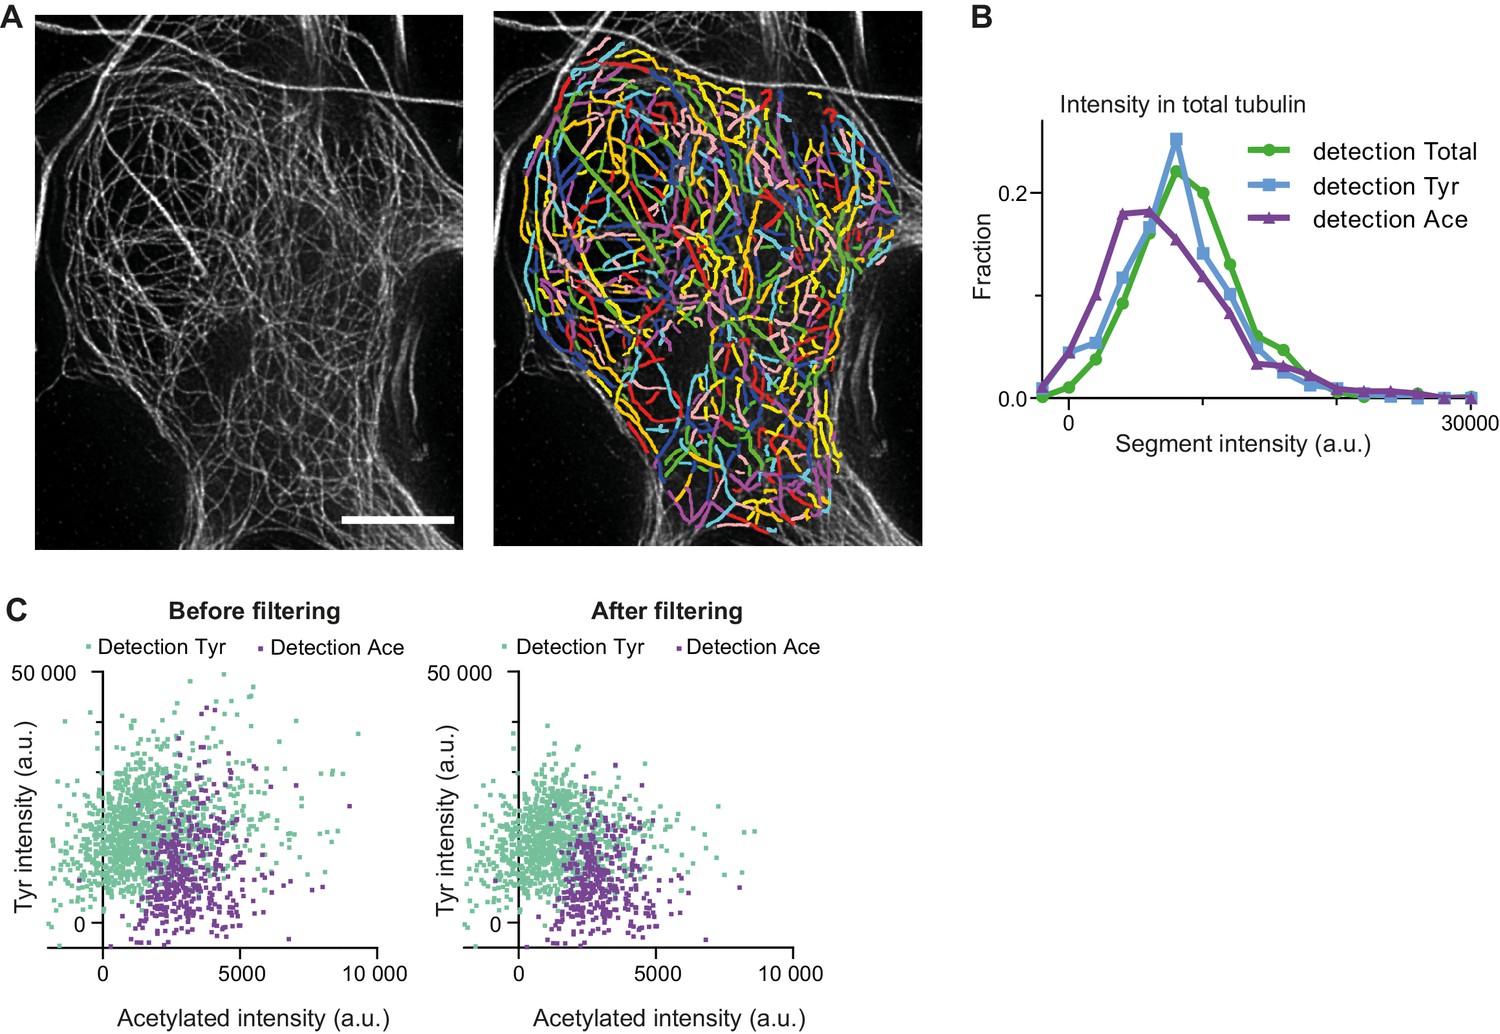
Analysis of microtubule segments intensities.
(A) Zoom-in of cell body area in total tubulin channel from Figure 2B, showing individual microtubule segments detections in different colors. Scale bar 5 µm. (B) Histograms of background corrected integrated intensities of individual microtubule segments from the cell shown in Figure 2B, quantified in total tubulin channel and detected in total (green, n=660), tyrosinated (cyan, n=630) and acetylated (magenta, n=446) channels. (C) Background corrected integrated intensities of individual microtubule segments detected in tyrosinated (cyan) or acetylated (magenta) channels before (left) and after (right) threshold filtering (Figure 2E) in total tubulin channel (data for the cell shown in Figure 2B).
Figure 2—figure supplement 2
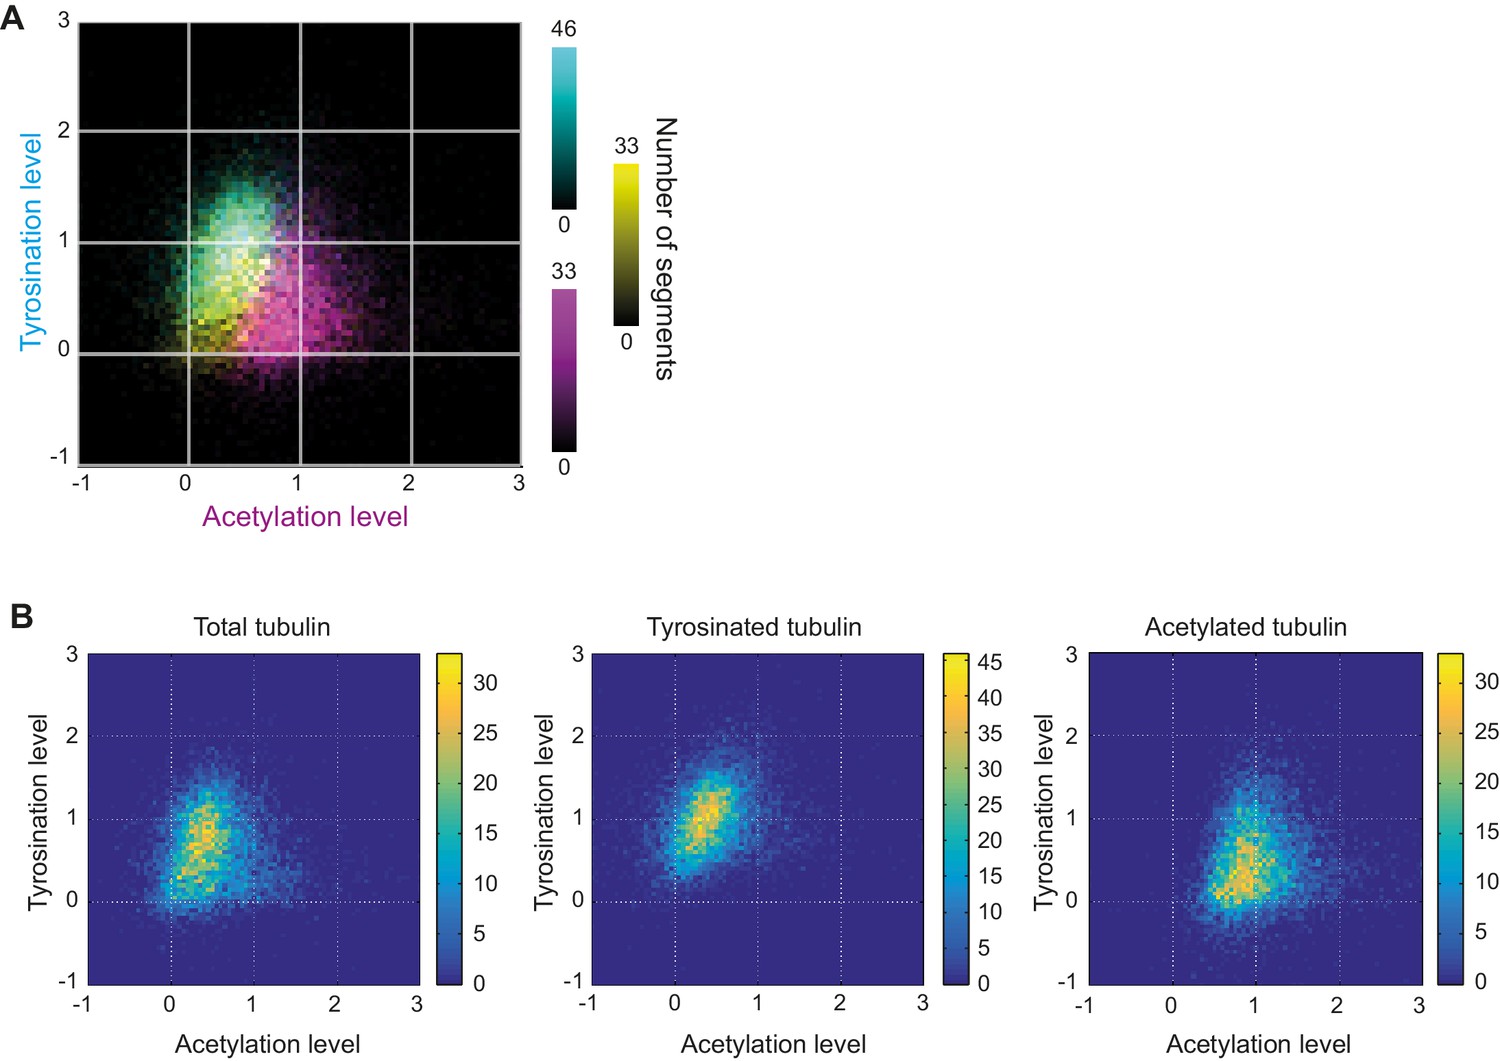
Heatmaps of microtubule subsets using STED.
(A) Three-color heatmap overlay of normalized intensity distributions of single microtubule segments detected in total tubulin, (yellow, n=9050), tyrosinated (cyan, n=10281 segments), and acetylated (magenta, n=9369 segments) channels. (22 cells, N=2 independent experiments). (B) Heatmaps of normalized intensities in tyrosinated and acetylated channels for the detections performed in the specified channel built separately (data is the same as in (A)).
Figure 3
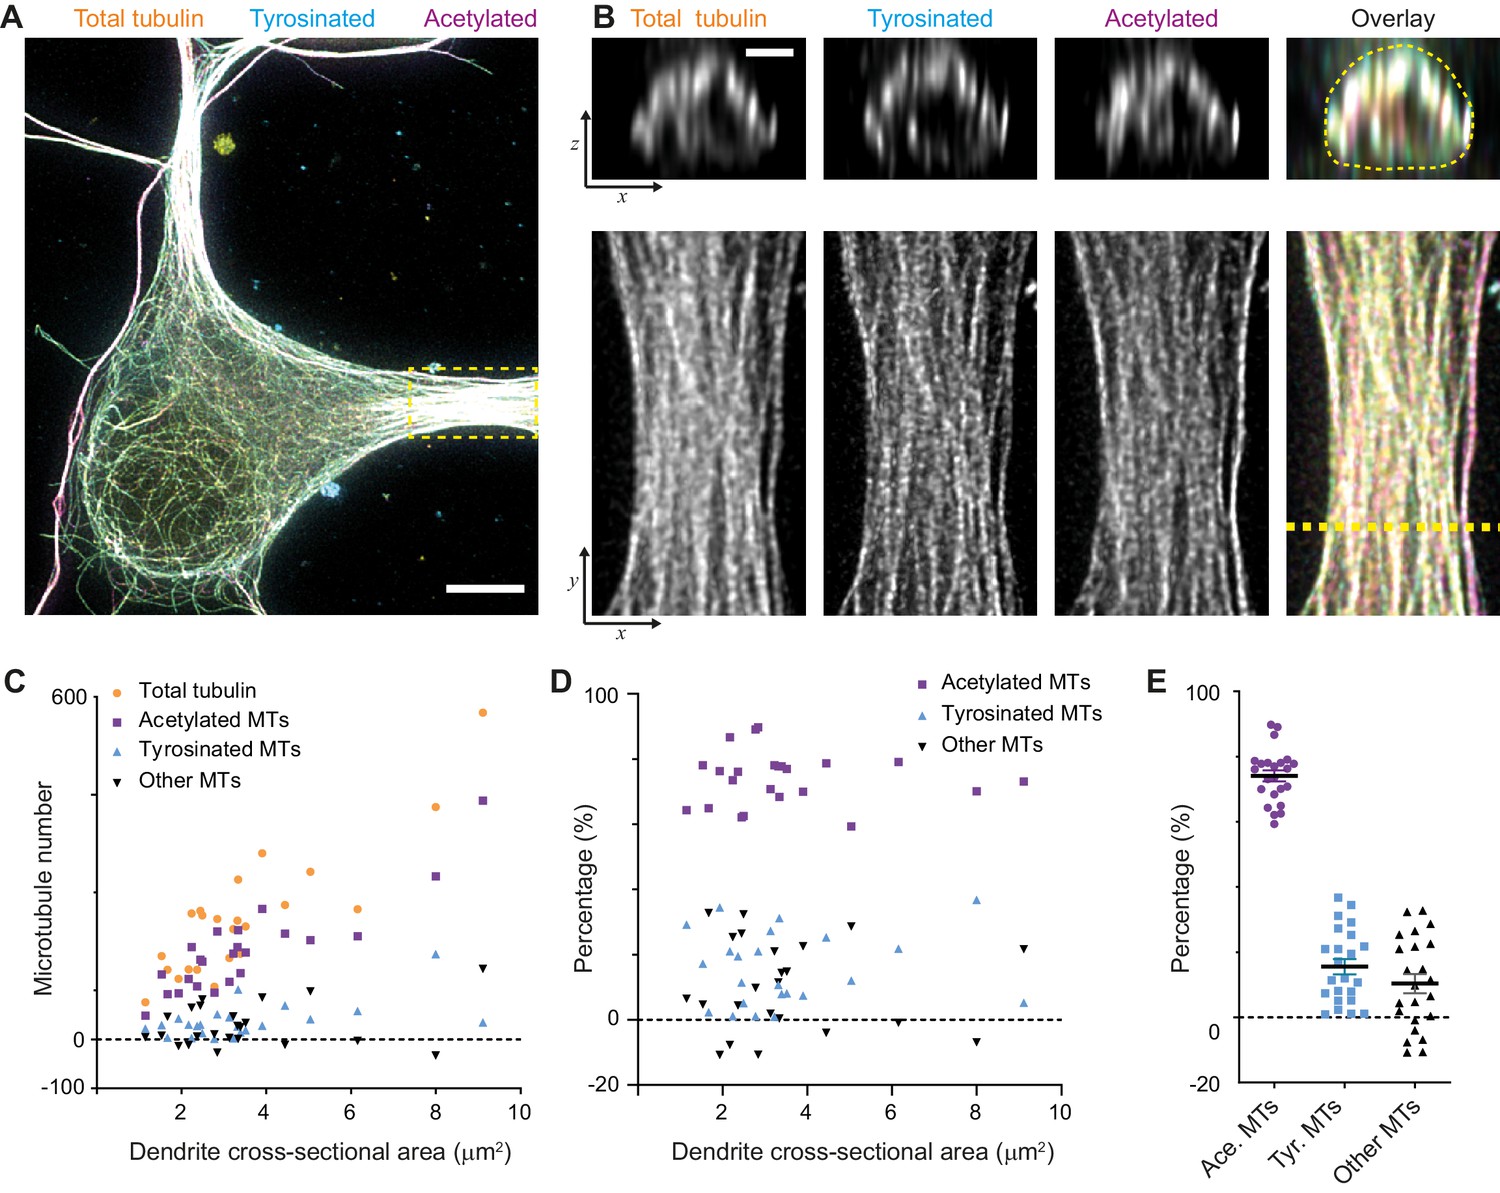
Estimation of absolute numbers of (modified) microtubules in dendrites using single-microtubule intensities from the soma.
(A) Three-color overlay of maximum intensity projection of a 2D STED z-stack including the whole volume of dendrites (total tubulin in yellow, tyrosinated in cyan and acetylated in magenta). Dashed yellow rectangle marks zoom-in shown in (B). Scale bar 5 µm. (B) Maximum intensity projections of a segment of dendrite (bottom row, marked by yellow dashed rectangle in (A)) and individual YZ slices (top row, corresponds to a dashed yellow line). (C) Numbers of total, tyrosinated, acetylated and other (i.e. neither tyrosinated nor acetylated) microtubules per dendrite as a function of cross-sectional area (n=23 dendrites, N=2 independent experiments). These numbers were determined using the approach outlined in Figure 2I. (D-E) Percentage of tyrosinated, acetylated and other microtubules per dendrite as a function of dendrite’s cross-section area (D) or pooled together (E). Horizontal black lines in (E) mark mean ± S.E.M. (n=23 dendrites, N=2 independent experiments).
Figure 4 with 1 supplement
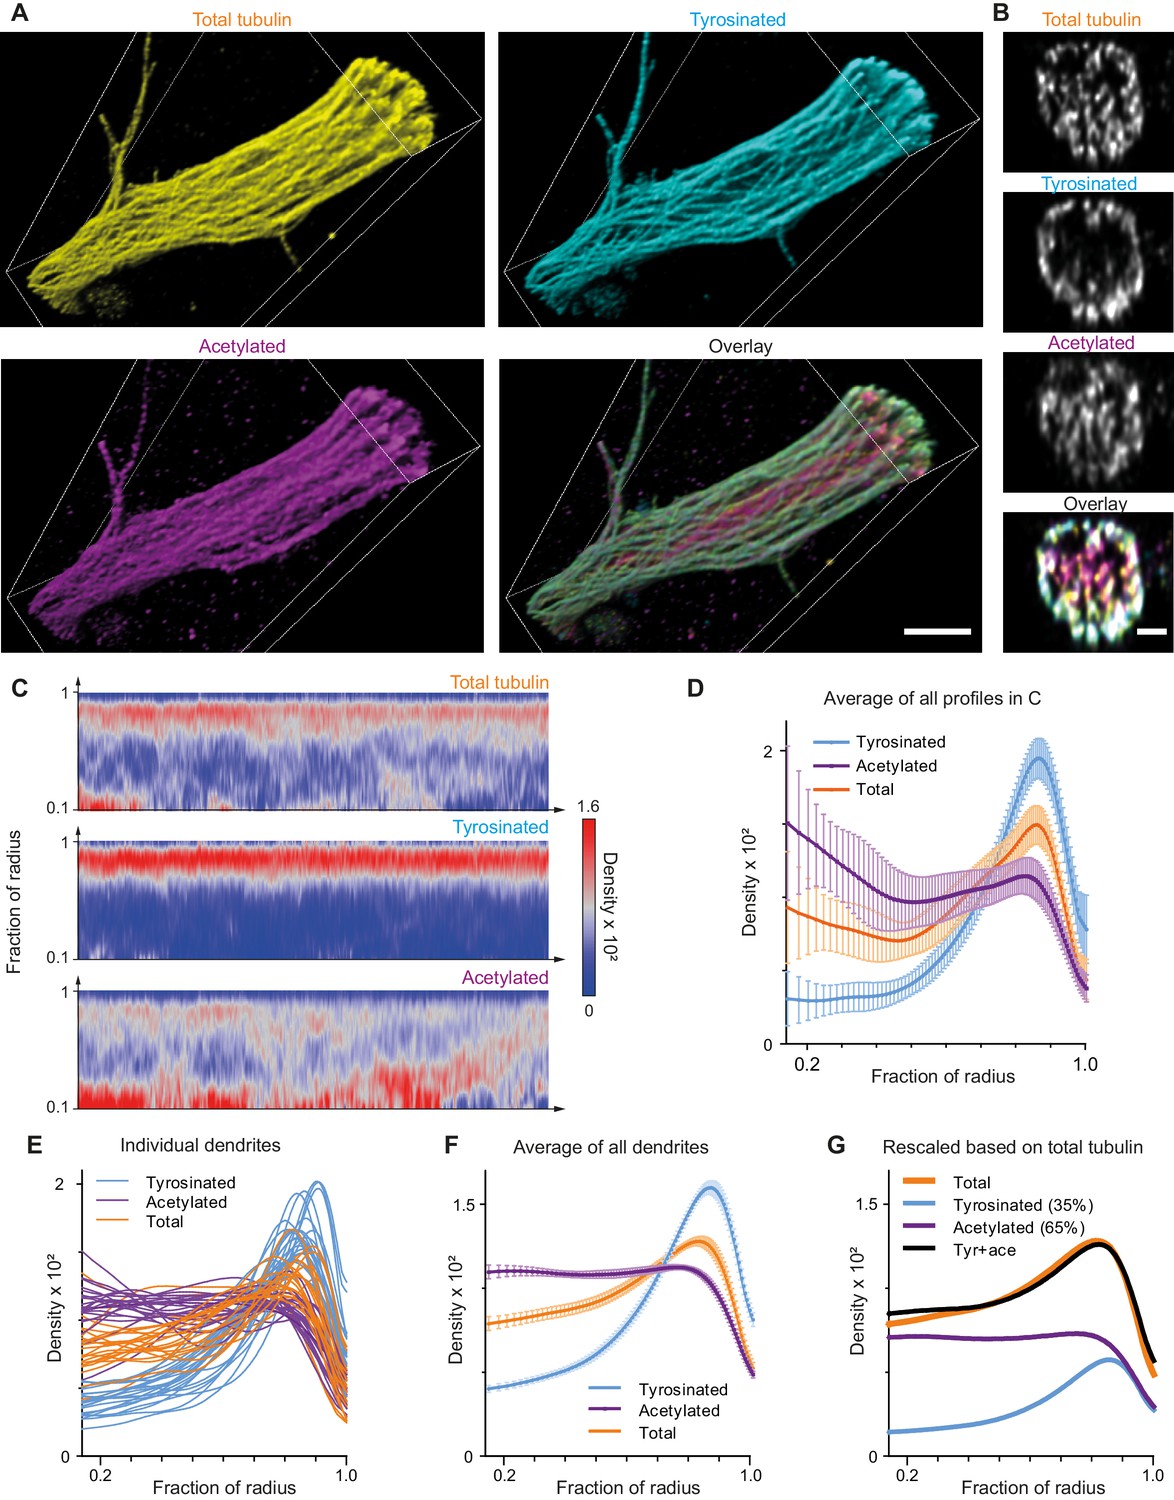
Expansion Microscopy improves quantification of the radial distribution of microtubule modifications in dendrites.
(A) Representative volumetric 3D rendering of total tubulin and its posttranslational modifications in a dendrite imaged using ExM. Scale bar 2 μm (physical size post-expansion 8.3 μm). (B) Representative single YZ cross-section of the dendrite from (A). Scale bar 0.5 μm (physical size post-expansion 2.07 μm). (C) Heatmaps of normalized radial intensity distributions for total tubulin (top), tyrosinated (middle) and acetylated (bottom) microtubule posttranslational modifications along the length of the dendrite shown in (A). Abscissa units are recalculated according to expansion factor (17 µm equals to 70.5 µm physical size post-expansion). (D) Radial distribution of total tubulin (orange), tyrosinated (cyan) and acetylated (magenta) microtubule posttranslational modifications averaged over the length of the dendrite shown in (A) (n=404 profiles). Error bars represent SD. (E-F) Radial distribution of total tubulin (orange) and tyrosinated (cyan) and acetylated (magenta) posttranslational modifications intensities averaged per dendrite (E) and among all dendrites (F) imaged using ExM (n=9460 profiles, 22 cells, N=2 independent experiments). Error bars represent S.E.M. (G) Decomposition of total tubulin radial intensity distribution as a weighted sum of tyrosinated and acetylated distributions.
Figure 4—figure supplement 1
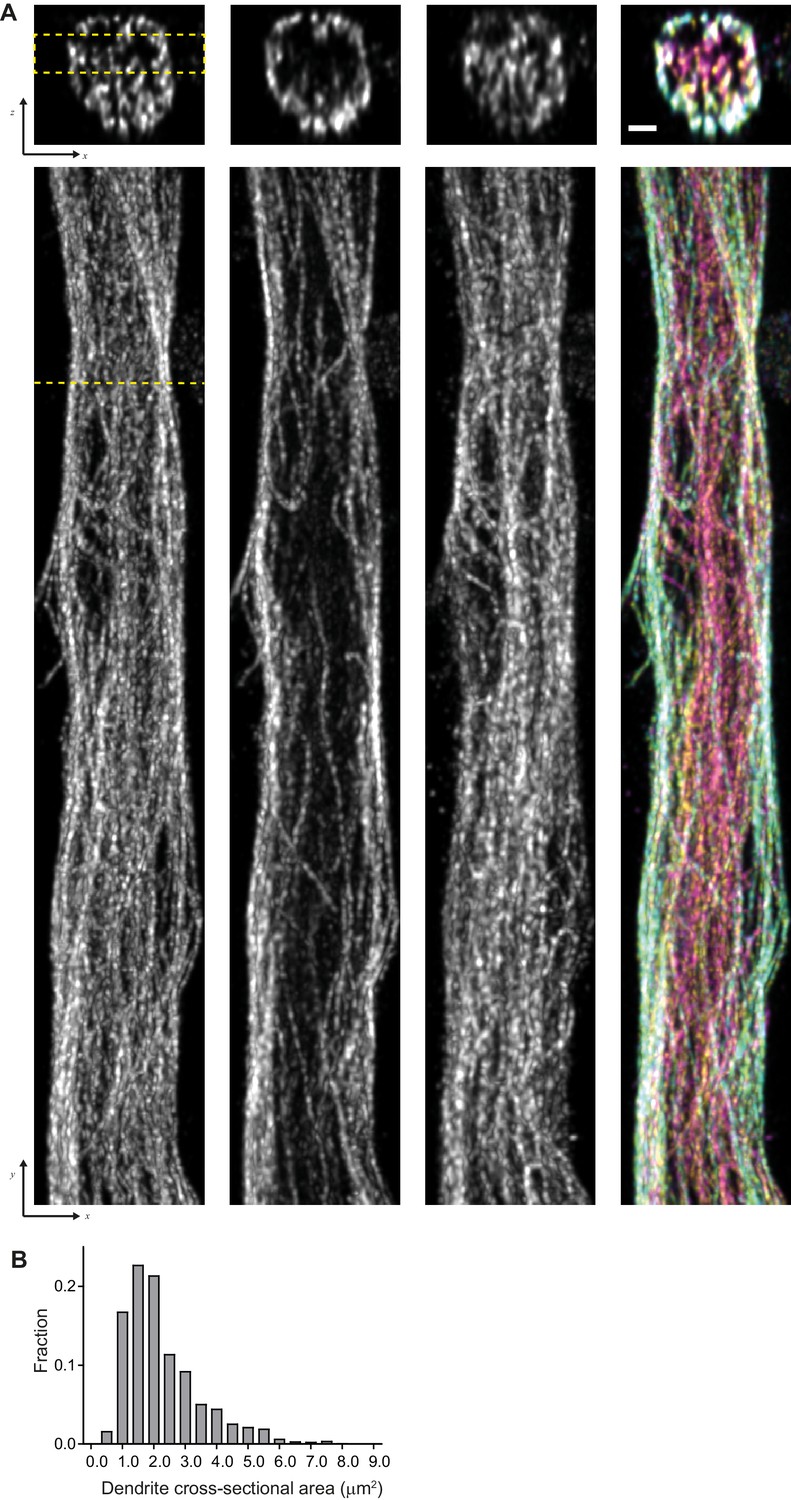
Characterization of dendrites imaged using ExM.
(A) (top) Representative single YZ cross-section of the dendrite from Figure 4A (E)-(F) and (bottom) corresponding maximum intensity XY projections of subvolume marked by dashed yellow lines. Scale bar 0.5 μm (physical size post-expansion 2.07 μm). (B) Distribution of dendrite’s cross-section area for the data shown in Figure 4 (E)-(F).
Figure 5 with 5 supplements
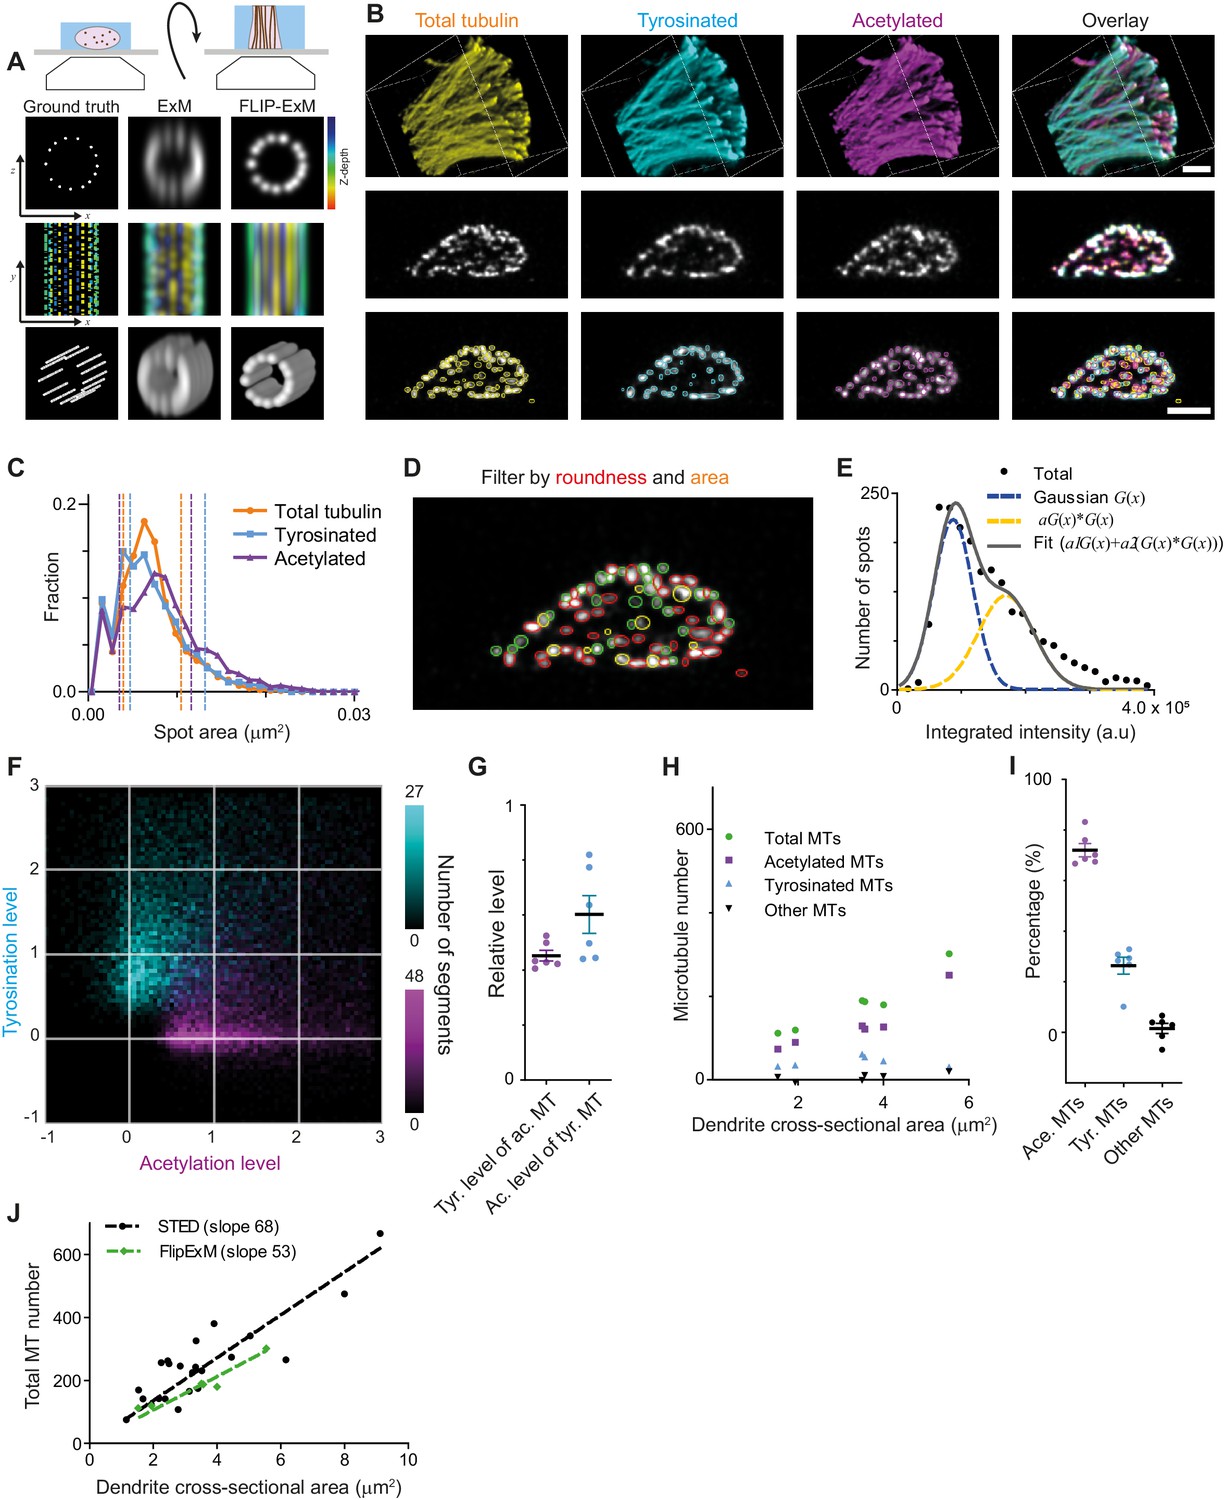
Direct estimation of microtubule numbers in dendrites using FlipExM.
(A) Top: Schematics of gel reorientation for FlipExM imaging. Bottom: Simulated z-stacks illustrating the advantages of FlipExM for imaging of dendritic microtubules. A set of simulated circumferential microtubules in a dendrite of 1 µm diameter (left) were convoluted with a point spread function corresponding to a regular ExM (middle) or FlipExM (right) imaging (top to bottom: single XZ plane, color-coded depth projection, 3D rendering). (B) Representative volumetric 3D rendering (top) and single YZ slices (middle) of total tubulin and its posttranslational modifications in a dendrite imaged using FlipExM. The bottom row shows automatic detections of microtubules in cross-sections. Scale bars 1 μm (physical size post-expansion 4.15 μm). (C) Area histogram of spots corresponding to microtubules cross-sections in three channels for the dendrite shown in (B). Spots were pre-filtered using roundness criteria (n=7103, 4844, 3821 for total, tyrosinated and acetylated channels). An interval between dashed lines marks the range for spot’s area filtering. Abscissa units are recalculated according to expansion factor (4.15). (D) Single YZ slice of total tubulin channel with detections filtered by roundness marked by red circles, detections filtered by area marked by yellow circles and remaining detections attributed to single microtubules marked in green. (E) Histogram of background subtracted integrated intensity of individual microtubules cross-sections detected and quantified in total tubulin channel for the dendrite shown in (B) (black dots, n=1981). The solid black line shows the fit of sum of two Gaussian functions: the first corresponds to a single microtubule cross-section intensity distribution (dashed green line) and the second Gaussian corresponds to the double cross-section intensity distribution, that is first Gaussian convoluted with itself (dashed red line). (F) Two color heatmap overlay of normalized intensity distributions of single microtubule cross-sections detected in tyrosinated (cyan, n=8642 spots) and acetylated (magenta, n=12552 spots) channels and quantified in both (6 cells, N=2 independent experiments). (G) Average normalized level of tyrosination per cell for single microtubule cross-section detected in acetylated channel (α, magenta) and average normalized level of acetylation for cross-sections detected in tyrosinated channel (β, cyan). Horizontal black lines mark mean ± S.E.M. (6 cells, N=2 independent experiments). (H) Numbers of total, tyrosinated, acetylated, and non-modified microtubules per dendrite depending on dendrite’s cross-section area (n=6 cells, N=2 independent experiments). (I) Percentage of tyrosinated, acetylated, and non-modified microtubules as a fraction of total microtubule number per dendrite. Horizontal black lines mark mean ± S.E.M. (n=6 cells, N=2 independent experiments). (J) Number of microtubules per dendrite determined using STED (black dots, data from Figure 2C) or FlipExM (green dots, data from (H)) imaging. Dashed lines show independent linear fits passing through the origin.
Figure 5—figure supplement 1
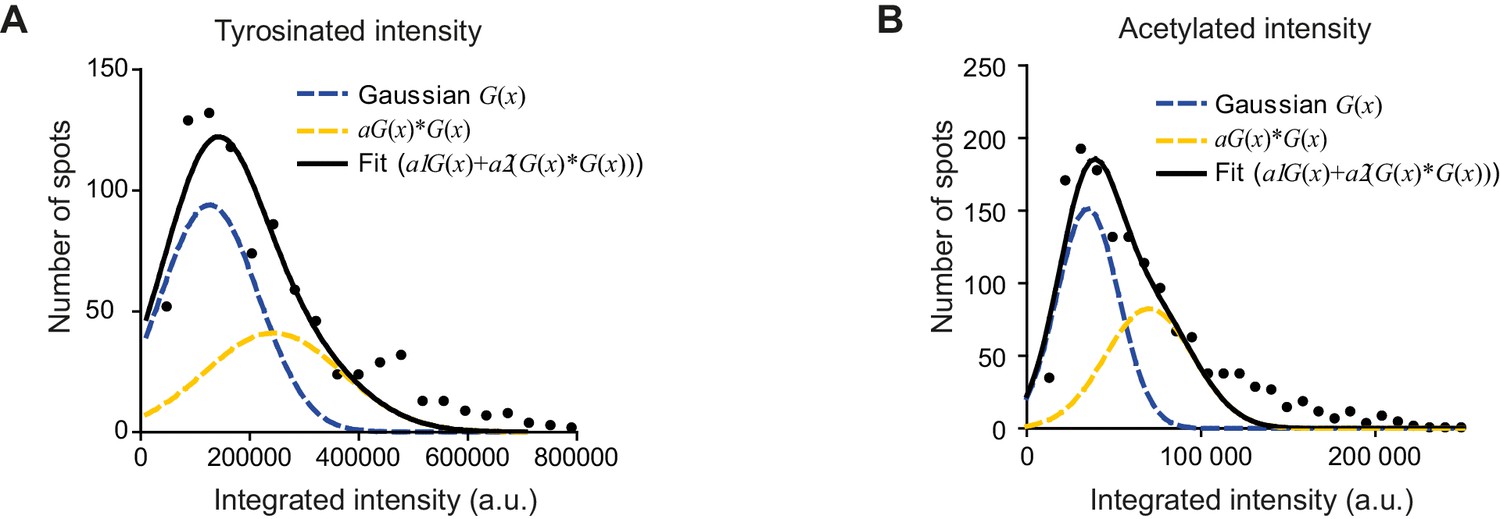
Estimation of single microtubule intensity per channel.
(A-B) Histograms of background subtracted integrated intensity of individual microtubules cross-sections detected and quantified in tyrosinated (A) or acetylated (B) tubulin channel for the dendrite shown in Figure 5B (black dots, n=870 and n=1441). The solid black line shows the fit of sum of two Gaussian functions: the first corresponds to a single microtubule cross-section intensity distribution (dashed green line) and the second Gaussian corresponds to the double cross-section intensity distribution, that is first Gaussian convoluted with itself (dashed blue line).
Figure 5—figure supplement 2
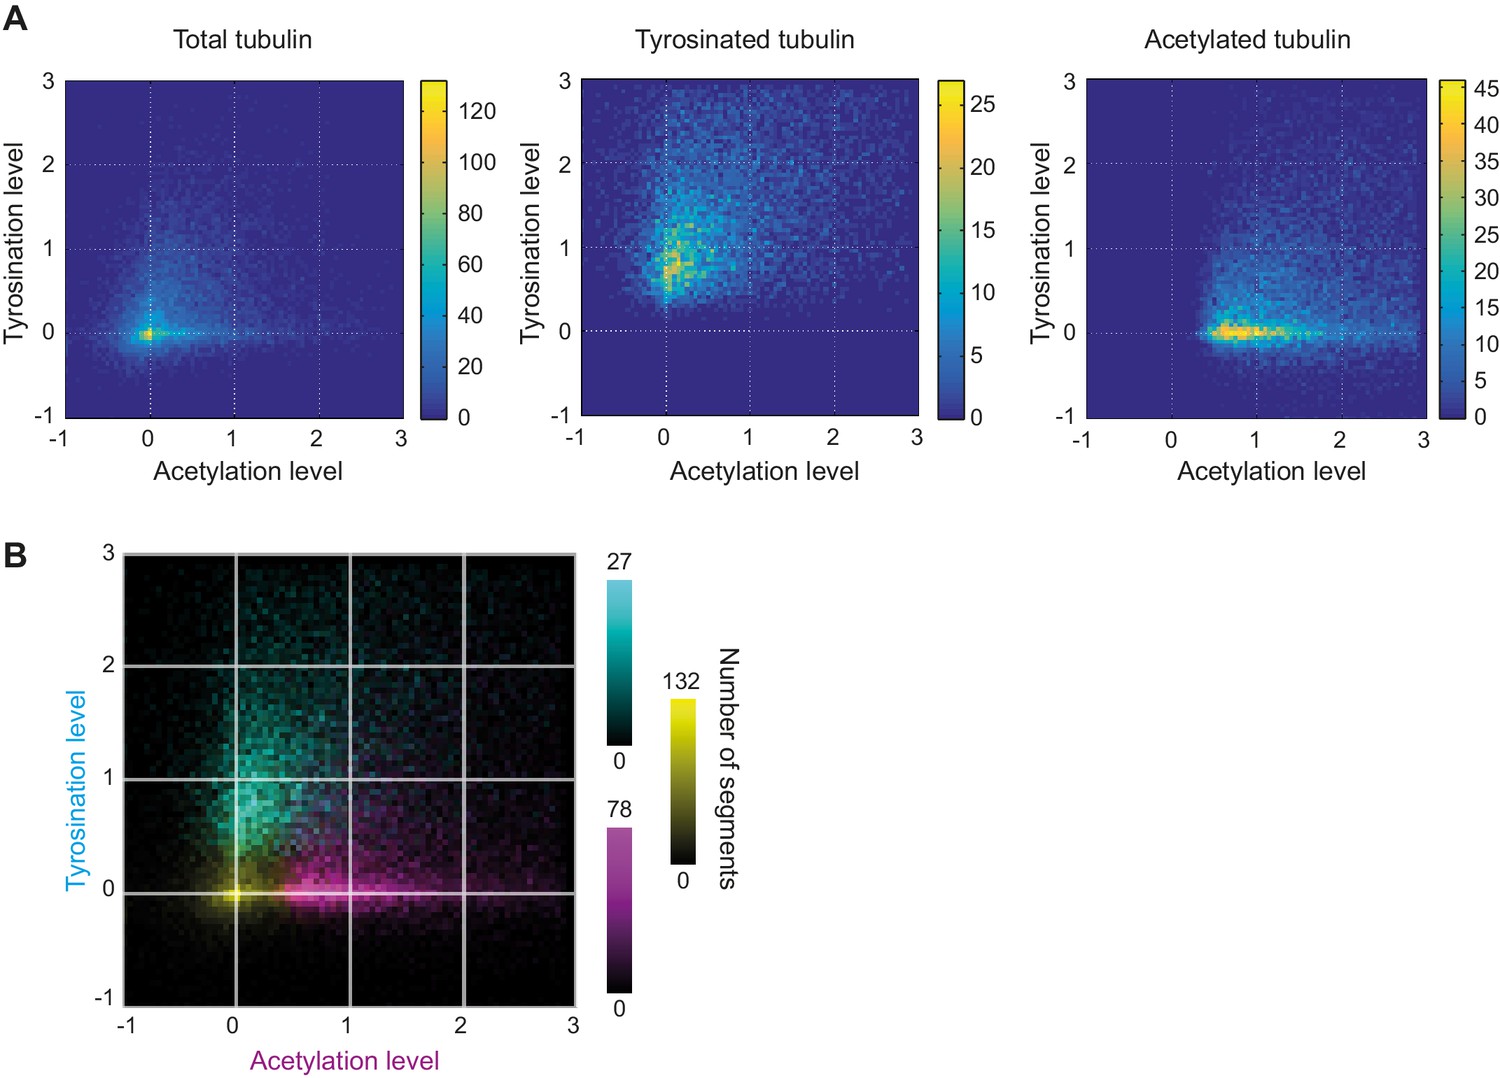
Heatmaps of microtubule subsets using FlipExM.
(A) Heatmaps of normalized single microtubule cross-section intensities in tyrosinated and acetylated channels for the detections performed in the specified channel built separately (data is the same as in (B)). (B) Three color heatmap overlay of normalized intensity distributions of single microtubule cross-sections detected in total (yellow, n=20398), tyrosinated (cyan, n=8642), and acetylated (magenta, n=12552) tubulin channels (6 cells, N=2 independent experiments).
Figure 5—figure supplement 3
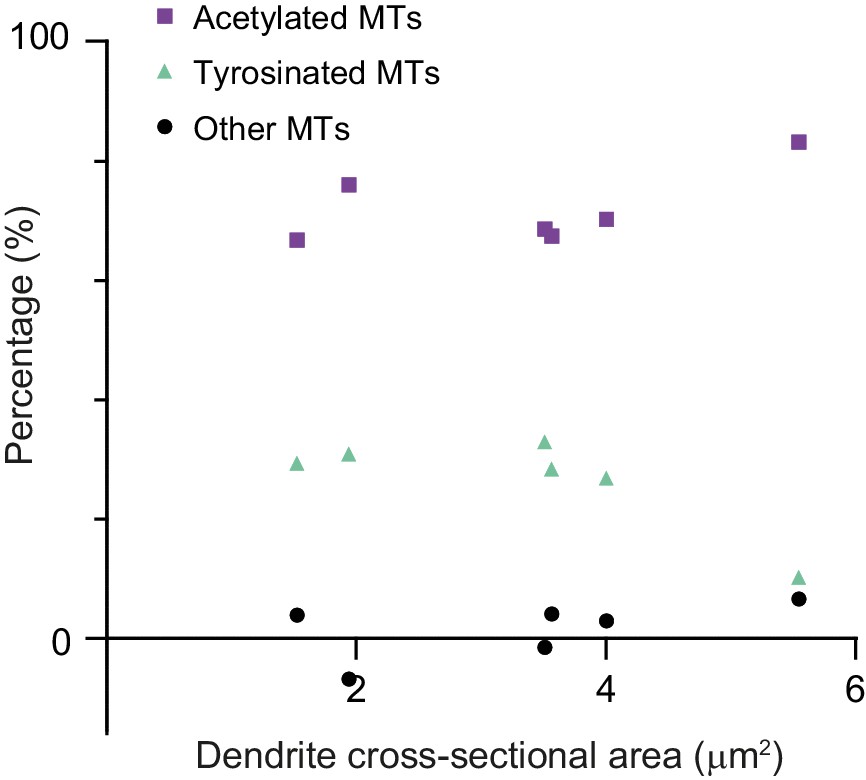
Percentage of microtubule subsets per dendrite.
Percentage of tyrosinated, acetylated, and non-modified microtubules as a fraction of total microtubule number per dendrite as a function of dendrite’s cross-section area (6 cells, N=two independent experiments).
Figure 5—figure supplement 4
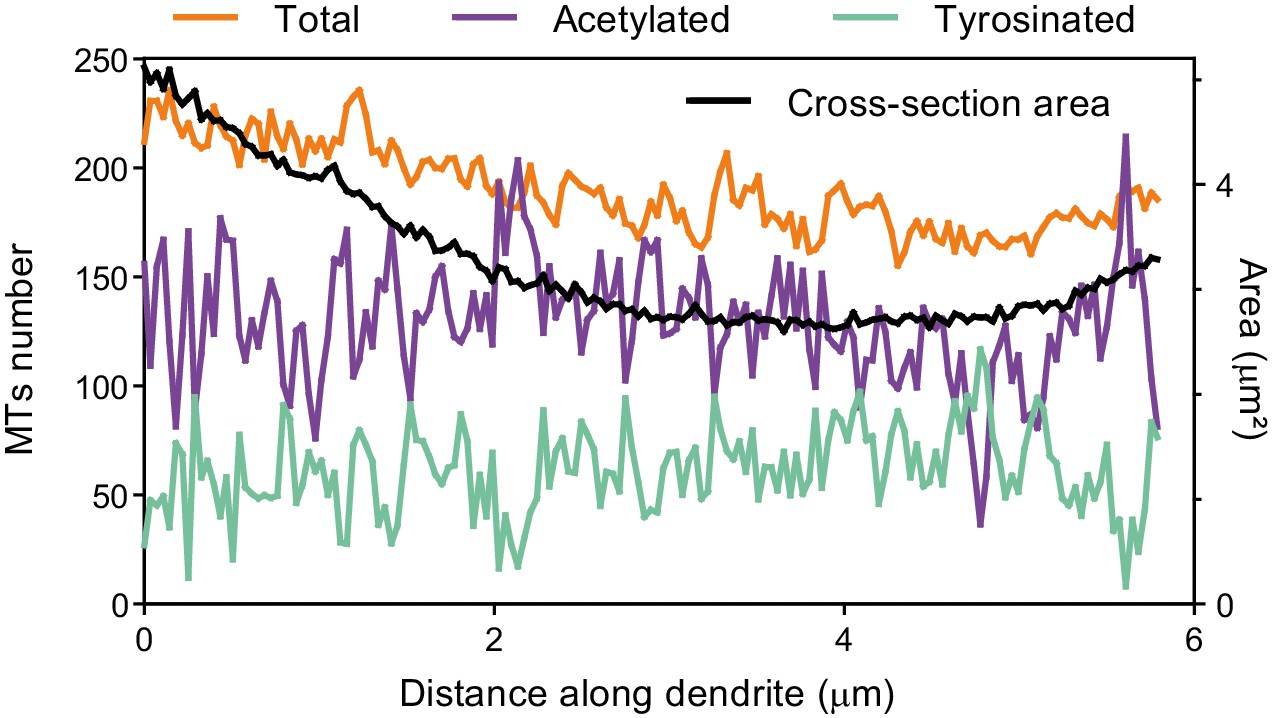
Number of microtubules along the length of a dendrite.
The number of total, tyrosinated and acetylated microtubules along the length of the dendrite shown in Figure 5B (left y-axis). The black line represents corresponding area of dendrite’s cross-section (right y-axis).
Figure 5—figure supplement 5
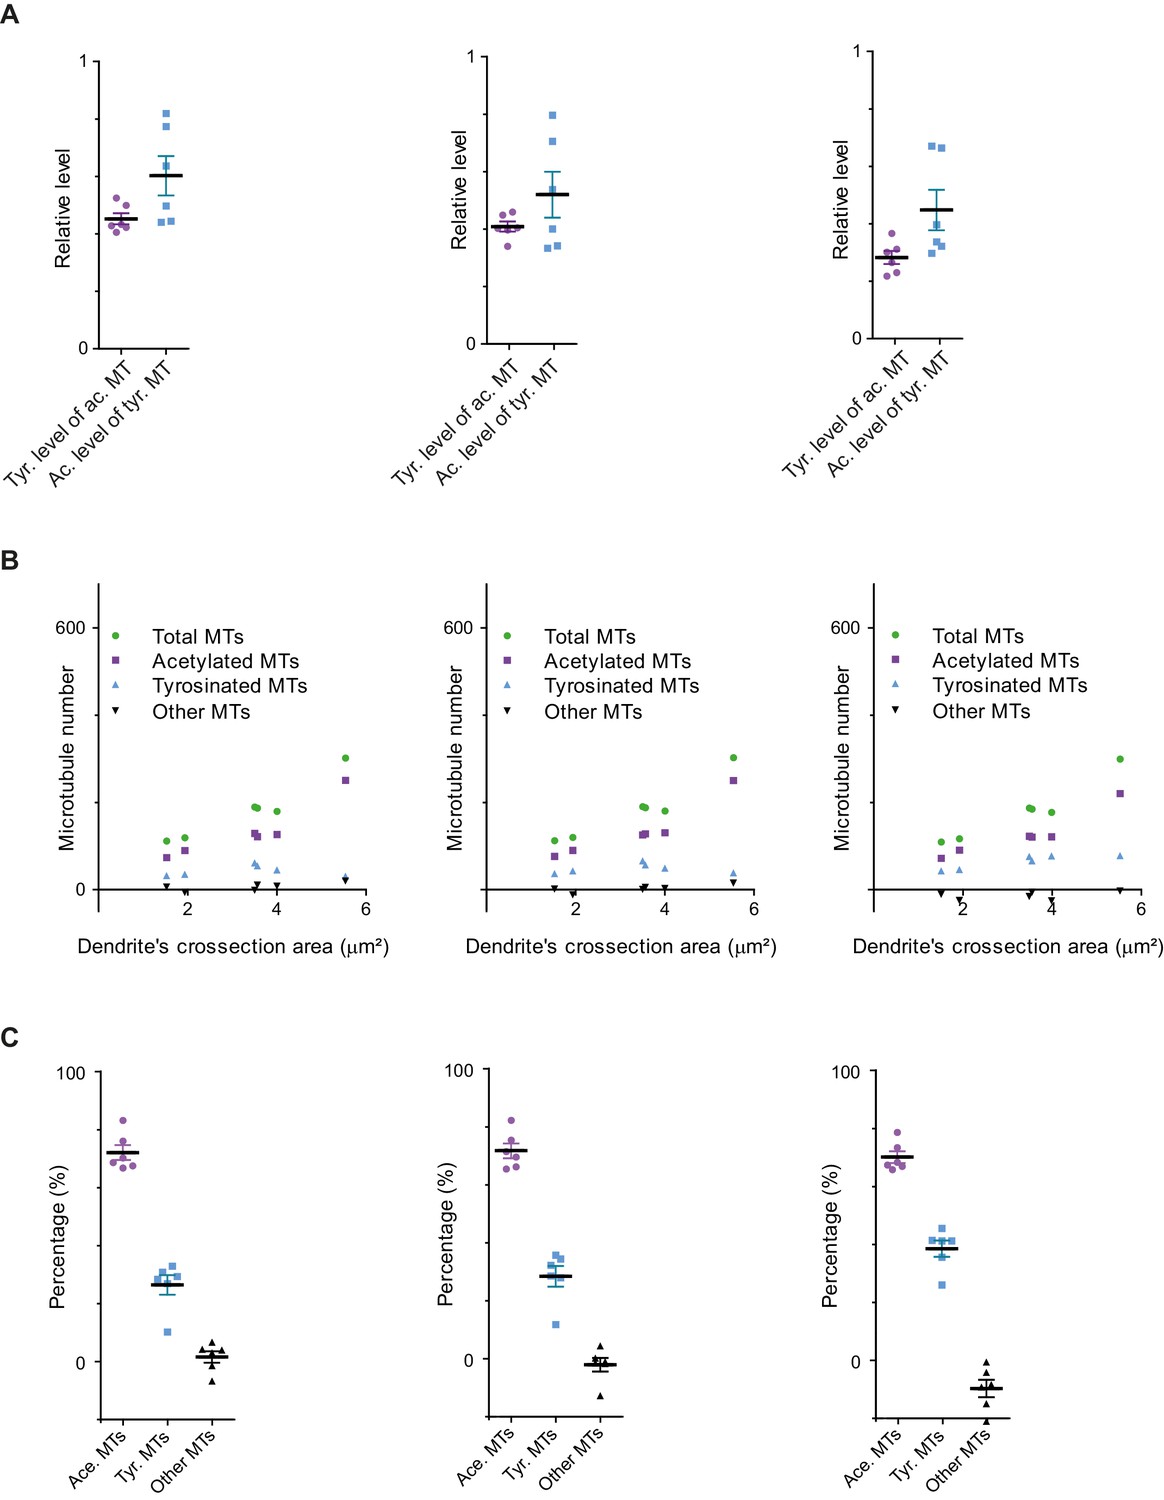
Different crosstalk estimation methods for FlipExM data.
(A)-(C) Comparison of different methods for quantification of tyrosination levels of acetylated MTs (α) and acetylation levels of tyrosinated MTs (β). In the left panels (same data as in Figure 5(G)-(I), shown here for comparison) values represent simple averaging of all data shown in Figure 5F. In the middle panels, averaging was performed after excluding intensity values above mean + SD in the detection channel. In the right panels a fit of sum of two Gaussians was performed to the histograms of tyrosination level of acetylated MTS (and vice versa) to detect a peak (mode) value. (A) Mean and SD values: (left panel) α = 0.45 ± 0.05, β = 0.60 ± 0.17; (middle panel) α = 0.41 ± 0.05, β = 0.52 ± 0.20; (right panel) α = 0.28 ± 0.06, β = 0.45 ± 0.17. (B) Microtubule number per dendrite as a function of dendrite’s cross-section area estimated using the three different crosstalk estimates shown in A (6 cells, N=2 independent experiments). (C) Mean percentage and SD values for acetylated, tyrosinated and other MTs using three different crosstalk estimates shown in (A): (left panel) 72 ± 6, 26 ± 8, 2 ± 5; (middle panel) 72 ± 6, 29 ± 9, -1 ± 6; (right panel) 70 ± 5, 39 ± 7, -9 ± 7.
Videos
Video 1
Illustration of radial intensity distribution analysis in dendrites acquired using STED microscopy.
Video 2
3D volumetric rendering of a dendrite imaged using ExM (same as in Figure 4A).
Scale bar corresponds to the physical post expansion size.
Video 3
Illustration of gel sample reorientation and microscope’s PSF for FlipExM imaging.
Video 4
3D volumetric rendering of a dendrite imaged using FlipExM (same as in Figure 5B).
Scale bar corresponds to the physical post expansion size.
Tables
Key resources table
| Reagent type (species) or resource | Designation | Source or reference | Identifiers | Additional information |
|---|---|---|---|---|
| Cell line (Cercopithecus aethiops) | COS7 | Lukas Kapitein lab | Cell line has not been authenticated, but mycoplasm testing was done fewer than 26 weeks before experiments | |
| Biological sample (Rattus norvegicus domestica) | Primary hippocampal neuron culture | Lukas Kapitein lab | Cultured on embryonic day 18 | |
| Antibody | Mouse monoclonal anti-Acetylated tubulin | Sigma | Cat#T7451, [6-11B-1], RRID:AB_609894 | IF Expansion (1:200), IF confocal/STED (1:600) |
| Antibody | Rat monoclonal anti-Tyrosinated tubulin | Abcam | Cat#Ab6160, [YL1/2], RRID:AB_305328 | IF Expansion (1:100), IF confocal/STED (1:250) |
| Antibody | Rabbit recombinant anti-alpha tubulin | Abcam | Cat# 52866, [EP1332Y] RRID:AB_869989 | IF Expansion (1:250), IF confocal/STED (1:500) |
| Antibody | Rabbit polyclonal anti-detyrosinated tubulin | Merck | Cat# AB3210, | IF STED (1:500) |
| Antibody | Rabbit anti-Δ2 tubulin | Millipore | Cat# AB3203, RRID:AB_177351 | IF STED (1:500) |
| Antibody | Alexa 594 Goat Anti-Rat IgG (H+L) | Molecular Probes, Life Technologies | Cat#A11007, RRID:AB_10561522 | IF Expansion (1:250), IF confocal/STED (1:500) |
| Antibody | Alexa 488 Goat Anti-Rabbit IgG (H+L) | Molecular Probes, Life Technologies | Cat#A11034, RRID:AB_2576217 | IF Expansion (1:250), IF confocal/STED (1:500) |
| Antibody | Alexa 594 Goat Anti-Mouse IgG (H+L) | Molecular Probes, Life Technologies | Cat#A11032, RRID:AB_2534091 | IF Expansion (1:250), IF confocal/STED (1:500) |
| Antibody | Alexa 488 Goat Anti-Rat IgG (H+L) | Molecular Probes, Life Technologies | Cat#A11006, RRID:AB_2534074 | IF Expansion (1:250), IF confocal/STED (1:500) |
| Antibody | Abberior Star 635P goat anti-mouse IgG (H+L) | Abberior GmbH | Cat#ST635P-1001–500 UG | IF Expansion (1:250), IF confocal/STED (1:500) |
| Antibody | Abberior Star 635P goat anti-rabbit IgG (H+L) | Abberior GmbH | Cat#ST635P-1002–500 UG | IF Expansion (1:250), IF confocal/STED (1:500) |
| Chemical compound,drug | Triton X-100 | Sigma | Cat#X100 | |
| Chemical compound,drug | Gluteraldehyde (8%) | Sigma | Cat#G7526 | |
| Chemical compound,drug | Paraformaledehyde (16%) | Electron Microscopy Sciences | Cat#15710 | EM-grade |
| Chemical compound,drug | Acryloyl-X | Thermo Fisher | Cat#A20770 | |
| Chemical compound,drug | Sodium Acrylate | Sigma Aldrich | Cat#408220 | |
| Peptide, recombinant protein | Proteinase K | ThermoFisher | Cat#EO0492 | |
| Software, algorithm | Huygens Professional software version 17.04 | Scientific Volume Imaging, the Netherlands | RRID:SCR_014237 | |
| Software, algorithm, | Correlescence plugin v.0.0.4 (2021) | Eugene Katrukha | https://github.com/ekatrukha/Correlescence https://doi.org/10.5281/zenodo.4534715 | |
| Software, algorithm, | CurveTrace plugin ver.0.3.5 (2021) | Eugene Katrukha | https://github.com/ekatrukha/CurveTrace https://doi.org/10.5281/zenodo.4534721 | |
| Software, algorithm | ComDet plugin v.0.5.3 (2021) | Eugene Katrukha | https://github.com/ekatrukha/ComDet https://doi.org/10.5281/zenodo.4281064 | |
| Other | Silicone mold for gels 13 mm | Sigma-Aldrich | Cat#GBL664107 |
Additional files
Download links
A two-part list of links to download the article, or parts of the article, in various formats.
Downloads (link to download the article as PDF)
Open citations (links to open the citations from this article in various online reference manager services)
Cite this article (links to download the citations from this article in formats compatible with various reference manager tools)
Quantitative mapping of dense microtubule arrays in mammalian neurons
eLife 10:e67925.
https://doi.org/10.7554/eLife.67925


