PI3K signaling specifies proximal-distal fate by driving a developmental gene regulatory network in SOX9+ mouse lung progenitors
- Department of Pediatrics, University of Cincinnati, United States
- Perinatal Institute, Cincinnati Children's Hospital Medical Center, United States
- Division of Neonatology, Perinatal and Pulmonary Biology, Cincinnati Children's Hospital Medical Center, United States
- Wake Forest University, United States
- Department of Medicine, University of Cincinnati, United States
Figures
Figure 1 with 1 supplement

The SOX9+multi-potent lung epithelial progenitor cell population.
(A–C) Whole mount confocal imaging of embryonic lungs isolated from SOX9-GFP reporter mice at E12.5 (A), E13.5 (B), and E14.5 (C) show SOX9 expression at the distal branch tips and in the tracheal mesenchyme. (D) Schematic summarizing the transcription factors known to play an important role in the development and differentiation of the SOX9+progenitors. (E–I) Immunofluoresence microscopy shows high levels of SOX9 staining in the epithelium of the distal lung tips, with a high percentage of Ki67 +proliferating cells early in development. (J–M) Monocle3 lineage analysis was performed on E11.5 FACS-sorted lung epithelium and E16.5 whole lung. (J) Lineage analyses predict E11.5 lung epithelial cells give rise to both proximal and distal lung epithelial cells at E16.5. (K) Known distal and proximal genes markers are expressed in their corresponding cell clusters at E16.5 but not E11.5, validating cluster identification. Cluster labels: 1 – E11.5 lung epithelium; 2 – E16.5 airway epithelium; 3 – E16.5 distal epithelium. (L) Monocle 3 analysis of isolated epithelial populations identifies multiple gene modules with specific expression patterns. One module of gene expression is consistent with the predicted distal differentiation trajectory and consists of genes related to processes important to lung development, including epithelial/respiratory system branching and development. (M) The expression patterns of example genes in this module are visualized and include genes known to be essential for proper distal lung development including Sox9, Wnt7b, Hmga2, and Bmp4. Scale bars: 200 µm (A–C), 50 µm (E–I).
Figure 1—figure supplement 1
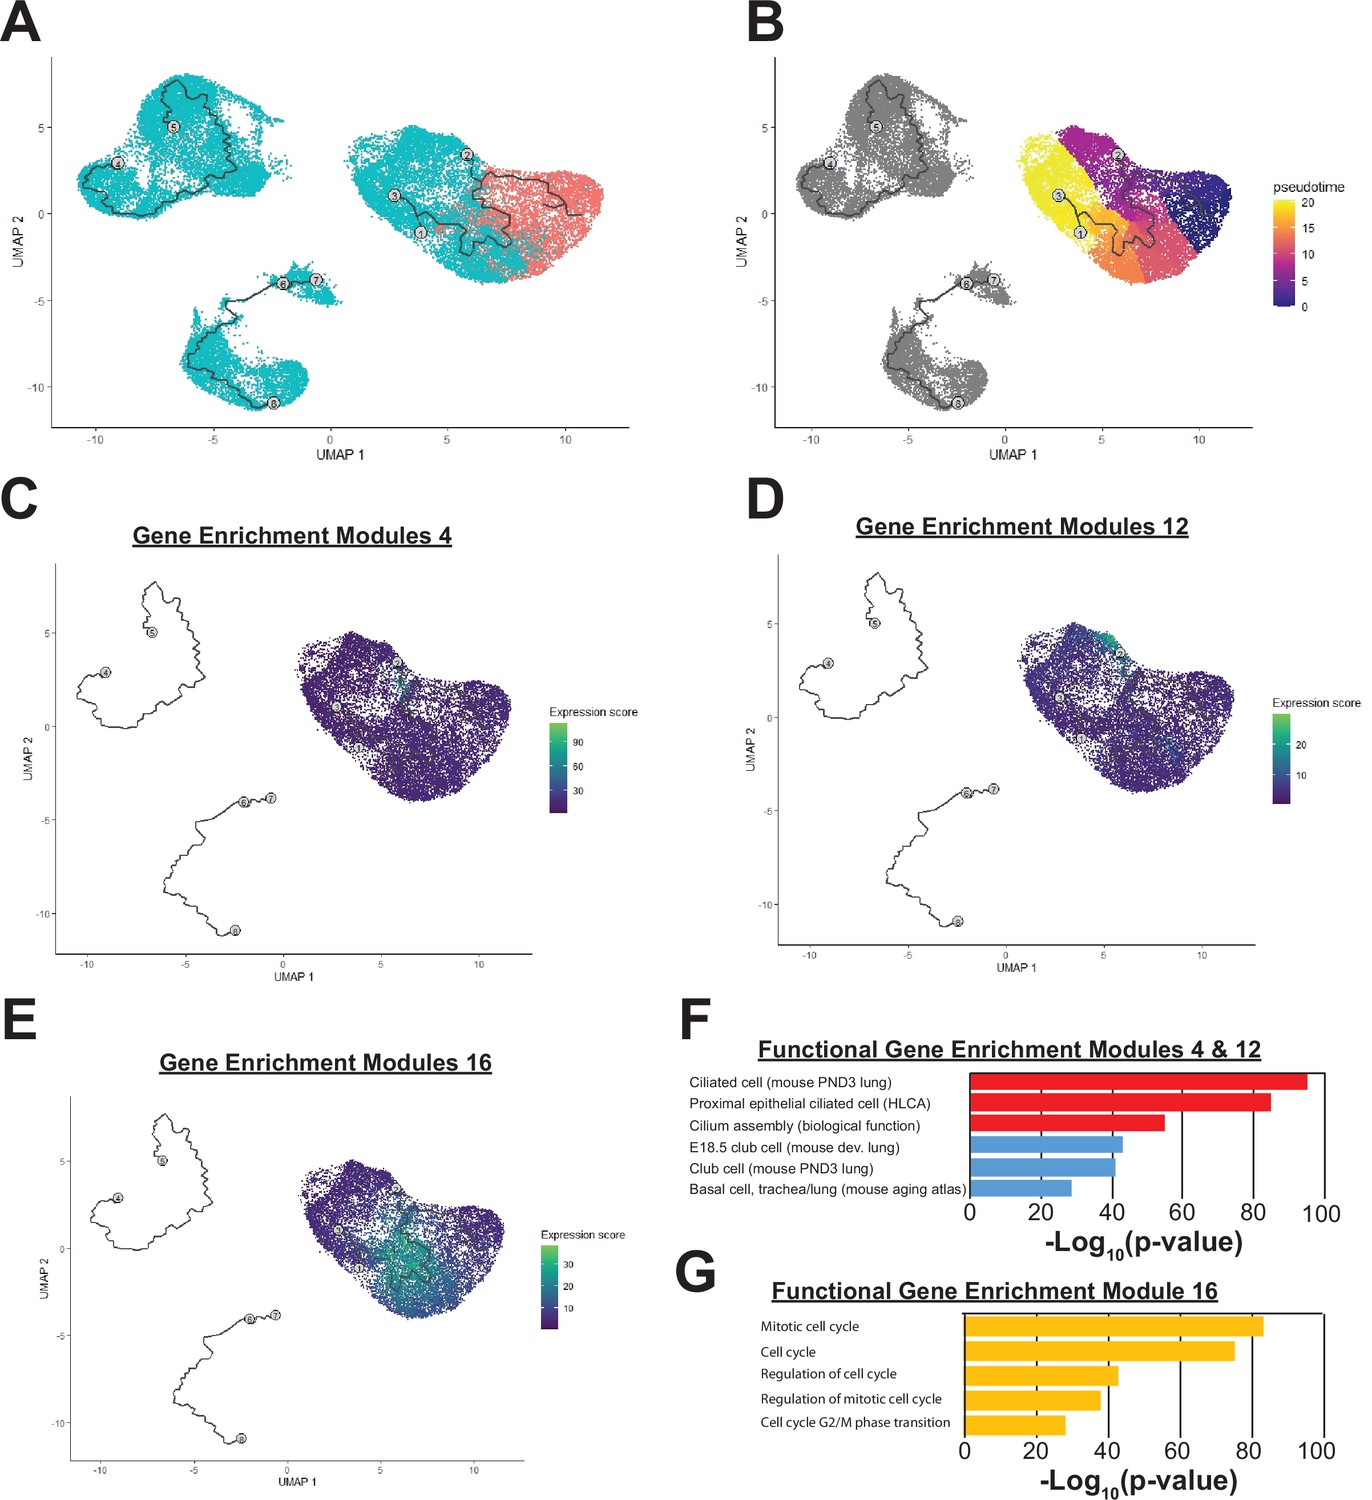
Single-cell analysis of mouse embryonic lung.
(A) Sample batches are indicated (red – E11.5 lung epithelium; blue – E16.5 lung epithelium). (B) Monocle pseudotime heatmap is shown. (C–D) Gene enrichment modules 4 and 12 are highly enriched for components of the ciliated and secretory cell epithelium respectively. (E) Gene enrichment module 16 are highly enriched in genes involved in cell cycle regulation, and cells expressing these targets are found in greatest numbers at the center of the pseudotime pathway. (F–G) Gene set enrichment categories for modules 4 and 12 (F) and module 16 (G) are shown.
Figure 2 with 4 supplements
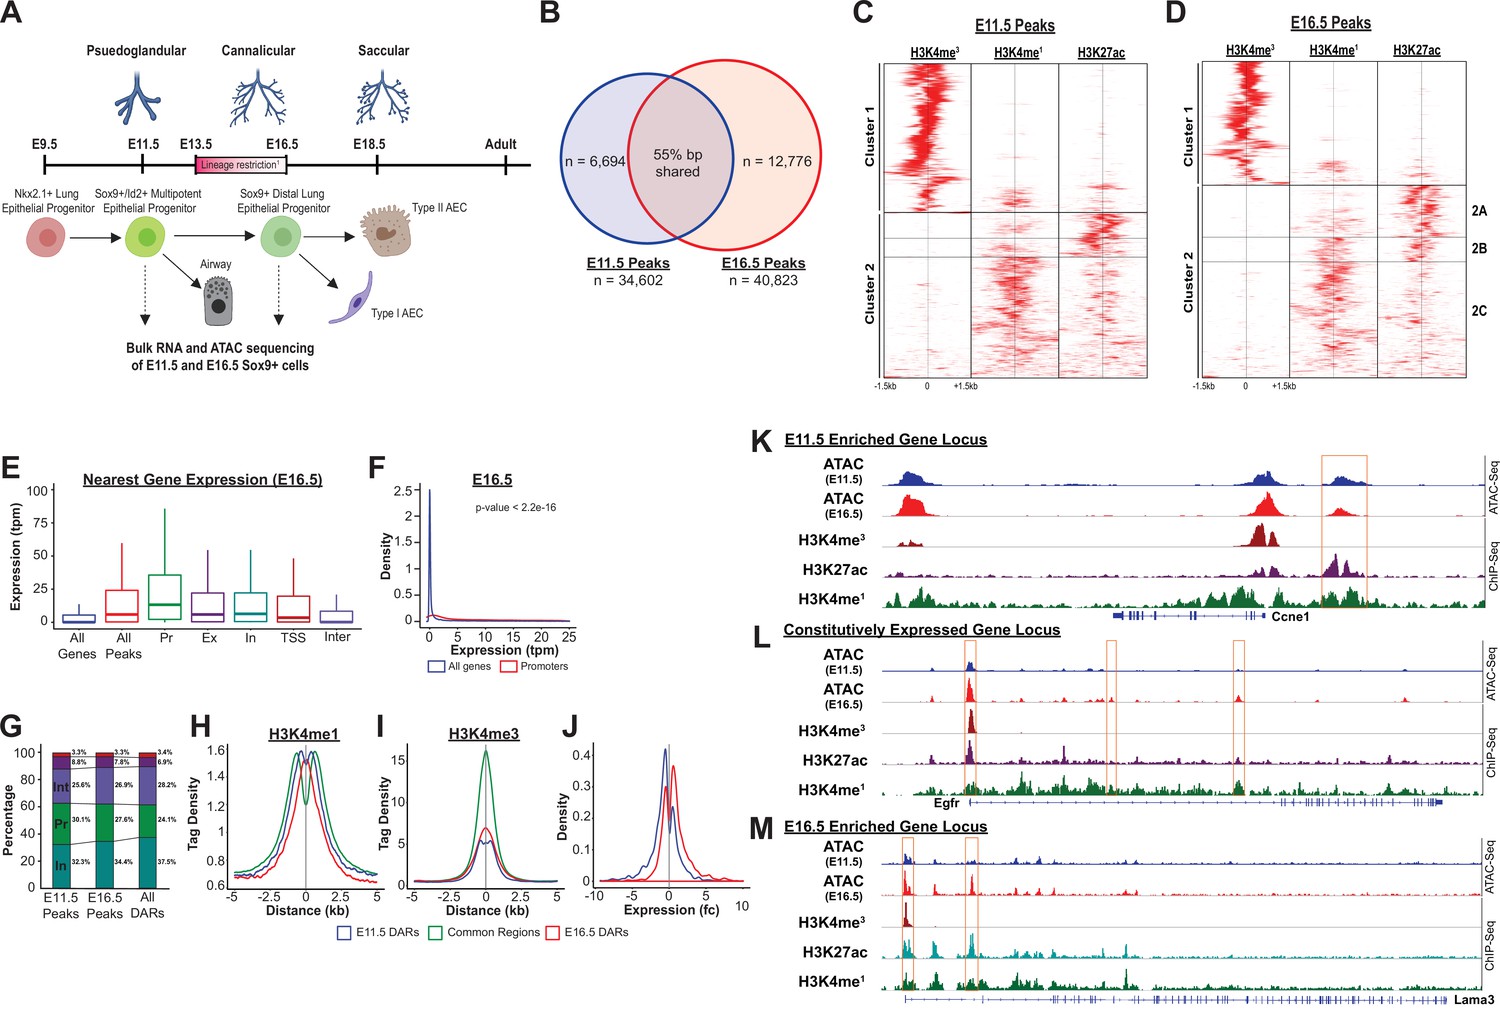
The SOX9+progenitor cell chromatin accessibility landscape.
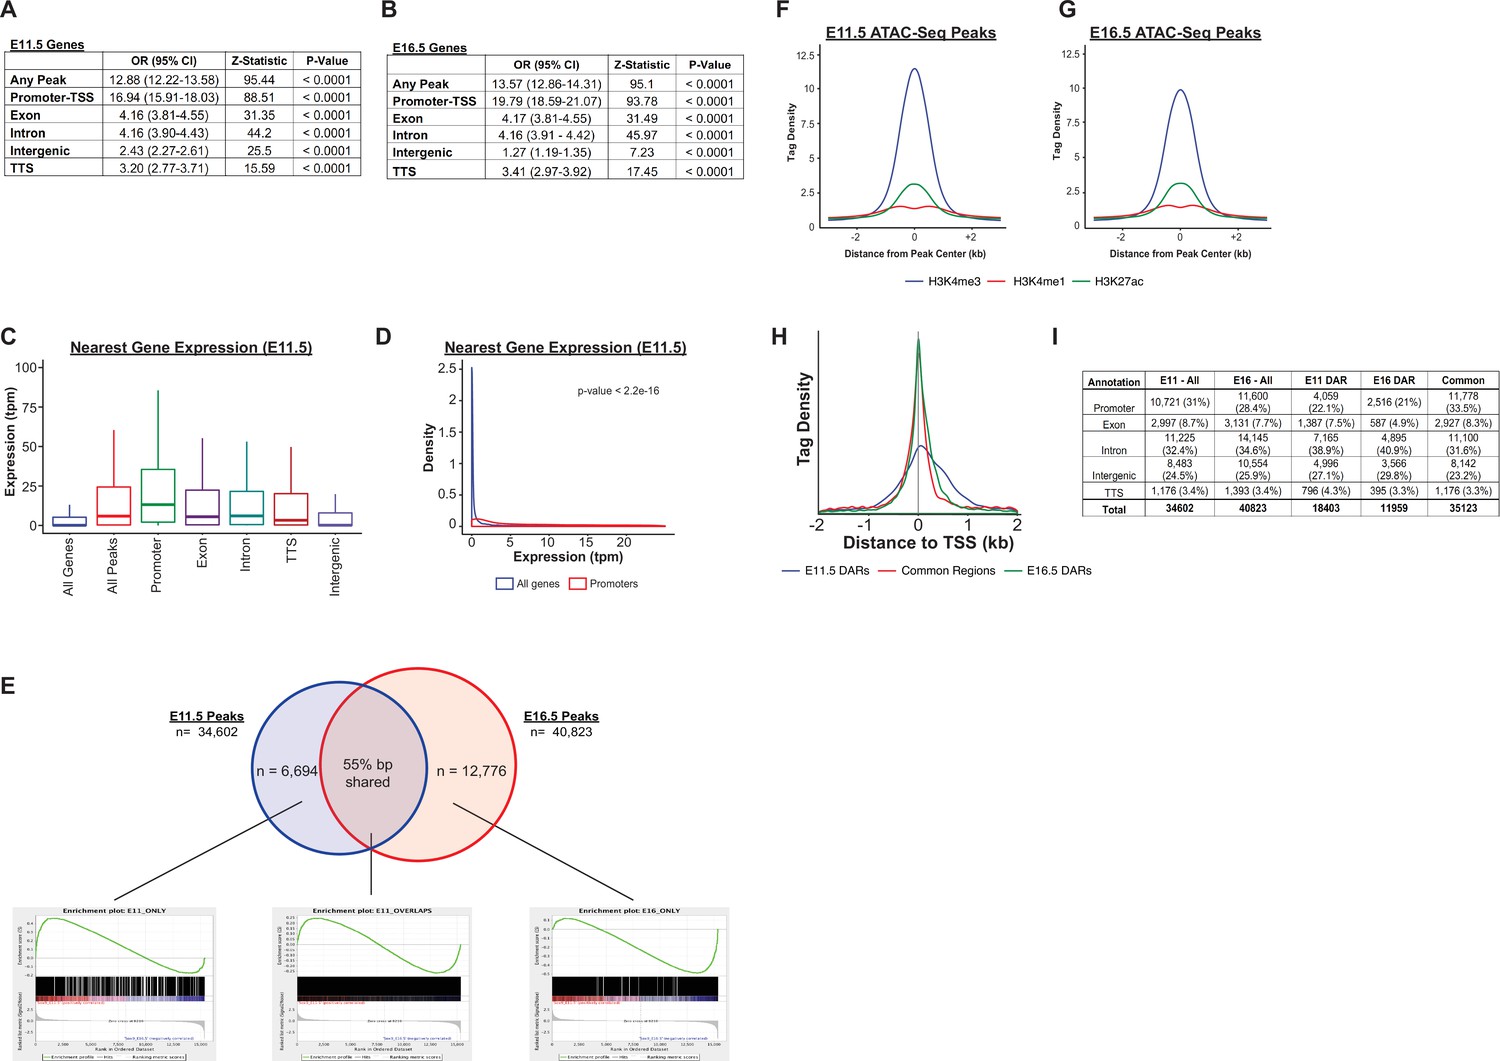
(A) Schematic strategy for isolation of SOX9+EPC. Cells sorted at E11.5 and E16.5 were used for RNA-seq and ATAC-seq analysis (n=2 biological replicates pooled from 8 to 12 embryos at each timepoint for ATAC-Seq, n=3 pooled biological replicates for RNA-Seq), which correspond to pseudoglandular and late saccular stages of lung development. (B) More than 34,000 regions of open chromatin were identified by ATAC-Seq at each developmental timepoint. (C–D) ChIP-Seq tag densities for H3K4me3, H3K4me1, and H3K27ac were plotted and clustered using Homer and R, respsectively. H3K4me3 tag density corresponds to the accessible promoter regions (Cluster 1), and H3K4me1 with or without H3K27ac correspond to active and ‘decommissioned’ enhancer regions (Clusters 2 A-C), respectively. (E–F) Gene expression levels correlate with the presence of a nearby region of open chromatin, particularly when it is located within the promoter region. Pr – Promoter; Ex – Exonic; In – Intronic; TSS – Transcriptional Stop Site; Inter – Intergenic (G) Differentially accessible chromatin regions (DARs) were more likely to be located with intronic (In) and intergenic (Int) regions instead of promoters. (H) H3K4me1 peak enrichment is found at the center of DARs. (I) Common regions were more enriched for H3K4me3 signal compared to DARs at either timepoint. (J) E11.5 and E16.5 DARs correlate with expression of nearby genes by RNA-seq. (K–L) Examples of three categories of genomic loci are shown: (K) Decreasing levels of accessibility over time for progenitor genes, (L) Changing accessibility without change in gene expression for housekeeping genes, and (M) Increasing accessibility at later developmental timepoints for genes required for function fo the mature lung.
Figure 2—figure supplement 1

Bulk RNA-Seq analysis of the developing SOX9+EPC population.
(A) A Volcano plot for genes differentially expressed between E11.5 and E16.5 in SOX9+EPCs is shown. (B–C) Gene ontology analysis demonstrates that differentially expressed genes at E11.5 are enriched in functions involved with cell proliferation, protein synthesis, and ‘signaling pathways regulating pluripotency’ (B), whereas genes with increased expression levels at E16.5 are enriched in functions associated with the mature distal lung epithelium, such as surfactant production (e.g. ‘phagosome’, ‘lysosome’, ‘sphingolipid metabolism’, ‘protein export’), epithelial barrier function (e.g. ‘ECM-receptor interaction’, ‘focal adhesion’, ‘collective duct secretion’), and a switch in energy metabolism (e.g. ‘oxidative phosphorylation’, ‘citrate/TCA cycle’) (C).
Figure 2—figure supplement 2
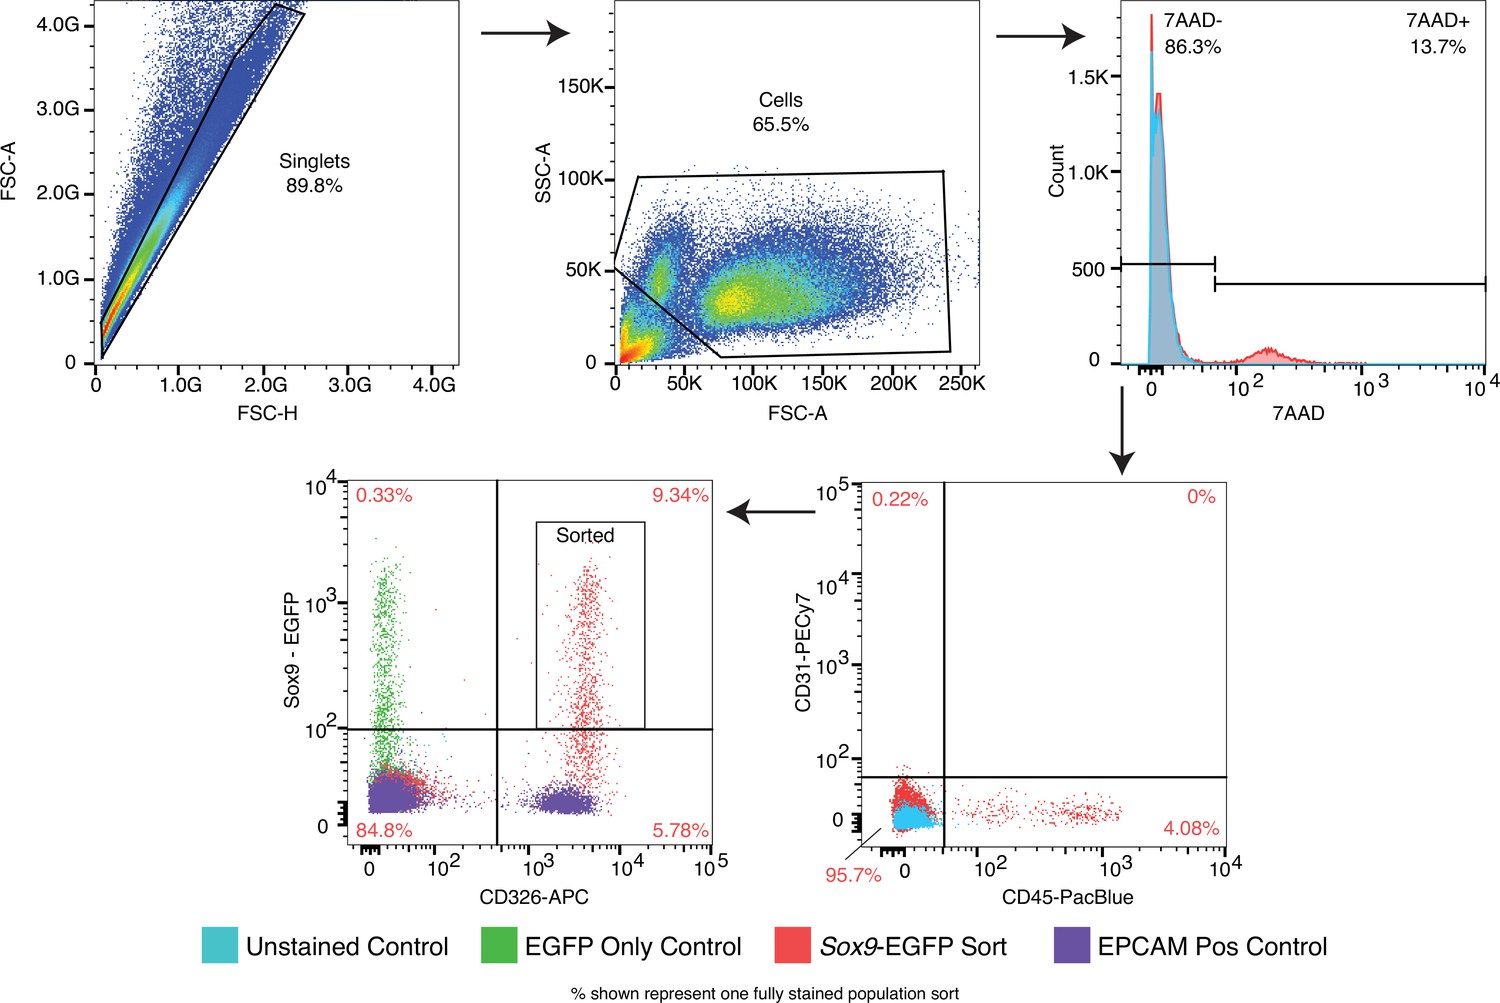
FACS sorting strategy for isolation of Sox9+EPC cells.
SOX9+lung epithelial progenitor cells were isolated by cell sorting CD326+/CD31-/CD45-/7-AAD-/GFP + cells isolated from Sox9-GFP reporter embryos at E11.5 and E16.5. Key single stain controls are shown.
Figure 2—figure supplement 3
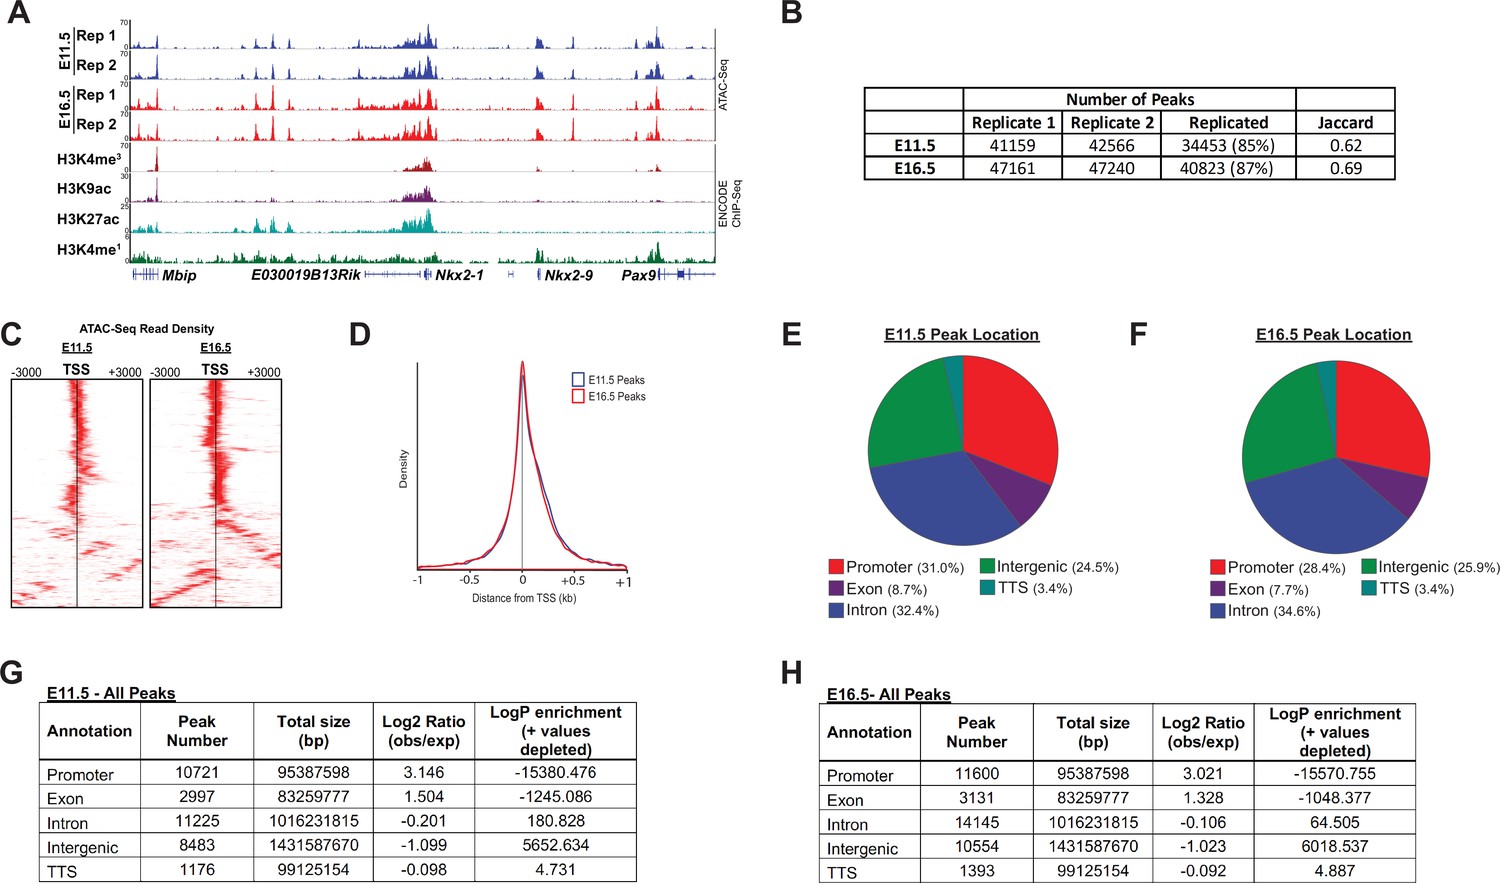
ATAC-Seq peak characteristics.
(A) A representative locus for a well-expressed gene (Nkx2.1) shows the high degree of consistency between biological replicates, and strong correlation between open regions of chromatin with histone post-translational modifications known to mark active cis-regulatory regions. (B) The number of peaks identified by MACS2 for each biological replicate, and replication statistics, are shown. (C) Heatmaps display the high-degree of enrichment for ATAC-seq reads within and immediately surrounding transcriptional start-sites (TSSs). (D) ATAC-req density is plot as a function of distance from the transcriptional start site (TSS). (E–H) The distribution of ATAC-Seq peaks by genomic location is shown.
Figure 2—figure supplement 4
Accessible chromatin regions, associated histone marks, and neighboring gene expression.
(A–B) The relationship between gene expression and the presence of a nearby region of accessible chromatin is displayed. Data is shown as the odds that a gene is expressed, compared to the set of all genes, for those genes identified as the nearest neighbor to a region of accessible chromatin (Any Peak). These relationships are further broken down by the types of genomic region in which the accessible region falls. (C–D) The expression levels for genes nearest to any region of accessible chromatin (All Peaks), or peaks corresponding to a particular genomic region are shown for E11.5, plotted as either a bar-whisker plot (C) or density plot (D) (data for E16.5 is shown in main Figure 3E–F). (E) Gene-set enrichment analysis (GSEA) for peaks unique to E11.5 or peaks unique to E16.5 reveals an increased number of genes with higher levels of expression at that same developmental timepoint. In contrast, peaks identified at both developmental timepoints do not show a consistent direction of differential expression. (F–G) Density plots for H3K4me3, H3K4me1, and H3K27ac ChIP-Seq read density are displayed relative to the center of identified ATAC-Seq peaks at E11.5 (F) and E16.5 (G). (H) Density of ATAC-Seq reads associated with E11.5 DARs, E16.5 DARs, and common regions relative to transcriptional start sites (TSSs) are shown. (I) The distribution of E11.5 DARs, E16.5 DARs, and common regions by genomic location is shown.
Figure 3
Paired expression and chromatin acessibility modeling of SOX9+progenitor cells.
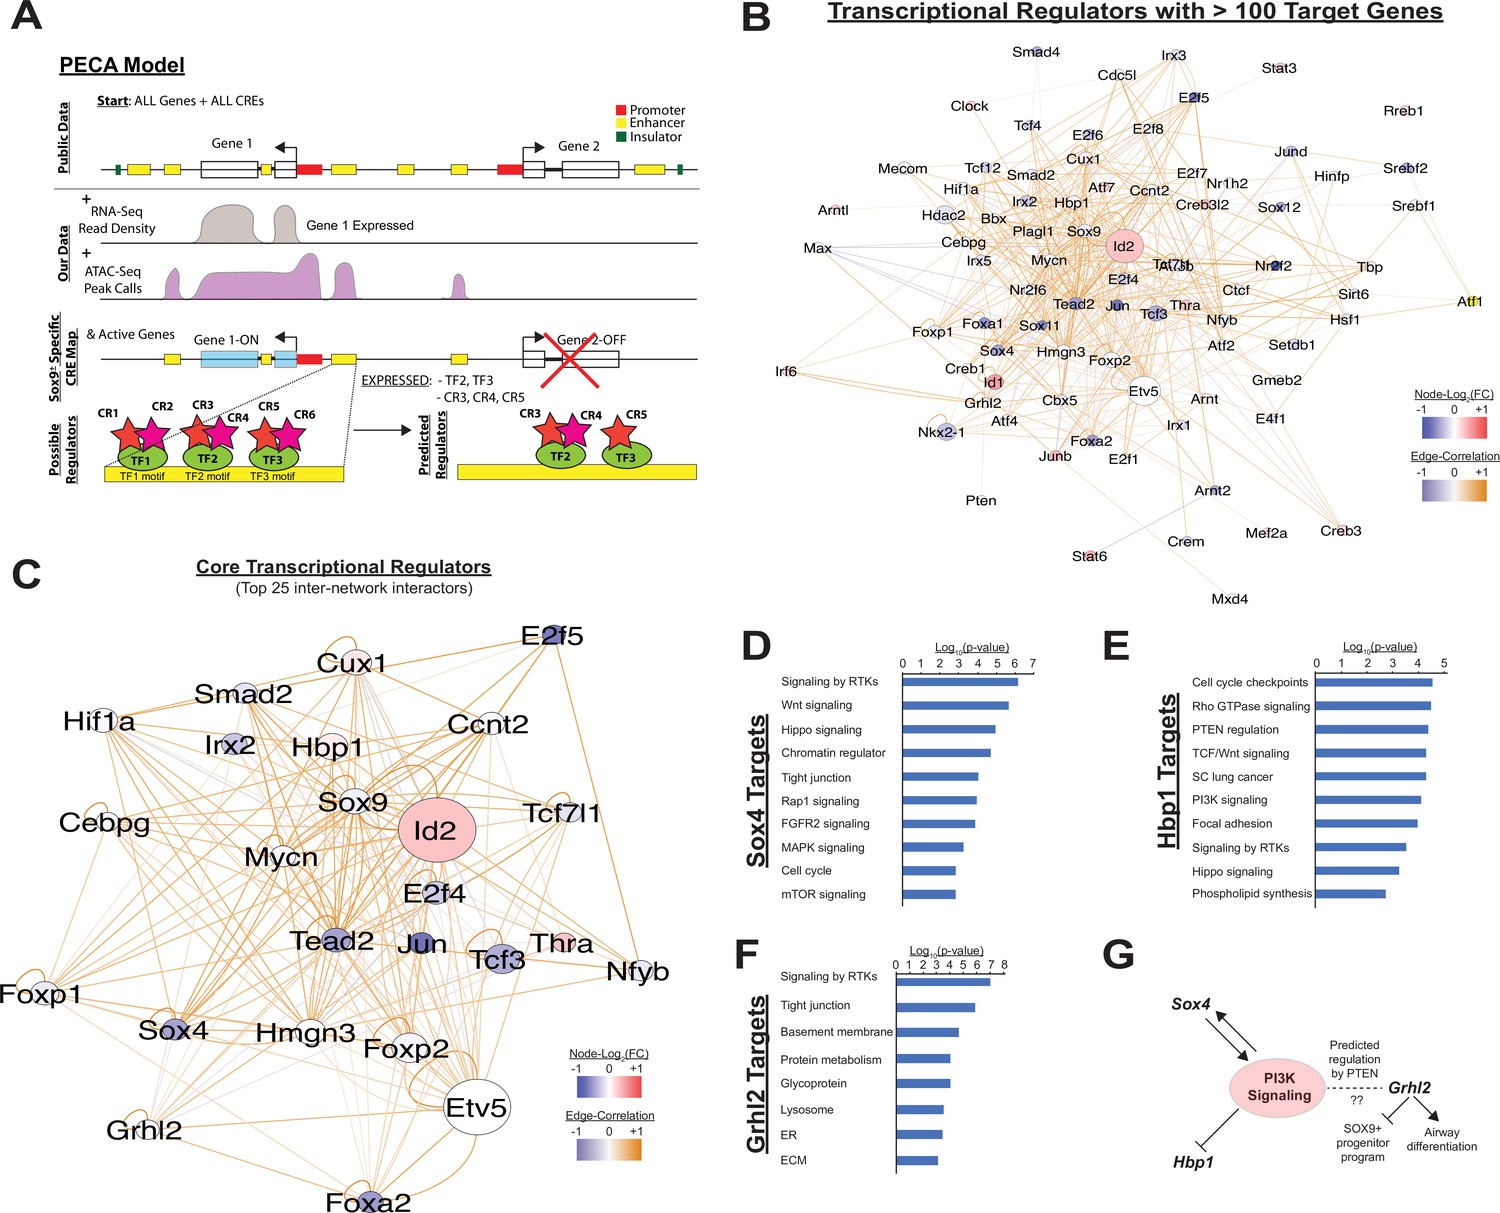
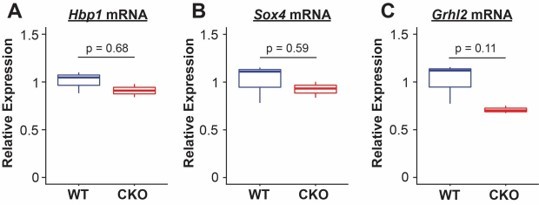
(A) The computational model Paired Expression and Chromatin Accessibility (PECA) was used to develop a SOX9+ epithelial progenitor cell gene regulatory network. Potential active cis-regulatory elements, key transcription factor (TF) networks, and chromain regulatory (CR) protein complexes active in the SOX9+ EPCs cells are predicted. (B) The co-regulatory relationships between transcription factors with more than 100 predicted target genes are shown. Network nodes (TFs) are color coded according to their expression log2 fold-change between E11.5 to E16.5 (blue – decreasing expression, red – increasing expression), and network edges are color coded according to the correlation coefficient between the two indicated TFs (blue and organge indicate negative and positive regulatory relationships, respectively). (C) The transcription factors with the top 25 highest degree of network interactions in EPCs. (D–E) The TFs Hbp1 and Sox4 interact with PI3K signaling. Gene ontology analysis of predicted targets of these TFs in the SOX9+ progenitor cell network are shown. (F) Grhl2 has previously been shown to promote airway differentiation, and its loss leads to expansion of the SOX9+ progenitor population. Our network data predict regulation of Grhl2 expression through the PI3K signaling pathway. (G) Putative relationships between the PI3K signaling pathway and several key nodes of the SOX9+ progenitor cell gene regulatory network.
Figure 4
PI3K signaling in ATAC data.
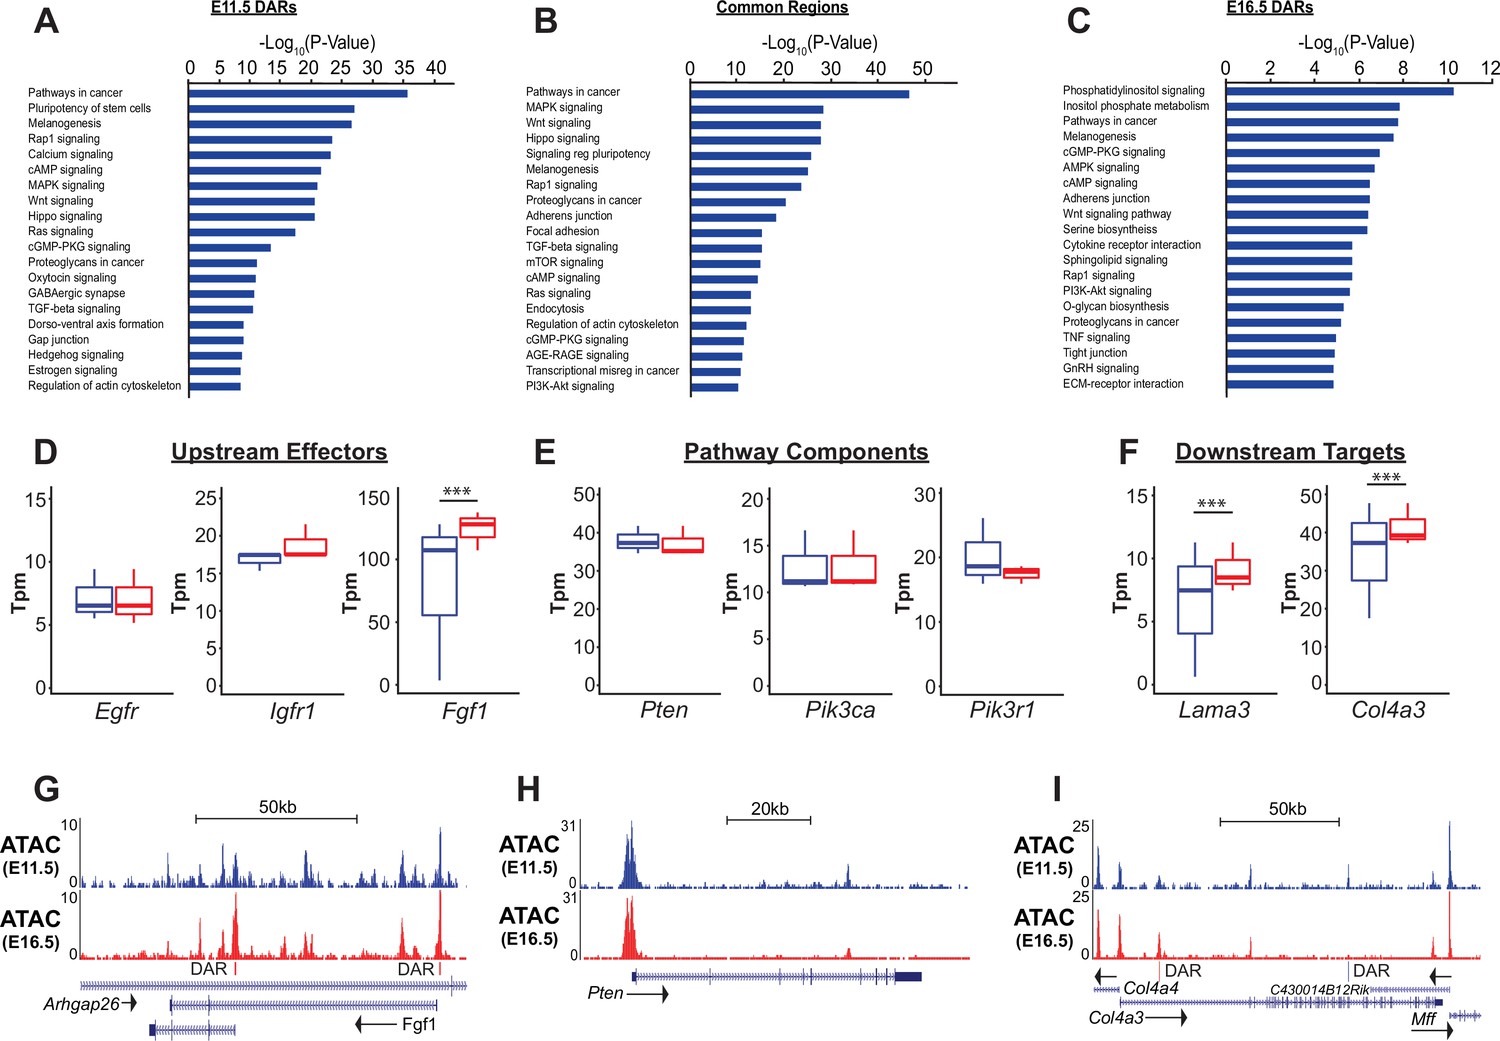
(A–C) Gene ontology analysis for genes nearest E11.5 and E16.5 differentially accessible regions (DARs) and common regions are shown. Pathways regulating lung epithelial development, such as Wnt, Hippo, and Hedgehog signaling are identified. A number of GO catatories associated with PI3K signaling were over-represented in genes adjacent to E16.5 DARs, as well as those nearby common regions. (D–I) Examples include proteins upstream of PI3K signaling (D,G), core pathway components (E,H), and known downstream targets of PI3K sigaling (F,I). Many of the downstream targets are components of epithelial basement membrane, which increase as development proceeds. (G–I) Examples of DARs correlated with gene expression changes for Fgfr1 and Col4a3 are shown. Pten, which does not change in expression between E11.5 and E16.5 has common accessible regions of chromatin (in promoter and 5th intron). E11.5 is shown in blue, E16.5 in red. Two-tailed Student’s t-test used for D-F. *** p<0.001.
Figure 5
Phospho-AKT staining in the developing lung epithelium.
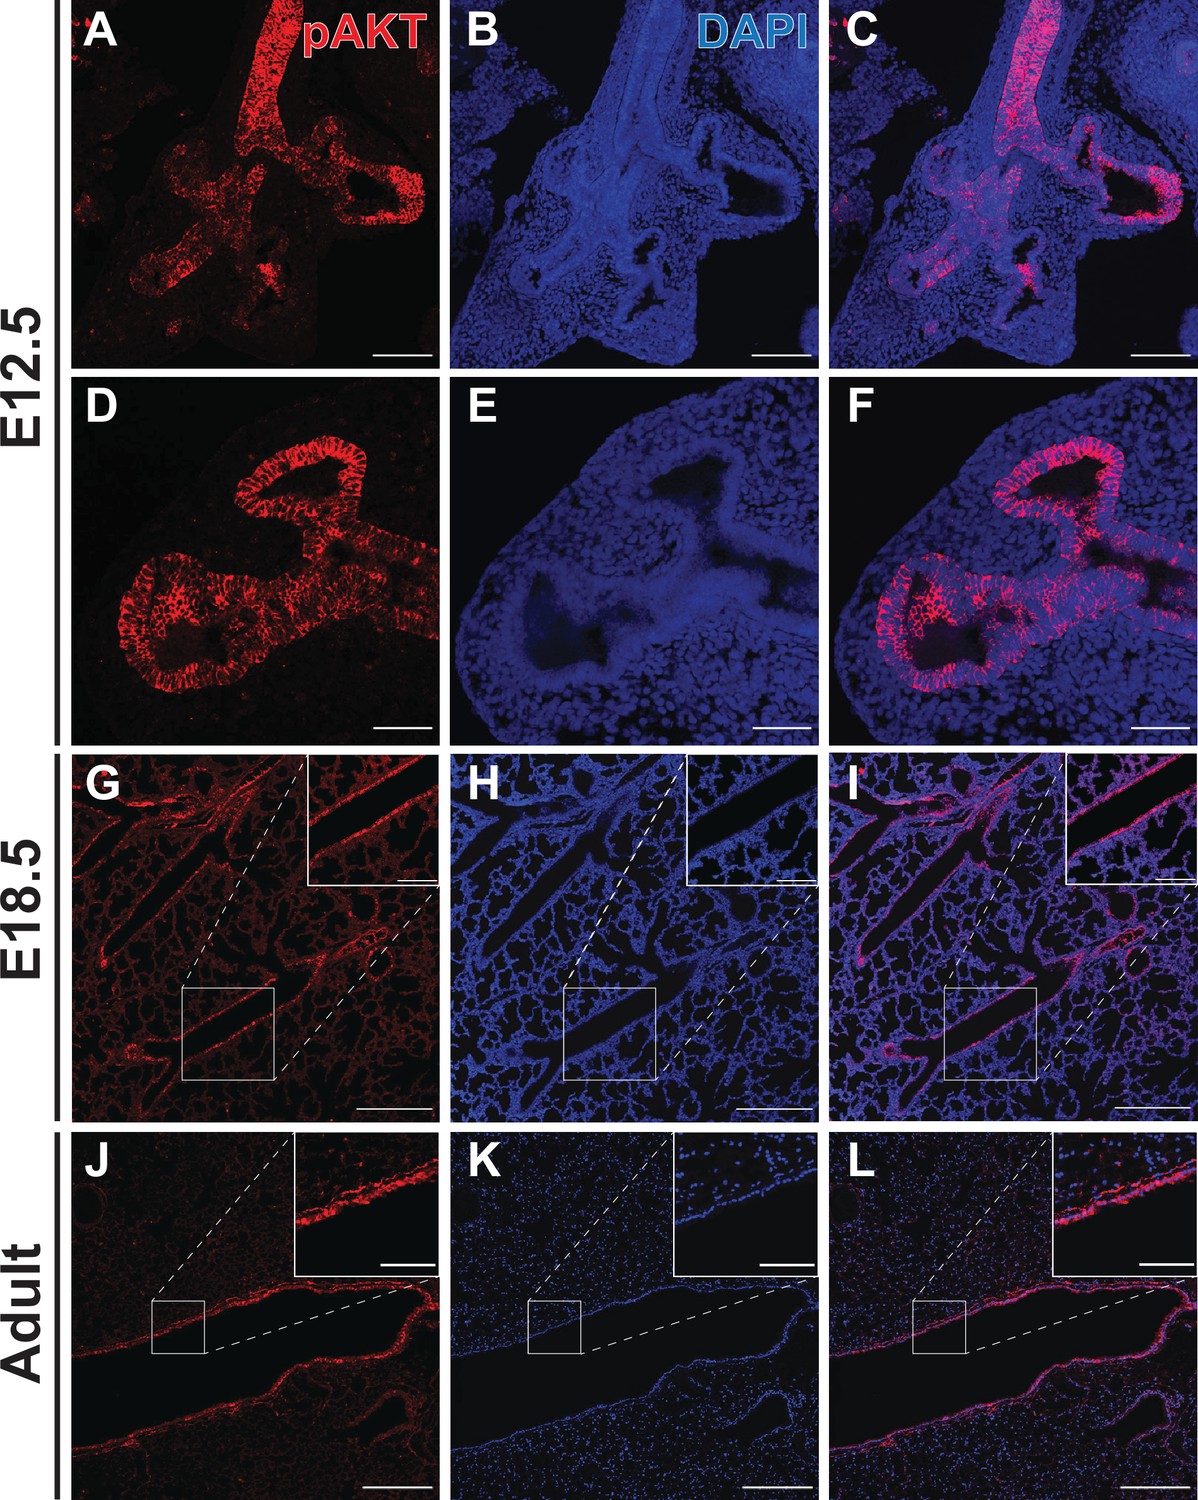
(A–F) Strong staining for AKT phosphorylated at Ser473 (pAKT) was observed in the early lung epithelium at E12.5, with minimal staining seen in the mesenchyme. Staining intensity was highest in the proximal lung, but appeared to be pan-epithelial with relatively intense staining also observed at the distal tips. (G–I) By E18.5, highest levels of pAKT staining were detected in epithelial cells lining the large conducting airways. (J–L) Strong pAKT staining was observed in the conducting airway epithelium, with notable expression in the sub-epithelial airway mesenchyme (see inset). Scale bars: 100 µm (A–C), 50 µm (D–F), 250 µm (G–L), 100 µm (inset G-I), 50 µm (inset J-L).
Figure 6 with 1 supplement

Conditional deletion of Pik3ca from the developing lung epithelium results in impaired branching morphogenesis and cystic pulmonary hypoplasia.
(A–B) Whole-mount images show cystic areas throughout the lungs of Pik3ca cKO embryos at E18.5. The lungs are smaller in size compared to littermate controls. (C–F) Widefield imaging of H&E stains shows numerous cystic areas in Pik3ca cKO and a paucity of conducting airways at E18.5. The majority of the lung tissue consists of simplified alveolar structures. (G–N) A time-series of Pik3ca cKO embryonic lungs show a decreased number of epithelial branches and smaller lung size at E12.5 and E14.5 (G–J). Dilated airspaces are evident by E16.5 (K–L), and large cystic structures with simplified alveoli are seen at E18.5 (M–N). Scale bars: 2.5 mm (A–B), 100 µm (C–H), 250 µm (I–L), 500 µm (M–N).
Figure 6—figure supplement 1
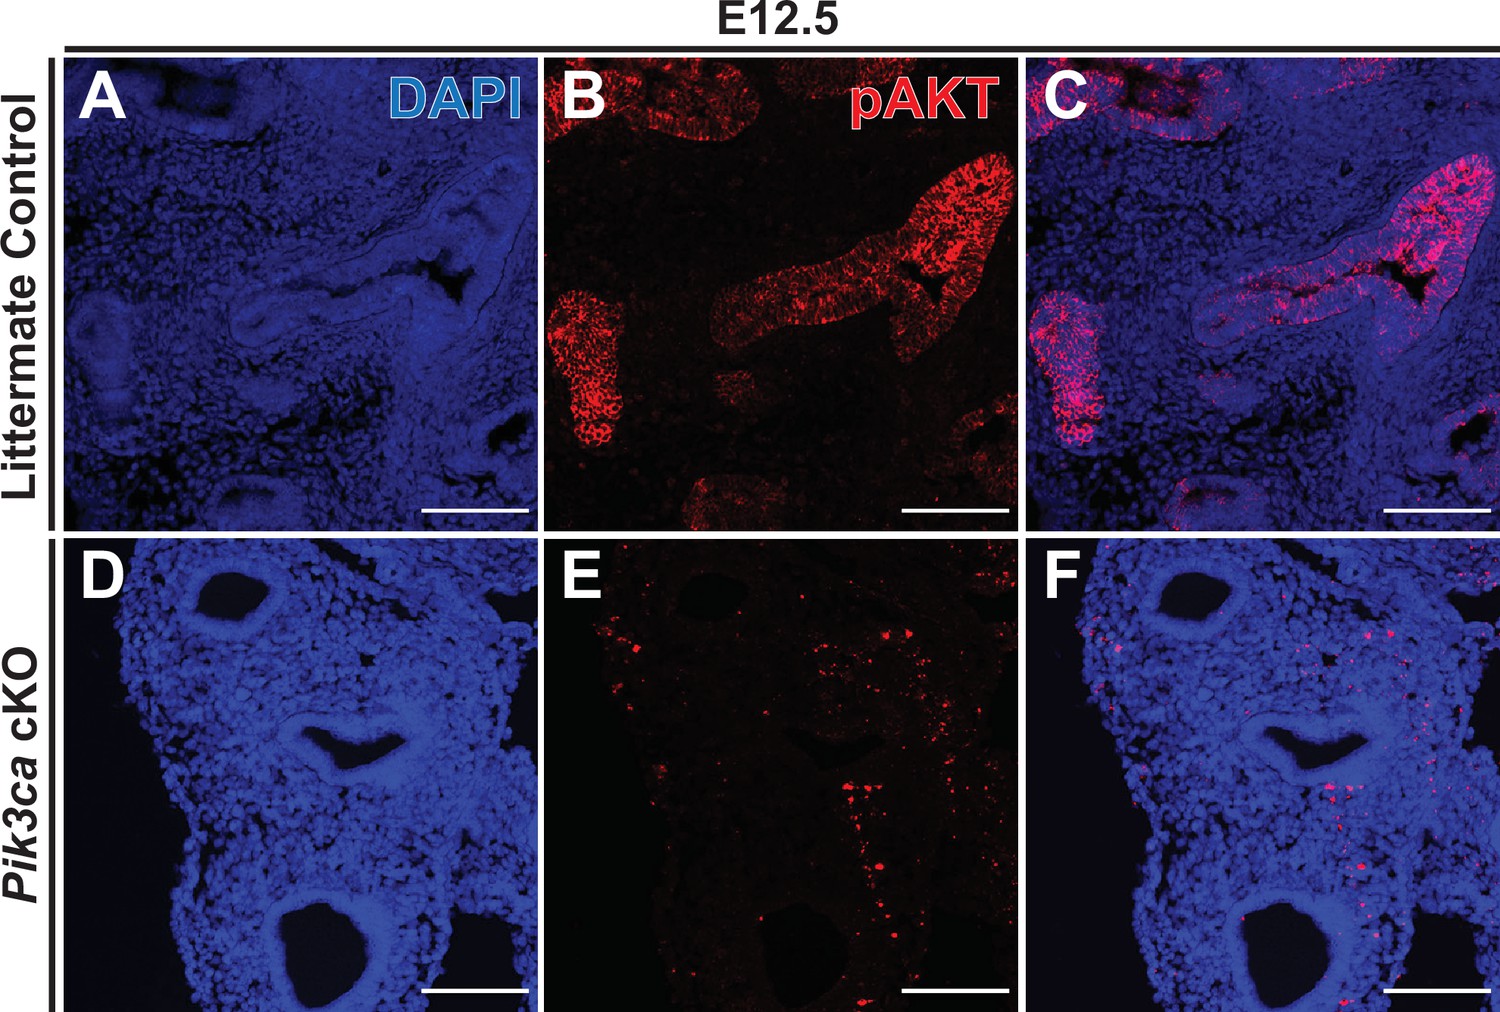
Conditional deletion of Pik3ca with Shh-Cre results in loss of epithelial pAKT staining.
(A–C) In littermate control embryos, immunofluorescence microscopy clearly detected phospho-AKT (pAKT) in the lung epithelium at E12.5. (D–F) In Pik3ca cKO embryos, no detectable pAKT signal was observed in the epithelium as early as E12.5. Scale bars: 100 µm.
Figure 7
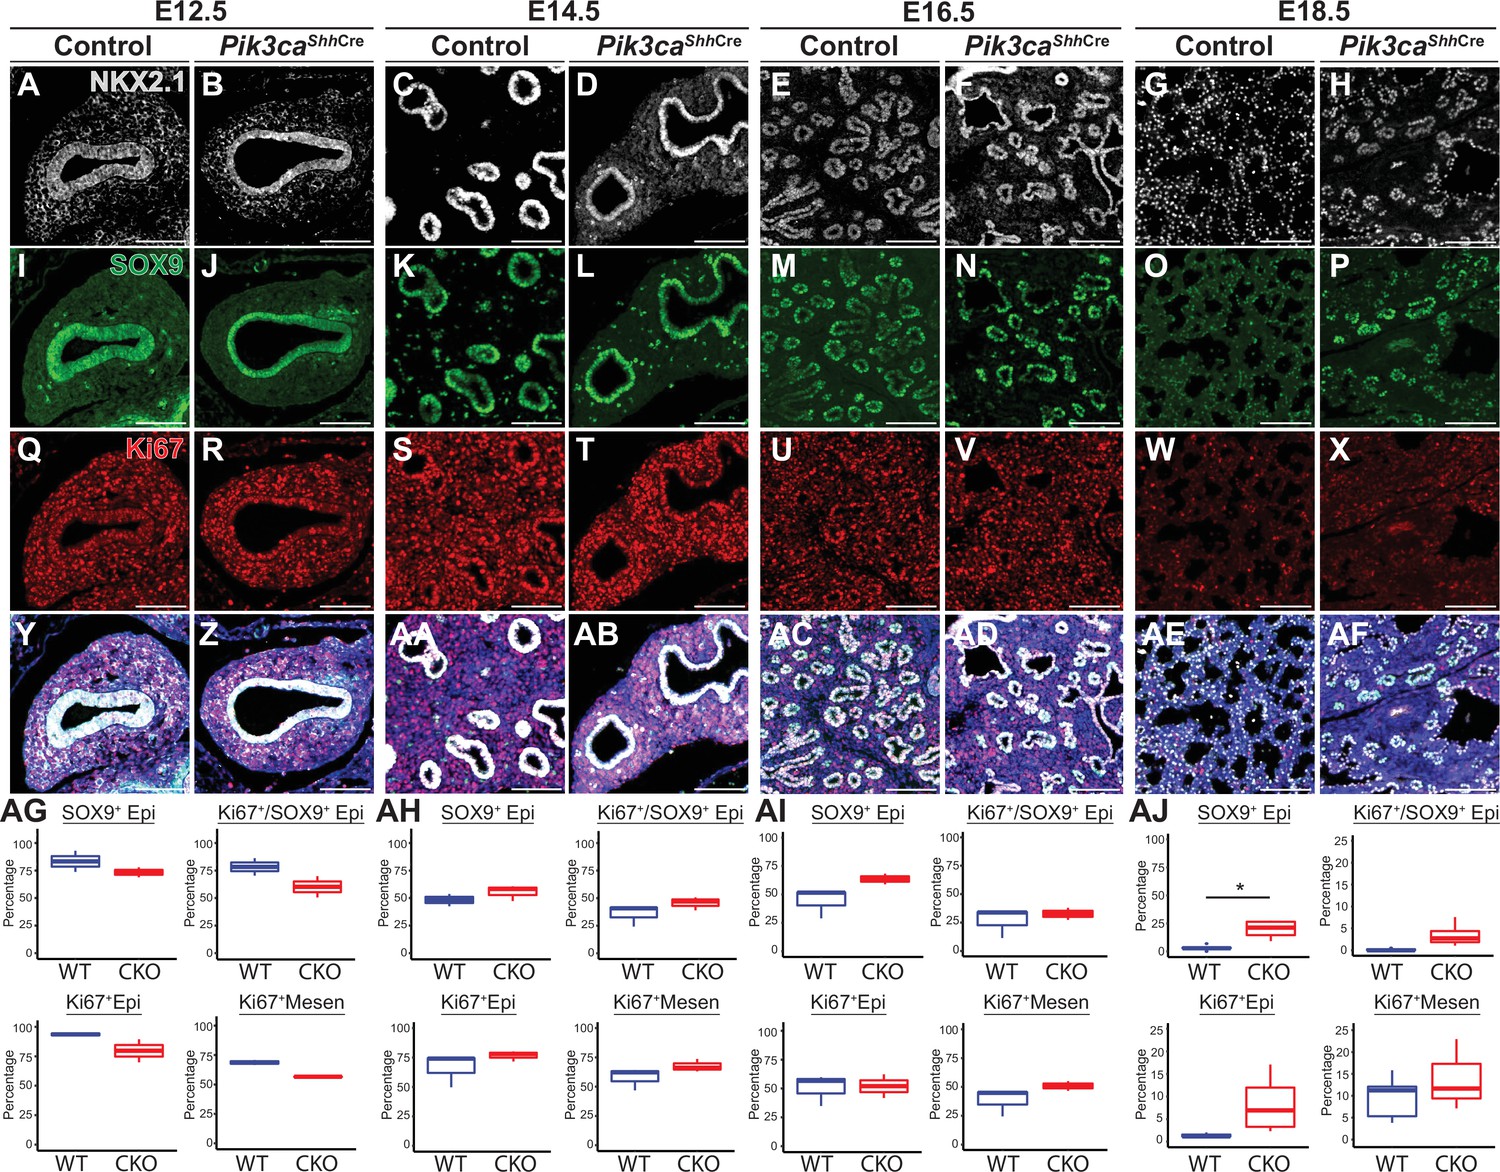
Loss of Pik3ca in the developing lung epithelium leads to persistence of the SOX9+epithelial progenitor cell population at E18.5.
(A–AF) The relative numbers of NKX2−1+epithelial cells, SOX9+ epithelial progenitor cells, and fraction of proliferating (Ki67+) cells within each population were assessed and quantified using immunofluorescence microscopy from E12.5 to E18.5. (AG-AI) No significant differences were observed in the relative total numbers of SOX9+ EPCs or proliferating SOX9+ EPCs from E12.5 to E16.5. (AJ) At E18.5, significant numbers of SOX9+ EPCs were still present, in contrast to littermate controls. This difference did not appear to be accounted for by a change in proliferation. (n=2–3 embryos per genotype at each timepoint) Scale bars: 100 µm. * p<0.05. Comparisons were not statistically significant, unless noted otherwise.
Figure 8

Loss of Pik3ca in the developing lung epithelium leads to impaired airway epithelial cell differentiation.
(A–X) SOX2 expression is observed in the airway epithelium from E12.5 to E18.5. (NN) Although the total number of SOX2 + cells present at E18.5 appears to be decreased in images A-X, the relative expression of Sox2 mRNA is not significantly changed. (Y–MM, NN–PP) A marked decrease in both the total number of SCGB1A1+secretory cells and TUB1A1+ciliated cells, and the mRNA expression levels of related transcripts was observed at E18.5. Scale bars: 100 µm (A-X, except E16.5 timepoint; Y–Z, DD–EE, II–JJ), 250 µm (E–F, M–N, U–V), 50 µm (AA-CC, FF-HH, KK-MM). N=5 Pik3ca cKO lungs and N=6 wild-type lungs were included for all cell counts based on immunofluorescence microscopy (OO, QQ) N=3 biological replicates per genotype for qPCR (NN, PP). Two-tailed Student’s t-test used for NN-QQ. * p<0.05, ** p<0.01, *** p<0.001.
Figure 9
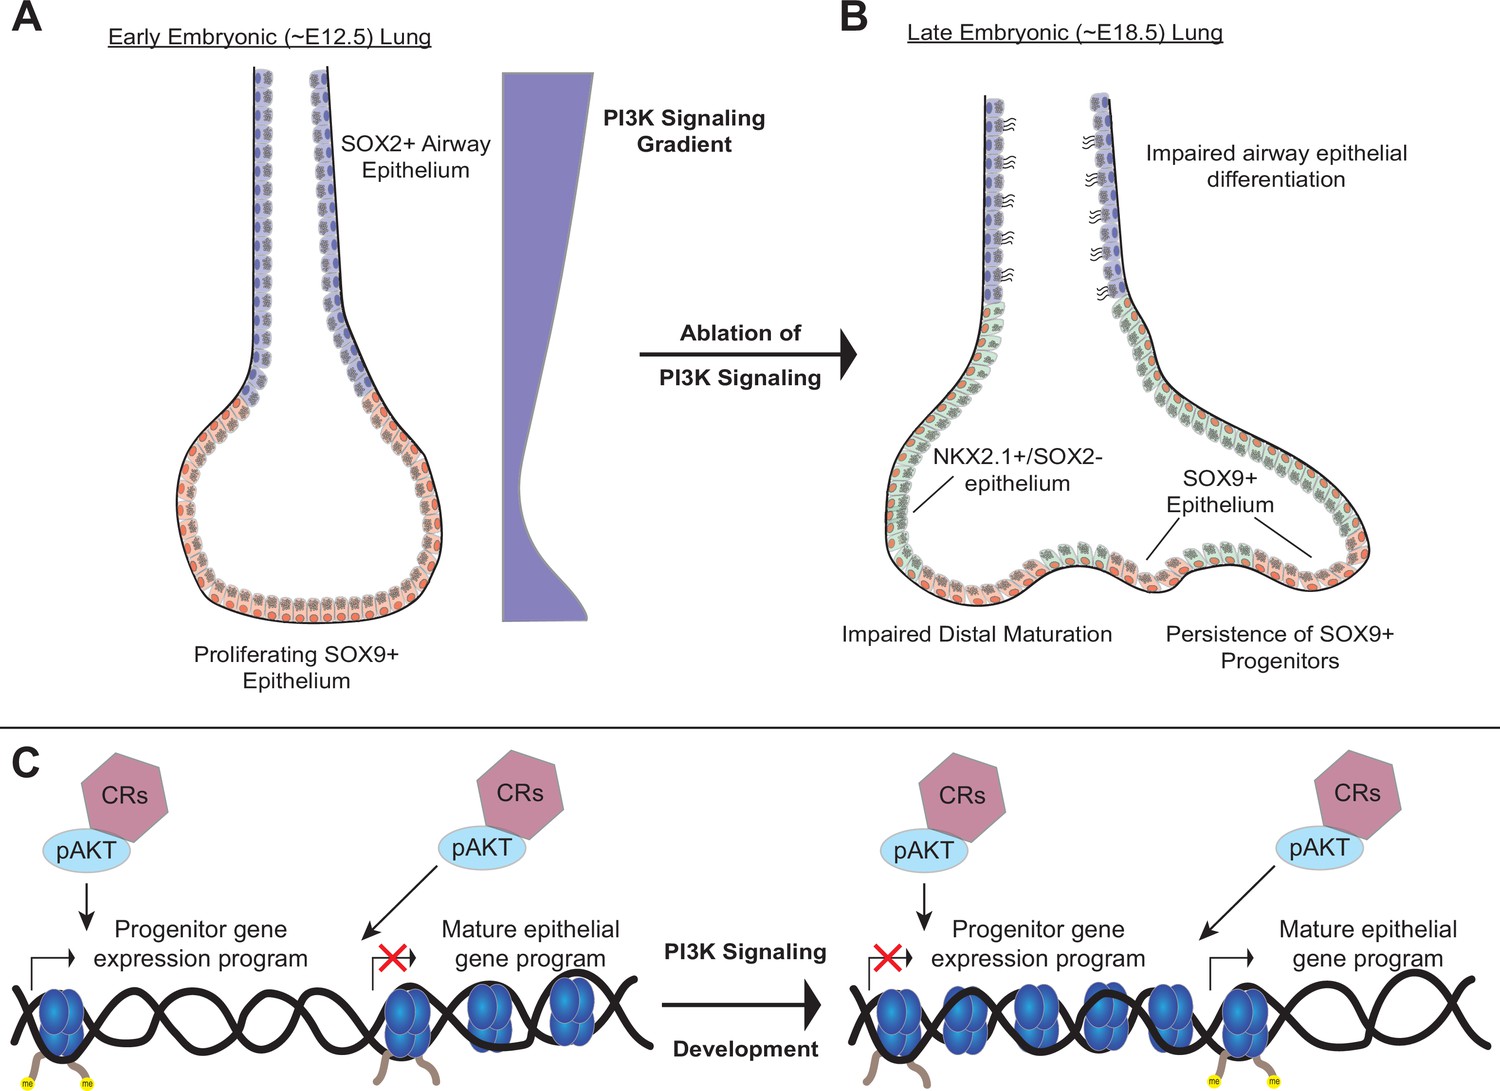
A model of the role of PI3K signaling in the developing lung epithelium.
(A) During normal lung epithelial development, a proximal-to-distal gradient of PI3K signaling patterns the lung epithelium, with highest levels in the developing conducting airways and distal tips (early in development). (B) Genetic ablation of PI3K signaling causes persistence of the SOX9+progenitor cells, and impairs epithelial differentiation of alveolar and conducting airway epithelial cells. (C) PI3K signaling may directly modulate chromatin accessibility to promote differentiation and pattern cell-type identity during lung epithelial development.
Author response image 1
Additional files
-
Supplementary file 1
Genes identified to be differentially expressed between E11.5 and E16.5 in SOX9+lung epithelial cells sorted using flow cytometry are listed.
- https://cdn.elifesciences.org/articles/67954/elife-67954-supp1-v2.xlsx
-
Supplementary file 2
Significantly accessible regions identified using MACS2 in SOX9+lung epithelial cells sorted using flow cytometry at E11.5 are listed.
- https://cdn.elifesciences.org/articles/67954/elife-67954-supp2-v2.xlsx
-
Supplementary file 3
Significantly accessible regions identified using MACS2 in SOX9+lung epithelial cells sorted using flow cytometry at E16.5 are listed.
- https://cdn.elifesciences.org/articles/67954/elife-67954-supp3-v2.xlsx
-
Supplementary file 4
Regions of differentially accessible chromatin in SOX9+lung epithelial cells sorted using flow cytometry, with increased accessibility at E11.5 compared to E16.5, are listed.
- https://cdn.elifesciences.org/articles/67954/elife-67954-supp4-v2.xlsx
-
Supplementary file 5
Regions of differentially accessible chromatin in SOX9+lung epithelial cells sorted using flow cytometry, with increased accessibility at E16.5 compared to E11.5, are listed.
- https://cdn.elifesciences.org/articles/67954/elife-67954-supp5-v2.xlsx
-
Supplementary file 6
Regions of accessible chromatin in SOX9+lung epithelial cells sorted using flow cytometry, that did not undergo statistically significant changes in accessibility between E11.5 and E16.5 (common regions), are listed.
- https://cdn.elifesciences.org/articles/67954/elife-67954-supp6-v2.xlsx
-
Supplementary file 7
Information for ENCODE datasets used in this study are listed.
- https://cdn.elifesciences.org/articles/67954/elife-67954-supp7-v2.xlsx
-
Supplementary file 8
Oligonuclotide DNA sequences used as primers for RT-PCR (qPCR) in this study are listed.
- https://cdn.elifesciences.org/articles/67954/elife-67954-supp8-v2.xlsx
-
Transparent reporting form
- https://cdn.elifesciences.org/articles/67954/elife-67954-transrepform1-v2.pdf
Download links
A two-part list of links to download the article, or parts of the article, in various formats.
Downloads (link to download the article as PDF)
Open citations (links to open the citations from this article in various online reference manager services)
Cite this article (links to download the citations from this article in formats compatible with various reference manager tools)
PI3K signaling specifies proximal-distal fate by driving a developmental gene regulatory network in SOX9+ mouse lung progenitors
eLife 11:e67954.
https://doi.org/10.7554/eLife.67954


